Dashboards
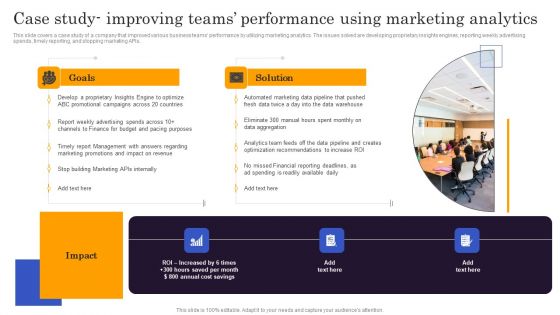
Marketers Guide To Data Analysis Optimization Case Study Improving Teams Performance Using Marketing Professional PDF
This slide covers a case study of a company that improved various business teams performance by utilizing marketing analytics. The issues solved are developing proprietary insights engines, reporting weekly advertising spends, timely reporting, and stopping marketing APIs. Make sure to capture your audiences attention in your business displays with our gratis customizable Marketers Guide To Data Analysis Optimization Case Study Improving Teams Performance Using Marketing Professional PDF. These are great for business strategies, office conferences, capital raising or task suggestions. If you desire to acquire more customers for your tech business and ensure they stay satisfied, create your own sales presentation with these plain slides.
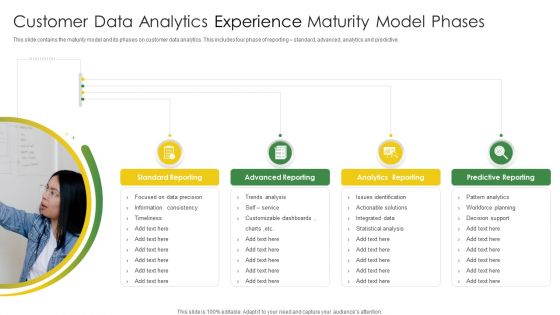
Customer Data Analytics Experience Maturity Model Phases Download PDF
This slide contains the maturity model and its phases on customer data analytics. This includes four phase of reporting standard, advanced, analytics and predictive. Presenting Customer Data Analytics Experience Maturity Model Phases Download PDF to dispense important information. This template comprises four stages. It also presents valuable insights into the topics including Advanced Reporting, Analytics Reporting, Predictive Reporting, Standard Reporting. This is a completely customizable PowerPoint theme that can be put to use immediately. So, download it and address the topic impactfully.
Data Analysis Reporting Tools Ppt PowerPoint Presentation Professional Layout Cpb Pdf
Presenting this set of slides with name data analysis reporting tools ppt powerpoint presentation professional layout cpb pdf. This is an editable Powerpoint four stages graphic that deals with topics like cyber security detection response to help convey your message better graphically. This product is a premium product available for immediate download and is 100 percent editable in Powerpoint. Download this now and use it in your presentations to impress your audience.

Web Marketing Analysis Diagram Ppt Slides Design
This is a web marketing analysis diagram ppt slides design. This is a five stage process. The stages in this process are communication, global reach, growth, business plan, financial.
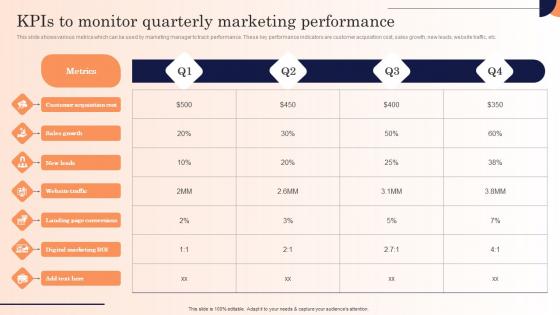
Kpis To Monitor Quarterly Marketing Performance Strategic Marketing Campaign Themes Pdf
This slide shows various metrics which can be used by marketing manager to track performance. These key performance indicators are customer acquisition cost, sales growth, new leads, website traffic, etc.Explore a selection of the finest Kpis To Monitor Quarterly Marketing Performance Strategic Marketing Campaign Themes Pdf here. With a plethora of professionally designed and pre-made slide templates, you can quickly and easily find the right one for your upcoming presentation. You can use our Kpis To Monitor Quarterly Marketing Performance Strategic Marketing Campaign Themes Pdf to effectively convey your message to a wider audience. Slidegeeks has done a lot of research before preparing these presentation templates. The content can be personalized and the slides are highly editable. Grab templates today from Slidegeeks. This slide shows various metrics which can be used by marketing manager to track performance. These key performance indicators are customer acquisition cost, sales growth, new leads, website traffic, etc.
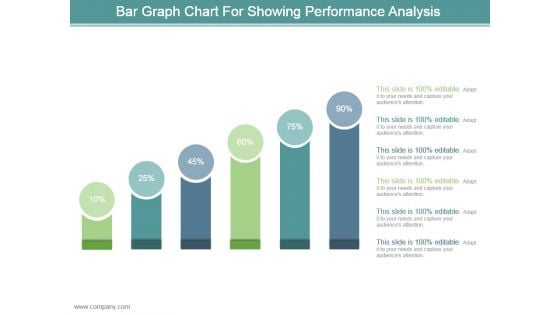
Bar Graph Chart For Showing Performance Analysis Ppt Design
This is a bar graph chart for showing performance analysis ppt design. This is a six stage process. The stages in this process are business, marketing, process, success, presentation.
Business Data Insights Report Icon Download PDF
Showcasing this set of slides titled Business Data Insights Report Icon Download PDF. The topics addressed in these templates are Business, Data Insights, Report. All the content presented in this PPT design is completely editable. Download it and make adjustments in color, background, font etc. as per your unique business setting.

Magnifying Glass Ppt PowerPoint Presentation Example
This is a magnifying glass ppt powerpoint presentation example. This is a one stage process. The stages in this process are magnifier, search, marketing, analysis, business.
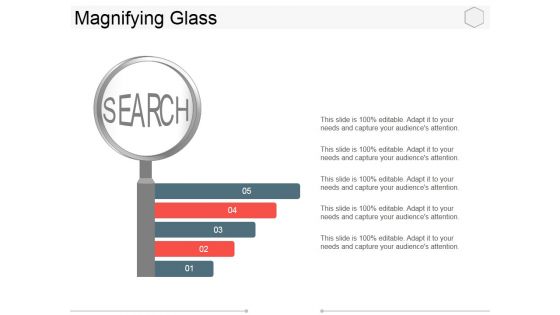
Magnifying Glass Ppt PowerPoint Presentation Pictures Deck
This is a magnifying glass ppt powerpoint presentation pictures deck. This is a five stage process. The stages in this process are search, magnifying glass, analysis, business, marketing.
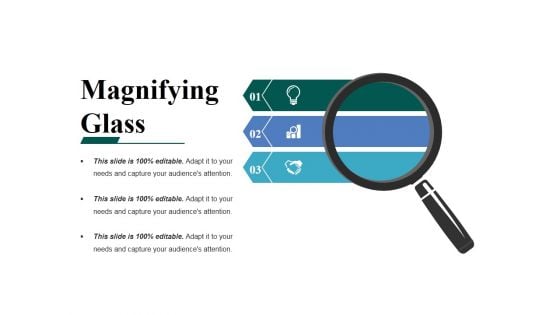
Magnifying Glass Ppt PowerPoint Presentation Professional Structure
This is a magnifying glass ppt powerpoint presentation professional structure. This is a three stage process. The stages in this process are business, analysis, magnifying glass, marketing, search.

Magnifying Glass Ppt PowerPoint Presentation Styles Slide
This is a magnifying glass ppt powerpoint presentation styles slide. This is a one stage process. The stages in this process are magnifying glass, search, marketing, strategy, analysis.
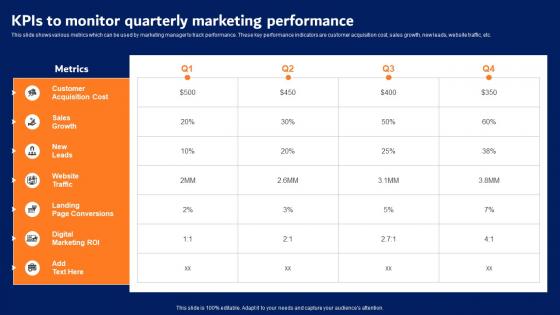
KPIs To Monitor Quarterly Marketing Performance Digital Advertising Strategies Mockup Pdf
This slide shows various metrics which can be used by marketing manager to track performance. These key performance indicators are customer acquisition cost, sales growth, new leads, website traffic, etc. Find a pre designed and impeccable KPIs To Monitor Quarterly Marketing Performance Digital Advertising Strategies Mockup Pdf. The templates can ace your presentation without additional effort. You can download these easy to edit presentation templates to make your presentation stand out from others. So, what are you waiting for Download the template from Slidegeeks today and give a unique touch to your presentation. This slide shows various metrics which can be used by marketing manager to track performance. These key performance indicators are customer acquisition cost, sales growth, new leads, website traffic, etc.
Beginners Guide To Commercial Kpis To Evaluate Performance Of Commercial Banks Fin SS V
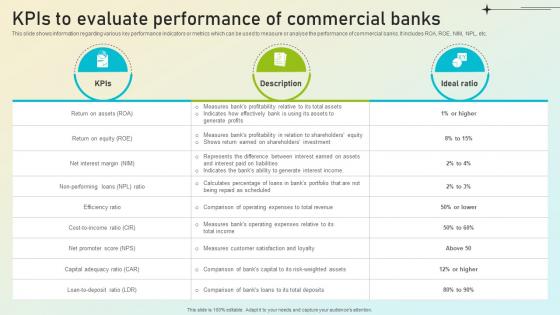
This slide shows information regarding various key performance indicators or metrics which can be used to measure or analyse the performance of commercial banks. It includes ROA, ROE, NIM, NPL, etc. Want to ace your presentation in front of a live audience Our Beginners Guide To Commercial Kpis To Evaluate Performance Of Commercial Banks Fin SS V can help you do that by engaging all the users towards you. Slidegeeks experts have put their efforts and expertise into creating these impeccable powerpoint presentations so that you can communicate your ideas clearly. Moreover, all the templates are customizable, and easy-to-edit and downloadable. Use these for both personal and commercial use. This slide shows information regarding various key performance indicators or metrics which can be used to measure or analyse the performance of commercial banks. It includes ROA, ROE, NIM, NPL, etc.

Kpis To Evaluate Performance Of Commercial Banks Complete Guide On Managing Banking Fin SS V
This slide shows information regarding various key performance indicators or metrics which can be used to measure or analyse the performance of commercial banks. It includes ROA, ROE, NIM, NPL, etc. Take your projects to the next level with our ultimate collection of Kpis To Evaluate Performance Of Commercial Banks Complete Guide On Managing Banking Fin SS V. Slidegeeks has designed a range of layouts that are perfect for representing task or activity duration, keeping track of all your deadlines at a glance. Tailor these designs to your exact needs and give them a truly corporate look with your own brand colors they will make your projects stand out from the rest This slide shows information regarding various key performance indicators or metrics which can be used to measure or analyse the performance of commercial banks. It includes ROA, ROE, NIM, NPL, etc.
Production Operations KPIs For Performance Evaluation Structure Pdf
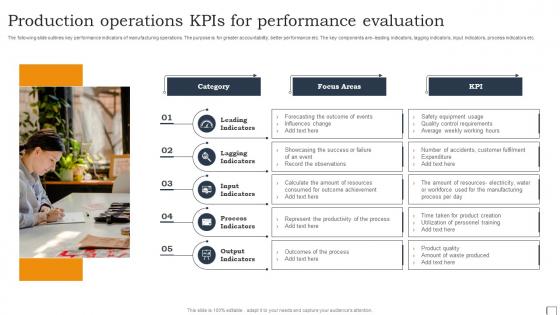
The following slide outlines key performance indicators of manufacturing operations. The purpose is for greater accountability, better performance etc. The key components are- leading indicators, lagging indicators, input indicators, process indicators etc. Pitch your topic with ease and precision using this Production Operations KPIs For Performance Evaluation Structure Pdf. This layout presents information on Leading Indicators, Lagging Indicators, Input Indicators. It is also available for immediate download and adjustment. So, changes can be made in the color, design, graphics or any other component to create a unique layout. The following slide outlines key performance indicators of manufacturing operations. The purpose is for greater accountability, better performance etc. The key components are- leading indicators, lagging indicators, input indicators, process indicators etc.
Statistical Tools For Evidence Market Size Of Statistical Data Analysis
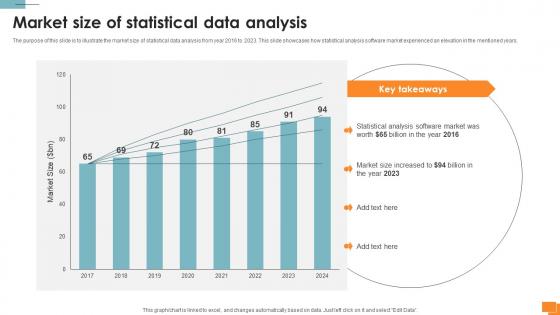
The purpose of this slide is to illustrate the market size of statistical data analysis from year 2016 to 2023. This slide showcases how statistical analysis software market experienced an elevation in the mentioned years. Retrieve professionally designed Statistical Tools For Evidence Market Size Of Statistical Data Analysis to effectively convey your message and captivate your listeners. Save time by selecting pre-made slideshows that are appropriate for various topics, from business to educational purposes. These themes come in many different styles, from creative to corporate, and all of them are easily adjustable and can be edited quickly. Access them as PowerPoint templates or as Google Slides themes. You do not have to go on a hunt for the perfect presentation because Slidegeeks got you covered from everywhere. The purpose of this slide is to illustrate the market size of statistical data analysis from year 2016 to 2023. This slide showcases how statistical analysis software market experienced an elevation in the mentioned years.
Actual Vs Forecast Powerpoint Ppt Template Bundles
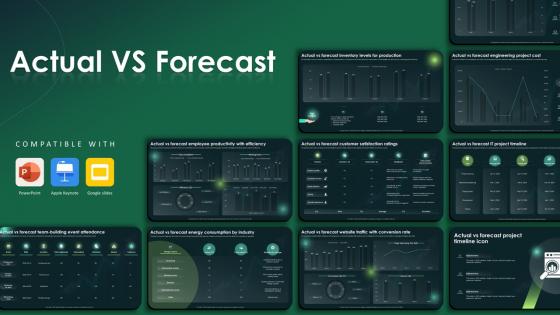
This Actual Vs Forecast Powerpoint Ppt Template Bundles is designed to help you retain your audiences attention. This content-ready PowerPoint Template enables you to take your audience on a journey and share information in a way that is easier to recall. It helps you highlight the crucial parts of your work so that the audience does not get saddled with information download. This KPI Dashboard, Data Driven Marketing, Campaign Performance, Marketing Evaluation, Inventory Assessment-slide PPT Deck comes prepared with the graphs and charts you could need to showcase your information through visuals. You only need to enter your own data in them. Download this editable PowerPoint Theme and walk into that meeting with confidence. Our Actual vs. Forecast PowerPoint presentation can provide you with valuable business insights. Analyze sales figures, budgets, and financial predictions. Identify major differences, modify methods, and match projections with results to improve decision-making. Download now to accelerate your success.
Magnifying Glass Ppt PowerPoint Presentation Summary Layout Ideas
This is a magnifying glass ppt powerpoint presentation summary layout ideas. This is a five stage process. The stages in this process are magnifier, research, business, analysis.
Product Yearly Sales Trend Analysis Marketing Intelligence Guide Data Gathering Introduction Pdf
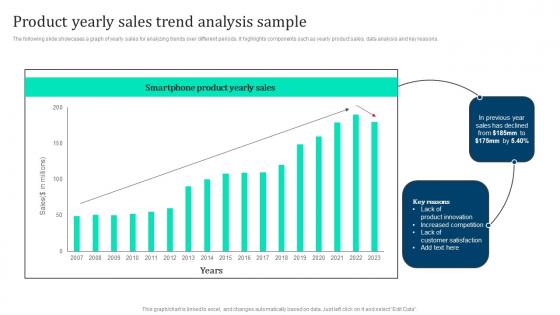
The following slide showcases a graph of yearly sales for analyzing trends over different periods. It highlights components such as yearly product sales, data analysis and key reasons. Create an editable Product Yearly Sales Trend Analysis Marketing Intelligence Guide Data Gathering Introduction Pdf that communicates your idea and engages your audience. Whether you are presenting a business or an educational presentation, pre designed presentation templates help save time. Product Yearly Sales Trend Analysis Marketing Intelligence Guide Data Gathering Introduction Pdf is highly customizable and very easy to edit, covering many different styles from creative to business presentations. Slidegeeks has creative team members who have crafted amazing templates. So, go and get them without any delay. The following slide showcases a graph of yearly sales for analyzing trends over different periods. It highlights components such as yearly product sales, data analysis and key reasons.

Key Performance Indicators Template 2 Ppt PowerPoint Presentation Microsoft
This is a key performance indicators template 2 ppt powerpoint presentation microsoft. This is a four stage process. The stages in this process are business, table, marketing, strategy, data.

Key Performance Indicators KPI Ppt PowerPoint Presentation Infographics Cpb
This is a key performance indicators kpi ppt powerpoint presentation infographics cpb. This is a five stage process. The stages in this process are key performance indicators kpi.
Big Data Analytics Framework In Digital Marketing Clipart Pdf
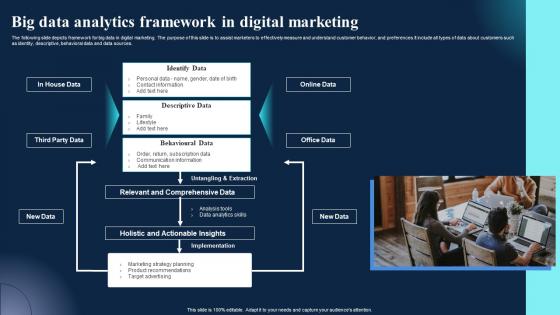
The following slide depicts framework for big data in digital marketing. The purpose of this slide is to assist marketers to effectively measure and understand customer behavior, and preferences.It include all types of data about customers such as identity, descriptive, behavioral data and data sources. Showcasing this set of slides titled Big Data Analytics Framework In Digital Marketing Clipart Pdf. The topics addressed in these templates are Online Data, Office Data, New Data. All the content presented in this PPT design is completely editable. Download it and make adjustments in color, background, font etc. as per your unique business setting. The following slide depicts framework for big data in digital marketing. The purpose of this slide is to assist marketers to effectively measure and understand customer behavior, and preferences.It include all types of data about customers such as identity, descriptive, behavioral data and data sources.
Business Executive Data Insights Report Pictures PDF
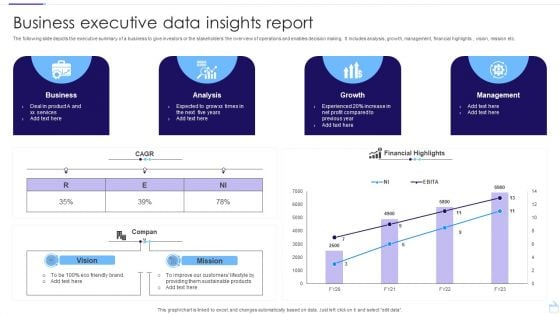
The following slide depicts the executive summary of a business to give investors or the stakeholders the overview of operations and enables decision making. It includes analysis, growth, management, financial highlights , vision, mission etc. Pitch your topic with ease and precision using this Business Executive Data Insights Report Pictures PDF. This layout presents information on Business, Analysis, Growth. It is also available for immediate download and adjustment. So, changes can be made in the color, design, graphics or any other component to create a unique layout.
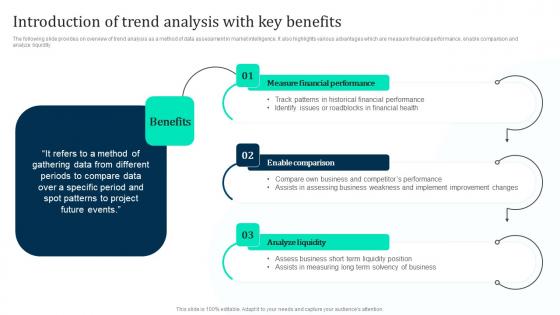
Introduction Of Trend Analysis Key Marketing Intelligence Guide Data Gathering Structure Pdf
The following slide provides on overview of trend analysis as a method of data assessment in market intelligence. It also highlights various advantages which are measure financial performance, enable comparison and analyze liquidity. Formulating a presentation can take up a lot of effort and time, so the content and message should always be the primary focus. The visuals of the PowerPoint can enhance the presenters message, so our Introduction Of Trend Analysis Key Marketing Intelligence Guide Data Gathering Structure Pdf was created to help save time. Instead of worrying about the design, the presenter can concentrate on the message while our designers work on creating the ideal templates for whatever situation is needed. Slidegeeks has experts for everything from amazing designs to valuable content, we have put everything into Introduction Of Trend Analysis Key Marketing Intelligence Guide Data Gathering Structure Pdf The following slide provides on overview of trend analysis as a method of data assessment in market intelligence. It also highlights various advantages which are measure financial performance, enable comparison and analyze liquidity.
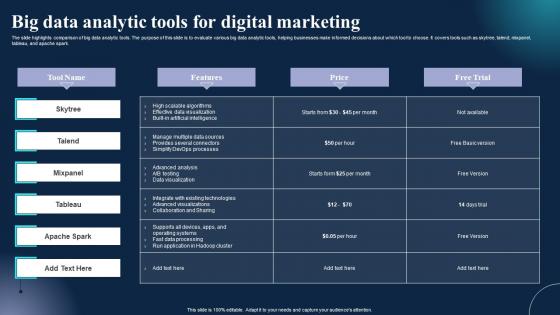
Big Data Analytic Tools For Digital Marketing Information Pdf
The slide highlights comparison of big data analytic tools. The purpose of this slide is to evaluate various big data analytic tools, helping businesses make informed decisions about which tool to choose. It covers tools such as skytree, talend, mixpanel, tableau, and apache spark. Pitch your topic with ease and precision using this Big Data Analytic Tools For Digital Marketing Information Pdf. This layout presents information on Tool Name, Features, Price. It is also available for immediate download and adjustment. So, changes can be made in the color, design, graphics or any other component to create a unique layout. The slide highlights comparison of big data analytic tools. The purpose of this slide is to evaluate various big data analytic tools, helping businesses make informed decisions about which tool to choose. It covers tools such as skytree, talend, mixpanel, tableau, and apache spark.
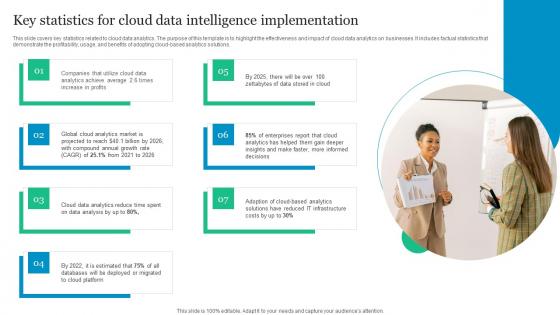
Key Statistics For Cloud Data Intelligence Implementation Download Pdf
This slide covers key statistics related to cloud data analytics. The purpose of this template is to highlight the effectiveness and impact of cloud data analytics on businesses. It includes factual statistics that demonstrate the profitability, usage, and benefits of adopting cloud based analytics solutions. Showcasing this set of slides titled Key Statistics For Cloud Data Intelligence Implementation Download Pdf. The topics addressed in these templates are Analytics Achieve Average, Growth Rate, Global Cloud Analytics. All the content presented in this PPT design is completely editable. Download it and make adjustments in color, background, font etc. as per your unique business setting. This slide covers key statistics related to cloud data analytics. The purpose of this template is to highlight the effectiveness and impact of cloud data analytics on businesses. It includes factual statistics that demonstrate the profitability, usage, and benefits of adopting cloud based analytics solutions.
Icon For Big Data Analytics In Digital Marketing Introduction Pdf
Pitch your topic with ease and precision using this Icon For Big Data Analytics In Digital Marketing Introduction Pdf. This layout presents information on Big Data, Analytics, Digital Marketing. It is also available for immediate download and adjustment. So, changes can be made in the color, design, graphics or any other component to create a unique layout. Our Icon For Big Data Analytics In Digital Marketing Introduction Pdf are topically designed to provide an attractive backdrop to any subject. Use them to look like a presentation pro.
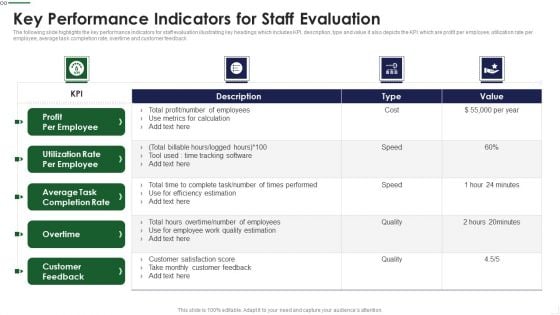
Key Performance Indicators For Staff Evaluation Infographics PDF
The following slide highlights the key performance Indicators for staff evaluation illustrating key headings which includes KPI, description, type and value it also depicts the KPI which are profit per employee, utilization rate per employee, average task completion rate, overtime and customer feedback Showcasing this set of slides titled Key Performance Indicators For Staff Evaluation Infographics PDF The topics addressed in these templates are Metrics Calculation, Times Performed, Customer Satisfaction All the content presented in this PPT design is completely editable. Download it and make adjustments in color, background, font etc. as per your unique business setting.
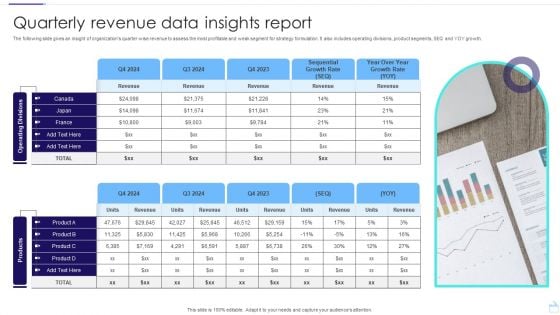
Quarterly Revenue Data Insights Report Template PDF
The following slide gives an insight of organizations quarter wise revenue to assess the most profitable and weak segment for strategy formulation. It also includes operating divisions, product segments, SEQ and YOY growth. Showcasing this set of slides titled Quarterly Revenue Data Insights Report Template PDF. The topics addressed in these templates are Operating, Divisions products, Insights Report. All the content presented in this PPT design is completely editable. Download it and make adjustments in color, background, font etc. as per your unique business setting.
Business Research And Analysis Ppt PowerPoint Presentation Ideas Graphics Design
This is a business research and analysis ppt powerpoint presentation ideas graphics design. This is a three stage process. The stages in this process are support, assistance, hand holding.
Predictive Analytics In The Age Of Big Data Predictive Analytics Model Performance Tracking Introduction PDF
This slide represents the predictive analytics model performance tracking dashboard, and it covers the details of total visitors, total buyers, total products added to the cart, filters by date and category, visitors to clients conversion rate, and so on. Slidegeeks has constructed Predictive Analytics In The Age Of Big Data Predictive Analytics Model Performance Tracking Introduction PDF after conducting extensive research and examination. These presentation templates are constantly being generated and modified based on user preferences and critiques from editors. Here, you will find the most attractive templates for a range of purposes while taking into account ratings and remarks from users regarding the content. This is an excellent jumping off point to explore our content and will give new users an insight into our top notch PowerPoint Templates.

Magnifying Glass Ppt PowerPoint Presentation Infographic Template Background
This is a magnifying glass ppt powerpoint presentation infographic template background. This is a one stage process. The stages in this process are magnifying glass, search, marketing, analysis, business.
Comparative Analysis Of Tools For Measuring Effectiveness Of Training Program Icons PDF
This slide covers comparative analysis of tools for measuring effectiveness of training program. It involves features such as analytics dashboard, customized survey templates, data analysis and customized reports. Find highly impressive Comparative Analysis Of Tools For Measuring Effectiveness Of Training Program Icons PDF on Slidegeeks to deliver a meaningful presentation. You can save an ample amount of time using these presentation templates. No need to worry to prepare everything from scratch because Slidegeeks experts have already done a huge research and work for you. You need to download Comparative Analysis Of Tools For Measuring Effectiveness Of Training Program Icons PDF for your upcoming presentation. All the presentation templates are 100 percent editable and you can change the color and personalize the content accordingly. Download now

Identify The Change Ppt PowerPoint Presentation Slides Pictures
This is a identify the change ppt powerpoint presentation slides pictures. This is a five stage process. The stages in this process are forces for change, vision for change, gap analysis, organization change readiness.
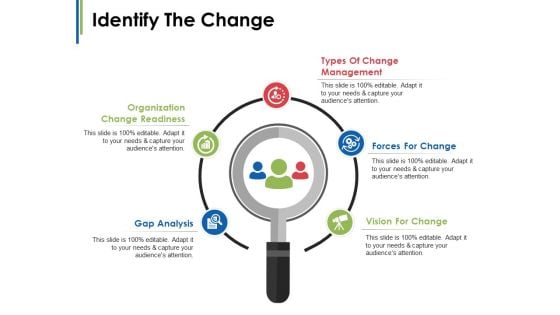
Identify The Change Ppt PowerPoint Presentation Model Introduction
This is a identify the change ppt powerpoint presentation model introduction. This is a five stage process. The stages in this process are organization change readiness, gap analysis, types of change management, forces for change, vision for change.
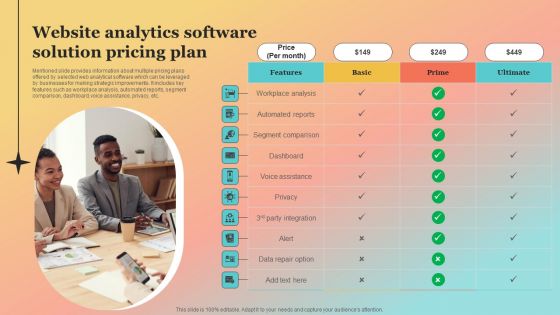
New Website Launch Strategy Website Analytics Software Solution Pricing Plan Microsoft PDF
Mentioned slide provides information about multiple pricing plans offered by selected web analytical software which can be leveraged by businesses for making strategic improvements. It includes key features such as workplace analysis, automated reports, segment comparison, dashboard, voice assistance, privacy, etc. The New Website Launch Strategy Website Analytics Software Solution Pricing Plan Microsoft PDF is a compilation of the most recent design trends as a series of slides. It is suitable for any subject or industry presentation, containing attractive visuals and photo spots for businesses to clearly express their messages. This template contains a variety of slides for the user to input data, such as structures to contrast two elements, bullet points, and slides for written information. Slidegeeks is prepared to create an impression.
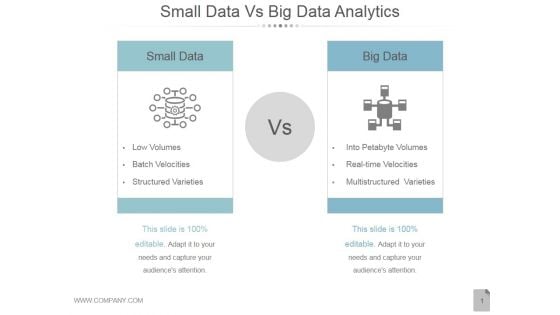
Small Data Vs Big Data Analytics Ppt PowerPoint Presentation Influencers
This is a small data vs big data analytics ppt powerpoint presentation influencers. This is a two stage process. The stages in this process are small data, big data.
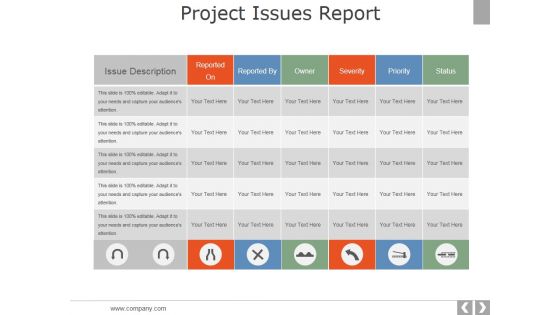
Project Issues Report Ppt PowerPoint Presentation Slide
This is a project issues report ppt powerpoint presentation slide. This is a six stage process. The stages in this process are issue description, reported on, reported by, owner, severity.
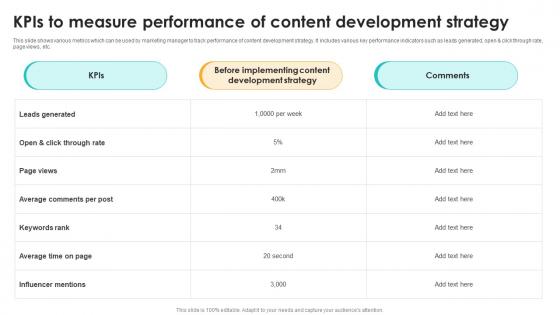
Kpis To Measure Performance Of Content Development Strategy Seo Content Plan To Drive Strategy SS V
This slide shows various metrics which can be used by marketing manager to track performance of content development strategy. It includes various key performance indicators such as leads generated, open and click through rate, page views, etc. Explore a selection of the finest Kpis To Measure Performance Of Content Development Strategy Seo Content Plan To Drive Strategy SS V here. With a plethora of professionally designed and pre-made slide templates, you can quickly and easily find the right one for your upcoming presentation. You can use our Kpis To Measure Performance Of Content Development Strategy Seo Content Plan To Drive Strategy SS V to effectively convey your message to a wider audience. Slidegeeks has done a lot of research before preparing these presentation templates. The content can be personalized and the slides are highly editable. Grab templates today from Slidegeeks. This slide shows various metrics which can be used by marketing manager to track performance of content development strategy. It includes various key performance indicators such as leads generated, open and click through rate, page views, etc.
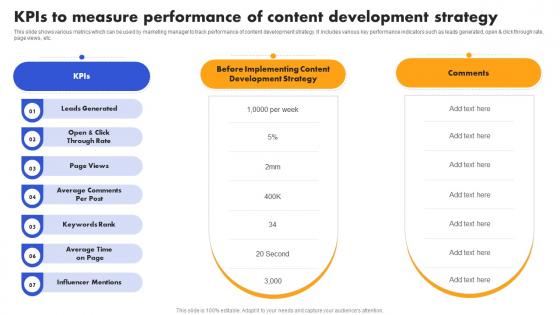
SEO Strategy To Improve ROI Kpis To Measure Performance Of Content Strategy SS V
This slide shows various metrics which can be used by marketing manager to track performance of content development strategy. It includes various key performance indicators such as leads generated, open and click through rate, page views, etc. Explore a selection of the finest SEO Strategy To Improve ROI Kpis To Measure Performance Of Content Strategy SS V here. With a plethora of professionally designed and pre-made slide templates, you can quickly and easily find the right one for your upcoming presentation. You can use our SEO Strategy To Improve ROI Kpis To Measure Performance Of Content Strategy SS V to effectively convey your message to a wider audience. Slidegeeks has done a lot of research before preparing these presentation templates. The content can be personalized and the slides are highly editable. Grab templates today from Slidegeeks. This slide shows various metrics which can be used by marketing manager to track performance of content development strategy. It includes various key performance indicators such as leads generated, open and click through rate, page views, etc.
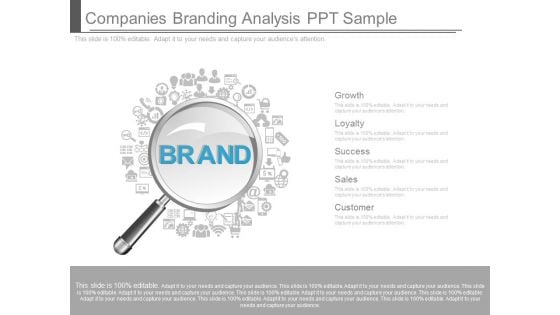
Companies Branding Analysis Ppt Sample
This is a companies branding analysis ppt sample. This is a five stage process. The stages in this process are growth, loyalty, success, sales, customer.
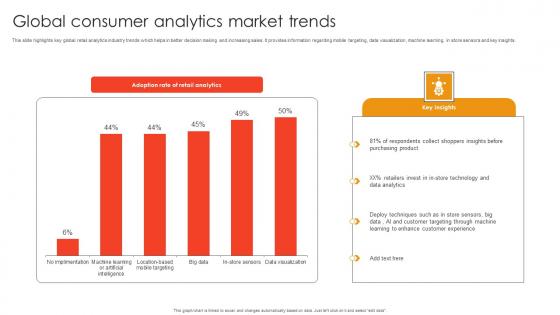
Global Consumer Analytics Market Trends Template Pdf
This slide highlights key global retail analytics industry trends which helps in better decision making and increasing sales. It provides information regarding mobile targeting, data visualization, machine learning, in store sensors and key insights. Pitch your topic with ease and precision using this Global Consumer Analytics Market Trends Template Pdf. This layout presents information on Respondents Collect Shoppers, Retailers Invest Store, Deploy Techniques Store Sensors. It is also available for immediate download and adjustment. So, changes can be made in the color, design, graphics or any other component to create a unique layout. This slide highlights key global retail analytics industry trends which helps in better decision making and increasing sales. It provides information regarding mobile targeting, data visualization, machine learning, in store sensors and key insights.
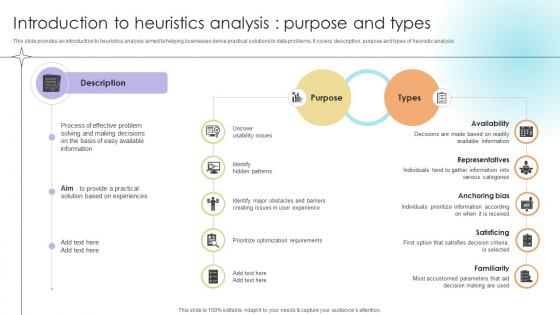
Introduction To Heuristics Analysis Purpose And Types Data Analytics SS V
This slide provides an introduction to heuristics analysis aimed ta helping businesses derive practical solutions to data problems. It covers description, purpose and types of heuristic analysis.There are so many reasons you need a Introduction To Heuristics Analysis Purpose And Types Data Analytics SS V. The first reason is you can not spend time making everything from scratch, Thus, Slidegeeks has made presentation templates for you too. You can easily download these templates from our website easily. This slide provides an introduction to heuristics analysis aimed ta helping businesses derive practical solutions to data problems. It covers description, purpose and types of heuristic analysis.

Business Diagram Data Driven Bar Graph And Pie Chart For Analysis PowerPoint Slide
This PowerPoint template displays technology gadgets with various business charts. Use this diagram slide, in your presentations to make business reports for statistical analysis. You may use this diagram to impart professional appearance to your presentations.
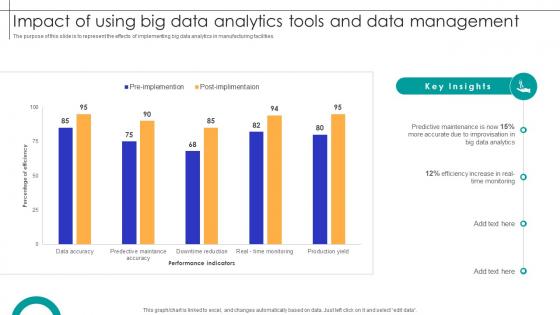
Impact Of Using Big Data Analytics Tools And Data Management Streamlining Production Ppt Example
The purpose of this slide is to represent the effects of implementing big data analytics in manufacturing facilities. Here you can discover an assortment of the finest PowerPoint and Google Slides templates. With these templates, you can create presentations for a variety of purposes while simultaneously providing your audience with an eye-catching visual experience. Download Impact Of Using Big Data Analytics Tools And Data Management Streamlining Production Ppt Example to deliver an impeccable presentation. These templates will make your job of preparing presentations much quicker, yet still, maintain a high level of quality. Slidegeeks has experienced researchers who prepare these templates and write high-quality content for you. Later on, you can personalize the content by editing the Impact Of Using Big Data Analytics Tools And Data Management Streamlining Production Ppt Example The purpose of this slide is to represent the effects of implementing big data analytics in manufacturing facilities.
Icon For Big Data Analytics In Marketing Ppt Slides Files PDF
Showcasing this set of slides titled Icon For Big Data Analytics In Marketing Ppt Slides Files PDF. The topics addressed in these templates are Icon, Big Data Analytics, Marketing. All the content presented in this PPT design is completely editable. Download it and make adjustments in color, background, font etc. as per your unique business setting. Our Icon For Big Data Analytics In Marketing Ppt Slides Files PDF are topically designed to provide an attractive backdrop to any subject. Use them to look like a presentation pro.
Magnifying Glass Data Analysis Ppt PowerPoint Presentation Styles Images
Presenting this set of slides with name magnifying glass data analysis ppt powerpoint presentation styles images. This is a four stage process. The stages in this process are technology, marketing, planning, business, management. This is a completely editable PowerPoint presentation and is available for immediate download. Download now and impress your audience.
Magnifier Glass Data Analysis Ppt PowerPoint Presentation Model Elements
Presenting this set of slides with name magnifier glass data analysis ppt powerpoint presentation model elements. This is a five stage process. The stages in this process are technology, marketing, planning, business, management. This is a completely editable PowerPoint presentation and is available for immediate download. Download now and impress your audience.
Magnifying Glass Big Data Analysis Ppt PowerPoint Presentation Diagram Templates
Presenting this set of slides with name magnifying glass big data analysis ppt powerpoint presentation diagram templates. This is a four stage process. The stages in this process are technology, marketing, planning, business, management. This is a completely editable PowerPoint presentation and is available for immediate download. Download now and impress your audience.
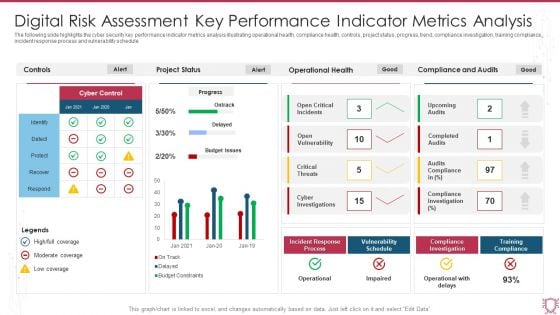
Digital Risk Assessment Key Performance Indicator Metrics Analysis Infographics PDF
The following slide highlights the cyber security key performance indicator metrics analysis illustrating operational health, compliance health, controls, project status, progress, trend, compliance investigation, training compliance, incident response process and vulnerability schedule. Showcasing this set of slides titled Digital Risk Assessment Key Performance Indicator Metrics Analysis Infographics PDF. The topics addressed in these templates are Project Status, Operational Health, Compliance And Audits. All the content presented in this PPT design is completely editable. Download it and make adjustments in color, background, font etc. as per your unique business setting.
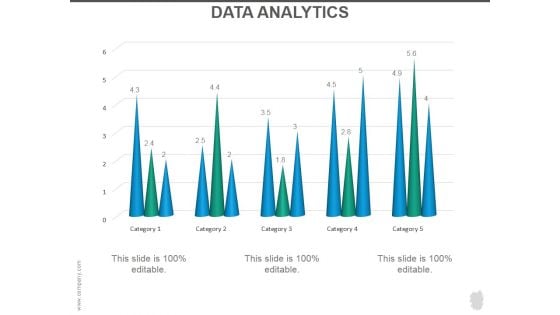
Data Analytics Ppt PowerPoint Presentation Graphics
This is a data analytics ppt powerpoint presentation graphics. This is a five stage process. The stages in this process are data analysis, business, marketing, success, graph.
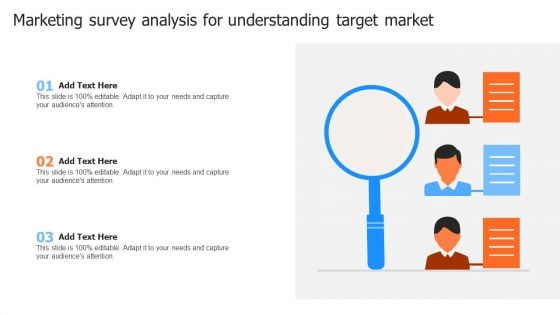
Marketing Survey Analysis For Understanding Target Market Inspiration PDF
Persuade your audience using this Marketing Survey Analysis For Understanding Target Market Inspiration PDF. This PPT design covers three stages, thus making it a great tool to use. It also caters to a variety of topics including Marketing Survey Analysis, Understanding Target Market. Download this PPT design now to present a convincing pitch that not only emphasizes the topic but also showcases your presentation skills.
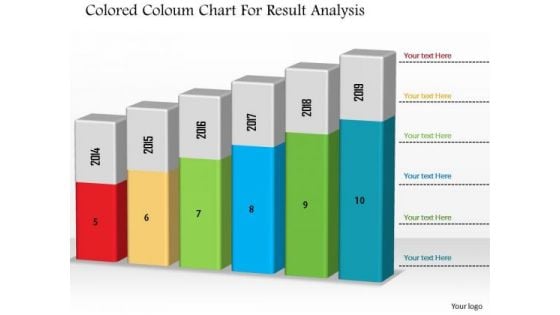
Business Diagram Colored Column Chart For Result Analysis PowerPoint Slide
This Power Point diagram has been designed with graphic of column chart. It contains diagram of bar char depicting annual business progress report. Use this diagram to build professional presentations for your viewers.
Campaign Report Ppt PowerPoint Presentation File Icon
This is a campaign report ppt powerpoint presentation file icon. This is a ten stage process. The stages in this process are email name, send date time, recipients, delivered, spam.
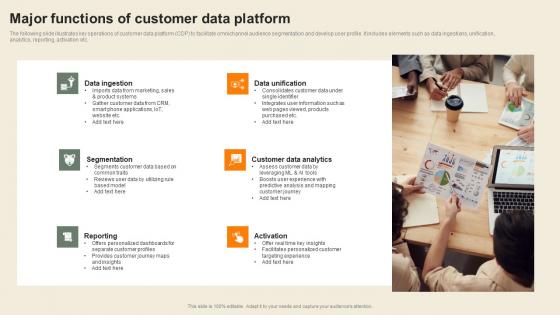
Major Functions Of Customer Data Platform Usability Of CDP Software Tool Mockup Pdf
The following slide illustrates key operations of customer data platform CDP to facilitate omnichannel audience segmentation and develop user profile. It includes elements such as data ingestions, unification, analytics, reporting, activation etc. Retrieve professionally designed Major Functions Of Customer Data Platform Usability Of CDP Software Tool Mockup Pdf to effectively convey your message and captivate your listeners. Save time by selecting pre-made slideshows that are appropriate for various topics, from business to educational purposes. These themes come in many different styles, from creative to corporate, and all of them are easily adjustable and can be edited quickly. Access them as PowerPoint templates or as Google Slides themes. You do not have to go on a hunt for the perfect presentation because Slidegeeks got you covered from everywhere. The following slide illustrates key operations of customer data platform CDP to facilitate omnichannel audience segmentation and develop user profile. It includes elements such as data ingestions, unification, analytics, reporting, activation etc.
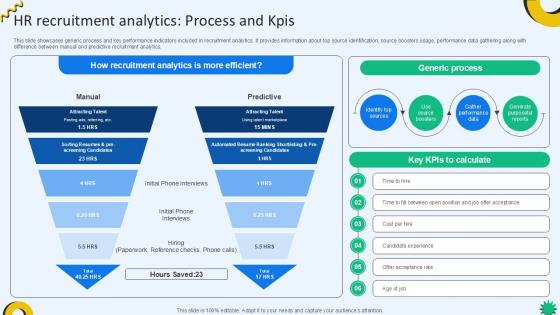
HR Recruitment Analytics Process And KPIs Cloud Recruiting Technologies PPT Sample
This slide showcases generic process and key performance indicators included in recruitment analytics. It provides information about top source identification, source boosters usage, performance data gathering along with difference between manual and predictive recruitment analytics. If you are looking for a format to display your unique thoughts, then the professionally designed HR Recruitment Analytics Process And KPIs Cloud Recruiting Technologies PPT Sample is the one for you. You can use it as a Google Slides template or a PowerPoint template. Incorporate impressive visuals, symbols, images, and other charts. Modify or reorganize the text boxes as you desire. Experiment with shade schemes and font pairings. Alter, share or cooperate with other people on your work. Download HR Recruitment Analytics Process And KPIs Cloud Recruiting Technologies PPT Sample and find out how to give a successful presentation. Present a perfect display to your team and make your presentation unforgettable. This slide showcases generic process and key performance indicators included in recruitment analytics. It provides information about top source identification, source boosters usage, performance data gathering along with difference between manual and predictive recruitment analytics.

HR Recruitment Analytics Process And KPIs Enhancing Recruitment Process PPT PowerPoint
This slide showcases generic process and key performance indicators included in recruitment analytics. It provides information about top source identification, source boosters usage, performance data gathering along with difference between manual and predictive recruitment analytics. If you are looking for a format to display your unique thoughts, then the professionally designed HR Recruitment Analytics Process And KPIs Enhancing Recruitment Process PPT PowerPoint is the one for you. You can use it as a Google Slides template or a PowerPoint template. Incorporate impressive visuals, symbols, images, and other charts. Modify or reorganize the text boxes as you desire. Experiment with shade schemes and font pairings. Alter, share or cooperate with other people on your work. Download HR Recruitment Analytics Process And KPIs Enhancing Recruitment Process PPT PowerPoint and find out how to give a successful presentation. Present a perfect display to your team and make your presentation unforgettable. This slide showcases generic process and key performance indicators included in recruitment analytics. It provides information about top source identification, source boosters usage, performance data gathering along with difference between manual and predictive recruitment analytics.
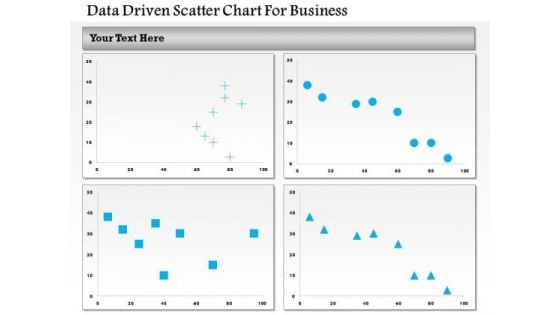
Business Diagram Data Driven Scatter Chart For Business PowerPoint Slide
This business diagram has been designed with four comparative charts. This slide suitable for data representation. You can also use this slide to present business analysis and reports. Use this diagram to present your views in a wonderful manner.
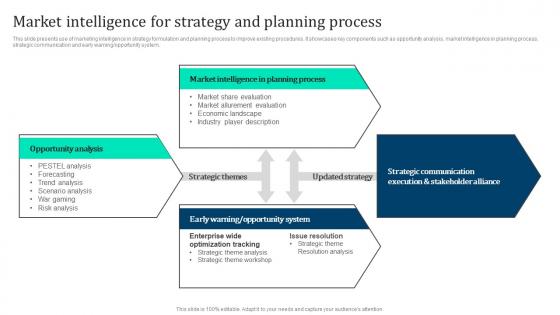
Market Intelligence Strategy Marketing Intelligence Guide Data Gathering Summary Pdf
This slide presents use of marketing intelligence in strategy formulation and planning process to improve existing procedures. It showcases key components such as opportunity analysis, market intelligence in planning process, strategic communication and early warning opportunity system. The Market Intelligence Strategy Marketing Intelligence Guide Data Gathering Summary Pdf is a compilation of the most recent design trends as a series of slides. It is suitable for any subject or industry presentation, containing attractive visuals and photo spots for businesses to clearly express their messages. This template contains a variety of slides for the user to input data, such as structures to contrast two elements, bullet points, and slides for written information. Slidegeeks is prepared to create an impression. This slide presents use of marketing intelligence in strategy formulation and planning process to improve existing procedures. It showcases key components such as opportunity analysis, market intelligence in planning process, strategic communication and early warning opportunity system.
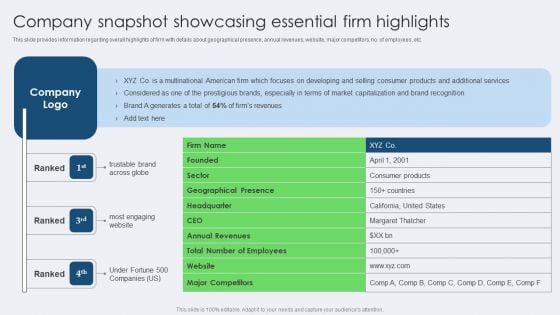
Company Snapshot Showcasing Essential Firm Highlights Infographics PDF
This slide provides information regarding overall highlights of firm with details about geographical presence, annual revenues, website, major competitors, no. of employees, etc. From laying roadmaps to briefing everything in detail, our templates are perfect for you. You can set the stage with your presentation slides. All you have to do is download these easy to edit and customizable templates. Company Snapshot Showcasing Essential Firm Highlights Infographics PDF will help you deliver an outstanding performance that everyone would remember and praise you for. Do download this presentation today.


 Continue with Email

 Home
Home


