Dashboards

Data Lake Architecture Future Of Data Analysis How Does Central Repository Data Lake Works Ideas PDF
This slide represents the working of the data lakes, including how different types of data are stored at a centralized place, extracted and performed operations on the data.Deliver an awe inspiring pitch with this creative Data Lake Architecture Future Of Data Analysis How Does Central Repository Data Lake Works Ideas PDF bundle. Topics like Advanced Analytics, Business Intelligence, Storage And Processing can be discussed with this completely editable template. It is available for immediate download depending on the needs and requirements of the user.
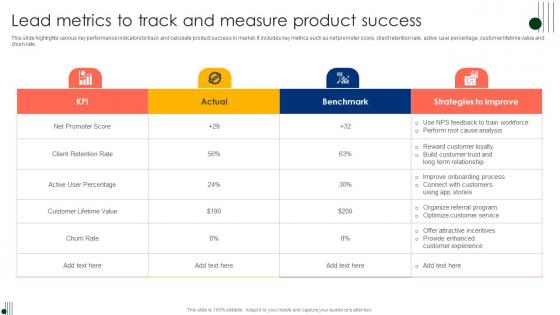
Lead Metrics To Track And Measure Product Success Ppt Visual Aids Ideas Pdf
This slide highlights various key performance indicators to track and calculate product success in market. It includes key metrics such as net promoter score, client retention rate, active user percentage, customer lifetime value and churn rate. Showcasing this set of slides titled Lead Metrics To Track And Measure Product Success Ppt Visual Aids Ideas Pdf. The topics addressed in these templates are Client Retention Rate, Active User Percentage, Customer Lifetime. All the content presented in this PPT design is completely editable. Download it and make adjustments in color, background, font etc. as per your unique business setting. This slide highlights various key performance indicators to track and calculate product success in market. It includes key metrics such as net promoter score, client retention rate, active user percentage, customer lifetime value and churn rate.
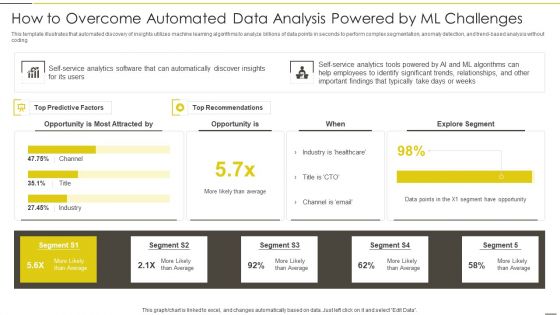
Administered Data And Analytic Quality Playbook How To Overcome Automated Data Analysis Sample PDF
This template illustrates that automated discovery of insights utilizes machine learning algorithms to analyze billions of data points in seconds to perform complex segmentation, anomaly detection, and trend-based analysis without codingDeliver and pitch your topic in the best possible manner with this Administered Data And Analytic Quality Playbook How To Overcome Automated Data Analysis Sample PDF Use them to share invaluable insights on Predictive Factors, Recommendations, Explore Segment and impress your audience. This template can be altered and modified as per your expectations. So, grab it now.
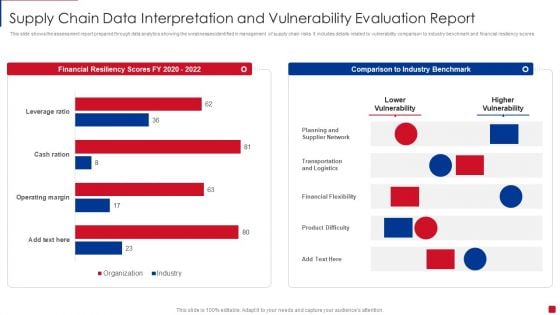
Supply Chain Data Interpretation And Vulnerability Evaluation Report Pictures PDF
This slide shows the assessment report prepared through data analytics showing the weaknesses identified in management of supply chain risks. It includes details related to vulnerability comparison to industry benchmark and financial resiliency scores Showcasing this set of slides titled Supply Chain Data Interpretation And Vulnerability Evaluation Report Pictures PDF. The topics addressed in these templates are Planning And Supplier Network, Transportation And Logistics, Financial Flexibility. All the content presented in this PPT design is completely editable. Download it and make adjustments in color, background, font etc. as per your unique business setting.
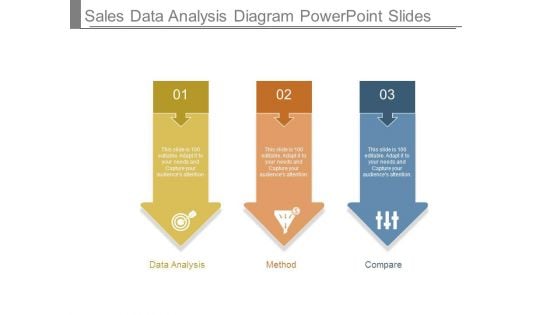
Sales Data Analysis Diagram Powerpoint Slides
This is a sales data analysis diagram powerpoint slides. This is a three stage process. The stages in this process are data analysis, method, compare.
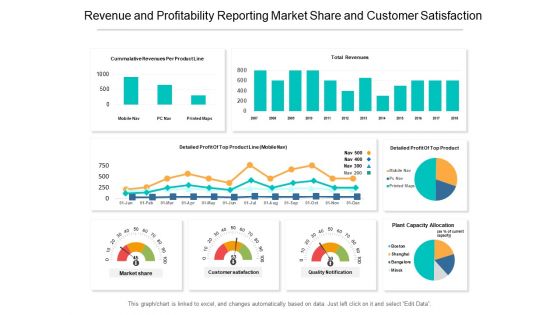
Revenue And Profitability Reporting Market Share And Customer Satisfaction Ppt PowerPoint Presentation Styles Format Ideas
This is a revenue and profitability reporting market share and customer satisfaction ppt powerpoint presentation styles format ideas. This is a four stage process. The stages in this process are business analytics, ba, organizations data.
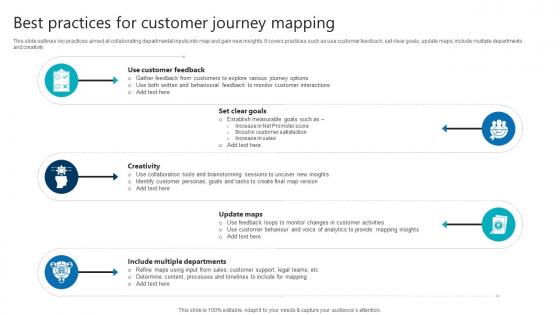
Best Practices For Customer Journey Mapping Product Analytics Implementation Data Analytics V
This slide outlines key practices aimed at collaborating departmental inputs into map and gain new insights. It covers practices such as use customer feedback, set clear goals, update maps, include multiple departments and creativity.Want to ace your presentation in front of a live audience Our Best Practices For Customer Journey Mapping Product Analytics Implementation Data Analytics V can help you do that by engaging all the users towards you. Slidegeeks experts have put their efforts and expertise into creating these impeccable powerpoint presentations so that you can communicate your ideas clearly. Moreover, all the templates are customizable, and easy-to-edit and downloadable. Use these for both personal and commercial use. This slide outlines key practices aimed at collaborating departmental inputs into map and gain new insights. It covers practices such as use customer feedback, set clear goals, update maps, include multiple departments and creativity.
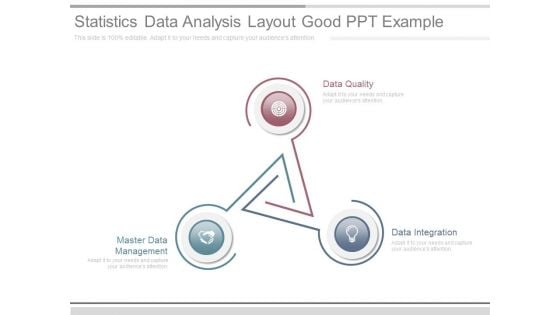
Statistics Data Analysis Layout Good Ppt Example
This is a statistics data analysis layout good ppt example. This is a three stage process. The stages in this process are data quality, data integration, master data management.
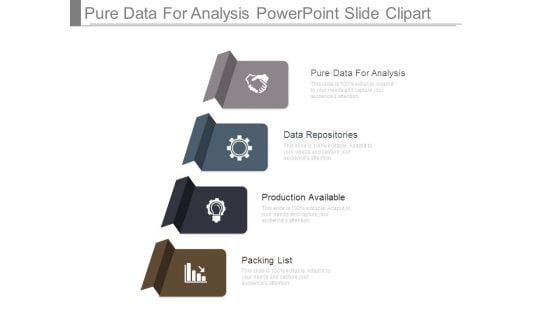
Pure Data For Analysis Powerpoint Slide Clipart
This is a pure data for analysis powerpoint slide clipart. This is a four stage process. The stages in this process are pure data for analysis, data repositories, production available, packing list.

Customer Satisfaction Framework Ppt Slide
This is a customer satisfaction framework ppt slide. This is a seven stage process. The stages in this process are task items, item.
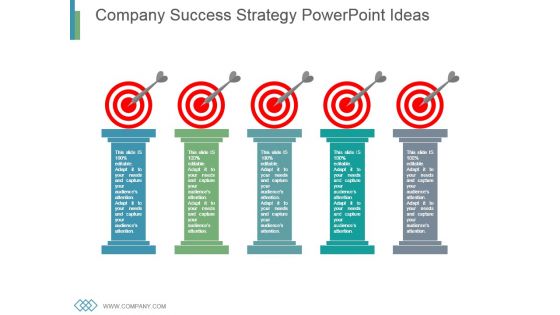
Company Success Strategy Powerpoint Ideas
This is a company success strategy powerpoint ideas. This is a five stage process. The stages in this process are business, marketing, success, strategy, target.
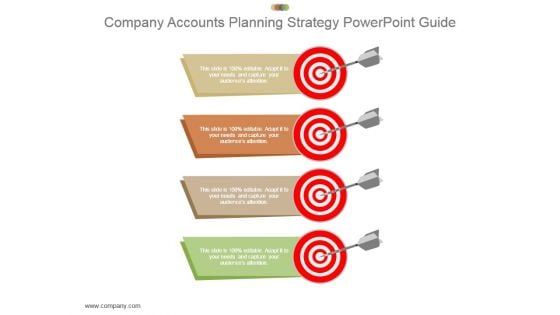
Company Accounts Planning Strategy Powerpoint Guide
This is a company accounts planning strategy powerpoint guide. This is a four stage process. The stages in this process are goal, target, planning, strategy, company.
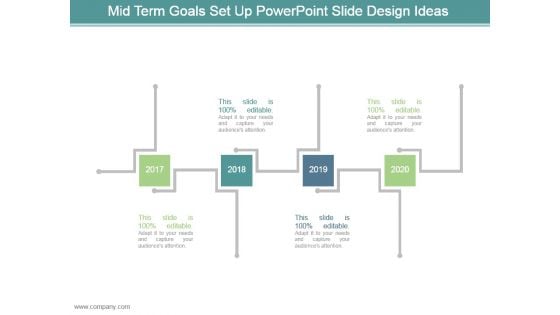
Mid Term Goals Set Up Powerpoint Slide Design Ideas
This is a mid term goals set up powerpoint slide design ideas. This is a four stage process. The stages in this process are arrows, business, marketing, planning, years.

Setting Short Term Goals Powerpoint Slide Graphics
This is a setting short term goals powerpoint slide graphics. This is a five stage process. The stages in this process are february, january, march, may, april.
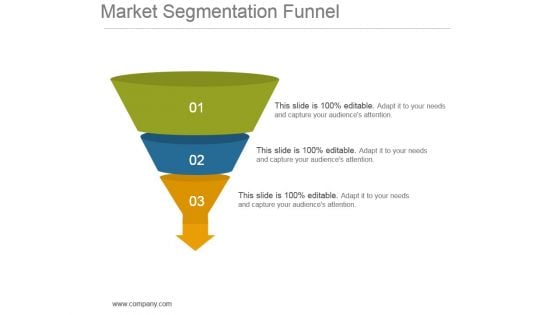
Market Segmentation Funnel Example Of Ppt Presentation
This is a market segmentation funnel example of ppt presentation. This is a three stage process. The stages in this process are funnel, business, filter, marketing, arrow.
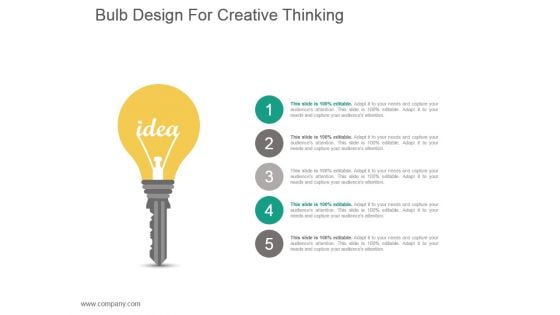
Bulb Design For Creative Thinking Process Powerpoint Ideas
This is a bulb design for creative thinking process powerpoint ideas. This is a five stage process. The stages in this process are idea bulls, security, business, strategy, success.
4 Steps Agenda To Achieve Company Goals Ppt PowerPoint Presentation Inspiration
This is a 4 steps agenda to achieve company goals ppt powerpoint presentation inspiration. This is a four stage process. The stages in this process are business, agenda, strategy, analysis, success.
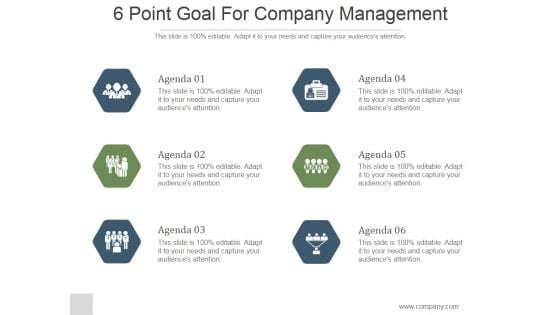
6 Point Goal For Company Management Ppt PowerPoint Presentation Slide
This is a 6 point goal for company management ppt powerpoint presentation slide. This is a six stage process. The stages in this process are agenda, business, strategy, icons, hexagon, marketing.

Real Estate Outlook Ppt PowerPoint Presentation Layout
This is a real estate outlook ppt powerpoint presentation layout. This is a one stage process. The stages in this process are business, marketing, management, real estate, innovation.

Customer Satisfaction Template Ppt PowerPoint Presentation Show Introduction
This is a customer satisfaction template ppt powerpoint presentation show introduction. This is a three stage process. The stages in this process are overall satisfaction with service, satisfaction with value for money, overall satisfaction with relationship.
External Analysis Labour Market Forecasts Ppt PowerPoint Presentation Icon Guidelines
This is a external analysis labour market forecasts ppt powerpoint presentation icon guidelines. This is a seven stage process. The stages in this process are labour market characteristic, tables, data, analysis, planning.
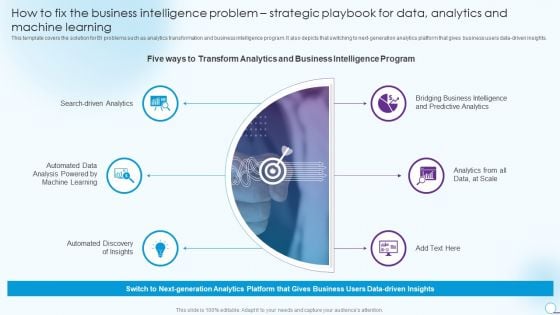
How To Fix The Business Intelligence Problem Strategic Playbook For Data Analytics And Machine Learning Designs PDF
This template covers the solution for BI problems such as analytics transformation and business intelligence program. It also depicts that switching to next generation analytics platform that gives business users data driven insights. This is a How To Fix The Business Intelligence Problem Strategic Playbook For Data Analytics And Machine Learning Designs PDF template with various stages. Focus and dispense information on six stages using this creative set, that comes with editable features. It contains large content boxes to add your information on topics like Automated Data Analysis, Search Driven Analytics, Predictive Analytics. You can also showcase facts, figures, and other relevant content using this PPT layout. Grab it now.
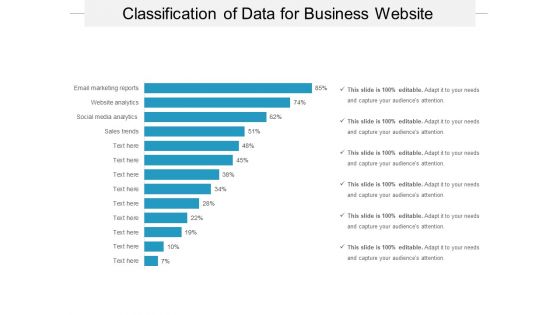
Classification Of Data For Business Website Ppt PowerPoint Presentation Styles Layout PDF
Presenting this set of slides with name classification of data for business website ppt powerpoint presentation styles layout pdf. The topics discussed in these slides are sales trends, social media analytics, website analytics, email marketing reports. This is a completely editable PowerPoint presentation and is available for immediate download. Download now and impress your audience.
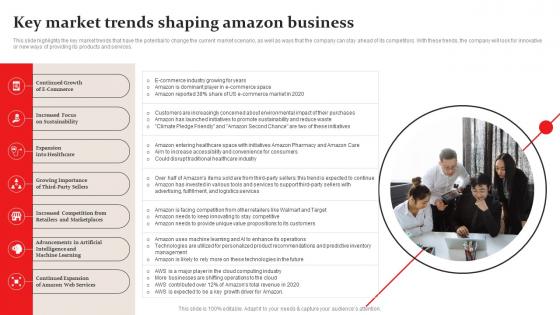
Key Market Trends Shaping Amazon Business Plan Go To Market Strategy Slides Pdf
This slide highlights the key market trends that have the potential to change the current market scenario, as well as ways that the company can stay ahead of its competitors. With these trends, the company will look for innovative or new ways of providing its products and services. The Key Market Trends Shaping Amazon Business Plan Go To Market Strategy Slides Pdf is a compilation of the most recent design trends as a series of slides. It is suitable for any subject or industry presentation, containing attractive visuals and photo spots for businesses to clearly express their messages. This template contains a variety of slides for the user to input data, such as structures to contrast two elements, bullet points, and slides for written information. Slidegeeks is prepared to create an impression. This slide highlights the key market trends that have the potential to change the current market scenario, as well as ways that the company can stay ahead of its competitors. With these trends, the company will look for innovative or new ways of providing its products and services.
Magnifying Glass Ppt PowerPoint Presentation Information
This is a magnifying glass ppt powerpoint presentation information. This is a one stage process. The stages in this process are magnify, gears, search, big data, technology.
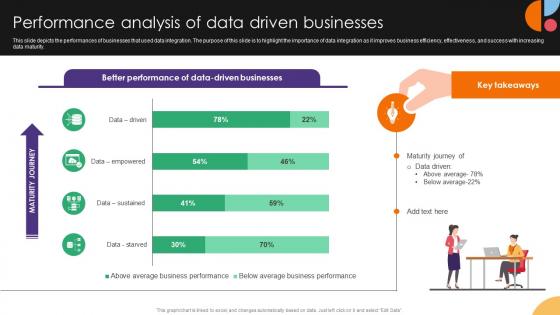
Performance Analysis Of Data Driven Businesses Data Integration Strategies For Business
This slide depicts the performances of businesses that used data integration. The purpose of this slide is to highlight the importance of data integration as it improves business efficiency, effectiveness, and success with increasing data maturity. From laying roadmaps to briefing everything in detail, our templates are perfect for you. You can set the stage with your presentation slides. All you have to do is download these easy-to-edit and customizable templates. Performance Analysis Of Data Driven Businesses Data Integration Strategies For Business will help you deliver an outstanding performance that everyone would remember and praise you for. Do download this presentation today. This slide depicts the performances of businesses that used data integration. The purpose of this slide is to highlight the importance of data integration as it improves business efficiency, effectiveness, and success with increasing data maturity.

Increasing Business Awareness Evaluating Kpis To Determine Gap In Business Strategy SS V
This slide analyzes the performance of key metrics of insurance business. It includes information about metrics such as new policies per agent, customer acquisition cost, policy sales growth, average premium per customer. Whether you have daily or monthly meetings, a brilliant presentation is necessary. Increasing Business Awareness Evaluating Kpis To Determine Gap In Business Strategy SS V can be your best option for delivering a presentation. Represent everything in detail using Increasing Business Awareness Evaluating Kpis To Determine Gap In Business Strategy SS V and make yourself stand out in meetings. The template is versatile and follows a structure that will cater to your requirements. All the templates prepared by Slidegeeks are easy to download and edit. Our research experts have taken care of the corporate themes as well. So, give it a try and see the results. This slide analyzes the performance of key metrics of insurance business. It includes information about metrics such as new policies per agent, customer acquisition cost, policy sales growth, average premium per customer.
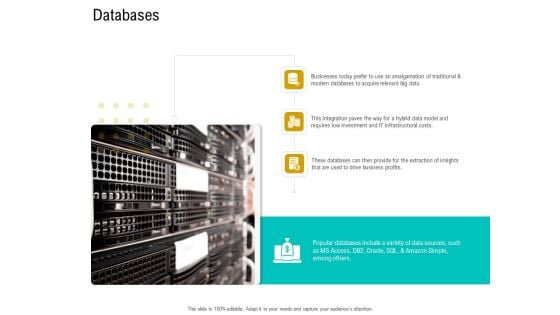
Business Data Analysis Databases Download PDF
Deliver an awe inspiring pitch with this creative business data analysis databases download pdf bundle. Topics like amalgamation of traditional, this integration paves the way for a hybrid data model and requires low investment and it infrastructural costs, these databases can then provide for the extraction of insights that are used to drive business profits. can be discussed with this completely editable template. It is available for immediate download depending on the needs and requirements of the user.
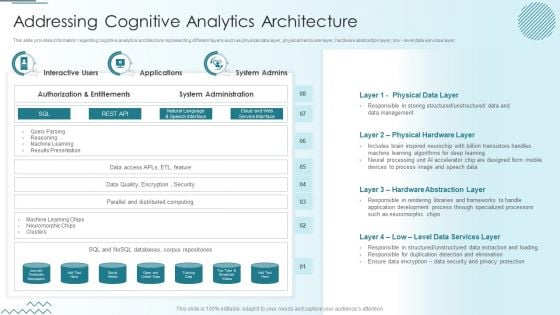
Computer Simulation Human Thinking Addressing Cognitive Analytics Architecture Guidelines PDF
This slide provides information regarding cognitive analytics architecture representing different layers such as physical data layer, physical hardware layer, hardware abstraction layer, low - level data services layer. This is a Computer Simulation Human Thinking Addressing Cognitive Analytics Architecture Guidelines PDF template with various stages. Focus and dispense information on eight stages using this creative set, that comes with editable features. It contains large content boxes to add your information on topics like Interactive Users, Applications, System Admins, System Administration. You can also showcase facts, figures, and other relevant content using this PPT layout. Grab it now.
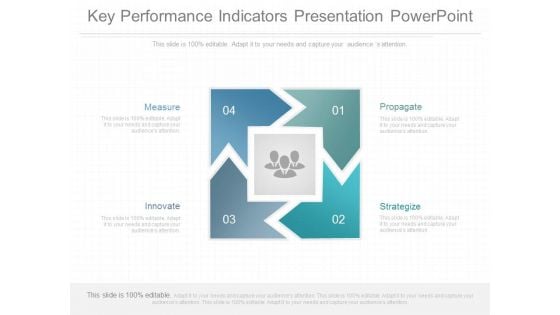
Key Performance Indicators Presentation Powerpoint
This is a key performance indicators presentation powerpoint. This is a four stage process. The stages in this process are measure, innovate, propagate, strategize.
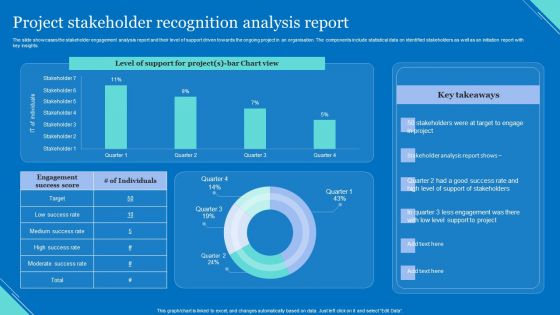
Project Stakeholder Recognition Analysis Report Elements PDF
The slide showcases the stakeholder engagement analysis report and their level of support driven towards the ongoing project in an organisation. The components include statistical data on identified stakeholders as well as an initiation report with key insights. Showcasing this set of slides titled Project Stakeholder Recognition Analysis Report Elements PDF. The topics addressed in these templates are Level Support, Chart View, Support Stakeholders. All the content presented in this PPT design is completely editable. Download it and make adjustments in color, background, font etc. as per your unique business setting.
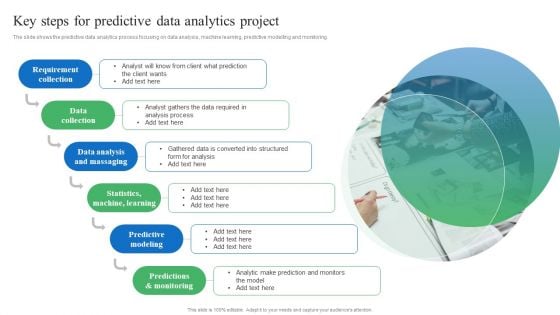
Toolkit For Data Science And Analytics Transition Key Steps For Predictive Data Analytics Project Infographics PDF
The slide shows the predictive data analytics process focusing on data analysis, machine learning, predictive modelling and monitoring. Formulating a presentation can take up a lot of effort and time, so the content and message should always be the primary focus. The visuals of the PowerPoint can enhance the presenters message, so our Toolkit For Data Science And Analytics Transition Key Steps For Predictive Data Analytics Project Infographics PDF was created to help save time. Instead of worrying about the design, the presenter can concentrate on the message while our designers work on creating the ideal templates for whatever situation is needed. Slidegeeks has experts for everything from amazing designs to valuable content, we have put everything into Toolkit For Data Science And Analytics Transition Key Steps For Predictive Data Analytics Project Infographics PDF.
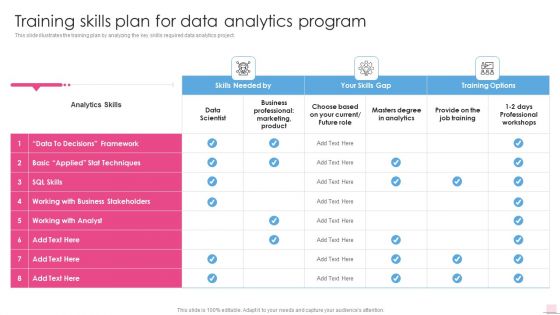
Training Skills Plan For Data Analytics Program Business Analysis Modification Toolkit Template PDF
This slide illustrates the training plan by analyzing the key skills required data analytics project.Deliver and pitch your topic in the best possible manner with this Training Skills Plan For Data Analytics Program Business Analysis Modification Toolkit Template PDF. Use them to share invaluable insights on Business Stakeholders, Decisions Framework, Professional Marketing and impress your audience. This template can be altered and modified as per your expectations. So, grab it now.
Business Diagram Hour Glass With 3d Man And Icons PowerPoint Slide
This diagram displays 3d man with hour glass and icons. This diagram contains concept of communication and technology. Use this diagram to display business process workflows in any presentations.
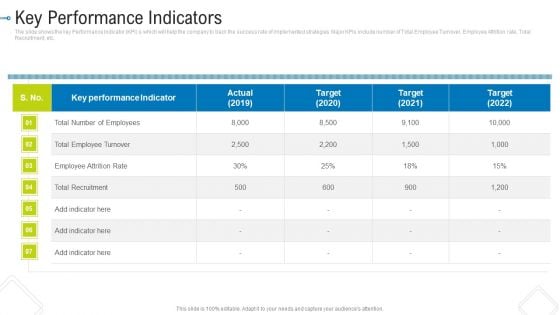
Key Performance Indicators Mockup PDF
Deliver and pitch your topic in the best possible manner with this key performance indicators mockup pdf. Use them to share invaluable insights on total number of employees, employee attrition rate, key performance indicator and impress your audience. This template can be altered and modified as per your expectations. So, grab it now.
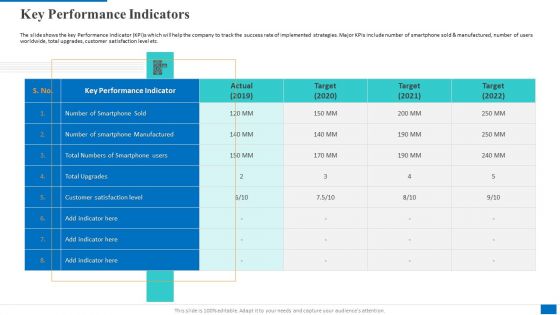
Key Performance Indicators Microsoft PDF
Deliver and pitch your topic in the best possible manner with this key performance indicators microsoft pdf. Use them to share invaluable insights on total numbers of smartphone users, key performance indicator, customer satisfaction level and impress your audience. This template can be altered and modified as per your expectations. So, grab it now.
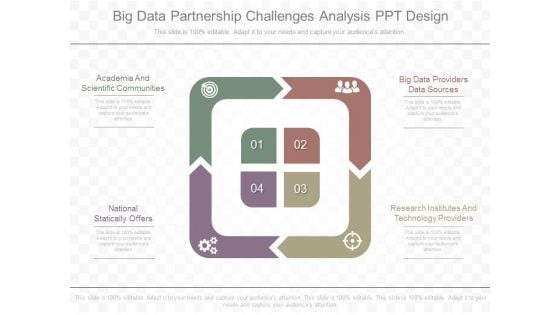
Big Data Partnership Challenges Analysis Ppt Design
This is a big data partnership challenges analysis ppt design. This is a four stage process. The stages in this process are academia and scientific communities, national statically offers, big data providers data sources, research institutes and technology providers.
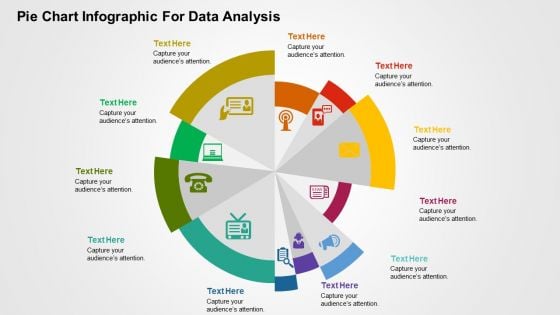
Pie Chart Infographic For Data Analysis PowerPoint Templates
This is one of the most downloaded PowerPoint template. This slide can be used for various purposes and to explain a number of processes. This can be included in your presentation to explain each step of a process and even include its relevance and importance in a single diagram. Using the uneven circular structure of the pie chart, the presenter can also explain random steps or highlight particular steps of process or parts of an organization or business that need special attention of any kind to the audience. Additionally, you can use this slide to show a transformation process or highlight key features of a product.

Big Data Cycle For Analysis Diagram Slides
This is a big data cycle for analysis diagram slides. This is a five stage process. The stages in this process are massive data, new management needs, new final result, new hard and software, new analysis possibilities.
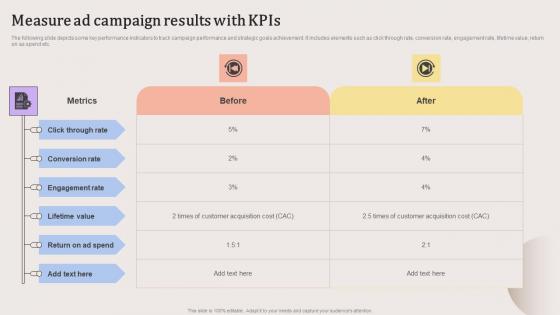
Measure Ad Campaign Results With KPIs Evaluating Strengths And Weaknesses Elements Pdf
The following slide depicts some key performance indicators to track campaign performance and strategic goals achievement. It includes elements such as click through rate, conversion rate, engagement rate, lifetime value, return on as spend etc.From laying roadmaps to briefing everything in detail, our templates are perfect for you. You can set the stage with your presentation slides. All you have to do is download these easy-to-edit and customizable templates. Measure Ad Campaign Results With KPIs Evaluating Strengths And Weaknesses Elements Pdf will help you deliver an outstanding performance that everyone would remember and praise you for. Do download this presentation today. The following slide depicts some key performance indicators to track campaign performance and strategic goals achievement. It includes elements such as click through rate, conversion rate, engagement rate, lifetime value, return on as spend etc.
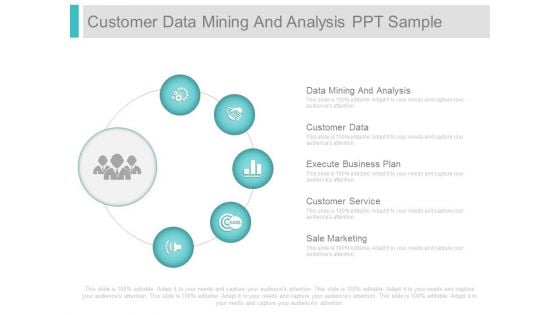
Customer Data Mining And Analysis Ppt Sample
This is a customer data mining and analysis ppt sample. This is a five stage process. The stages in this process are data mining and analysis, customer data, execute business plan, customer service, sale marketing.
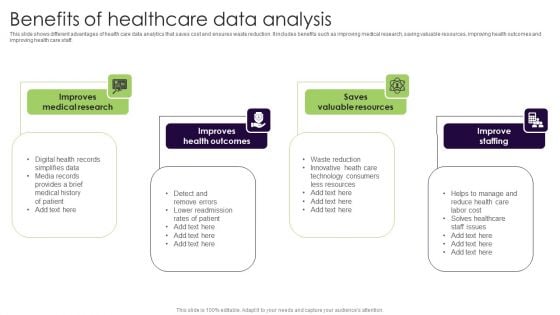
Benefits Of Healthcare Data Analysis Slides PDF
This slide shows different advantages of health care data analytics that saves cost and ensures waste reduction. It includes benefits such as improving medical research, saving valuable resources, improving health outcomes and improving health care staff. Persuade your audience using this Benefits Of Healthcare Data Analysis Slides PDF. This PPT design covers four stages, thus making it a great tool to use. It also caters to a variety of topics including Improves Health Outcomes, Saves Valuable Resources, Improve Staffing. Download this PPT design now to present a convincing pitch that not only emphasizes the topic but also showcases your presentation skills.
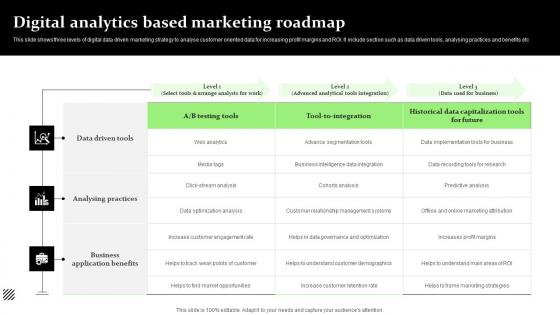
Digital Analytics Based Marketing Roadmap Elements Pdf
This slide shows three levels of digital data driven marketing strategy to analyse customer oriented data for increasing profit margins and ROI. It include section such as data driven tools, analysing practices and benefits etc.Showcasing this set of slides titled Digital Analytics Based Marketing Roadmap Elements Pdf The topics addressed in these templates are Analysing Practices, Data Driven Tools, Optimization Analysis All the content presented in this PPT design is completely editable. Download it and make adjustments in color, background, font etc. as per your unique business setting. This slide shows three levels of digital data driven marketing strategy to analyse customer oriented data for increasing profit margins and ROI. It include section such as data driven tools, analysing practices and benefits etc.
Transformation Toolkit Competitive Intelligence Information Analysis Vendor Data Profile For Data Analytics Software Icons PDF
This slide represents the list of vendors along with accompanying information including the key features, pros and cons of each vendor software. Slidegeeks is here to make your presentations a breeze with Transformation Toolkit Competitive Intelligence Information Analysis Vendor Data Profile For Data Analytics Software Icons PDF With our easy to use and customizable templates, you can focus on delivering your ideas rather than worrying about formatting. With a variety of designs to choose from, you are sure to find one that suits your needs. And with animations and unique photos, illustrations, and fonts, you can make your presentation pop. So whether you are giving a sales pitch or presenting to the board, make sure to check out Slidegeeks first.
Sales Gap Data Analysis Icon Microsoft PDF
Persuade your audience using this Sales Gap Data Analysis Icon Microsoft PDF. This PPT design covers four stages, thus making it a great tool to use. It also caters to a variety of topics including Sales Gap Data, Analysis Icon. Download this PPT design now to present a convincing pitch that not only emphasizes the topic but also showcases your presentation skills.
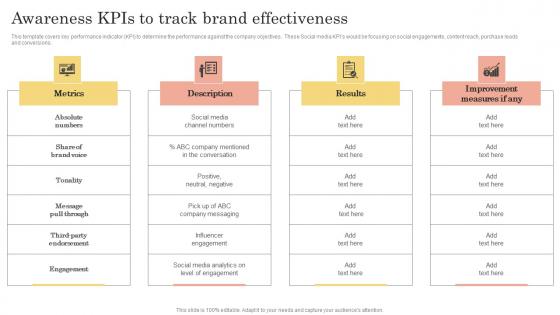
Brand Kickoff Promotional Plan Awareness KPIs To Track Brand Effectiveness Topics Pdf
This template covers key performance indicator KPI to determine the performance against the company objectives. These Social media KPIs would be focusing on social engagements, content reach, purchase leads and conversions. There are so many reasons you need a Brand Kickoff Promotional Plan Awareness KPIs To Track Brand Effectiveness Topics Pdf. The first reason is you can not spend time making everything from scratch, Thus, Slidegeeks has made presentation templates for you too. You can easily download these templates from our website easily. This template covers key performance indicator KPI to determine the performance against the company objectives. These Social media KPIs would be focusing on social engagements, content reach, purchase leads and conversions.
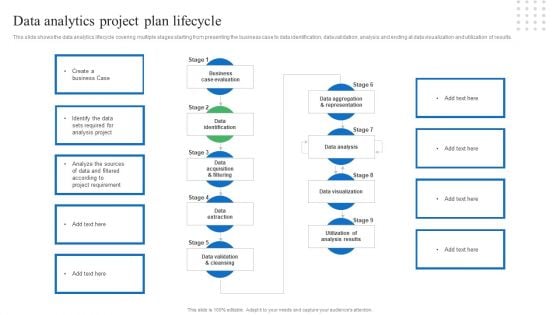
Toolkit For Data Science And Analytics Transition Data Analytics Project Plan Lifecycle Introduction PDF
The slide outline the key steps for data analytics methodology. It initiates with defining business objectives to data understanding, modelling and ends at data visualization and presentation. From laying roadmaps to briefing everything in detail, our templates are perfect for you. You can set the stage with your presentation slides. All you have to do is download these easy to edit and customizable templates. Toolkit For Data Science And Analytics Transition Data Analytics Project Plan Lifecycle Introduction PDF will help you deliver an outstanding performance that everyone would remember and praise you for. Do download this presentation today.
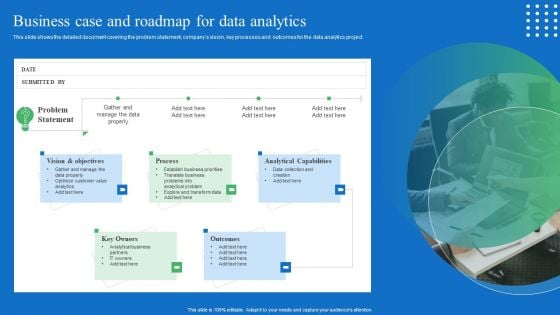
Toolkit For Data Science And Analytics Transition Business Case And Roadmap For Data Analytics Microsoft PDF
This slide shows the detailed document covering the problem statement, companys vision, key processes and outcomes for the data analytics project.There are so many reasons you need a Toolkit For Data Science And Analytics Transition Business Case And Roadmap For Data Analytics Microsoft PDF. The first reason is you can not spend time making everything from scratch, Thus, Slidegeeks has made presentation templates for you too. You can easily download these templates from our website easily.

Internet Security Threat Analysis Report Chart Introduction PDF
Following slide exhibits security and data breach report chart it includes major statistics such as- loss or theft of data, failure to redirect data and data posting to incorrect recipient. Pitch your topic with ease and precision using this internet security threat analysis report chart introduction pdf. This layout presents information on internet security threat analysis report chart. It is also available for immediate download and adjustment. So, changes can be made in the color, design, graphics or any other component to create a unique layout.
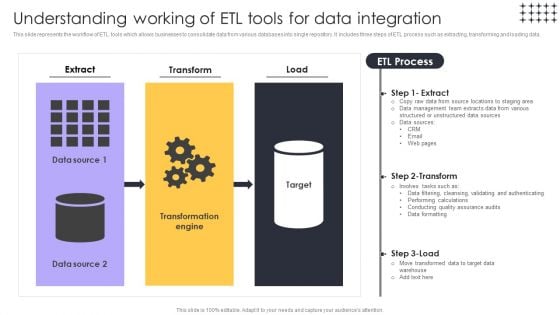
Tools For HR Business Analytics Understanding Working Of ETL Tools For Data Integration Ideas PDF
This slide represents the workflow of ETL tools which allows businesses to consolidate data from various databases into single repository. It includes three steps of ETL process such as extracting, transforming and loading data. Presenting this PowerPoint presentation, titled Tools For HR Business Analytics Understanding Working Of ETL Tools For Data Integration Ideas PDF, with topics curated by our researchers after extensive research. This editable presentation is available for immediate download and provides attractive features when used. Download now and captivate your audience. Presenting this Tools For HR Business Analytics Understanding Working Of ETL Tools For Data Integration Ideas PDF. Our researchers have carefully researched and created these slides with all aspects taken into consideration. This is a completely customizable Tools For HR Business Analytics Understanding Working Of ETL Tools For Data Integration Ideas PDF that is available for immediate downloading. Download now and make an impact on your audience. Highlight the attractive features available with our PPTs.
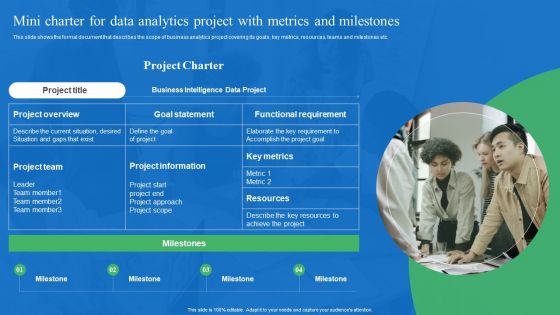
Mini Charter For Data Analytics Project With Metrics And Milestones Clipart PDF
This slide shows the formal document that describes the scope of business analytics project covering its goals, key metrics, resources, teams and milestones etc. This Mini Charter For Data Analytics Project With Metrics And Milestones Clipart PDF from Slidegeeks makes it easy to present information on your topic with precision. It provides customization options, so you can make changes to the colors, design, graphics, or any other component to create a unique layout. It is also available for immediate download, so you can begin using it right away. Slidegeeks has done good research to ensure that you have everything you need to make your presentation stand out. Make a name out there for a brilliant performance.
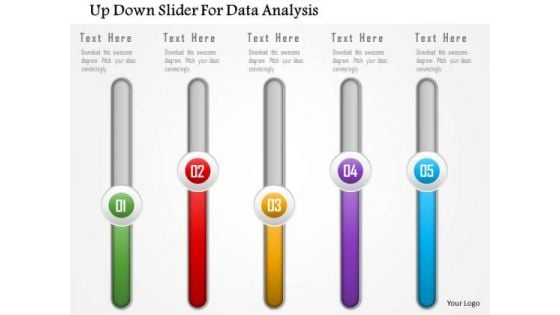
Business Diagram Up Down Slider For Data Analysis Presentation Template
This business diagram has been designed with graphics of slider. You may download this professional slide to display data trends. Transmit your thoughts via this slide.

Toolkit For Data Science And Analytics Transition Business Requirements For Data Analytics Project Designs PDF
The slide specifies the key requirements for data analytics project covering the business, data, application and technology aspects. Do you have to make sure that everyone on your team knows about any specific topic I yes, then you should give Toolkit For Data Science And Analytics Transition Business Requirements For Data Analytics Project Designs PDF a try. Our experts have put a lot of knowledge and effort into creating this impeccable Toolkit For Data Science And Analytics Transition Business Requirements For Data Analytics Project Designs PDF. You can use this template for your upcoming presentations, as the slides are perfect to represent even the tiniest detail. You can download these templates from the Slidegeeks website and these are easy to edit. So grab these today.

Case Study Ppt PowerPoint Presentation Slides Diagrams
This is a case study ppt powerpoint presentation slides diagrams. This is a one stage process. The stages in this process are magnify, search, technology, study, analysis.
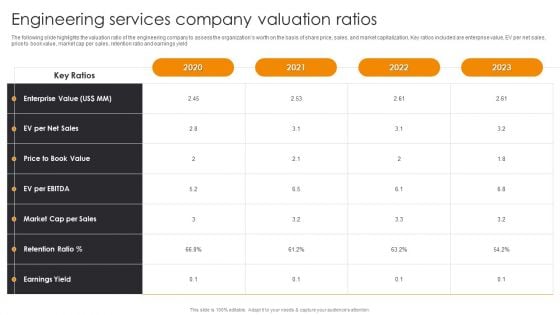
Engineering Services Company Valuation Ratios Engineering Company Financial Analysis Report Brochure PDF
The following slide highlights the valuation ratio of the engineering company to assess the organizations worth on the basis of share price, sales, and market capitalization, Key ratios included are enterprise value, EV per net sales, price to book value, market cap per sales, retention ratio and earnings yield. The Engineering Services Company Valuation Ratios Engineering Company Financial Analysis Report Brochure PDF is a compilation of the most recent design trends as a series of slides. It is suitable for any subject or industry presentation, containing attractive visuals and photo spots for businesses to clearly express their messages. This template contains a variety of slides for the user to input data, such as structures to contrast two elements, bullet points, and slides for written information. Slidegeeks is prepared to create an impression.

Data Lake Architecture Future Of Data Analysis Foundational Elements Of Centralized Repository Data Lake Sample PDF
This slide represents the data lake foundation elements such as data lake provisioning, data ingestion sources, landing zones, processing zone, analytics zone, insight zone, and data lake decommissioning.Presenting Data Lake Architecture Future Of Data Analysis Foundational Elements Of Centralized Repository Data Lake Sample PDF to provide visual cues and insights. Share and navigate important information on One stage that need your due attention. This template can be used to pitch topics like Lake Provisioning, Data Ingestion, Processing Zone. In addtion, this PPT design contains high resolution images, graphics, etc, that are easily editable and available for immediate download.
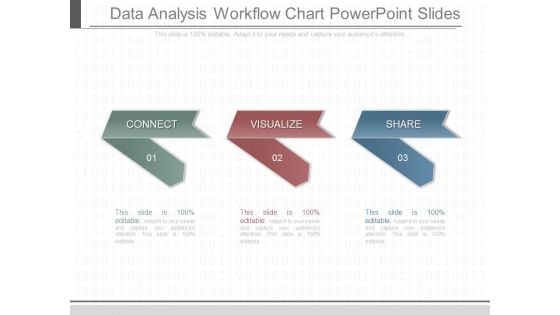
Data Analysis Workflow Chart Powerpoint Slides
This is a data analysis workflow chart powerpoint slides. This is a three stage process. The stages in this process are connect, visualize, share.
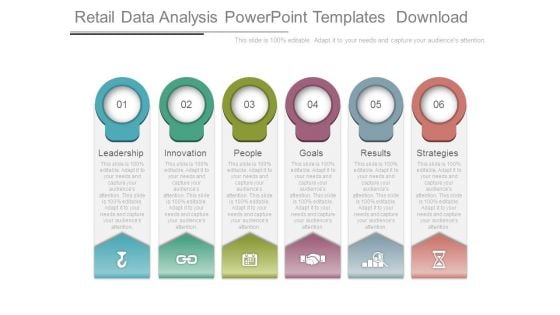
Retail Data Analysis Powerpoint Templates Download
This is a retail data analysis powerpoint templates download. This is a six stage process. The stages in this process are leadership, innovation, people, goals, results, strategies.
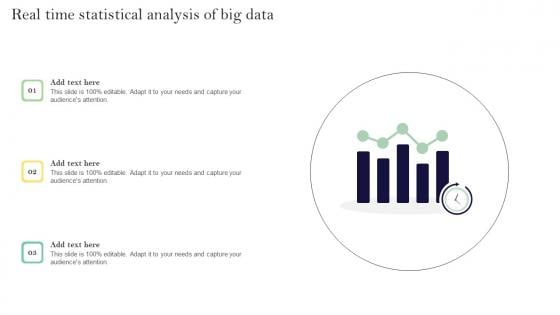
Real Time Statistical Analysis Of Big Data Ppt Infographics Design Ideas Pdf
Pitch your topic with ease and precision using this Real Time Statistical Analysis Of Big Data Ppt Infographics Design Ideas Pdf. This layout presents information on Real Time, Statistical Analysis, Big Data. It is also available for immediate download and adjustment. So, changes can be made in the color, design, graphics or any other component to create a unique layout. Our Real Time Statistical Analysis Of Big Data Ppt Infographics Design Ideas Pdf are topically designed to provide an attractive backdrop to any subject. Use them to look like a presentation pro.
Overview Of Key Insights On Cyber Security Trends Icon Microsoft PDF
Persuade your audience using this Overview Of Key Insights On Cyber Security Trends Icon Microsoft PDF. This PPT design covers three stages, thus making it a great tool to use. It also caters to a variety of topics including Overview Of Key Insights, Cyber Security Trends Icon. Download this PPT design now to present a convincing pitch that not only emphasizes the topic but also showcases your presentation skills.


 Continue with Email

 Home
Home


