Dashboards
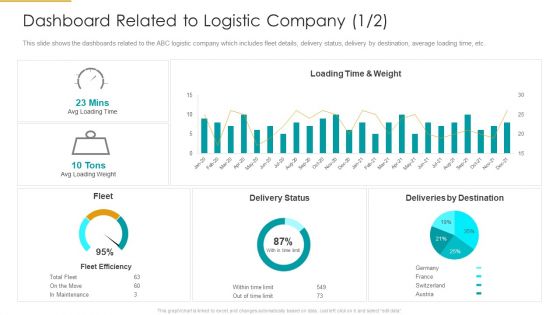
Dashboard Related To Logistic Company Loading Infographics PDF
This slide shows the dashboards related to the ABC logistic company which includes fleet details, delivery status, delivery by destination, average loading time, etc. Deliver and pitch your topic in the best possible manner with this dashboard related to logistic company loading infographics pdf. Use them to share invaluable insights on dashboard related to logistic company and impress your audience. This template can be altered and modified as per your expectations. So, grab it now.
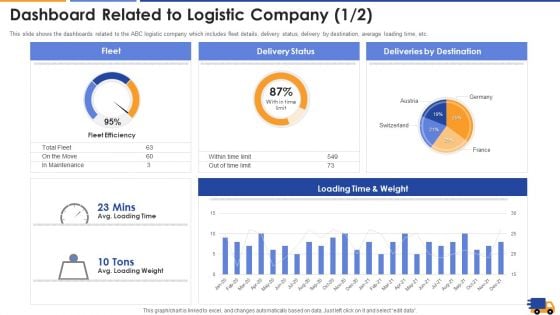
Dashboard Related To Logistic Company Average Structure PDF
This slide shows the dashboards related to the ABC logistic company which includes fleet details, delivery status, delivery by destination, average loading time, etc. Deliver an awe inspiring pitch with this creative dashboard related to logistic company average structure pdf bundle. Topics like dashboard related to logistic company can be discussed with this completely editable template. It is available for immediate download depending on the needs and requirements of the user.
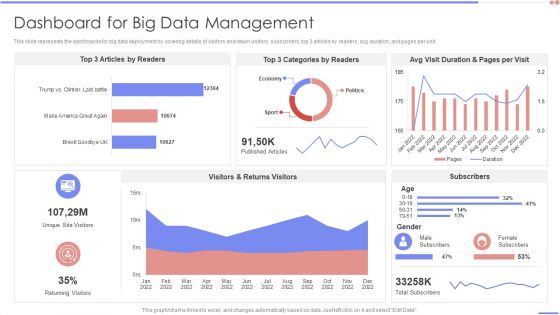
Data Analytics Management Dashboard For Big Data Management Background PDF
This slide represents the dashboards for big data deployment by covering details of visitors and return visitors, subscribers, top 3 articles by readers, avg duration, and pages per visit. Deliver and pitch your topic in the best possible manner with this Data Analytics Management Dashboard For Big Data Management Background PDF. Use them to share invaluable insights on Article Readers, Categories Readers, Duration Pages and impress your audience. This template can be altered and modified as per your expectations. So, grab it now.
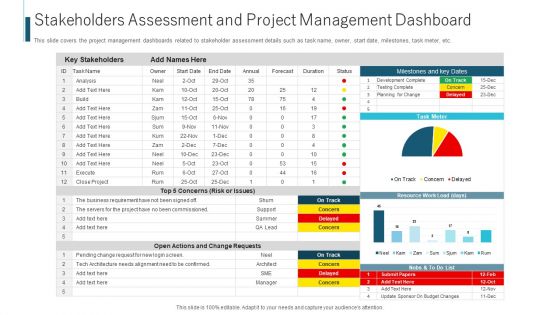
Stakeholders Assessment And Project Management Dashboard Ppt Ideas Outline PDF
This slide covers the project management dashboards related to stakeholder assessment details such as task name, owner, start date, milestones, task meter, etc. Deliver and pitch your topic in the best possible manner with this stakeholders assessment and project management dashboard ppt ideas outline pdf. Use them to share invaluable insights on risk or issues, business requirement, analysis and impress your audience. This template can be altered and modified as per your expectations. So, grab it now.
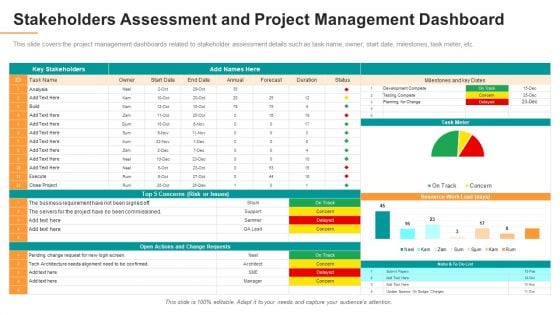
Stakeholders Assessment And Project Management Dashboard Formats PDF
This slide covers the project management dashboards related to stakeholder assessment details such as task name, owner, start date, milestones, task meter, etc. Deliver an awe inspiring pitch with this creative stakeholders assessment and project management dashboard formats pdf bundle. Topics like resource, stakeholders, analysis can be discussed with this completely editable template. It is available for immediate download depending on the needs and requirements of the user.
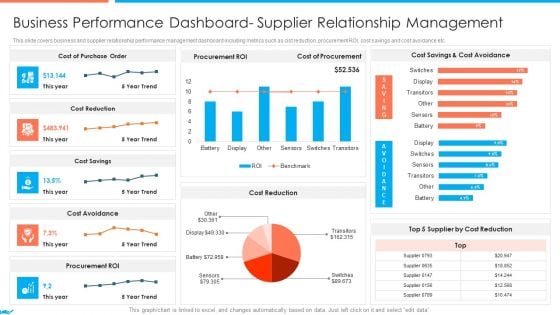
Supplier Association Management Techniques Business Performance Dashboard Portrait PDF
This slide covers business and supplier relationship performance management dashboard including metrics such as cist reduction, procurement ROI, cost savings and cost avoidance etc. Deliver an awe inspiring pitch with this creative icons slide for supplier association management techniques introduction pdf bundle. Topics like supplier association management techniques supplier performance management kpi dashboards guidelines pdf can be discussed with this completely editable template. It is available for immediate download depending on the needs and requirements of the user.
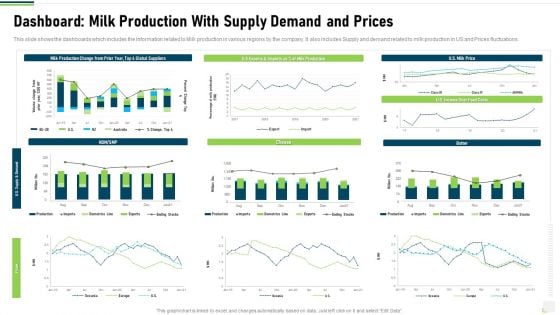
Dashboard Milk Production With Supply Demand And Prices Pictures PDF
This slide shows the dashboards which includes the information related to Milk production in various regions by the company. It also includes Supply and demand related to milk production in US and Prices fluctuations. Deliver an awe inspiring pitch with this creative dashboard milk production with supply demand and prices pictures pdf bundle. Topics like dashboard milk production with supply demand and prices can be discussed with this completely editable template. It is available for immediate download depending on the needs and requirements of the user.
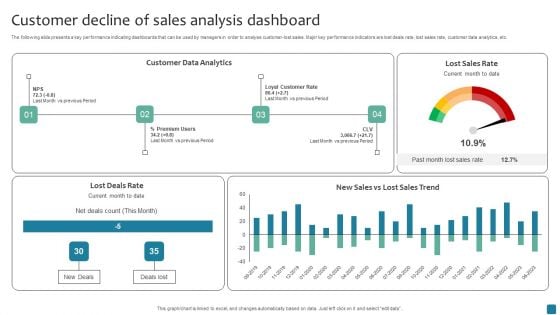
Customer Decline Of Sales Analysis Dashboard Rules PDF
The following slide presents a key performance indicating dashboards that can be used by managers in order to analyse customer-lost sales. Major key performance indicators are lost deals rate, lost sales rate, customer data analytics, etc. Pitch your topic with ease and precision using this Customer Decline Of Sales Analysis Dashboard Rules PDF. This layout presents information on Customer Data Analytics. It is also available for immediate download and adjustment. So, changes can be made in the color, design, graphics or any other component to create a unique layout.
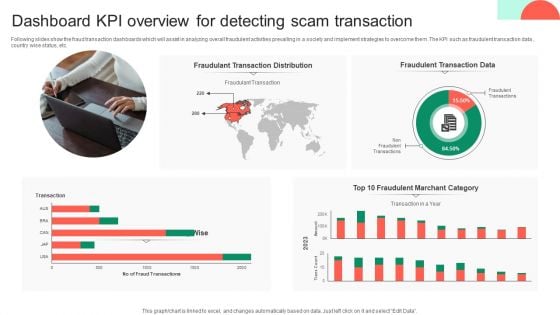
Dashboard KPI Overview For Detecting Scam Transaction Microsoft PDF
Following slides show the fraud transaction dashboards which will assist in analyzing overall fraudulent activities prevailing in a society and implement strategies to overcome them .The KPI such as fraudulent transaction data , country wise status, etc. Showcasing this set of slides titled Dashboard KPI Overview For Detecting Scam Transaction Microsoft PDF. The topics addressed in these templates are Fraudulant Transaction Distribution, Fraudulent Transaction Data, Detecting Scam Transaction. All the content presented in this PPT design is completely editable. Download it and make adjustments in color, background, font etc. as per your unique business setting.
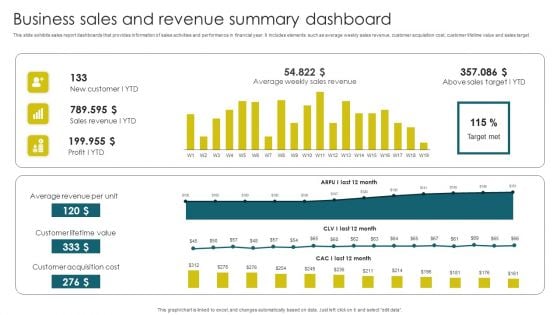
Business Sales And Revenue Summary Dashboard Brochure PDF
This slide exhibits sales report dashboards that provides information of sales activities and performance in financial year. It includes elements such as average weekly sales revenue, customer acquisition cost, customer lifetime value and sales target. Pitch your topic with ease and precision using this Business Sales And Revenue Summary Dashboard Brochure PDF. This layout presents information on Average Revenue, Customer Lifetime, Customer Acquisition. It is also available for immediate download and adjustment. So, changes can be made in the color, design, graphics or any other component to create a unique layout.
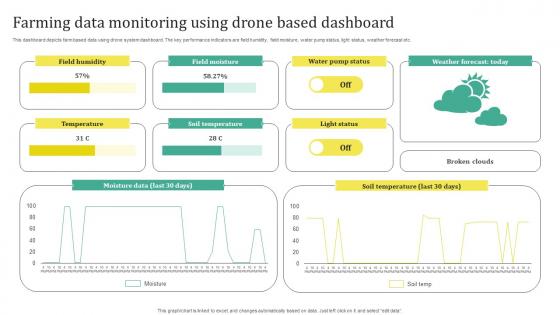
Farming Data Monitoring Using Drone Based Dashboard Sample Pdf
This dashboard depicts farm based data using drone system dashboard. The key performance indicators are field humidity, field moisture, water pump status, light status, weather forecast etc. Pitch your topic with ease and precision using this Farming Data Monitoring Using Drone Based Dashboard Sample Pdf. This layout presents information on Temperature, Soil Temperature, Light Status. It is also available for immediate download and adjustment. So, changes can be made in the color, design, graphics or any other component to create a unique layout. This dashboard depicts farm based data using drone system dashboard. The key performance indicators are field humidity, field moisture, water pump status, light status, weather forecast etc.
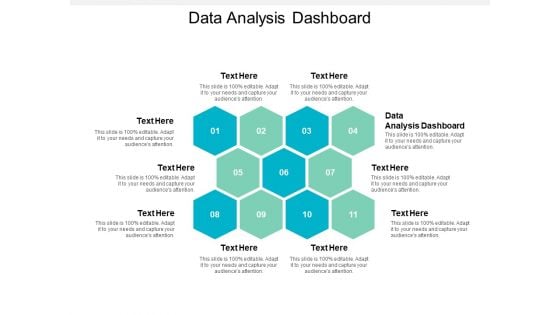
Data Analysis Dashboard Ppt PowerPoint Presentation Styles Maker Cpb
This is a data analysis dashboard ppt powerpoint presentation styles maker cpb. This is a eleven stage process. The stages in this process are data analysis dashboard.
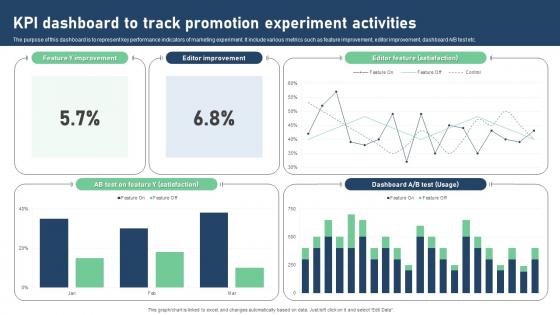
Kpi Dashboard To Track Promotion Experiment Activities Portrait Pdf
The purpose of this dashboard is to represent key performance indicators of marketing experiment. It include various metrics such as feature improvement, editor improvement, dashboard A or B test etc. Pitch your topic with ease and precision using this Kpi Dashboard To Track Promotion Experiment Activities Portrait Pdf. This layout presents information on KPI Dashboard, Track Promotion, Experiment Activities, Editor Improvement. It is also available for immediate download and adjustment. So, changes can be made in the color, design, graphics or any other component to create a unique layout. The purpose of this dashboard is to represent key performance indicators of marketing experiment. It include various metrics such as feature improvement, editor improvement, dashboard A or B test etc.
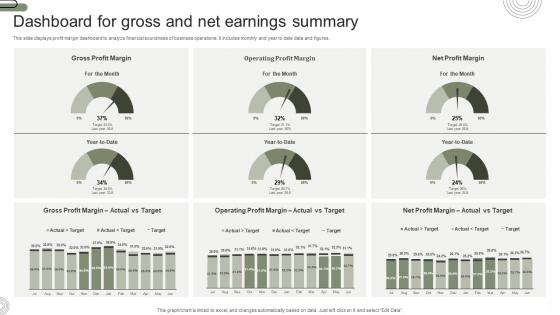
Dashboard For Gross And Net Earnings Summary Designs Pdf
This slide displays profit margin dashboard to analyze financial soundness of business operations. It includes monthly and year to date data and figures. Showcasing this set of slides titled Dashboard For Gross And Net Earnings Summary Designs Pdf. The topics addressed in these templates are Dashboard For Gross, Net Earnings Summary, Financial Soundness. All the content presented in this PPT design is completely editable. Download it and make adjustments in color, background, font etc. as per your unique business setting. This slide displays profit margin dashboard to analyze financial soundness of business operations. It includes monthly and year to date data and figures.
Excel Reporting Dashboard Ppt PowerPoint Presentation Inspiration Slide Portrait Cpb
This is a excel reporting dashboard ppt powerpoint presentation inspiration slide portrait cpb. This is a six stage process. The stages in this process are excel reporting dashboard.
Dashboard Reporting Excel Ppt PowerPoint Presentation File Files Cpb
This is a dashboard reporting excel ppt powerpoint presentation file files cpb. This is a four stage process. The stages in this process are dashboard reporting excel.
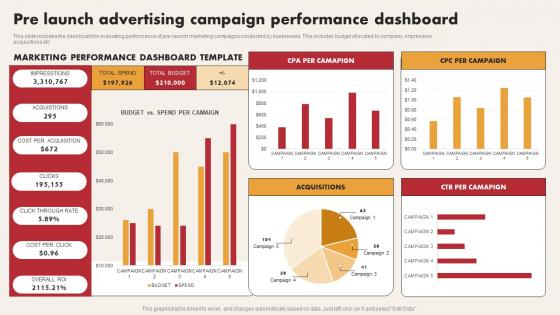
Pre Launch Advertising Campaign Performance Dashboard Graphics Pdf
This slide includes the dashboard for evaluating performance of pre launch marketing campaigns conducted by businesses. This includes budget allocated by company, impression, acquisitions etc Pitch your topic with ease and precision using this Pre Launch Advertising Campaign Performance Dashboard Graphics Pdf. This layout presents information on Pre Launch Advertising Campaign, Performance Dashboard. It is also available for immediate download and adjustment. So, changes can be made in the color, design, graphics or any other component to create a unique layout. This slide includes the dashboard for evaluating performance of pre launch marketing campaigns conducted by businesses. This includes budget allocated by company, impression, acquisitions etc
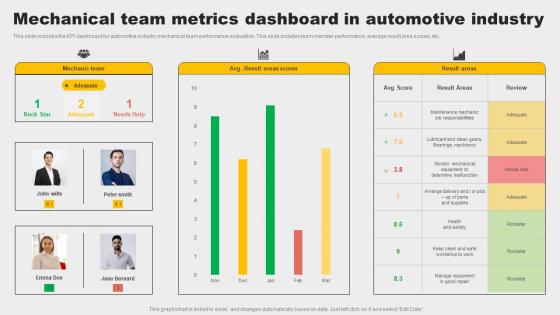
Mechanical Team Metrics Dashboard In Automotive Industry Rules Pdf
This slide includes the KPI dashboard for automotive industry mechanical team performance evaluation. This slide includes team member performance, average result area scores, etc. Showcasing this set of slides titled Mechanical Team Metrics Dashboard In Automotive Industry Rules Pdf. The topics addressed in these templates are Determine Malfunction, Automotive Industry, Mechanical Team Metrics Dashboard. All the content presented in this PPT design is completely editable. Download it and make adjustments in color, background, font etc. as per your unique business setting. This slide includes the KPI dashboard for automotive industry mechanical team performance evaluation. This slide includes team member performance, average result area scores, etc.
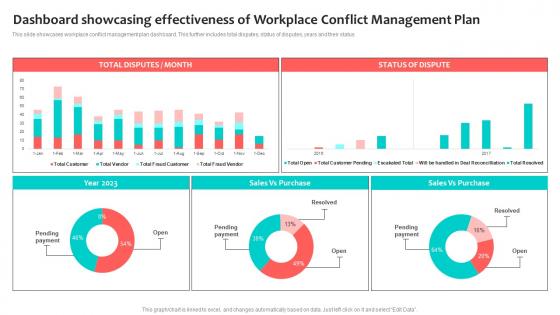
Dashboard Showcasing Effectiveness Of Workplace Conflict Management Plan Formats Pdf
This slide showcases workplace conflict management plan dashboard. This further includes total disputes, status of disputes, years and their status Pitch your topic with ease and precision using this Dashboard Showcasing Effectiveness Of Workplace Conflict Management Plan Formats Pdf. This layout presents information on Dashboard Showcasing Effectiveness, Workplace Conflict Management Plan. It is also available for immediate download and adjustment. So, changes can be made in the color, design, graphics or any other component to create a unique layout. This slide showcases workplace conflict management plan dashboard. This further includes total disputes, status of disputes, years and their status
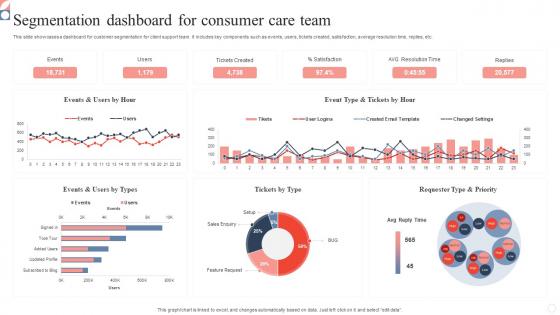
Segmentation Dashboard For Consumer Care Team Slides Pdf
This slide showcases a dashboard for customer segmentation for client support team. It includes key components such as events, users, tickets created, satisfaction, average resolution time, replies, etc. Showcasing this set of slides titled Segmentation Dashboard For Consumer Care Team Slides Pdf. The topics addressed in these templates are Segmentation Dashboard, Consumer Care Team, Satisfaction. All the content presented in this PPT design is completely editable. Download it and make adjustments in color, background, font etc. as per your unique business setting. This slide showcases a dashboard for customer segmentation for client support team. It includes key components such as events, users, tickets created, satisfaction, average resolution time, replies, etc.
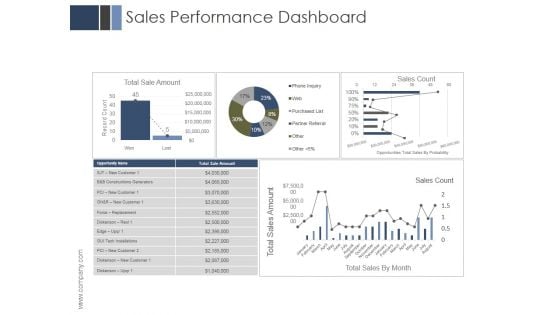
Sales Performance Dashboard Ppt PowerPoint Presentation Example 2015
This is a sales performance dashboard ppt powerpoint presentation example 2015. This is a four stage process. The stages in this process are business, marketing, management, finance, dashboard.
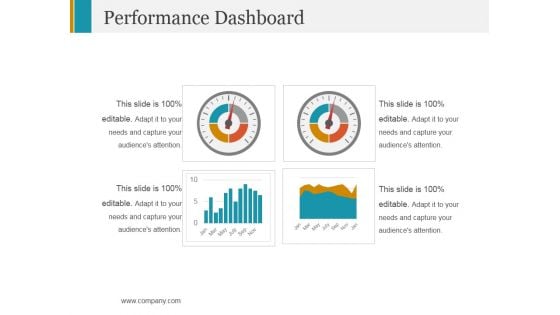
Performance Dashboard Template 2 Ppt PowerPoint Presentation Model Format
This is a performance dashboard template 2 ppt powerpoint presentation model format. This is a four stage process. The stages in this process are dashboard, finance, business, marketing.
Dashboard Management Ppt Powerpoint Presentation Ideas Format Cpb
This is a dashboard management ppt powerpoint presentation ideas format cpb. This is a stage process. The stages in this process are dashboard management.
Dashboard Design Excel Ppt PowerPoint Presentation Ideas Show Cpb
This is a dashboard design excel ppt powerpoint presentation ideas show cpb. This is a four stage process. The stages in this process are dashboard design excel.
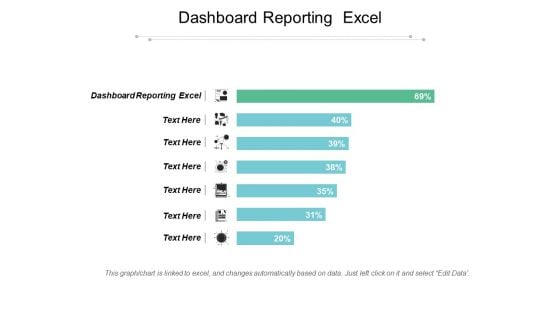
Dashboard Reporting Excel Ppt PowerPoint Presentation Layouts Templates Cpb
This is a dashboard reporting excel ppt powerpoint presentation layouts templates cpb. This is a seven stage process. The stages in this process are dashboard reporting excel.
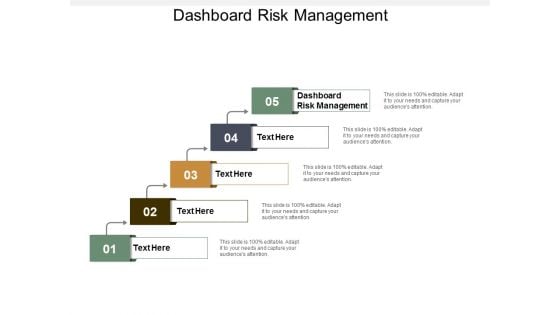
Dashboard Risk Management Ppt Powerpoint Presentation Infographics Infographic Template Cpb
This is a dashboard risk management ppt powerpoint presentation infographics infographic template cpb. This is a five stage process. The stages in this process are dashboard risk management.
Business KPI Dashboard Ppt PowerPoint Presentation Styles Deck Cpb
This is a business kpi dashboard ppt powerpoint presentation styles deck cpb. This is a four stage process. The stages in this process are business kpi dashboard.
Network KPI Dashboard Ppt PowerPoint Presentation Summary Design Ideas Cpb
This is a network kpi dashboard ppt powerpoint presentation summary design ideas cpb. This is a three stage process. The stages in this process are network kpi dashboard.

Email Dashboard Ppt PowerPoint Presentation Layouts Model Cpb
This is a email dashboard ppt powerpoint presentation layouts model cpb. This is a four stage process. The stages in this process are email dashboard.
Email Marketing Dashboard Ppt PowerPoint Presentation Portfolio Templates Cpb
This is a email marketing dashboard ppt powerpoint presentation portfolio templates cpb. This is a four stage process. The stages in this process are email marketing dashboard.
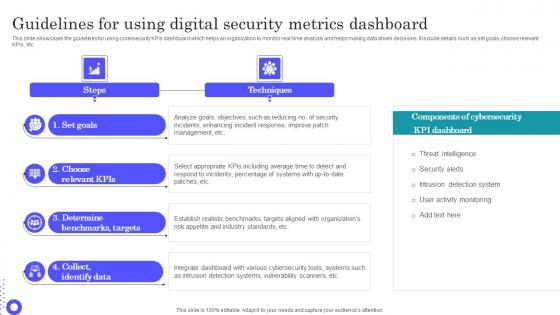
Guidelines For Using Digital Security Metrics Dashboard Introduction Pdf
Pitch your topic with ease and precision using this Guidelines For Using Digital Security Metrics Dashboard Introduction Pdf This layout presents information on Benchmarks Targets, Integrate Dashboard, Incidents Enhancing It is also available for immediate download and adjustment. So, changes can be made in the color, design, graphics or any other component to create a unique layout. This slide showcases the guidelines for using cybersecurity KPIs dashboard which helps an organization to monitor real time analysis and helps making data driven decisions. It include details such as set goals, choose relevant KPIs, etc.
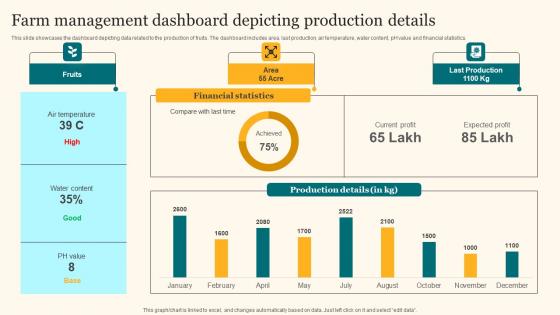
Farm Management Dashboard Depicting Agricultural Product Promotion Pictures Pdf
This slide showcases the dashboard depicting data related to the production of fruits. The dashboard includes area, last production, air temperature, water content, pH value and financial statistics. This modern and well-arranged Farm Management Dashboard Depicting Agricultural Product Promotion Pictures Pdf provides lots of creative possibilities. It is very simple to customize and edit with the Powerpoint Software. Just drag and drop your pictures into the shapes. All facets of this template can be edited with Powerpoint, no extra software is necessary. Add your own material, put your images in the places assigned for them, adjust the colors, and then you can show your slides to the world, with an animated slide included. This slide showcases the dashboard depicting data related to the production of fruits. The dashboard includes area, last production, air temperature, water content, pH value and financial statistics.
Cybernetics Implant Performance Tracking Dashboard Cybernetic Integration Icons Pdf
This slide shows the Cybernetics implant performance tracking dashboard. The purpose of this slide is to represent the Information related to the status of Cybernetics implant graphically. Presenting this PowerPoint presentation, titled Cybernetics Implant Performance Tracking Dashboard Cybernetic Integration Icons Pdf with topics curated by our researchers after extensive research. This editable presentation is available for immediate download and provides attractive features when used. Download now and captivate your audience. Presenting this Cybernetics Implant Performance Tracking Dashboard Cybernetic Integration Icons Pdf Our researchers have carefully researched and created these slides with all aspects taken into consideration. This is a completely customizable Cybernetics Implant Performance Tracking Dashboard Cybernetic Integration Icons Pdf that is available for immediate downloading. Download now and make an impact on your audience. Highlight the attractive features available with our PPTs. This slide shows the Cybernetics implant performance tracking dashboard. The purpose of this slide is to represent the Information related to the status of Cybernetics implant graphically.

Boosting Efficiency In ABC Inventory Management Dashboard Analysis
This slide illustrates ABC inventory management dashboard analysis includes elements such as product name, stock keeping unit, grade etc. Boost your pitch with our creative Boosting Efficiency In ABC Inventory Management Dashboard Analysis. Deliver an awe-inspiring pitch that will mesmerize everyone. Using these presentation templates you will surely catch everyones attention. You can browse the ppts collection on our website. We have researchers who are experts at creating the right content for the templates. So you do not have to invest time in any additional work. Just grab the template now and use them. This slide illustrates ABC inventory management dashboard analysis includes elements such as product name, stock keeping unit, grade etc.
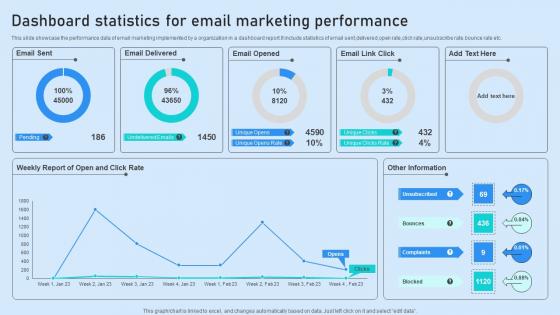
Dashboard Statistics For Email Marketing Performance Guidelines Pdf
This slide showcase the performance data of email marketing implemented by a organization in a dashboard report.It include statistics of email sent,delivered,open rate,click rate,unsubscribe rate,bounce rate etc. Showcasing this set of slides titled Dashboard Statistics For Email Marketing Performance Guidelines Pdf. The topics addressed in these templates are Email Delivered, Email Opened, Performance. All the content presented in this PPT design is completely editable. Download it and make adjustments in color, background, font etc. as per your unique business setting. This slide showcase the performance data of email marketing implemented by a organization in a dashboard report.It include statistics of email sent,delivered,open rate,click rate,unsubscribe rate,bounce rate etc.
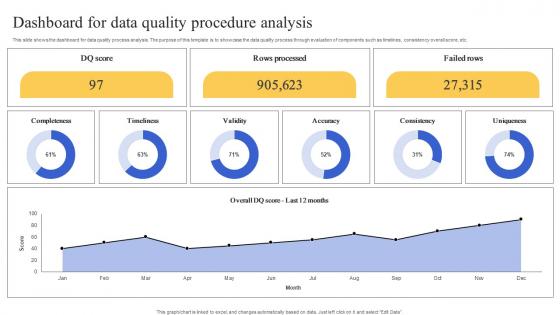
Dashboard For Data Quality Procedure Analysis Demonstration Pdf
This slide shows the dashboard for data quality process analysis. The purpose of this template is to showcase the data quality process through evaluation of components such as timelines, consistency overall score, etc. Showcasing this set of slides titled Dashboard For Data Quality Procedure Analysis Demonstration Pdf. The topics addressed in these templates are Dashboard For Data Quality, Procedure Analysis, Timelines. All the content presented in this PPT design is completely editable. Download it and make adjustments in color, background, font etc. as per your unique business setting. This slide shows the dashboard for data quality process analysis. The purpose of this template is to showcase the data quality process through evaluation of components such as timelines, consistency overall score, etc.
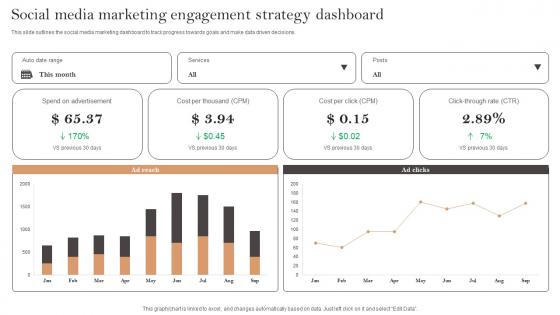
Social Media Marketing Engagement Strategy Dashboard Ppt Professional Sample Pdf
This slide outlines the social media marketing dashboard to track progress towards goals and make data driven decisions. Showcasing this set of slides titled Social Media Marketing Engagement Strategy Dashboard Ppt Professional Sample Pdf. The topics addressed in these templates are Cost Per Thousand, Cost Per Click, Spend On Advertisement. All the content presented in this PPT design is completely editable. Download it and make adjustments in color, background, font etc. as per your unique business setting. This slide outlines the social media marketing dashboard to track progress towards goals and make data driven decisions.
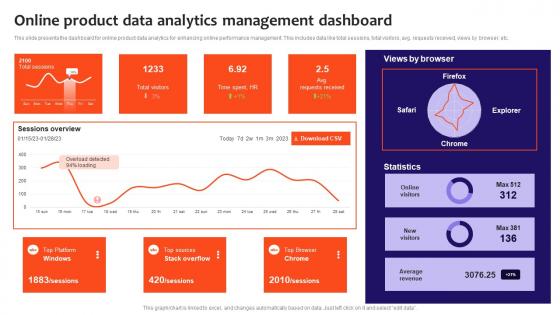
Online Product Data Analytics Management Dashboard Information Pdf
This slide presents the dashboard for online product data analytics for enhancing online performance management. This includes data like total sessions, total visitors, avg. requests received, views by browser, etc. Showcasing this set of slides titled Online Product Data Analytics Management Dashboard Information Pdf. The topics addressed in these templates are Online Product Data Analytics, Management Dashboard. All the content presented in this PPT design is completely editable. Download it and make adjustments in color, background, font etc. as per your unique business setting. This slide presents the dashboard for online product data analytics for enhancing online performance management. This includes data like total sessions, total visitors, avg. requests received, views by browser, etc.

KPI Dashboard For Estimating Monthly Cash Flow Infographics Pdf
Following slide demonstrates KPI dashboard to forecast monthly business money flow for cash flow management planning. It includes components such as projected profit before tax, net operating cash flow, net financial cash flow, net investing cash flow, etc. Showcasing this set of slides titled KPI Dashboard For Estimating Monthly Cash Flow Infographics Pdf. The topics addressed in these templates are KPI Dashboard, Estimating Monthly Cash Flow, Net Financial Cash Flow. All the content presented in this PPT design is completely editable. Download it and make adjustments in color, background, font etc. as per your unique business setting. Following slide demonstrates KPI dashboard to forecast monthly business money flow for cash flow management planning. It includes components such as projected profit before tax, net operating cash flow, net financial cash flow, net investing cash flow, etc.
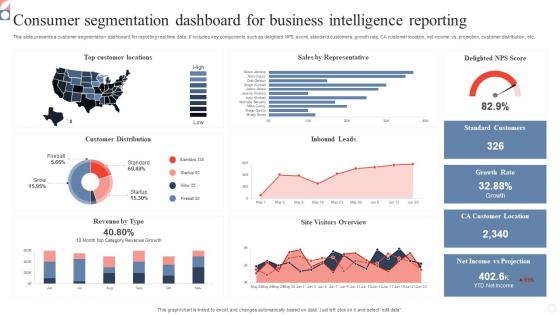
Consumer Segmentation Dashboard For Business Intelligence Reporting Topics Pdf
This slide presents a customer segmentation dashboard for reporting real time data. It includes key components such as delighted NPS score, standard customers, growth rate, CA customer location, net income vs. projection, customer distribution, etc. Pitch your topic with ease and precision using this Consumer Segmentation Dashboard For Business Intelligence Reporting Topics Pdf. This layout presents information on Consumer Segmentation Dashboard, Business Intelligence Reporting, Growth Rate. It is also available for immediate download and adjustment. So, changes can be made in the color, design, graphics or any other component to create a unique layout. This slide presents a customer segmentation dashboard for reporting real time data. It includes key components such as delighted NPS score, standard customers, growth rate, CA customer location, net income vs. projection, customer distribution, etc.
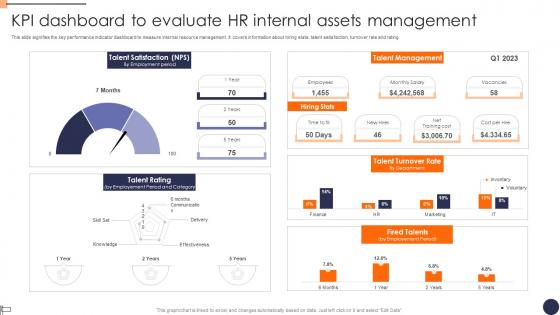
KPI Dashboard To Evaluate HR Internal Assets Management Structure Pdf
This slide signifies the key performance indicator dashboard to measure internal resource management. It covers information about hiring stats, talent satisfaction, turnover rate and rating. Showcasing this set of slides titled KPI Dashboard To Evaluate HR Internal Assets Management Structure Pdf. The topics addressed in these templates are About Hiring Stats, Talent Satisfaction, Turnover. All the content presented in this PPT design is completely editable. Download it and make adjustments in color, background, font etc. as per your unique business setting. This slide signifies the key performance indicator dashboard to measure internal resource management. It covers information about hiring stats, talent satisfaction, turnover rate and rating.
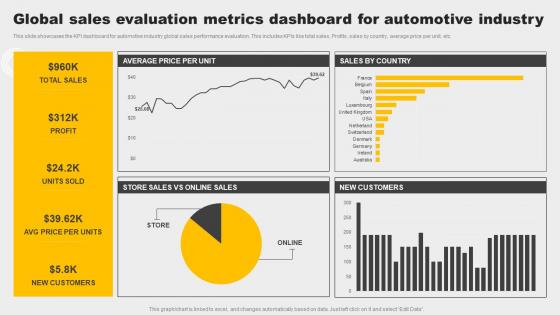
Global Sales Evaluation Metrics Dashboard For Automotive Industry Demonstration Pdf
This slide showcases the KPI dashboard for automotive industry global sales performance evaluation. This includes KPIs like total sales, Profits, sales by country, average price per unit, etc. Pitch your topic with ease and precision using this Global Sales Evaluation Metrics Dashboard For Automotive Industry Demonstration Pdf. This layout presents information on Customers, Profit, Sales. It is also available for immediate download and adjustment. So, changes can be made in the color, design, graphics or any other component to create a unique layout. This slide showcases the KPI dashboard for automotive industry global sales performance evaluation. This includes KPIs like total sales, Profits, sales by country, average price per unit, etc.
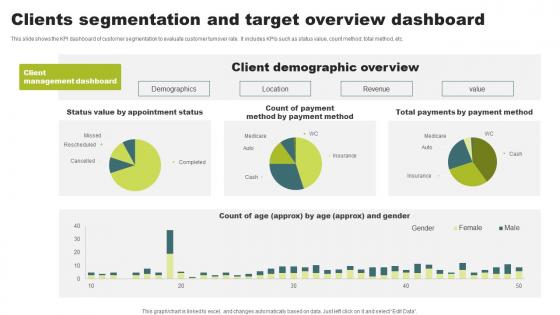
Clients Segmentation And Target Overview Dashboard Microsoft Pdf
This slide shows the KPI dashboard of customer segmentation to evaluate customer turnover rate. It includes KPIs such as status value, count method, total method, etc. Showcasing this set of slides titled Clients Segmentation And Target Overview Dashboard Microsoft Pdf. The topics addressed in these templates are Client Demographic Overview, Revenue, Location. All the content presented in this PPT design is completely editable. Download it and make adjustments in color, background, font etc. as per your unique business setting. This slide shows the KPI dashboard of customer segmentation to evaluate customer turnover rate. It includes KPIs such as status value, count method, total method, etc.
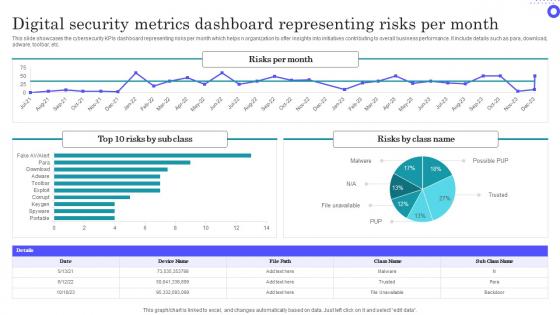
Digital Security Metrics Dashboard Representing Risks Per Month Themes Pdf
Showcasing this set of slides titled Digital Security Metrics Dashboard Representing Risks Per Month Themes Pdf The topics addressed in these templates are Digital Security, Metrics Dashboard, Representing Risks All the content presented in this PPT design is completely editable. Download it and make adjustments in color, background, font etc. as per your unique business setting. This slide showcases the cybersecurity KPIs dashboard representing risks per month which helps n organization to offer insights into initiatives contributing to overall business performance. It include details such as para, download, adware, toolbar, etc.
Corporate Branding Performance Tracking Dashboard Leveraging Corporate Rules Pdf
This slide provides information regarding corporate branding performance tracking dashboard in terms of leads, conversion metrics, web traffic, etc. If your project calls for a presentation, then Slidegeeks is your go-to partner because we have professionally designed, easy-to-edit templates that are perfect for any presentation. After downloading, you can easily edit Corporate Branding Performance Tracking Dashboard Leveraging Corporate Rules Pdf and make the changes accordingly. You can rearrange slides or fill them with different images. Check out all the handy templates This slide provides information regarding corporate branding performance tracking dashboard in terms of leads, conversion metrics, web traffic, etc.
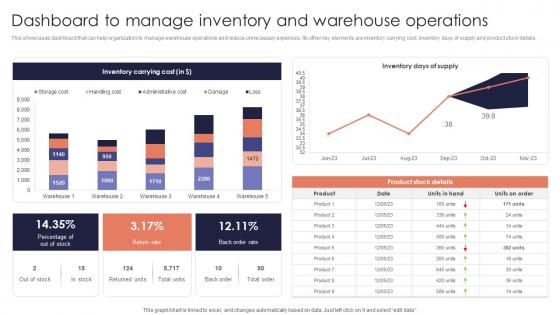
Dashboard Manage Inventory Minimizing Inventory Wastage Through Warehouse Microsoft Pdf
This showcases dashboard that can help organization to manage warehouse operations and reduce unnecessary expenses. Its other key elements are inventory carrying cost, inventory days of supply and product stock details. There are so many reasons you need a Dashboard Manage Inventory Minimizing Inventory Wastage Through Warehouse Microsoft Pdf. The first reason is you can not spend time making everything from scratch, Thus, Slidegeeks has made presentation templates for you too. You can easily download these templates from our website easily. This showcases dashboard that can help organization to manage warehouse operations and reduce unnecessary expenses. Its other key elements are inventory carrying cost, inventory days of supply and product stock details.
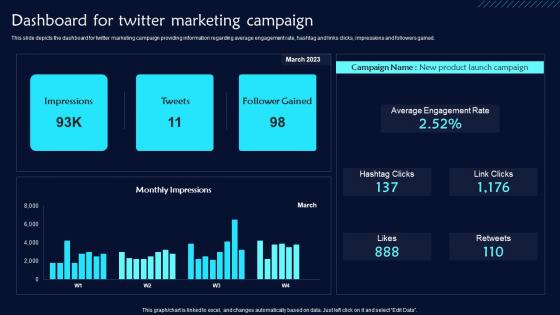
Dashboard For Twitter Marketing Campaign Twitter Promotional Techniques Formats Pdf
This slide depicts the dashboard for twitter marketing campaign providing information regarding average engagement rate, hashtag and links clicks, impressions and followers gained. From laying roadmaps to briefing everything in detail, our templates are perfect for you. You can set the stage with your presentation slides. All you have to do is download these easy-to-edit and customizable templates. Dashboard For Twitter Marketing Campaign Twitter Promotional Techniques Formats Pdf will help you deliver an outstanding performance that everyone would remember and praise you for. Do download this presentation today. This slide depicts the dashboard for twitter marketing campaign providing information regarding average engagement rate, hashtag and links clicks, impressions and followers gained.
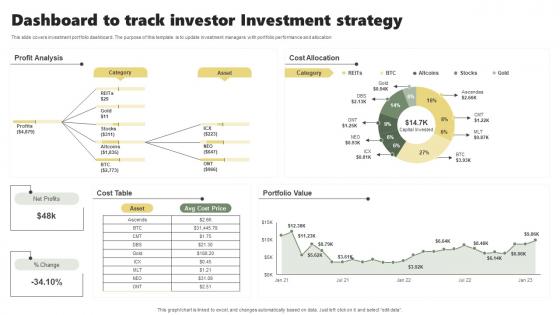
Dashboard To Track Investor Investment Strategy Sample Pdf
This slide covers investment portfolio dashboard. The purpose of this template is to update investment managers with portfolio performance and allocation Showcasing this set of slides titled Dashboard To Track Investor Investment Strategy Sample Pdf. The topics addressed in these templates are Cost Table, Portfolio Value, Cost Allocation. All the content presented in this PPT design is completely editable. Download it and make adjustments in color, background, font etc. as per your unique business setting. This slide covers investment portfolio dashboard. The purpose of this template is to update investment managers with portfolio performance and allocation
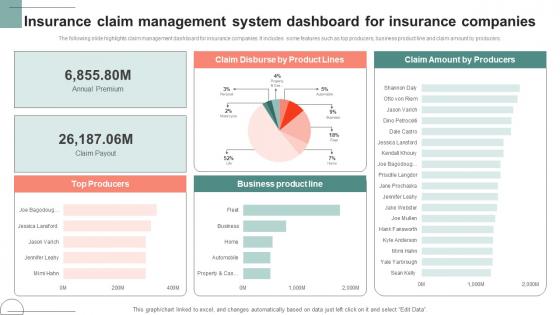
Insurance Claim Management System Dashboard For Insurance Companies Demonstration Pdf
The following slide highlights claim management dashboard for insurance companies. It includes some features such as top producers, business product line and claim amount by producers. Showcasing this set of slides titled Insurance Claim Management System Dashboard For Insurance Companies Demonstration Pdf The topics addressed in these templates are Claim Disburse, Product Lines, Business Product All the content presented in this PPT design is completely editable. Download it and make adjustments in color, background, font etc. as per your unique business setting. The following slide highlights claim management dashboard for insurance companies. It includes some features such as top producers, business product line and claim amount by producers.
Employees Learning And Improvement KPI Courses Dashboard Icon Introduction Pdf
Showcasing this set of slides titled Employees Learning And Improvement KPI Courses Dashboard Icon Introduction Pdf. The topics addressed in these templates are Employees Learning, Improvement KPI, Courses Dashboard Icon. All the content presented in this PPT design is completely editable. Download it and make adjustments in color, background, font etc. as per your unique business setting. Our Employees Learning And Improvement KPI Courses Dashboard Icon Introduction Pdf are topically designed to provide an attractive backdrop to any subject. Use them to look like a presentation pro.
Learning And Improvement KPI Training Dashboard Icon Graphics Pdf
Pitch your topic with ease and precision using this Learning And Improvement KPI Training Dashboard Icon Graphics Pdf. This layout presents information on Learning And Improvement KPI, Training Dashboard Icon. It is also available for immediate download and adjustment. So, changes can be made in the color, design, graphics or any other component to create a unique layout. Our Learning And Improvement KPI Training Dashboard Icon Graphics Pdf are topically designed to provide an attractive backdrop to any subject. Use them to look like a presentation pro.
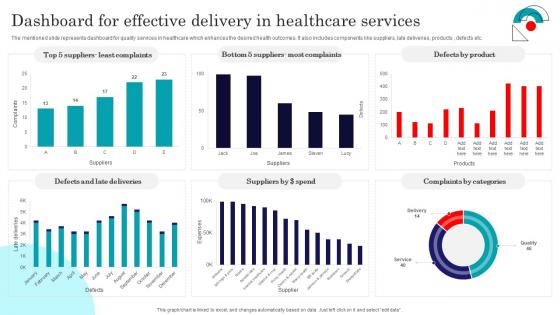
Dashboard For Effective Delivery In Healthcare Services Introduction Pdf
The mentioned slide represents dashboard for quality services in healthcare which enhances the desired health outcomes. It also includes components like suppliers, late deliveries, products , defects etc. Showcasing this set of slides titled Dashboard For Effective Delivery In Healthcare Services Introduction Pdf. The topics addressed in these templates are Late Deliveries, Complaints By Categories. All the content presented in this PPT design is completely editable. Download it and make adjustments in color, background, font etc. as per your unique business setting. The mentioned slide represents dashboard for quality services in healthcare which enhances the desired health outcomes. It also includes components like suppliers, late deliveries, products , defects etc.
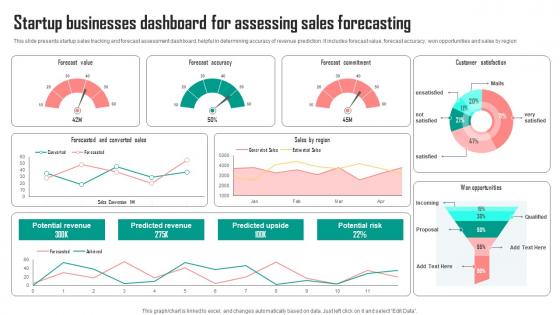
Startup Businesses Dashboard For Assessing Sales Forecasting Background Pdf
This slide presents startup sales tracking and forecast assessment dashboard, helpful in determining accuracy of revenue prediction. It includes forecast value, forecast accuracy, won opportunities and sales by region Pitch your topic with ease and precision using this Startup Businesses Dashboard For Assessing Sales Forecasting Background Pdf. This layout presents information on Forecast Value, Accuracy, Commitment. It is also available for immediate download and adjustment. So, changes can be made in the color, design, graphics or any other component to create a unique layout. This slide presents startup sales tracking and forecast assessment dashboard, helpful in determining accuracy of revenue prediction. It includes forecast value, forecast accuracy, won opportunities and sales by region
A136 Vendor Management Audit KPI Dashboard For Tracking Supplier Compliance
Mentioned slide demonstrates KPI dashboard for evaluating supplier compliance and performance. It includes key components such as total suppliers, contracts, unlisted, contact compliance rate. Find a pre-designed and impeccable A136 Vendor Management Audit KPI Dashboard For Tracking Supplier Compliance. The templates can ace your presentation without additional effort. You can download these easy-to-edit presentation templates to make your presentation stand out from others. So, what are you waiting for Download the template from Slidegeeks today and give a unique touch to your presentation. Mentioned slide demonstrates KPI dashboard for evaluating supplier compliance and performance. It includes key components such as total suppliers, contracts, unlisted, contact compliance rate.
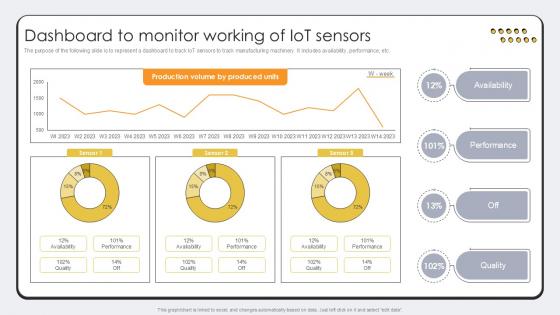
Dashboard To Monitor Working Of Revolutionizing Production IoT Ppt Presentation
The purpose of the following slide is to represent a dashboard to track IoT sensors to track manufacturing machinery. It includes availability, performance, etc. If your project calls for a presentation, then Slidegeeks is your go-to partner because we have professionally designed, easy-to-edit templates that are perfect for any presentation. After downloading, you can easily edit Dashboard To Monitor Working Of Revolutionizing Production IoT Ppt Presentation and make the changes accordingly. You can rearrange slides or fill them with different images. Check out all the handy templates The purpose of the following slide is to represent a dashboard to track IoT sensors to track manufacturing machinery. It includes availability, performance, etc.
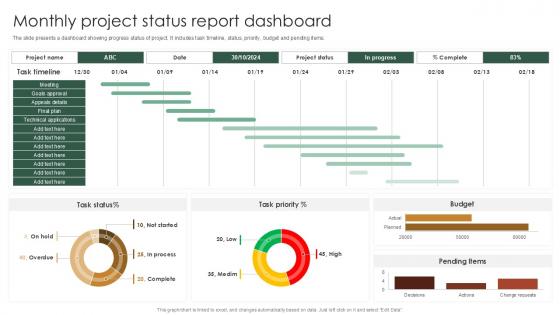
Monthly Project Status Report Dashboard PPT PowerPoint SS
The slide presents a dashboard showing progress status of project. It includes task timeline, status, priority, budget and pending items. Want to ace your presentation in front of a live audience Our Monthly Project Status Report Dashboard PPT PowerPoint SS can help you do that by engaging all the users towards you. Slidegeeks experts have put their efforts and expertise into creating these impeccable powerpoint presentations so that you can communicate your ideas clearly. Moreover, all the templates are customizable, and easy-to-edit and downloadable. Use these for both personal and commercial use. The slide presents a dashboard showing progress status of project. It includes task timeline, status, priority, budget and pending items.
Database Modeling Data Model Performance Tracking Dashboard Demonstration Pdf
This slide shows the data model performance tracking dashboard. The purpose of this slide is to represent the Information related to the change brought by data models graphically. Do you have to make sure that everyone on your team knows about any specific topic I yes, then you should give Database Modeling Data Model Performance Tracking Dashboard Demonstration Pdf a try. Our experts have put a lot of knowledge and effort into creating this impeccable Database Modeling Data Model Performance Tracking Dashboard Demonstration Pdf. You can use this template for your upcoming presentations, as the slides are perfect to represent even the tiniest detail. You can download these templates from the Slidegeeks website and these are easy to edit. So grab these today This slide shows the data model performance tracking dashboard. The purpose of this slide is to represent the Information related to the change brought by data models graphically.
Security Breach Events Tracking Dashboard Data Fortification Strengthening Defenses
This slide represents the dashboard to track data breach attacks. The purpose of this slide is to provide a graphical representation of cyber attacks that occurred in a specific period. It also depicts the overview of different types of attacks.Create an editable Security Breach Events Tracking Dashboard Data Fortification Strengthening Defenses that communicates your idea and engages your audience. Whether you are presenting a business or an educational presentation, pre-designed presentation templates help save time. Security Breach Events Tracking Dashboard Data Fortification Strengthening Defenses is highly customizable and very easy to edit, covering many different styles from creative to business presentations. Slidegeeks has creative team members who have crafted amazing templates. So, go and get them without any delay. This slide represents the dashboard to track data breach attacks. The purpose of this slide is to provide a graphical representation of cyber attacks that occurred in a specific period. It also depicts the overview of different types of attacks.
Tracking Departure Metrics For Employee Exit Interview Dashboard Portrait Pdf
This slide exhibits KPI dashboard of exit interview for visual representation and consolidated data aggregation. It include metrics such as Current employee, Forms submitted, Moving new position, etc. Showcasing this set of slides titled Tracking Departure Metrics For Employee Exit Interview Dashboard Portrait Pdf The topics addressed in these templates are Exit Interview Dashboard, Forms Submitted, Moving New Position All the content presented in this PPT design is completely editable. Download it and make adjustments in color, background, font etc. as per your unique business setting. This slide exhibits KPI dashboard of exit interview for visual representation and consolidated data aggregation. It include metrics such as Current employee, Forms submitted, Moving new position, etc.
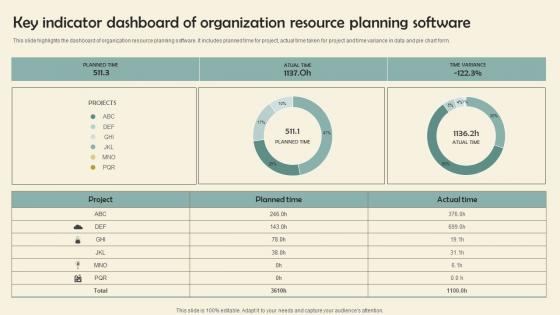
Key Indicator Dashboard Of Organization Resource Planning Software Themes Pdf
This slide highlights the dashboard of organization resource planning software. It includes planned time for project, actual time taken for project and time variance in data and pie chart form.Showcasing this set of slides titled Key Indicator Dashboard Of Organization Resource Planning Software Themes Pdf The topics addressed in these templates are Key Indicator, Dashboard Organization, Resource Planning Software All the content presented in this PPT design is completely editable. Download it and make adjustments in color, background, font etc. as per your unique business setting. This slide highlights the dashboard of organization resource planning software. It includes planned time for project, actual time taken for project and time variance in data and pie chart form.


 Continue with Email

 Home
Home


