Dashboards
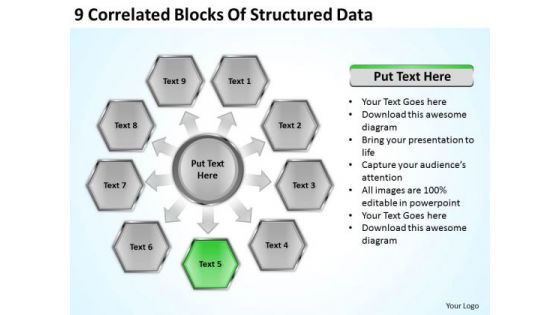
9 Correlated Blocks Of Structured Data How To Present Business Plan PowerPoint Slides
We present our 9 correlated blocks of structured data how to present business plan PowerPoint Slides.Download our Marketing PowerPoint Templates because Our PowerPoint Templates and Slides are focused like a searchlight beam. They highlight your ideas for your target audience. Use our Business PowerPoint Templates because You can Stir your ideas in the cauldron of our PowerPoint Templates and Slides. Cast a magic spell on your audience. Use our Finance PowerPoint Templates because You can Rise to the occasion with our PowerPoint Templates and Slides. You will bring your audience on their feet in no time. Present our Process and Flows PowerPoint Templates because Our PowerPoint Templates and Slides are innately eco-friendly. Their high recall value negate the need for paper handouts. Use our Arrows PowerPoint Templates because our PowerPoint Templates and Slides will give your ideas the shape.Use these PowerPoint slides for presentations relating to Diagram, Chart, Business, Background, Vector, Pie, Brown, Abstract, Wheel, Options, Board, Website, Cross, Statistics, Model, Item, Document, Media, Beehives, Red, Hive, Concept, Presentation, Template, Matt, Brochure, Orange, Guide, Description, Multicolor, Marketing, Gray, Development, Title, Management, Honeycomb, Illustration, Six, Catalog, Direction, Plans, Blue, Text, Reports, Financial, Workplace, Navigation, Parts. The prominent colors used in the PowerPoint template are Green, Gray, Black. Begin with a bang with our 9 Correlated Blocks Of Structured Data How To Present Business Plan PowerPoint Slides. Explode off the blocks with your thoughts.
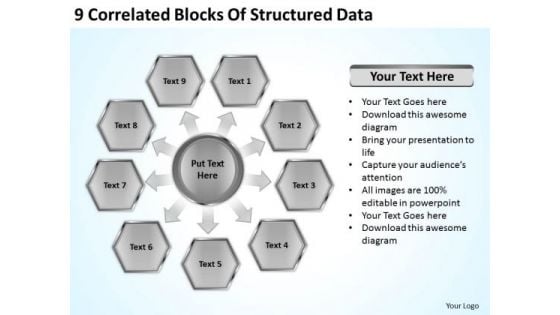
9 Correlated Blocks Of Structured Data Outline Business Plan PowerPoint Slides
We present our 9 correlated blocks of structured data outline business plan PowerPoint Slides.Download and present our Marketing PowerPoint Templates because Our PowerPoint Templates and Slides are conceived by a dedicated team. Use them and give form to your wondrous ideas. Download our Business PowerPoint Templates because Our PowerPoint Templates and Slides will provide weight to your words. They will bring out the depth of your thought process. Download our Finance PowerPoint Templates because Our PowerPoint Templates and Slides are Clear and concise. Use them and dispel any doubts your team may have. Present our Process and Flows PowerPoint Templates because It will mark the footprints of your journey. Illustrate how they will lead you to your desired destination. Download and present our Arrows PowerPoint Templates because Our PowerPoint Templates and Slides will fulfill your every need. Use them and effectively satisfy the desires of your audience.Use these PowerPoint slides for presentations relating to Diagram, Chart, Business, Background, Vector, Pie, Brown, Abstract, Wheel, Options, Board, Website, Cross, Statistics, Model, Item, Document, Media, Beehives, Red, Hive, Concept, Presentation, Template, Matt, Brochure, Orange, Guide, Description, Multicolor, Marketing, Gray, Development, Title, Management, Honeycomb, Illustration, Six, Catalog, Direction, Plans, Blue, Text, Reports, Financial, Workplace, Navigation, Parts. The prominent colors used in the PowerPoint template are White, Gray, Black. Our 9 Correlated Blocks Of Structured Data Outline Business Plan PowerPoint Slides have amazing characteristics. They educate and entertain on your command.
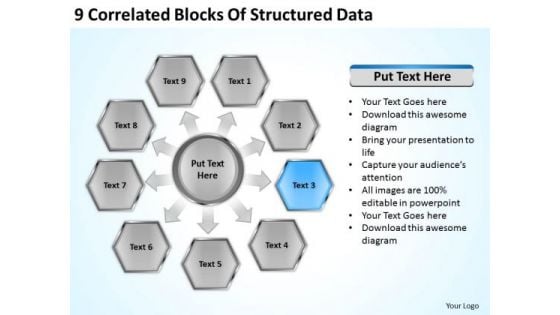
9 Correlated Blocks Of Structured Data Ppt Business Plan PowerPoint Slides
We present our 9 correlated blocks of structured data ppt business plan PowerPoint Slides.Download our Marketing PowerPoint Templates because You aspire to touch the sky with glory. Let our PowerPoint Templates and Slides provide the fuel for your ascent. Download our Business PowerPoint Templates because our PowerPoint Templates and Slides will give your ideas the shape. Download our Finance PowerPoint Templates because Our PowerPoint Templates and Slides offer you the widest possible range of options. Present our Process and Flows PowerPoint Templates because our PowerPoint Templates and Slides will give your ideas the shape. Download our Arrows PowerPoint Templates because you can Break through with our PowerPoint Templates and Slides. Bring down the mental barriers of your audience.Use these PowerPoint slides for presentations relating to Diagram, Chart, Business, Background, Vector, Pie, Brown, Abstract, Wheel, Options, Board, Website, Cross, Statistics, Model, Item, Document, Media, Beehives, Red, Hive, Concept, Presentation, Template, Matt, Brochure, Orange, Guide, Description, Multicolor, Marketing, Gray, Development, Title, Management, Honeycomb, Illustration, Six, Catalog, Direction, Plans, Blue, Text, Reports, Financial, Workplace, Navigation, Parts. The prominent colors used in the PowerPoint template are Blue, Gray, Black. Get rid of the fat with our 9 Correlated Blocks Of Structured Data Ppt Business Plan PowerPoint Slides. Get to the meat with your thoughts.
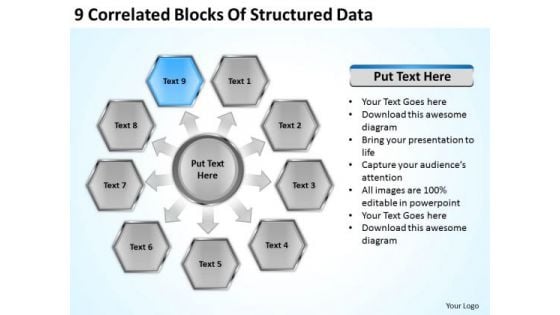
9 Correlated Blocks Of Structured Data Ppt Business Plan PowerPoint Templates
We present our 9 correlated blocks of structured data ppt business plan PowerPoint templates.Use our Marketing PowerPoint Templates because Our PowerPoint Templates and Slides provide you with a vast range of viable options. Select the appropriate ones and just fill in your text. Download our Business PowerPoint Templates because It is Aesthetically crafted by artistic young minds. Our PowerPoint Templates and Slides are designed to display your dexterity. Download and present our Finance PowerPoint Templates because Our PowerPoint Templates and Slides will definately Enhance the stature of your presentation. Adorn the beauty of your thoughts with their colourful backgrounds. Present our Process and Flows PowerPoint Templates because Our PowerPoint Templates and Slides come in all colours, shades and hues. They help highlight every nuance of your views. Download and present our Arrows PowerPoint Templates because Our PowerPoint Templates and Slides will effectively help you save your valuable time. They are readymade to fit into any presentation structure. Use these PowerPoint slides for presentations relating to Diagram, Chart, Business, Background, Vector, Pie, Brown, Abstract, Wheel, Options, Board, Website, Cross, Statistics, Model, Item, Document, Media, Beehives, Red, Hive, Concept, Presentation, Template, Matt, Brochure, Orange, Guide, Description, Multicolor, Marketing, Gray, Development, Title, Management, Honeycomb, Illustration, Six, Catalog, Direction, Plans, Blue, Text, Reports, Financial, Workplace, Navigation, Parts. The prominent colors used in the PowerPoint template are Blue, Gray, Black. Our 9 Correlated Blocks Of Structured Data Ppt Business Plan PowerPoint Templates stay away from farce. They treat every event correctly.
9 Correlated Blocks Of Structured Data Ppt Hotel Business Plan Example PowerPoint Slides
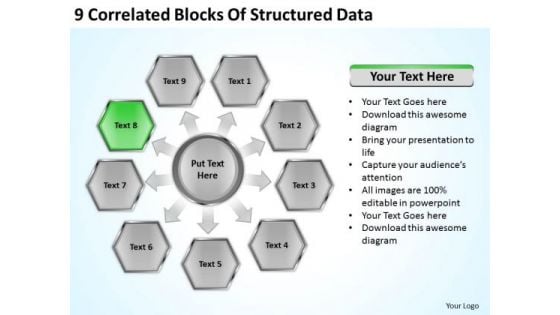
We present our 9 correlated blocks of structured data ppt hotel business plan example PowerPoint Slides.Present our Marketing PowerPoint Templates because Your ideas provide food for thought. Our PowerPoint Templates and Slides will help you create a dish to tickle the most discerning palate. Download our Business PowerPoint Templates because You can Stir your ideas in the cauldron of our PowerPoint Templates and Slides. Cast a magic spell on your audience. Present our Finance PowerPoint Templates because You can Create a matrix with our PowerPoint Templates and Slides. Feel the strength of your ideas click into place. Use our Process and Flows PowerPoint Templates because It can be used to Set your controls for the heart of the sun. Our PowerPoint Templates and Slides will be the propellant to get you there. Present our Arrows PowerPoint Templates because You canTake a leap off the starting blocks with our PowerPoint Templates and Slides. They will put you ahead of the competition in quick time.Use these PowerPoint slides for presentations relating to Diagram, Chart, Business, Background, Vector, Pie, Brown, Abstract, Wheel, Options, Board, Website, Cross, Statistics, Model, Item, Document, Media, Beehives, Red, Hive, Concept, Presentation, Template, Matt, Brochure, Orange, Guide, Description, Multicolor, Marketing, Gray, Development, Title, Management, Honeycomb, Illustration, Six, Catalog, Direction, Plans, Blue, Text, Reports, Financial, Workplace, Navigation, Parts. The prominent colors used in the PowerPoint template are Green, Gray, Black. Burst through the ceiling with our 9 Correlated Blocks Of Structured Data Ppt Hotel Business Plan Example PowerPoint Slides. Rise strongly above created barriers.
9 Correlated Blocks Of Structured Data Ppt Sales Business Plan Outline PowerPoint Templates
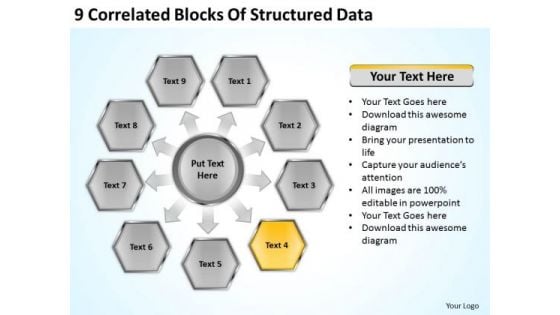
We present our 9 correlated blocks of structured data ppt sales business plan outline PowerPoint templates.Download our Marketing PowerPoint Templates because Our PowerPoint Templates and Slides will let you meet your Deadlines. Download and present our Business PowerPoint Templates because You can Hit the nail on the head with our PowerPoint Templates and Slides. Embed your ideas in the minds of your audience. Download and present our Finance PowerPoint Templates because Our PowerPoint Templates and Slides are a sure bet. Gauranteed to win against all odds. Download and present our Process and Flows PowerPoint Templates because Our PowerPoint Templates and Slides will bullet point your ideas. See them fall into place one by one. Use our Arrows PowerPoint Templates because Our PowerPoint Templates and Slides will let your ideas bloom. Create a bed of roses for your audience.Use these PowerPoint slides for presentations relating to Diagram, Chart, Business, Background, Vector, Pie, Brown, Abstract, Wheel, Options, Board, Website, Cross, Statistics, Model, Item, Document, Media, Beehives, Red, Hive, Concept, Presentation, Template, Matt, Brochure, Orange, Guide, Description, Multicolor, Marketing, Gray, Development, Title, Management, Honeycomb, Illustration, Six, Catalog, Direction, Plans, Blue, Text, Reports, Financial, Workplace, Navigation, Parts. The prominent colors used in the PowerPoint template are Yellow, Gray, Black. Color your presentation with success with our 9 Correlated Blocks Of Structured Data Ppt Sales Business Plan Outline PowerPoint Templates. You will come out on top.

Business Intelligence And Big Value Stream Data Analytics Process Download PDF
This slide shows the step by step approach of data analytics project focusing on data gathering, consolidation and data analysis to build business insights for effective decision making. Presenting business intelligence and big value stream data analytics process download pdf to provide visual cues and insights. Share and navigate important information on six stages that need your due attention. This template can be used to pitch topics like data gathering, field level analysis, data analysis and business insights, data cleaning, data consolidation. In addtion, this PPT design contains high resolution images, graphics, etc, that are easily editable and available for immediate download.
Data Analysis Project Plan Business Analysis Modification Toolkit Mockup PDF
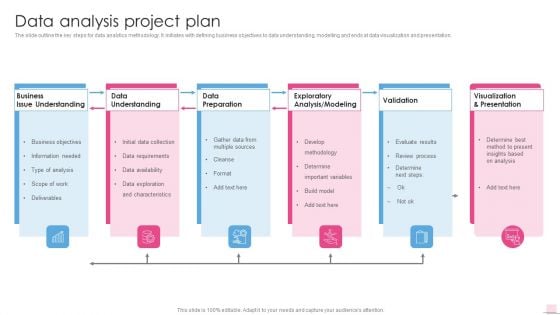
This is a Data Analysis Project Plan Business Analysis Modification Toolkit Mockup PDF template with various stages. Focus and dispense information on six stages using this creative set, that comes with editable features. It contains large content boxes to add your information on topics like Issue Understanding, Data Understanding, Data Preparation. You can also showcase facts, figures, and other relevant content using this PPT layout. Grab it now.
Bookkeeping And Finance Automation Market Trends Pictures PDF
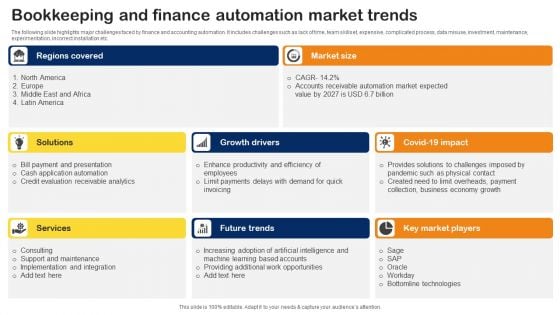
The following slide highlights major challenges faced by finance and accounting automation. It includes challenges such as lack of time, team skillset, expensive, complicated process, data misuse, investment, maintenance, experimentation, incorrect installation etc. Pitch your topic with ease and precision using this Bookkeeping And Finance Automation Market Trends Pictures PDF. This layout presents information on Growth Drivers, Key Market Players, Services. It is also available for immediate download and adjustment. So, changes can be made in the color, design, graphics or any other component to create a unique layout.
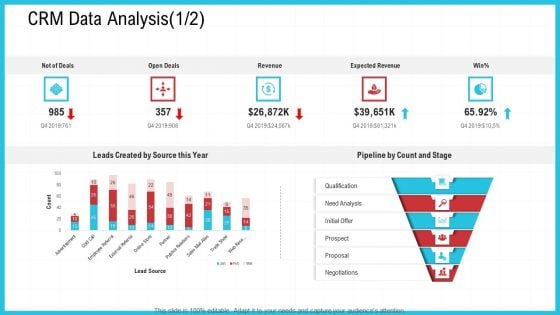
CRM Data Analysis Analysis Ppt Portfolio Inspiration PDF
Deliver and pitch your topic in the best possible manner with this crm data analysis analysis ppt portfolio inspiration pdf. Use them to share invaluable insights on revenue, source, analysis and impress your audience. This template can be altered and modified as per your expectations. So, grab it now.
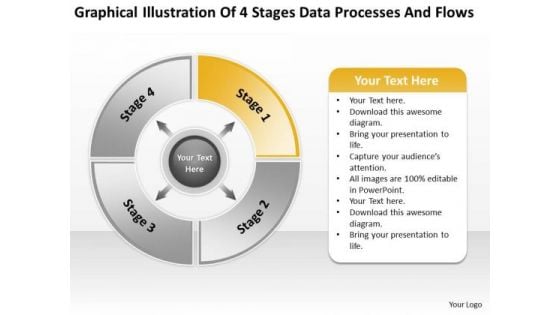
Illustration Of 4 Stages Data Processes And Flows Ppt Linear Rate PowerPoint Slides
We present our illustration of 4 stages data processes and flows ppt linear rate PowerPoint Slides.Present our Circle charts PowerPoint Templates because Our PowerPoint Templates and Slides are Clear and concise. Use them and dispel any doubts your team may have. Use our Process and Flows PowerPoint Templates because Our PowerPoint Templates and Slides will bullet point your ideas. See them fall into place one by one. Use our Business PowerPoint Templates because You should Throw the gauntlet with our PowerPoint Templates and Slides. They are created to take up any challenge. Use our Marketing PowerPoint Templates because It is Aesthetically crafted by artistic young minds. Our PowerPoint Templates and Slides are designed to display your dexterity. Use our Shapes PowerPoint Templates because Our PowerPoint Templates and Slides have the Brilliant backdrops. Guaranteed to illuminate the minds of your audience.Use these PowerPoint slides for presentations relating to Diagram , flow, process, chart, sequence, review, refresh, duplicate, concept, arrow, success, rotation, presentation, course, iterate, relate, circle, ring, recycle, report, work flow, simple, react, repeat, four, cycle, circulation, stage, connection, circular, system, strategy, round, section, direction, swirl, phase, method, procedure, correlate, cyclic, continuity, repetition. The prominent colors used in the PowerPoint template are Orange, Gray, Black. They consider you their father figure. Deliver on their expectations with our Illustration Of 4 Stages Data Processes And Flows Ppt Linear Rate PowerPoint Slides.
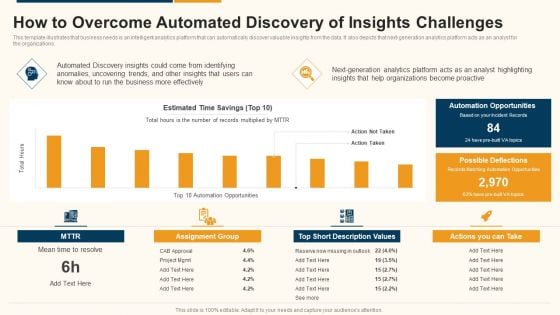
Data Interpretation And Analysis Playbook How To Overcome Automated Discovery Of Insights Challenges Rules PDF
This template illustrates that business needs is an intelligent analytics platform that can automatically discover valuable insights from the data. It also depicts that next-generation analytics platform acts as an analyst for the organizations. Deliver an awe inspiring pitch with this creative data interpretation and analysis playbook how to overcome automated discovery of insights challenges rules pdf bundle. Topics like opportunities, organizations, analytics, business can be discussed with this completely editable template. It is available for immediate download depending on the needs and requirements of the user.
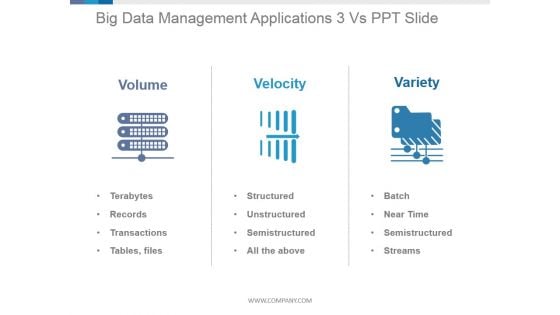
Big Data Management Applications 3 Vs Ppt PowerPoint Presentation Deck
This is a big data management applications 3 vs ppt powerpoint presentation deck. This is a three stage process. The stages in this process are volume, velocity, variety, terabytes, structured, batch.
Data Analytics For Business Operations Administration Icon Professional PDF
Presenting Data Analytics For Business Operations Administration Icon Professional PDF to dispense important information. This template comprises four stages. It also presents valuable insights into the topics including Business Operations Administration Icon, Data Analytics. This is a completely customizable PowerPoint theme that can be put to use immediately. So, download it and address the topic impactfully.
Financial Data And Analytics Expansion Icon Mockup PDF
Persuade your audience using this Financial Data And Analytics Expansion Icon Mockup PDF. This PPT design covers three stages, thus making it a great tool to use. It also caters to a variety of topics including Financial Data, Analytics, Expansion Icon. Download this PPT design now to present a convincing pitch that not only emphasizes the topic but also showcases your presentation skills.
Big Data And Analytics Framework Layers Icon Formats PDF
Presenting Big Data And Analytics Framework Layers Icon Formats PDF to dispense important information. This template comprises three stages. It also presents valuable insights into the topics including Big Data Analytics, Framework, Layers. This is a completely customizable PowerPoint theme that can be put to use immediately. So, download it and address the topic impactfully.
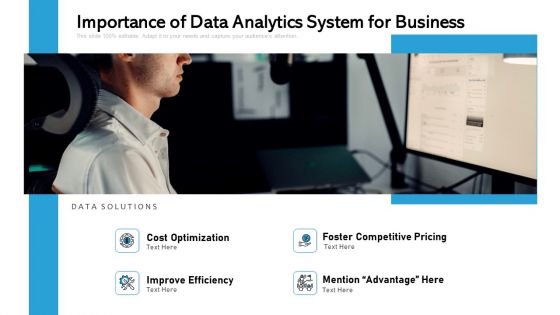
Importance Of Data Analytics System For Business Ppt PowerPoint Presentation Ideas Maker PDF
Persuade your audience using this importance of data analytics system for business ppt powerpoint presentation ideas maker pdf. This PPT design covers four stages, thus making it a great tool to use. It also caters to a variety of topics including cost optimization, foster competitive pricing, improve efficiency. Download this PPT design now to present a convincing pitch that not only emphasizes the topic but also showcases your presentation skills.
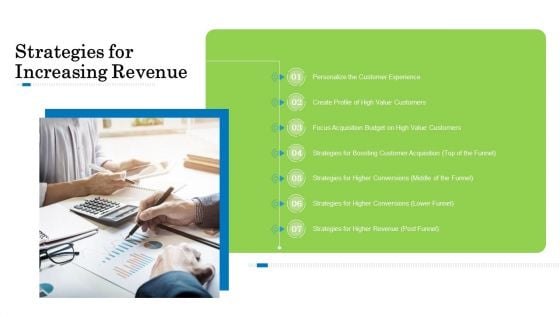
Customer Behavioral Data And Analytics Strategies For Increasing Revenue Background PDF
Presenting customer behavioral data and analytics strategies for increasing revenue background pdf to provide visual cues and insights. Share and navigate important information on seven stages that need your due attention. This template can be used to pitch topics like create profile of high value customers, personalize the customer experience, strategies for higher conversions, strategies for higher revenue, strategies for higher conversions. In addtion, this PPT design contains high resolution images, graphics, etc, that are easily editable and available for immediate download.
Table Of Contents For Predictive Analytics In The Age Of Big Data Icons PDF
If your project calls for a presentation, then Slidegeeks is your go to partner because we have professionally designed, easy to edit templates that are perfect for any presentation. After downloading, you can easily edit Table Of Contents For Predictive Analytics In The Age Of Big Data Icons PDF and make the changes accordingly. You can rearrange slides or fill them with different images. Check out all the handy templates
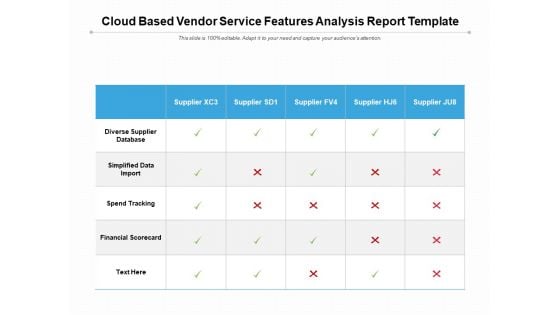
Cloud Based Vendor Service Features Analysis Report Template Ppt PowerPoint Presentation Slides Clipart Images PDF
Pitch your topic with ease and precision using this cloud based vendor service features analysis report template ppt powerpoint presentation slides clipart images pdf. This layout presents information on diverse supplier database, simplified data import, spend tracking, financial scorecard. It is also available for immediate download and adjustment. So, changes can be made in the color, design, graphics or any other component to create a unique layout.
Magnifying Glass Gears Big Data Ppt PowerPoint Presentation Layouts Templates
Presenting this set of slides with name magnifying glass gears big data ppt powerpoint presentation layouts templates. This is a three stage process. The stages in this process are technology, marketing, planning, business, management. This is a completely editable PowerPoint presentation and is available for immediate download. Download now and impress your audience.
Magnifying Glass Big Data Ppt PowerPoint Presentation Icon Background
Presenting this set of slides with name magnifying glass big data ppt powerpoint presentation icon background. This is a one stage process. The stages in this process are magnifying glass, research, marketing, strategy, business. This is a completely editable PowerPoint presentation and is available for immediate download. Download now and impress your audience.

Activity Generated Data Server Ppt PowerPoint Presentation Model Mockup
Presenting this set of slides with name activity generated data server ppt powerpoint presentation model mockup. This is a three stage process. The stages in this process are technology, marketing, planning, business, management. This is a completely editable PowerPoint presentation and is available for immediate download. Download now and impress your audience.
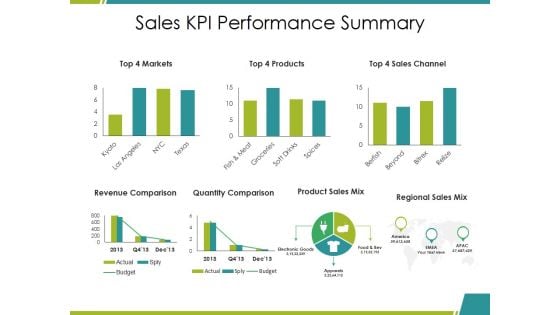
Sales Kpi Performance Summary Ppt PowerPoint Presentation Infographic Template Elements
This is a sales kpi performance summary ppt powerpoint presentation infographic template elements. This is a seven stage process. The stages in this process are revenue comparison, quantity comparison, product sales mix, regional sales mix, budget.
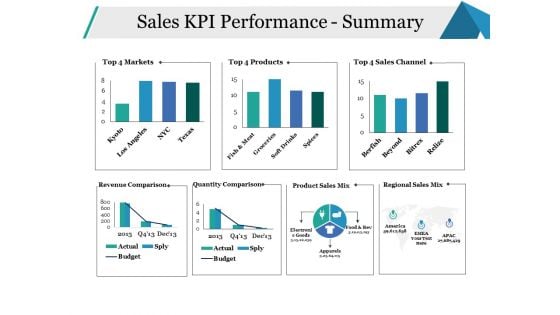
Sales KPI Performance Summary Ppt PowerPoint Presentation Infographics Model
This is a sales kpi performance summary ppt powerpoint presentation infographics model. This is a seven stage process. The stages in this process are sales channel, revenue comparison, quantity comparison, business, marketing.
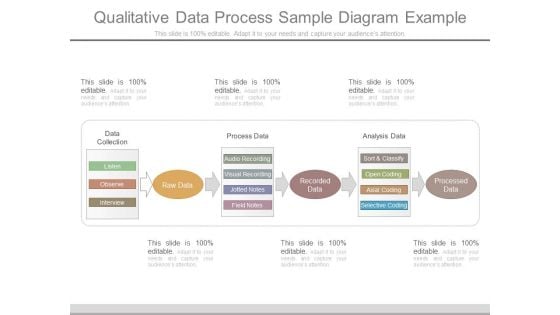
Qualitative Data Process Sample Diagram Example
This is a qualitative data process sample diagram example. This is a three stage process. The stages in this process are data collection, process data, analysis data, listen, observe, interview, audio recording, visual recording, jotted notes, field notes, sort and classify, open coding, axial coding, selective coding, processed data.
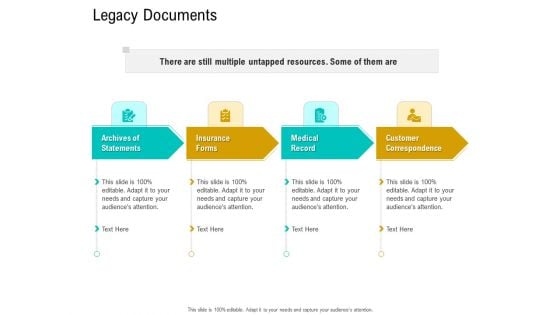
Business Data Analysis Legacy Documents Clipart PDF
Presenting business data analysis legacy documents clipart pdf to provide visual cues and insights. Share and navigate important information on four stages that need your due attention. This template can be used to pitch topics like archives of statements, insurance forms, medical record, customer correspondence, there are still multiple untapped resources. some of them are. In addtion, this PPT design contains high resolution images, graphics, etc, that are easily editable and available for immediate download.
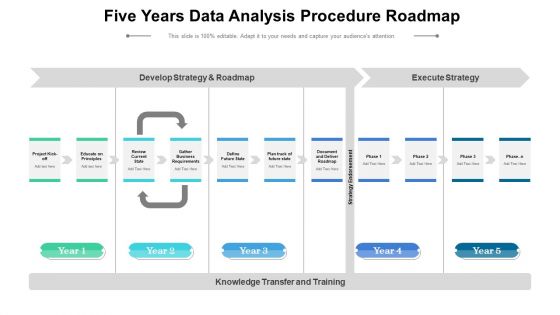
Five Years Data Analysis Procedure Roadmap Infographics
Introducing our five years data analysis procedure roadmap infographics. This PPT presentation is Google Slides compatible, therefore, you can share it easily with the collaborators for measuring the progress. Also, the presentation is available in both standard screen and widescreen aspect ratios. So edit the template design by modifying the font size, font type, color, and shapes as per your requirements. As this PPT design is fully editable it can be presented in PDF, JPG and PNG formats.
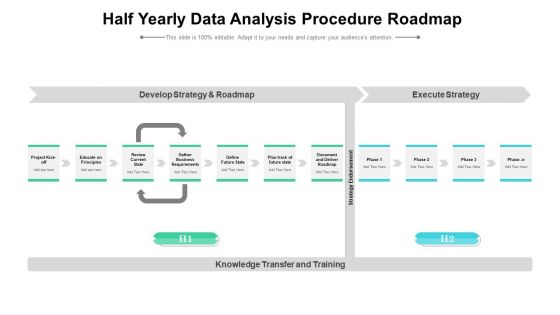
Half Yearly Data Analysis Procedure Roadmap Formats
Presenting our innovatively structured half yearly data analysis procedure roadmap formats Template. Showcase your roadmap process in different formats like PDF, PNG, and JPG by clicking the download button below. This PPT design is available in both Standard Screen and Widescreen aspect ratios. It can also be easily personalized and presented with modified font size, font type, color, and shapes to measure your progress in a clear way.
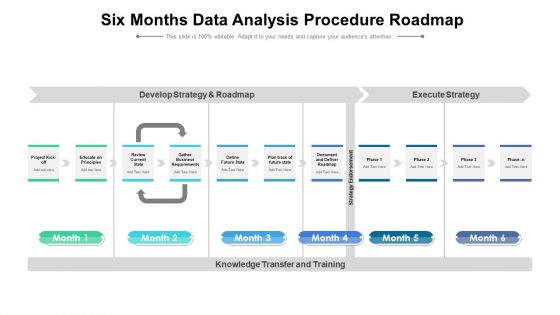
Six Months Data Analysis Procedure Roadmap Topics
Presenting our innovatively structured six months data analysis procedure roadmap topics Template. Showcase your roadmap process in different formats like PDF, PNG, and JPG by clicking the download button below. This PPT design is available in both Standard Screen and Widescreen aspect ratios. It can also be easily personalized and presented with modified font size, font type, color, and shapes to measure your progress in a clear way.
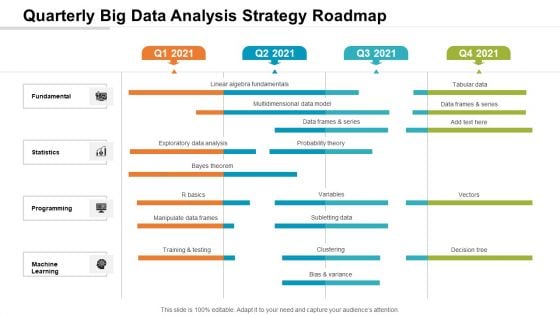
Quarterly Big Data Analysis Strategy Roadmap Infographics
Presenting our jaw-dropping quarterly big data analysis strategy roadmap infographics. You can alternate the color, font size, font type, and shapes of this PPT layout according to your strategic process. This PPT presentation is compatible with Google Slides and is available in both standard screen and widescreen aspect ratios. You can also download this well-researched PowerPoint template design in different formats like PDF, JPG, and PNG. So utilize this visually-appealing design by clicking the download button given below.
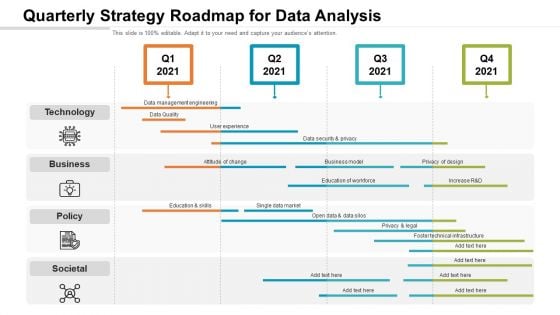
Quarterly Strategy Roadmap For Data Analysis Microsoft
Introducing our quarterly strategy roadmap for data analysis microsoft. This PPT presentation is Google Slides compatible, therefore, you can share it easily with the collaborators for measuring the progress. Also, the presentation is available in both standard screen and widescreen aspect ratios. So edit the template design by modifying the font size, font type, color, and shapes as per your requirements. As this PPT design is fully editable it can be presented in PDF, JPG and PNG formats.
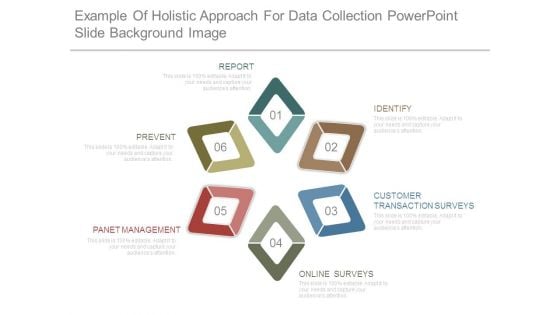
Example Of Holistic Approach For Data Collection Powerpoint Slide Background Image
This is a example of holistic approach for data collection powerpoint slide background image. This is a eight stage process. The stages in this process are report, prevent, panet management, identify, customer transaction surveys, online surveys.
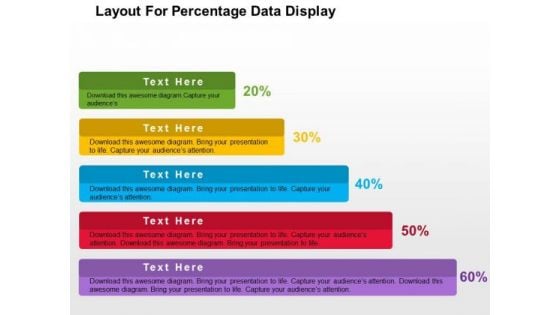
Layout For Precentage Data Display PowerPoint Template
Growth analysis for business can be defined with this business diagram. This slide depicts text boxes in increasing flow. Present your views using this innovative slide and be assured of leaving a lasting impression
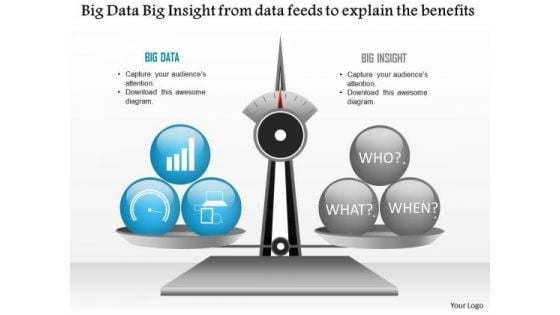
Business Diagram Big Data Big Insight From Data Feeds To Explain The Benefits Ppt Slide
Explain the benefits of big data analysis and data feeds with this technology diagram. This slide contains the graphic of scale with big data and big insight. Use this slide your data information and measurement related presentations.
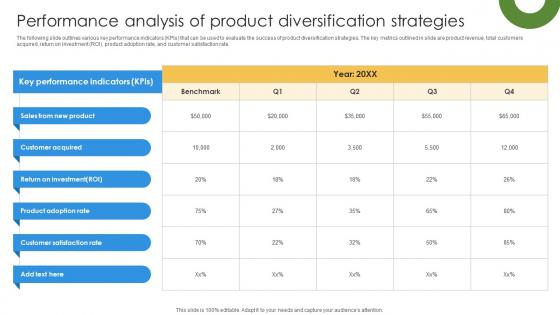
Marketing Growth Strategy To Strengthen Performance Analysis Of Product Strategy SS V
The following slide outlines various key performance indicators KPIs that can be used to evaluate the success of product diversification strategies. The key metrics outlined in slide are product revenue, total customers acquired, return on investment ROI, product adoption rate, and customer satisfaction rate. If you are looking for a format to display your unique thoughts, then the professionally designed Marketing Growth Strategy To Strengthen Performance Analysis Of Product Strategy SS V is the one for you. You can use it as a Google Slides template or a PowerPoint template. Incorporate impressive visuals, symbols, images, and other charts. Modify or reorganize the text boxes as you desire. Experiment with shade schemes and font pairings. Alter, share or cooperate with other people on your work. Download Marketing Growth Strategy To Strengthen Performance Analysis Of Product Strategy SS V and find out how to give a successful presentation. Present a perfect display to your team and make your presentation unforgettable. The following slide outlines various key performance indicators KPIs that can be used to evaluate the success of product diversification strategies. The key metrics outlined in slide are product revenue, total customers acquired, return on investment ROI, product adoption rate, and customer satisfaction rate.

Key Performance Indicators Company Ppt PowerPoint Presentation Slides Model
This is a key performance indicators company ppt powerpoint presentation slides model. This is a three stage process. The stages in this process are key performance indicators company.
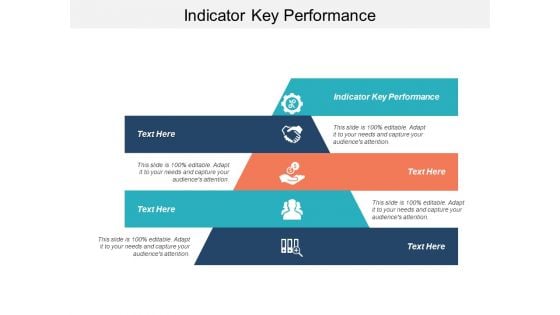
Indicator Key Performance Ppt PowerPoint Presentation Inspiration Mockup
This is a indicator key performance ppt powerpoint presentation inspiration mockup. This is a five stage process. The stages in this process are indicator key performance.
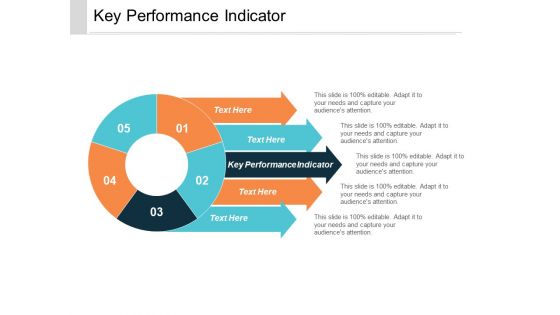
Key Performance Indicator Ppt PowerPoint Presentation Professional Templates Cpb
This is a key performance indicator ppt powerpoint presentation professional templates cpb. This is a five stage process. The stages in this process are key performance indicator.
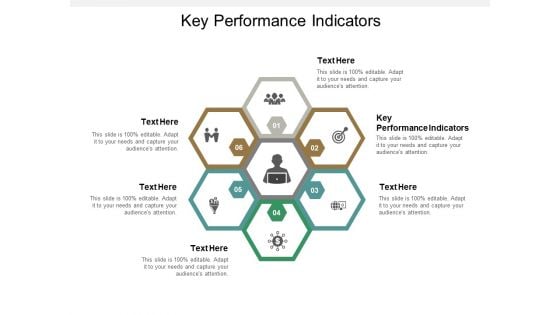
Key Performance Indicators Ppt PowerPoint Presentation Model Format Cpb
This is a key performance indicators ppt powerpoint presentation model format cpb. This is a six stage process. The stages in this process are key performance indicators.
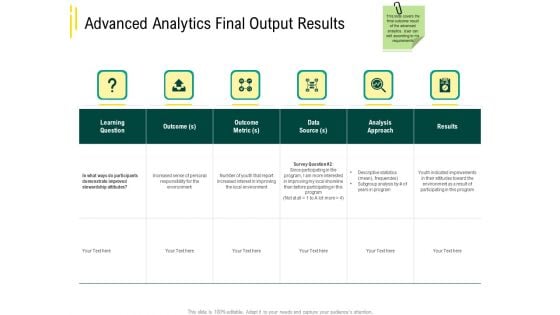
Expert Systems Advanced Analytics Final Output Results Analysis Ideas PDF
This is a expert systems advanced analytics final output results analysis ideas pdf template with various stages. Focus and dispense information on six stages using this creative set, that comes with editable features. It contains large content boxes to add your information on topics like learning question, data source, analysis approach. You can also showcase facts, figures, and other relevant content using this PPT layout. Grab it now.
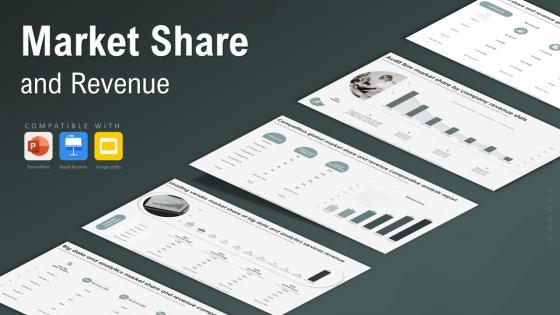
Market Share And Revenue Powerpoint Ppt
This Market Share And Revenue Powerpoint Ppt is designed to help you retain your audiences attention. This content-ready PowerPoint Template enables you to take your audience on a journey and share information in a way that is easier to recall. It helps you highlight the crucial parts of your work so that the audience does not get saddled with information download. This Market Share And Revenue From Sales, Big Data Market Share, Competitors Market Share, Unit Market And Revenue Share-slide PPT Deck comes prepared with the graphs and charts you could need to showcase your information through visuals. You only need to enter your own data in them. Download this editable PowerPoint Theme and walk into that meeting with confidence. The Market Share and Revenue PowerPoint PPT is a dynamic presentation template designed to analyze and showcase a companys market performance. It features visually appealing slides covering market share trends, revenue growth comparisons, and competitive analysis. This template includes charts, graphs, and infographics to clearly communicate key metrics and business insights. Ideal for business analysts, marketing professionals, and executives, it enables users to highlight strategic achievements, performance benchmarks, and growth opportunities effectively.

Components Of Edge Analytics In Iot Architecture Professional Pdf
This slide covers the components of edge analytics in the IoT edge architecture. This template aims to highlight the key components involved in edge analytics and roles in enabling real time data analysis at the edge. It includes sensors, actuators, smart devices, smart gateways, and edge analytics software.Pitch your topic with ease and precision using this Components Of Edge Analytics In Iot Architecture Professional Pdf This layout presents information on Smart Gateways, Smart Devices, Analytics Software It is also available for immediate download and adjustment. So, changes can be made in the color, design, graphics or any other component to create a unique layout. This slide covers the components of edge analytics in the IoT edge architecture. This template aims to highlight the key components involved in edge analytics and roles in enabling real time data analysis at the edge. It includes sensors, actuators, smart devices, smart gateways, and edge analytics software.
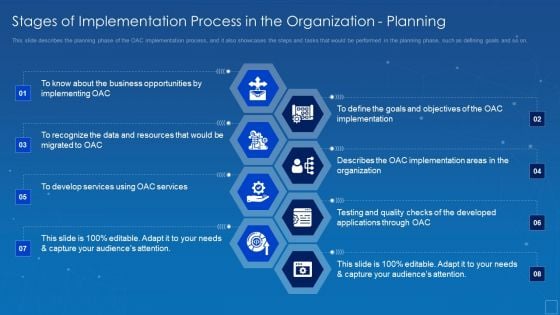
Oracle Cloud Data Analytics Administration IT Stages Of Implementation Planning Demonstration PDF
This slide describes the planning phase of the OAC implementation process, and it also showcases the steps and tasks that would be performed in the planning phase, such as defining goals and so on. This is a oracle cloud data analytics administration it stages of implementation planning demonstration pdf template with various stages. Focus and dispense information on eight stages using this creative set, that comes with editable features. It contains large content boxes to add your information on topics like business, opportunities, implementing, resources, recognize. You can also showcase facts, figures, and other relevant content using this PPT layout. Grab it now.
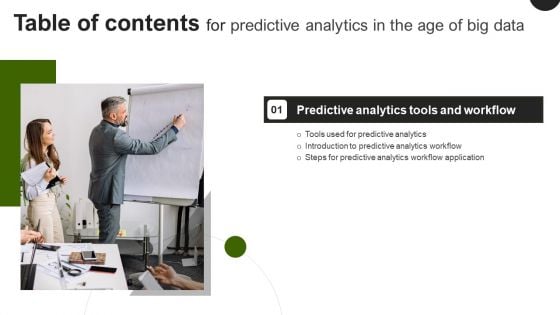
Predictive Analytics In The Age Of Big Data Table Of Contents Background PDF
Slidegeeks is one of the best resources for PowerPoint templates. You can download easily and regulate Predictive Analytics In The Age Of Big Data Table Of Contents Background PDF for your personal presentations from our wonderful collection. A few clicks is all it takes to discover and get the most relevant and appropriate templates. Use our Templates to add a unique zing and appeal to your presentation and meetings. All the slides are easy to edit and you can use them even for advertisement purposes.
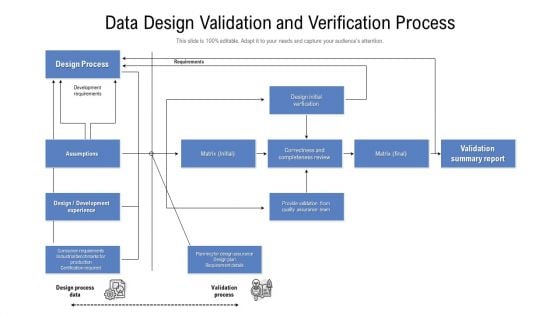
Data Design Validation And Verification Process Ppt PowerPoint Presentation Styles Show PDF
Showcasing this set of slides titled data design validation and verification process ppt powerpoint presentation styles show pdf. The topics addressed in these templates are design process, correctness and completeness review, validation summary report. All the content presented in this PPT design is completely editable. Download it and make adjustments in color, background, font etc. as per your unique business setting.
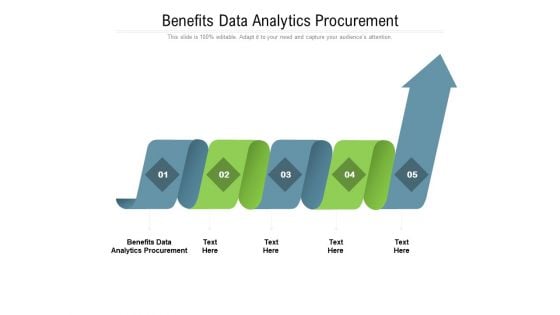
Benefits Data Analytics Procurement Ppt PowerPoint Presentation Introduction Cpb Pdf
Presenting this set of slides with name benefits data analytics procurement ppt powerpoint presentation introduction cpb pdf. This is an editable Powerpoint five stages graphic that deals with topics like benefits data analytics procurement to help convey your message better graphically. This product is a premium product available for immediate download and is 100 percent editable in Powerpoint. Download this now and use it in your presentations to impress your audience.
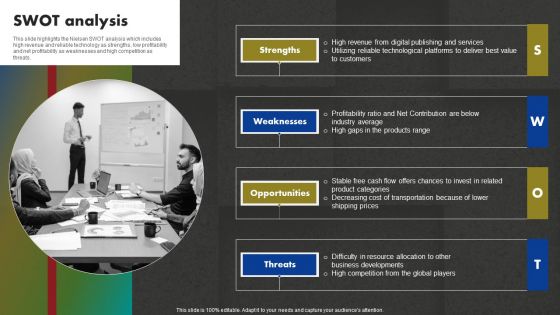
Data And Customer Analysis Company Outline SWOT Analysis Mockup PDF
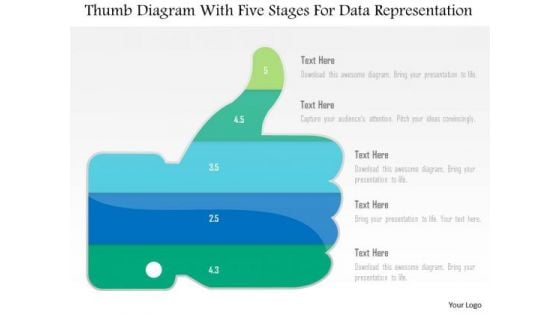
Business Diagram Thumb Diagram With Five Stages For Data Representation PowerPoint Slide
This business diagram displays thumb up with five stages. This diagram contains text boxes for data representation. Use this diagram to display business process workflows in any presentations.
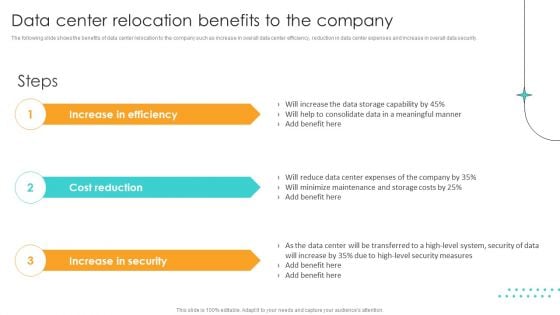
Cost Saving Benefits Of Implementing Data Center Data Center Relocation Benefits To The Company Designs PDF
The following slide shows the benefits of data center relocation to the company such as increase in overall data center efficiency, reduction in data center expenses and increase in overall data security. Are you in need of a template that can accommodate all of your creative concepts This one is crafted professionally and can be altered to fit any style. Use it with Google Slides or PowerPoint. Include striking photographs, symbols, depictions, and other visuals. Fill, move around, or remove text boxes as desired. Test out color palettes and font mixtures. Edit and save your work, or work with colleagues. Download Cost Saving Benefits Of Implementing Data Center Data Center Relocation Benefits To The Company Designs PDF and observe how to make your presentation outstanding. Give an impeccable presentation to your group and make your presentation unforgettable.

Roadmap Of Social Media Analytics Marketing Plan Cracking The Code Of Social Media
This slide represents the roadmap to implement Social Media Analytics. The key steps include your objective and goal, selecting the right tools, data analytics and interpretation, data driven decision making, etc. Boost your pitch with our creative Roadmap Of Social Media Analytics Marketing Plan Cracking The Code Of Social Media. Deliver an awe-inspiring pitch that will mesmerize everyone. Using these presentation templates you will surely catch everyones attention. You can browse the ppts collection on our website. We have researchers who are experts at creating the right content for the templates. So you do not have to invest time in any additional work. Just grab the template now and use them. This slide represents the roadmap to implement Social Media Analytics. The key steps include your objective and goal, selecting the right tools, data analytics and interpretation, data driven decision making, etc.
Graphical Representation Of Data Vector Icon Ppt PowerPoint Presentation File Design Templates PDF
Presenting this set of slides with name graphical representation of data vector icon ppt powerpoint presentation file design templates pdf. This is a three stage process. The stages in this process are graphical representation of data vector icon. This is a completely editable PowerPoint presentation and is available for immediate download. Download now and impress your audience.
Data Management Vector Icon Ppt PowerPoint Presentation File Visual Aids PDF
Presenting this set of slides with name data management vector icon ppt powerpoint presentation file visual aids pdf. This is a three stage process. The stages in this process are data management vector icon. This is a completely editable PowerPoint presentation and is available for immediate download. Download now and impress your audience.
Audit Officer Icon For Performing Data Quality Investigation Ppt PowerPoint Presentation File Templates PDF
Presenting this set of slides with name audit officer icon for performing data quality investigation ppt powerpoint presentation file templates pdf. This is a three stage process. The stages in this process are audit officer icon for performing data quality investigation. This is a completely editable PowerPoint presentation and is available for immediate download. Download now and impress your audience.
Meta Data Inventory Management Vector Icon Ppt PowerPoint Presentation Layouts Designs Download PDF
Presenting meta data inventory management vector icon ppt powerpoint presentation layouts designs download pdf to dispense important information. This template comprises three stages. It also presents valuable insights into the topics including meta data inventory management vector icon. This is a completely customizable PowerPoint theme that can be put to use immediately. So, download it and address the topic impactfully.
IT Management Plan With Data Governance Icon Ppt Styles Design Templates PDF
Presenting it management plan with data governance icon ppt styles design templates pdf to dispense important information. This template comprises three stages. It also presents valuable insights into the topics including it management plan with data governance icon. This is a completely customizable PowerPoint theme that can be put to use immediately. So, download it and address the topic impactfully.
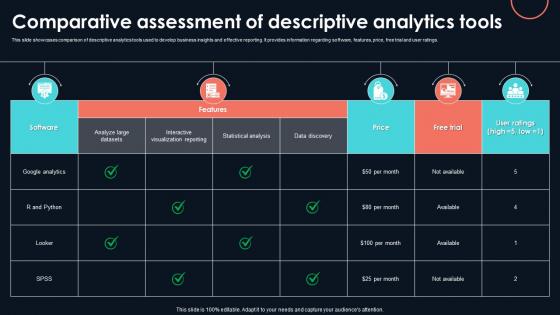
Comparative Assessment Of Descriptive Developing Strategic Insights Using Big Data Analytics SS V
This slide showcases comparison of descriptive analytics tools used to develop business insights and effective reporting. It provides information regarding software, features, price, free trial and user ratings. This modern and well-arranged Comparative Assessment Of Descriptive Developing Strategic Insights Using Big Data Analytics SS V provides lots of creative possibilities. It is very simple to customize and edit with the Powerpoint Software. Just drag and drop your pictures into the shapes. All facets of this template can be edited with Powerpoint, no extra software is necessary. Add your own material, put your images in the places assigned for them, adjust the colors, and then you can show your slides to the world, with an animated slide included. This slide showcases comparison of descriptive analytics tools used to develop business insights and effective reporting. It provides information regarding software, features, price, free trial and user ratings.
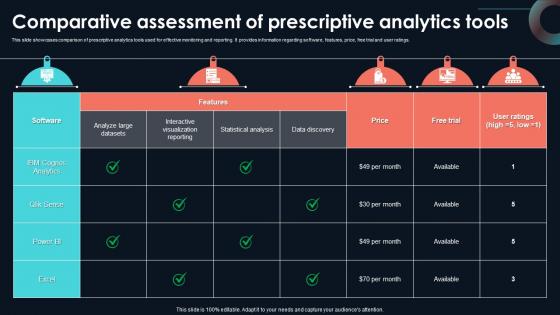
Comparative Assessment Of Prescriptive Developing Strategic Insights Using Big Data Analytics SS V
This slide showcases comparison of prescriptive analytics tools used for effective monitoring and reporting. It provides information regarding software, features, price, free trial and user ratings. Welcome to our selection of the Comparative Assessment Of Prescriptive Developing Strategic Insights Using Big Data Analytics SS V. These are designed to help you showcase your creativity and bring your sphere to life. Planning and Innovation are essential for any business that is just starting out. This collection contains the designs that you need for your everyday presentations. All of our PowerPoints are 100Percent editable, so you can customize them to suit your needs. This multi-purpose template can be used in various situations. Grab these presentation templates today. This slide showcases comparison of prescriptive analytics tools used for effective monitoring and reporting. It provides information regarding software, features, price, free trial and user ratings.
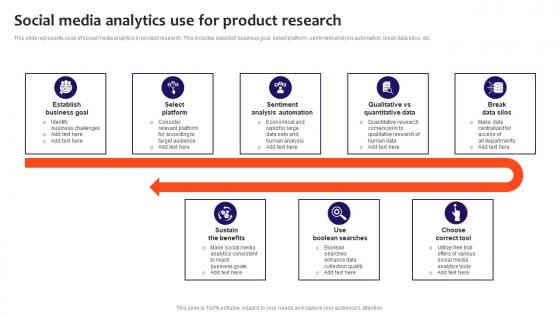
Social Media Analytics Use For Product Research Clipart Pdf
This slide represents uses of social media analytics in product research. This includes establish business goal, select platform, sentiment analysis automation, break data silos, etc. Showcasing this set of slides titled Social Media Analytics Use For Product Research Clipart Pdf. The topics addressed in these templates are Establish Business Goal, Sentiment Analysis Automation, Sustain The Benefits. All the content presented in this PPT design is completely editable. Download it and make adjustments in color, background, font etc. as per your unique business setting. This slide represents uses of social media analytics in product research. This includes establish business goal, select platform, sentiment analysis automation, break data silos, etc.
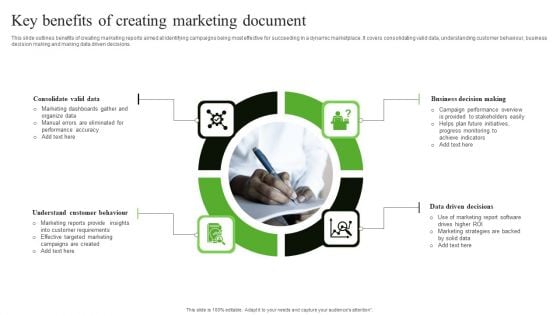
Key Benefits Of Creating Marketing Document Infographics PDF
This slide outlines benefits of creating marketing reports aimed at identifying campaigns being most effective for succeeding in a dynamic marketplace. It covers consolidating valid data, understanding customer behaviour, business decision making and making data driven decisions. Presenting Key Benefits Of Creating Marketing Document Infographics PDF to dispense important information. This template comprises four stages. It also presents valuable insights into the topics including Consolidate Valid Data, Understand Customer Behaviour, Business Decision Making. This is a completely customizable PowerPoint theme that can be put to use immediately. So, download it and address the topic impactfully.


 Continue with Email

 Home
Home


