Dashboards
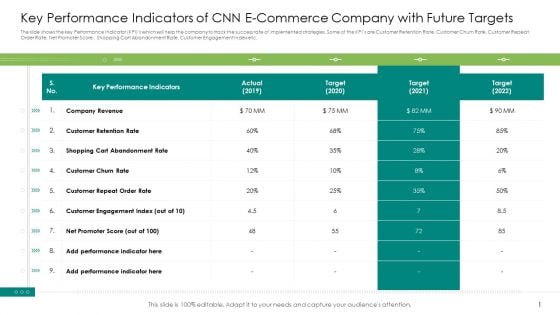
Key Performance Indicators Of CNN E Commerce Company With Future Targets Slides PDF
The slide shows the key Performance Indicator KPIs which will help the company to track the success rate of implemented strategies. Some of the KPIs are Customer Retention Rate, Customer Churn Rate, Customer Repeat Order Rate, Net Promoter Score , Shopping Cart Abandonment Rate, Customer Engagement Index etc.Deliver and pitch your topic in the best possible manner with this key performance indicators of CNN e commerce company with future targets slides pdf. Use them to share invaluable insights on shopping cart abandonment rate, customer repeat order rate and impress your audience. This template can be altered and modified as per your expectations. So, grab it now.
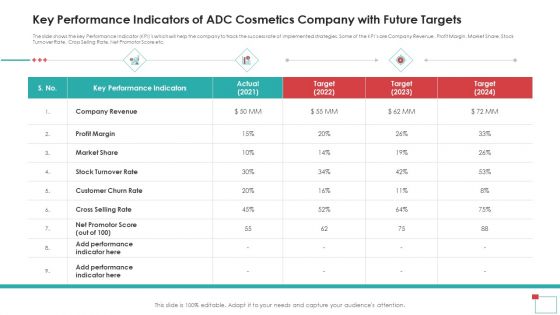
Key Performance Indicators Of ADC Cosmetics Company With Future Targets Elements PDF
The slide shows the key Performance Indicator KPIs which will help the company to track the success rate of implemented strategies. Some of the KPIs are Company Revenue , Profit Margin, Market Share, Stock Turnover Rate, Cross Selling Rate, Net Promotor Score etc. Deliver an awe-inspiring pitch with this creative key performance indicators of adc cosmetics company with future targets elements pdf bundle. Topics like company revenue, profit margin, market share, stock turnover rate, cross selling rate can be discussed with this completely editable template. It is available for immediate download depending on the needs and requirements of the user.
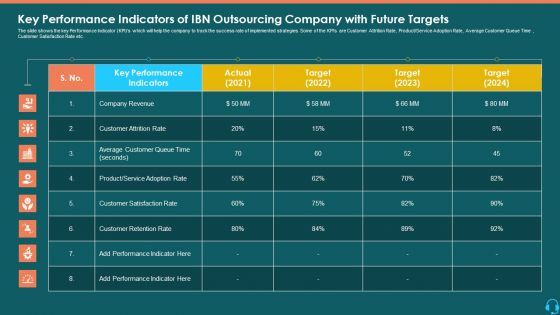
Key Performance Indicators Of IBN Outsourcing Company With Future Targets Template PDF
The slide shows the key Performance Indicator KPIs which will help the company to track the success rate of implemented strategies. Some of the KPIs are Customer Attrition Rate, Product or Service Adoption Rate, Average Customer Queue Time, Customer Satisfaction Rate etc. Deliver an awe-inspiring pitch with this creative key performance indicators of ibn outsourcing company with future targets template pdf bundle. Topics like company revenue, customer retention rate, customer satisfaction rate can be discussed with this completely editable template. It is available for immediate download depending on the needs and requirements of the user.
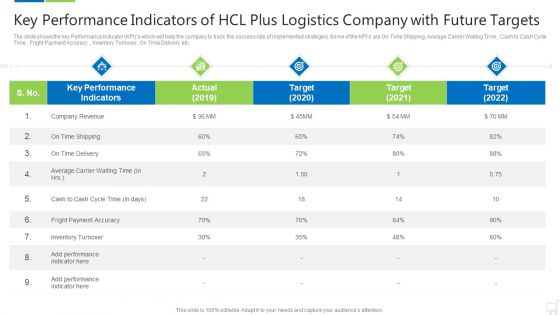
Key Performance Indicators Of Hcl Plus Logistics Company With Future Targets Brochure PDF
The slide shows the key Performance Indicator KPIs which will help the company to track the success rate of implemented strategies. Some of the KPIs are On Time Shipping, Average Carrier Waiting Time, Cash to Cash Cycle Time, Fright Payment Accuracy, Inventory Turnover, On Time Delivery etc. Deliver an awe inspiring pitch with this creative key performance indicators of hcl plus logistics company with future targets brochure pdf bundle. Topics like company revenue, average carrier waiting time, fright payment accuracy can be discussed with this completely editable template. It is available for immediate download depending on the needs and requirements of the user.
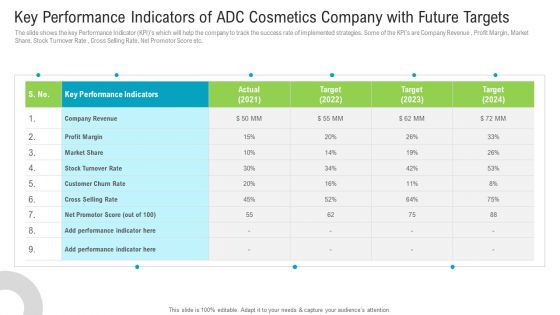
Key Performance Indicators Of ADC Cosmetics Company With Future Targets Mockup PDF
The slide shows the key Performance Indicator KPIs which will help the company to track the success rate of implemented strategies. Some of the KPIs are Company Revenue , Profit Margin, Market Share, Stock Turnover Rate, Cross Selling Rate, Net Promotor Score etc. Deliver an awe inspiring pitch with this creative key performance indicators of adc cosmetics company with future targets mockup pdf bundle. Topics like company revenue, profit margin, stock turnover rate, customer churn rate can be discussed with this completely editable template. It is available for immediate download depending on the needs and requirements of the user.
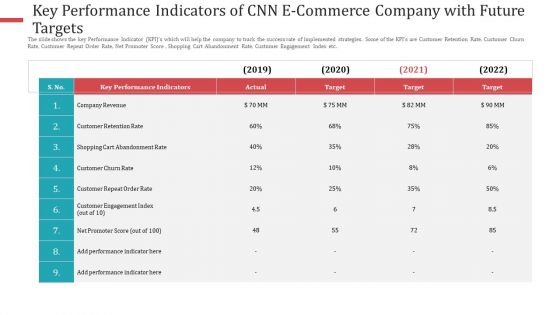
Key Performance Indicators Of CNN E Commerce Company With Future Targets Diagrams PDF
The slide shows the key Performance Indicator KPIs which will help the company to track the success rate of implemented strategies. Some of the KPIs are Customer Retention Rate, Customer Churn Rate, Customer Repeat Order Rate, Net Promoter Score , Shopping Cart Abandonment Rate, Customer Engagement Index etc.Deliver and pitch your topic in the best possible manner with this key performance indicators of CNN e commerce company with future targets diagrams pdf. Use them to share invaluable insights on customer retention rate, shopping cart abandonment rate, 2019 to 2022 and impress your audience. This template can be altered and modified as per your expectations. So, grab it now.
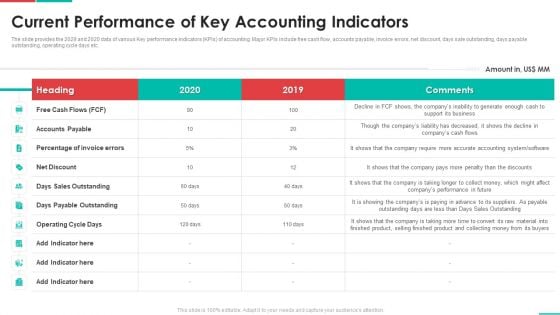
Roadmap For Financial Accounting Transformation Current Performance Of Key Accounting Indicators Elements PDF
The slide provides the 2029 and 2020 data of various Key performance indicators KPIs of accounting. Major KPIs include free cash flow, accounts payable, invoice errors, net discount, days sale outstanding, days payable outstanding, operating cycle days etc. Deliver an awe inspiring pitch with this creative roadmap for financial accounting transformation current performance of key accounting indicators elements pdf bundle. Topics like accounts payable, operating cycle days, days payable outstanding, net discount can be discussed with this completely editable template. It is available for immediate download depending on the needs and requirements of the user.
Initiatives To Produce Effective Concept For Logistic Firm Key Performance Indicators Icons PDF
The slide shows the key Performance Indicator KPIs which will help the company to track the success rate of implemented strategies. Some of the KPIs are On Time Shipping, Average Carrier Waiting Time , Cash to Cash Cycle Time , Fright Payment Accuracy , Inventory Turnover, On Time Delivery etc. Deliver an awe inspiring pitch with this creative initiatives to produce effective concept for logistic firm key performance indicators icons pdf bundle. Topics like payment, inventory turnover, revenue, target can be discussed with this completely editable template. It is available for immediate download depending on the needs and requirements of the user.
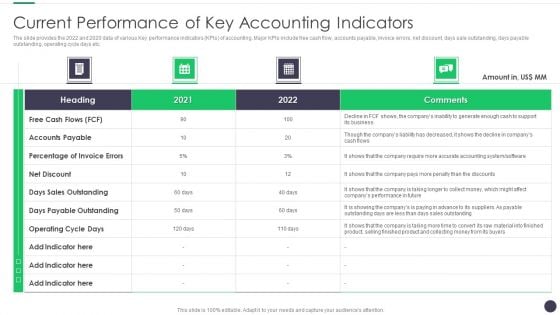
Finance And Accounting Online Conversion Plan Current Performance Of Key Accounting Indicators Template PDF
The slide provides the 2022 and 2020 data of various Key performance indicators KPIs of accounting. Major KPIs include free cash flow, accounts payable, invoice errors, net discount, days sale outstanding, days payable outstanding, operating cycle days etc. Deliver and pitch your topic in the best possible manner with this Finance And Accounting Online Conversion Plan Current Performance Of Key Accounting Indicators Template PDF. Use them to share invaluable insights on Sales Outstanding, Payable Outstanding, Accounts Payable and impress your audience. This template can be altered and modified as per your expectations. So, grab it now.
Tools For Customer Service Metrics Measurement And Tracking Download PDF
This slide showcases tools that can help to measure and track the customer service metrics. Its key components are tools, features, free trial, paid version and user reviews. Persuade your audience using this Tools For Customer Service Metrics Measurement And Tracking Download PDF. This PPT design covers four stages, thus making it a great tool to use. It also caters to a variety of topics including Data Visualization, Custom Reports, Goal Tracking. Download this PPT design now to present a convincing pitch that not only emphasizes the topic but also showcases your presentation skills.
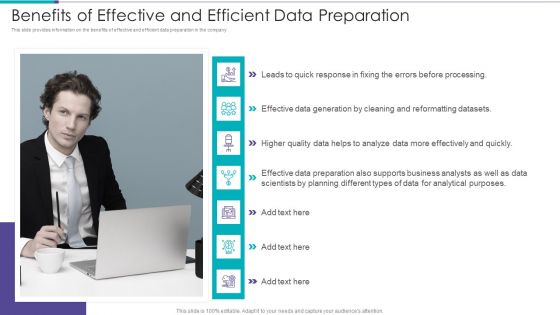
Data Preparation Infrastructure And Phases Benefits Of Effective And Efficient Data Preparation Topics PDF
This slide provides information on the benefits of effective and efficient data preparation in the company.This is a Data Preparation Infrastructure And Phases Benefits Of Effective And Efficient Data Preparation Topics PDF template with various stages. Focus and dispense information on seven stages using this creative set, that comes with editable features. It contains large content boxes to add your information on topics like Univariate Analysis, Variable Identification, Predictor Variables You can also showcase facts, figures, and other relevant content using this PPT layout. Grab it now.
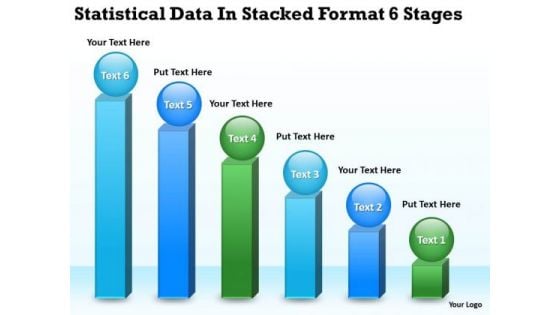
Data In Stacked Format 6 Stages Small Business Plan Template PowerPoint Slides
We present our data in stacked format 6 stages small business plan template PowerPoint Slides.Download and present our Finance PowerPoint Templates because Our PowerPoint Templates and Slides provide you with a vast range of viable options. Select the appropriate ones and just fill in your text. Download our Marketing PowerPoint Templates because Our PowerPoint Templates and Slides will bullet point your ideas. See them fall into place one by one. Present our Spheres PowerPoint Templates because You can Create a matrix with our PowerPoint Templates and Slides. Feel the strength of your ideas click into place. Download and present our Business PowerPoint Templates because our PowerPoint Templates and Slides are the string of your bow. Fire of your ideas and conquer the podium. Present our Boxes PowerPoint Templates because Our PowerPoint Templates and Slides are aesthetically designed to attract attention. We gaurantee that they will grab all the eyeballs you need.Use these PowerPoint slides for presentations relating to Accounting, bar, business, chart, data, diagram, dimension, economy, education, finance, financial, flow, graph, graphic, grow, increase, information, investment, learning, management, market, money, performance, piece, process, profit, report, stack, statistic, success, think, transaction, trend, work. The prominent colors used in the PowerPoint template are Blue, Green, Black. Unite your team with our Data In Stacked Format 6 Stages Small Business Plan Template PowerPoint Slides. Download without worries with our money back guaranteee.
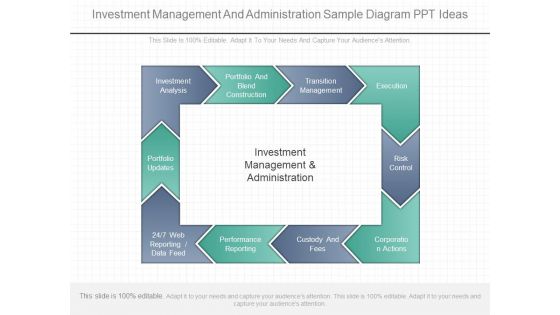
Investment Management And Administration Sample Diagram Ppt Ideas
This is a investment management and administration sample diagram ppt ideas. This is a ten stage process. The stages in this process are investment analysis, portfolio and blend construction, transition management, execution, risk control, corporation actions, custody and fees, performance reporting, web reporting data feed, portfolio updates, investment management and administration.
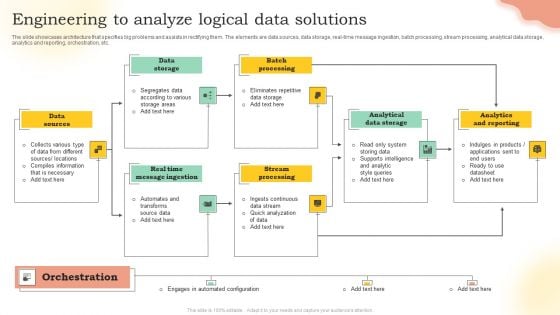
Engineering To Analyze Logical Data Solutions Ppt PowerPoint Presentation Gallery Design Inspiration PDF
The slide showcases architecture that specifies big problems and assists in rectifying them. The elements are data sources, data storage, real-time message ingestion, batch processing, stream processing, analytical data storage, analytics and reporting, orchestration, etc. Presenting Engineering To Analyze Logical Data Solutions Ppt PowerPoint Presentation Gallery Design Inspiration PDF to dispense important information. This template comprises seven stages. It also presents valuable insights into the topics including Data Storage, Batch Processing, Analytical Data Storage, Analytics And Reporting. This is a completely customizable PowerPoint theme that can be put to use immediately. So, download it and address the topic impactfully.
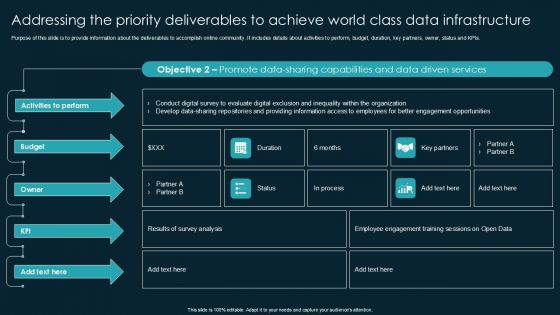
Addressing The Priority Deliverables To Achieve World Class Data Infrastructure Information PDF
About Us Ppt PowerPoint Presentation Introduction
This is a about us ppt powerpoint presentation introduction. This is a four stage process. The stages in this process are business, marketing, management, icons, about us.
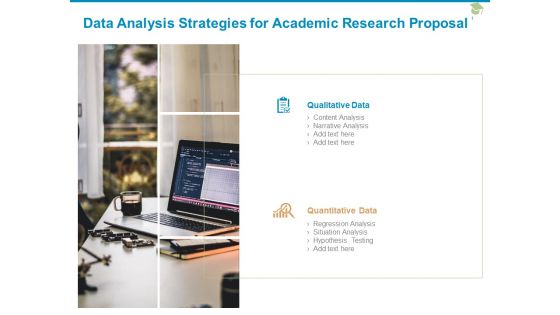
Data Analysis Strategies For Academic Research Proposal Ppt PowerPoint Presentation Model Grid
Presenting this set of slides with name data analysis strategies for academic research proposal ppt powerpoint presentation model grid. This is a two stage process. The stages in this process are qualitative data, quantitative data , content analysis, narrative analysis, regression analysis, situation analysis, hypothesis testing . This is a completely editable PowerPoint presentation and is available for immediate download. Download now and impress your audience.

Magnifying Glass For Project Research Example Of Ppt
This is a magnifying glass for project research example of ppt. This is a four stage process. The stages in this process are business, magnifying glass, search, arrows, marketing.
Magnifying Glass For Customer Management Skills Ppt Slides
This is a magnifying glass for customer management skills ppt slides. This is a five stage process. The stages in this process are icons, marketing, magnifying glass, communication, business, strategy.
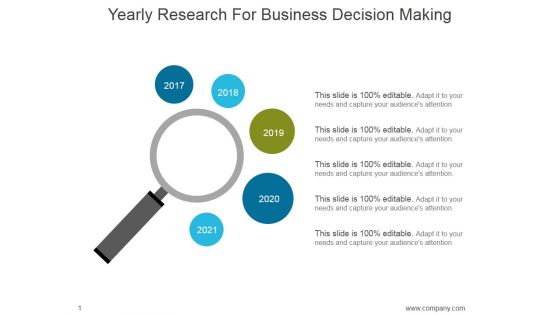
Yearly Research For Business Decision Making Ppt PowerPoint Presentation Show
This is a yearly research for business decision making ppt powerpoint presentation show. This is a five stage process. The stages in this process are business, marketing, year, research, magnify.
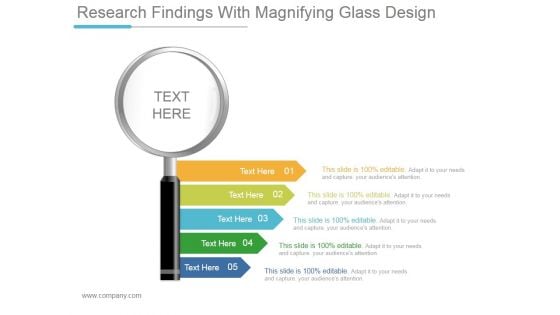
Research Findings With Magnifying Glass Design Ppt PowerPoint Presentation Infographic Template
This is a research findings with magnifying glass design ppt powerpoint presentation infographic template. This is a five stage process. The stages in this process are business, marketing, communication, technology, success.
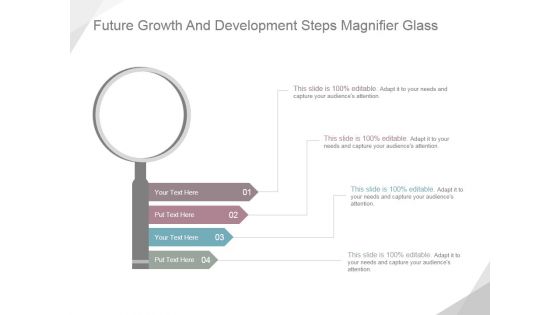
Future Growth And Development Steps Magnifier Glass Ppt PowerPoint Presentation Sample
This is a future growth and development steps magnifier glass ppt powerpoint presentation sample. This is a four stage process. The stages in this process are business, marketing, growth, magnifier glass, management.
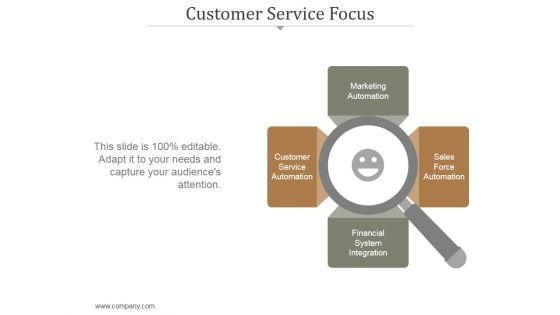
Customer Service Focus Ppt PowerPoint Presentation Model
This is a customer service focus ppt powerpoint presentation model. This is a one stage process. The stages in this process are marketing automation, customer service automation, sales force automation, financial system integration.
Magnifying Glass Ppt PowerPoint Presentation Professional Background Image
This is a magnifying glass ppt powerpoint presentation professional background image. This is a four stage process. The stages in this process are magnifying glass, business, marketing, innovation, management.
Magnifying Glass Ppt PowerPoint Presentation Infographic Template Ideas
This is a magnifying glass ppt powerpoint presentation infographic template ideas. This is a one stage process. The stages in this process are search, strategy, marketing, business, management, planning.
Magnifying Glass Ppt PowerPoint Presentation Professional Graphics Template
This is a magnifying glass ppt powerpoint presentation professional graphics template. This is a five stage process. The stages in this process are magnifying glass, business, marketing, management, planning.

Choose A Realtor Ppt PowerPoint Presentation Model Graphics Example
This is a choose a realtor ppt powerpoint presentation model graphics example. This is a one stage process. The stages in this process are technology, management, planning, marketing, business, strategy.
Magnifying Glass Ppt PowerPoint Presentation Diagram Graph Charts
This is a magnifying glass ppt powerpoint presentation diagram graph charts. This is a one stage process. The stages in this process are magnifying glass, planning, marketing, business, management, strategy.
Magnifying Glass Ppt PowerPoint Presentation Professional Show
This is a magnifying glass ppt powerpoint presentation professional show. This is a one stage process. The stages in this process are magnifying glass, business, management, planning, strategy, marketing.
Recruitment Process Template 4 Ppt PowerPoint Presentation Gallery Skills
This is a recruitment process template 4 ppt powerpoint presentation gallery skills. This is a four stage process. The stages in this process are business, marketing, strategy, technology, planning.
Magnifying Glass Ppt PowerPoint Presentation Professional Design Inspiration
This is a magnifying glass ppt powerpoint presentation professional design inspiration. This is a five stage process. The stages in this process are magnifying glass, marketing, strategy, success, planning.
Magnifying Glass Ppt PowerPoint Presentation File Background Designs
This is a magnifying glass ppt powerpoint presentation file background designs. This is a four stage process. The stages in this process are magnifier glass, research, business, marketing, focus.
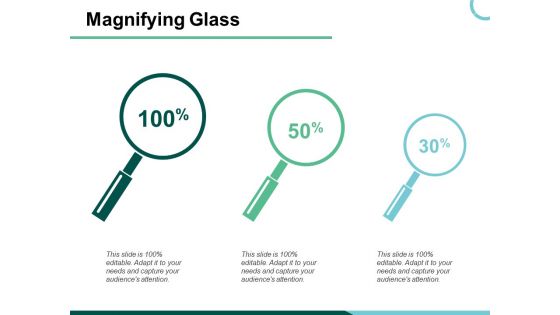
Magnifying Glass Technology Ppt PowerPoint Presentation Ideas Slideshow
This is a magnifying glass technology ppt powerpoint presentation ideas slideshow. This is a three stage process. The stages in this process are magnifying glass, technology, strategies, business, marketing, planning.
Magnifying Glass Technology Ppt Powerpoint Presentation File Slideshow
This is a magnifying glass technology ppt powerpoint presentation file slideshow. This is a four stage process. The stages in this process are magnifying glass, research, marketing, strategy, business.

Magnifying Glass Technology Ppt PowerPoint Presentation Outline Styles
This is a magnifying glass technology ppt powerpoint presentation outline styles. This is a five stage process. The stages in this process are magnifying glass, research, marketing, strategy, business.
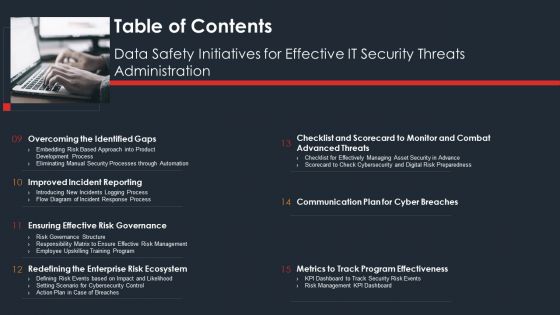
Table Of Contents Data Safety Initiatives For Effective IT Security Threats Administration Summary PDF
Presenting table of contents data safety initiatives for effective it security threats administration summary pdf to provide visual cues and insights. Share and navigate important information on seven stages that need your due attention. This template can be used to pitch topics like overcoming identified gaps, improved incident reporting, communication plan cyber breaches, ensuring effective risk governance. In addtion, this PPT design contains high resolution images, graphics, etc, that are easily editable and available for immediate download.
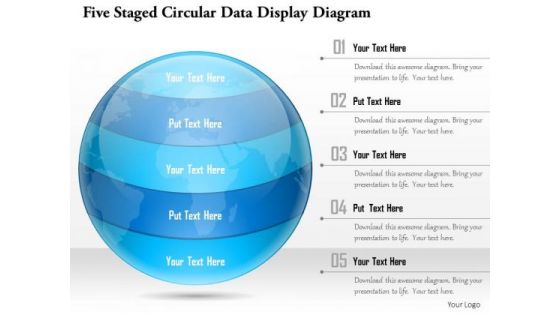
Business Diagram Five Staged Circular Data Display Diagram Presentation Template
This Power Point template slide has been crafted with graphic of five staged circular diagram. This PPT slide contains the concept of data analysis and representation. This PPT slide can be used for business data presentations.

Most Common Predictive Analytics Software Developing Strategic Insights Using Big Data Analytics SS V
This slide showcases major software providers for predictive analytics based on company revenue. It provides information regarding companies such as microsoft, siemens, IBM corporation, oracle , google cloud and SAS institute inc. Make sure to capture your audiences attention in your business displays with our gratis customizable Most Common Predictive Analytics Software Developing Strategic Insights Using Big Data Analytics SS V. These are great for business strategies, office conferences, capital raising or task suggestions. If you desire to acquire more customers for your tech business and ensure they stay satisfied, create your own sales presentation with these plain slides. This slide showcases major software providers for predictive analytics based on company revenue. It provides information regarding companies such as microsoft, siemens, IBM corporation, oracle , google cloud and SAS institute inc.
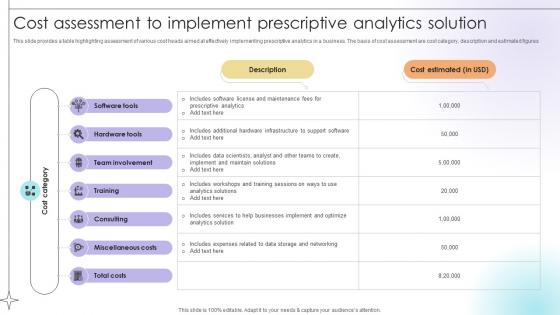
Cost Assessment To Implement Prescriptive Analytics Solution Data Analytics SS V
This slide provides a table highlighting assessment of various cost heads aimed at effectively implementing prescriptive analytics in a business. The basis of cost assessment are cost category, description and estimated figures.Retrieve professionally designed Cost Assessment To Implement Prescriptive Analytics Solution Data Analytics SS V to effectively convey your message and captivate your listeners. Save time by selecting pre-made slideshows that are appropriate for various topics, from business to educational purposes. These themes come in many different styles, from creative to corporate, and all of them are easily adjustable and can be edited quickly. Access them as PowerPoint templates or as Google Slides themes. You do not have to go on a hunt for the perfect presentation because Slidegeeks got you covered from everywhere. This slide provides a table highlighting assessment of various cost heads aimed at effectively implementing prescriptive analytics in a business. The basis of cost assessment are cost category, description and estimated figures.
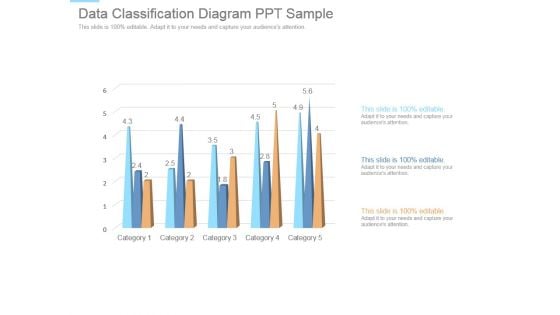
Data Classification Diagram Ppt Sample
This is a data classification diagram ppt sample. This is a five stage process. The stages in this process are category.
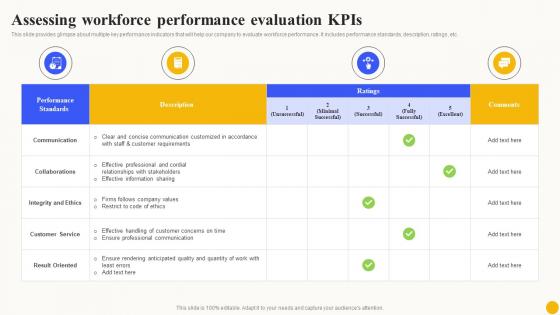
Assessing Workforce Performance Planned Workforce Enhancement Ideas Pdf
This slide provides glimpse about multiple key performance indicators that will help our company to evaluate workforce performance. It includes performance standards, description, ratings, etc.Want to ace your presentation in front of a live audience Our Assessing Workforce Performance Planned Workforce Enhancement Ideas Pdf can help you do that by engaging all the users towards you.. Slidegeeks experts have put their efforts and expertise into creating these impeccable powerpoint presentations so that you can communicate your ideas clearly. Moreover, all the templates are customizable, and easy-to-edit and downloadable. Use these for both personal and commercial use. This slide provides glimpse about multiple key performance indicators that will help our company to evaluate workforce performance. It includes performance standards, description, ratings, etc.
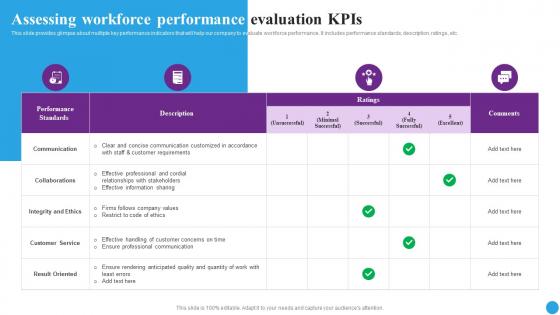
Assessing Workforce Performance Strategic Approaches To Streamline Clipart Pdf
This slide provides glimpse about multiple key performance indicators that will help our company to evaluate workforce performance. It includes performance standards, description, ratings, etc.Want to ace your presentation in front of a live audience Our Assessing Workforce Performance Strategic Approaches To Streamline Clipart Pdf can help you do that by engaging all the users towards you.. Slidegeeks experts have put their efforts and expertise into creating these impeccable powerpoint presentations so that you can communicate your ideas clearly. Moreover, all the templates are customizable, and easy-to-edit and downloadable. Use these for both personal and commercial use. This slide provides glimpse about multiple key performance indicators that will help our company to evaluate workforce performance. It includes performance standards, description, ratings, etc.
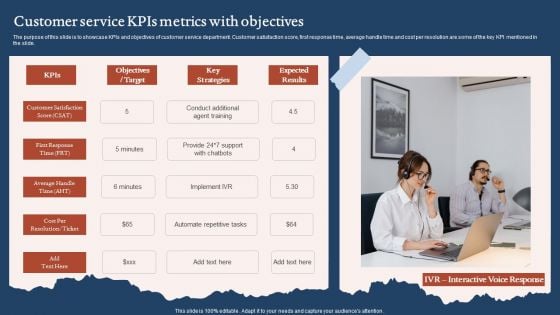
Customer Service Kpis Metrics With Objectives Introduction PDF
The purpose of this slide is to showcase KPIs and objectives of customer service department. Customer satisfaction score, first response time, average handle time and cost per resolution are some of the key KPI mentioned in the slide. Persuade your audience using this Customer Service Kpis Metrics With Objectives Introduction PDF. This PPT design covers one stages, thus making it a great tool to use. It also caters to a variety of topics including Customer Satisfaction, Target, Average Handle. Download this PPT design now to present a convincing pitch that not only emphasizes the topic but also showcases your presentation skills.
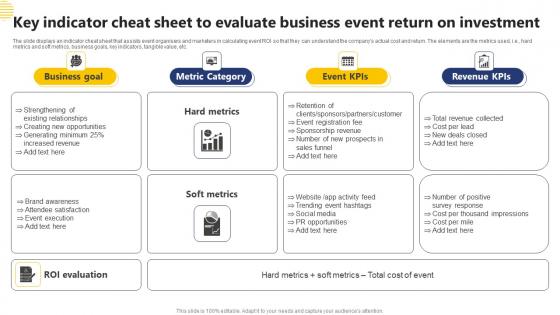
Key Indicator Cheat Sheet To Evaluate Business Event Return On Investment Template Pdf
The slide displays an indicator cheat sheet that assists event organisers and marketers in calculating event ROI so that they can understand the companys actual cost and return. The elements are the metrics used, i.e., hard metrics and soft metrics, business goals, key indicators, tangible value, etc. Showcasing this set of slides titled Key Indicator Cheat Sheet To Evaluate Business Event Return On Investment Template Pdf The topics addressed in these templates are Business Goal, Metric Category, Revenue KPIS All the content presented in this PPT design is completely editable. Download it and make adjustments in color, background, font etc. as per your unique business setting. The slide displays an indicator cheat sheet that assists event organisers and marketers in calculating event ROI so that they can understand the companys actual cost and return. The elements are the metrics used, i.e., hard metrics and soft metrics, business goals, key indicators, tangible value, etc.
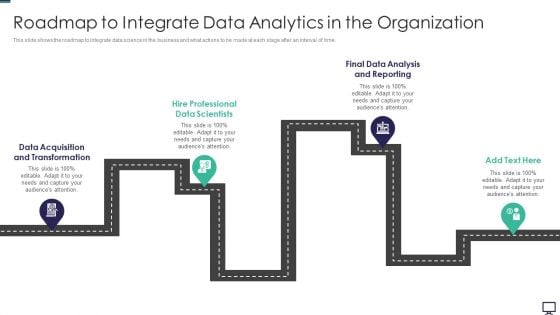
Roadmap To Integrate Data Analytics In The Organization Ppt Show Background Images PDF
This slide shows the roadmap to integrate data science in the business and what actions to be made at each stage after an interval of time. Presenting roadmap to integrate data analytics in the organization ppt show background images pdf to provide visual cues and insights. Share and navigate important information on four stages that need your due attention. This template can be used to pitch topics like data acquisition, analysis, data. In addtion, this PPT design contains high resolution images, graphics, etc, that are easily editable and available for immediate download.
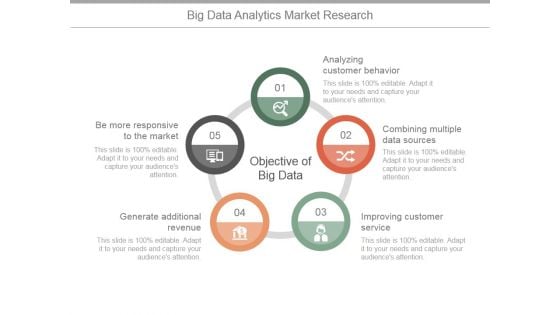
Big Data Analytics Market Research Ppt PowerPoint Presentation Ideas
This is a big data analytics market research ppt powerpoint presentation ideas. This is a five stage process. The stages in this process are analyzing customer behavior, combining multiple data sources, improving customer service, generate additional revenue, be more responsive to the market.
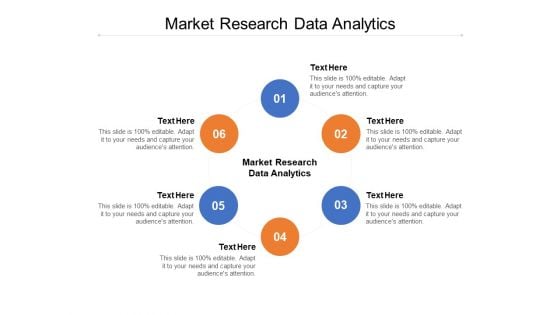
Market Research Data Analytics Ppt PowerPoint Presentation File Ideas Cpb
Presenting this set of slides with name market research data analytics ppt powerpoint presentation file ideas cpb. This is an editable Powerpoint six stages graphic that deals with topics like market research data analytics to help convey your message better graphically. This product is a premium product available for immediate download and is 100 percent editable in Powerpoint. Download this now and use it in your presentations to impress your audience.
Data Analytics Plan For Digital Marketing Icon Diagrams PDF
Persuade your audience using this Data Analytics Plan For Digital Marketing Icon Diagrams PDF. This PPT design covers three stages, thus making it a great tool to use. It also caters to a variety of topics including Data Analytics Plan, Digital Marketing Icon. Download this PPT design now to present a convincing pitch that not only emphasizes the topic but also showcases your presentation skills.
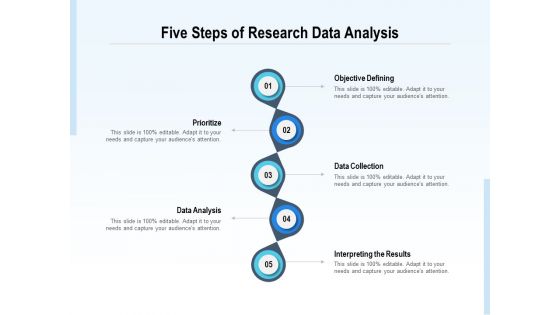
Five Steps Of Research Data Analysis Ppt PowerPoint Presentation Gallery Styles
Presenting this set of slides with name five steps of research data analysis ppt powerpoint presentation gallery styles. This is a five stage process. The stages in this process are objective defining, prioritize, data analysis, data collection, interpreting the results. This is a completely editable PowerPoint presentation and is available for immediate download. Download now and impress your audience.
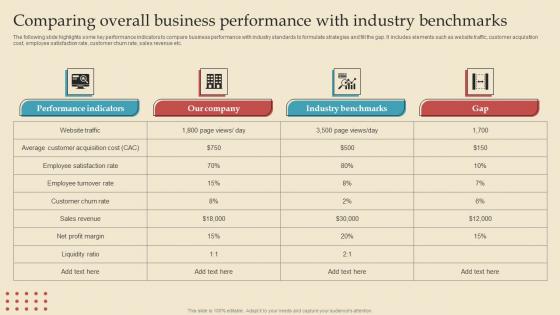
Comparing Overall Benchmarks Describing Business Performance Administration Goals Brochure Pdf
The following slide highlights some key performance indicators to compare business performance with industry standards to formulate strategies and fill the gap. It includes elements such as website traffic, customer acquisition cost, employee satisfaction rate, customer churn rate, sales revenue etc. The Comparing Overall Benchmarks Describing Business Performance Administration Goals Brochure Pdf is a compilation of the most recent design trends as a series of slides. It is suitable for any subject or industry presentation, containing attractive visuals and photo spots for businesses to clearly express their messages. This template contains a variety of slides for the user to input data, such as structures to contrast two elements, bullet points, and slides for written information. Slidegeeks is prepared to create an impression. The following slide highlights some key performance indicators to compare business performance with industry standards to formulate strategies and fill the gap. It includes elements such as website traffic, customer acquisition cost, employee satisfaction rate, customer churn rate, sales revenue etc.
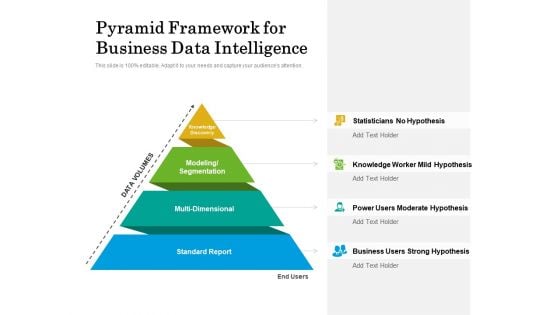
pyramid framework for business data intelligence ppt powerpoint presentation file layout ideas pdf
Presenting this set of slides with name pyramid framework for business data intelligence ppt powerpoint presentation file layout ideas pdf. This is a four stage process. The stages in this process are knowledge, discovery, modeling, segmentation, multi dimensional, standard report. This is a completely editable PowerPoint presentation and is available for immediate download. Download now and impress your audience.
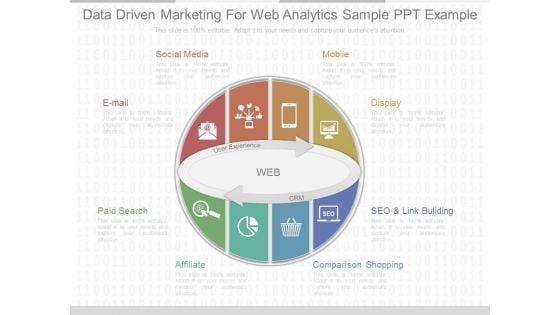
Data Driven Marketing For Web Analytics Sample Ppt Example
This is a data driven marketing for web analytics sample ppt example. This is a two stage process. The stages in this process are web, user experience, crm, social media, email, paid search, affiliate, comparison shopping, seo and link buliding, display, mobile.
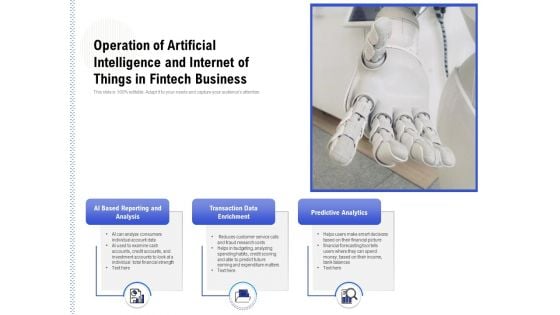
Operation Of Artificial Intelligence And Internet Of Things In Fintech Business Ppt PowerPoint Presentation Infographic Template Example File
Pitch your topic with ease and precision using this operation of artificial intelligence and internet of things in fintech business ppt powerpoint presentation infographic template example file. This layout presents information on ai based reporting and analysis, transaction data enrichment, predictive analytics. It is also available for immediate download and adjustment. So, changes can be made in the color, design, graphics or any other component to create a unique layout.
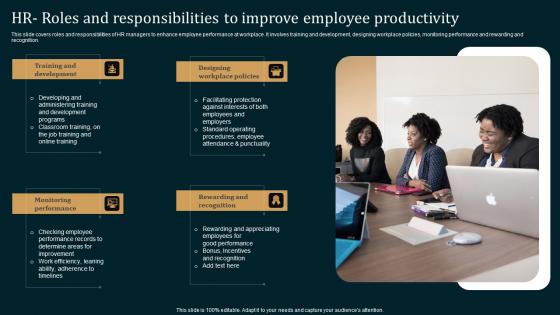
HR Roles And Responsibilities Employee Performance Improvement Strategies Infographics Pdf
This slide covers roles and responsibilities of HR managers to enhance employee performance at workplace. It involves training and development, designing workplace policies, monitoring performance and rewarding and recognition. Make sure to capture your audiences attention in your business displays with our gratis customizable HR Roles And Responsibilities Employee Performance Improvement Strategies Infographics Pdf. These are great for business strategies, office conferences, capital raising or task suggestions. If you desire to acquire more customers for your tech business and ensure they stay satisfied, create your own sales presentation with these plain slides. This slide covers roles and responsibilities of HR managers to enhance employee performance at workplace. It involves training and development, designing workplace policies, monitoring performance and rewarding and recognition.
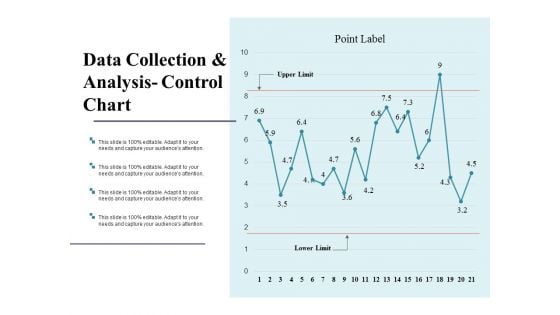
Data Collection And Analysis Control Chart Ppt PowerPoint Presentation Model Backgrounds
This is a data collection and analysis control chart ppt powerpoint presentation model backgrounds. This is a two stage process. The stages in this process are business, marketing, strategy, finance, analysis.
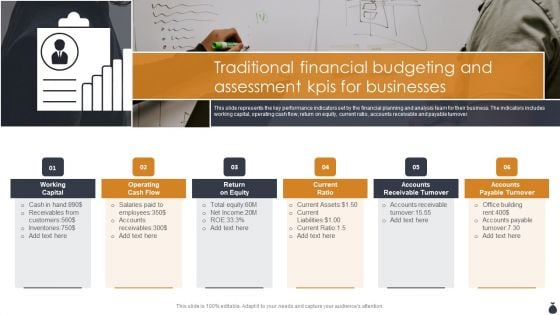
Traditional Financial Budgeting And Assessment Kpis For Businesses Infographics PDF
This slide represents the key performance indicators set by the financial planning and analysis team for their business. The indicators includes working capital, operating cash flow, return on equity, current ratio, accounts receivable and payable turnover. Presenting Traditional Financial Budgeting And Assessment Kpis For Businesses Infographics PDF to dispense important information. This template comprises six stages. It also presents valuable insights into the topics including Working Capital, Operating Cash Flow, Current Ratio. This is a completely customizable PowerPoint theme that can be put to use immediately. So, download it and address the topic impactfully.
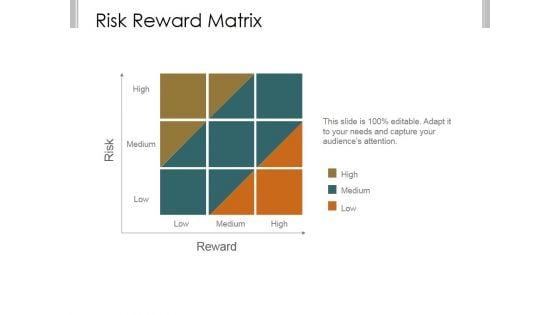
Risk Reward Matrix Template 2 Ppt PowerPoint Presentation Clipart
This is a risk reward matrix template 2 ppt powerpoint presentation clipart. This is a nine stage process. The stages in this process are business, strategy, marketing, analysis, risk, reward.

5 R2R Key Performance Indicators Ppt PowerPoint Presentation Model Topics PDF
Following slide outlines critical R2R KPIs. Time to close, number of entry corrections, voice of transactions per FTE, growth of CA and process costs are some of the KPIs, which will assist accounts department to measure its overall performance.Showcasing this set of slides titled 5 R2R Key Performance Indicators Ppt PowerPoint Presentation Model Topics PDF. The topics addressed in these templates are Volume Transactions, Process Cost, Entry Corrections. All the content presented in this PPT design is completely editable. Download it and make adjustments in color, background, font etc. as per your unique business setting.
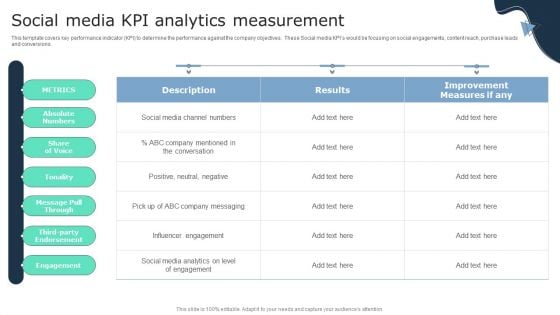
Social Media Kpi Analytics Measurement Business Social Strategy Guide Infographics PDF
This template covers key performance indicator KPI to determine the performance against the company objectives. These Social media KPIs would be focusing on social engagements, content reach, purchase leads and conversions. If you are looking for a format to display your unique thoughts, then the professionally designed Social Media Kpi Analytics Measurement Business Social Strategy Guide Infographics PDF is the one for you. You can use it as a Google Slides template or a PowerPoint template. Incorporate impressive visuals, symbols, images, and other charts. Modify or reorganize the text boxes as you desire. Experiment with shade schemes and font pairings. Alter, share or cooperate with other people on your work. Download Social Media Kpi Analytics Measurement Business Social Strategy Guide Infographics PDF and find out how to give a successful presentation. Present a perfect display to your team and make your presentation unforgettable.
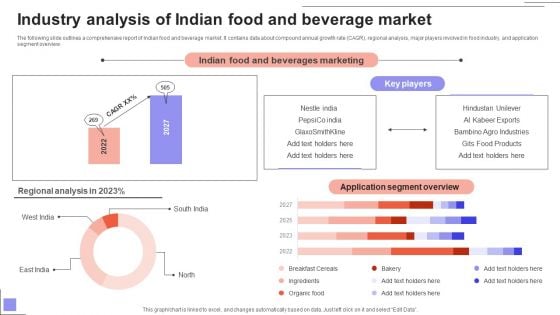
Overview Of The Food Industry Analysis Of Indian Food And Beverage Market Pictures PDF
The following slide outlines a comprehensive report of Indian food and beverage market. It contains data about compound annual growth rate CAGR, regional analysis, major players involved in food industry, and application segment overview. There are so many reasons you need a Overview Of The Food Industry Analysis Of Indian Food And Beverage Market Pictures PDF. The first reason is you can not spend time making everything from scratch, Thus, Slidegeeks has made presentation templates for you too. You can easily download these templates from our website easily.


 Continue with Email

 Home
Home


