Dashboards
Business Diagram Exponentially Growing Big Data With Icons Surrounding Cloud Ppt Slide
This slide contains the graphic of clouds and icons. This diagram has been designed with concept of big data growth. This diagram displays the exponential growth of data analysis. Use this diagram slide for your data technology related presentations.
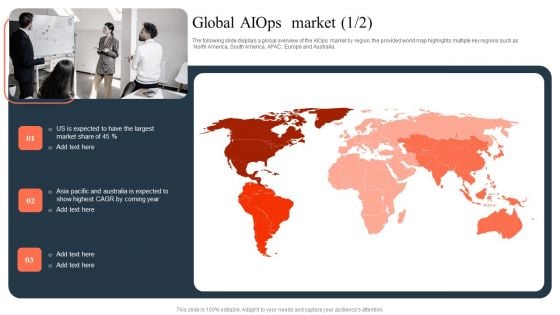
Ml And Big Data In Information Technology Processes Global Aiops Market Slides PDF
The following slide displays a global overview of the AIOps market by region, the provided world map highlights multiple key regions such as North America, South America, APAC, Europe and Australia. Welcome to our selection of the Ml And Big Data In Information Technology Processes Global Aiops Market Slides PDF. These are designed to help you showcase your creativity and bring your sphere to life. Planning and Innovation are essential for any business that is just starting out. This collection contains the designs that you need for your everyday presentations. All of our PowerPoints are 100 percent editable, so you can customize them to suit your needs. This multi purpose template can be used in various situations. Grab these presentation templates today.
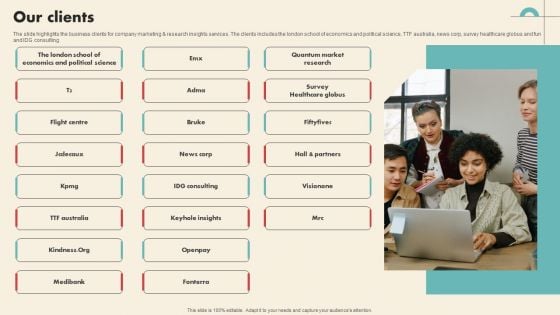
Data Driven Marketing Solutions Firm Company Profile Our Clients Themes PDF
The slide highlights the business clients for company marketing and research insights services. The clients includes the london school of economics and political science, TTF australia, news corp, survey healthcare globus and fun and IDG consulting Retrieve professionally designed Data Driven Marketing Solutions Firm Company Profile Our Clients Themes PDF to effectively convey your message and captivate your listeners. Save time by selecting pre made slideshows that are appropriate for various topics, from business to educational purposes. These themes come in many different styles, from creative to corporate, and all of them are easily adjustable and can be edited quickly. Access them as PowerPoint templates or as Google Slides themes. You do not have to go on a hunt for the perfect presentation because Slidegeeks got you covered from everywhere.
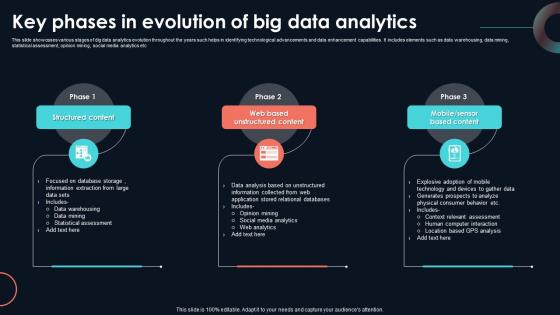
Key Phases In Evolution Of Big Data Developing Strategic Insights Using Big Data Analytics SS V
This slide showcases various stages of dig data analytics evolution throughout the years such helps in identifying technological advancements and data enhancement capabilities. It includes elements such as data warehousing, data mining, statistical assessment, opinion mining, social media analytics etc. Find highly impressive Key Phases In Evolution Of Big Data Developing Strategic Insights Using Big Data Analytics SS V on Slidegeeks to deliver a meaningful presentation. You can save an ample amount of time using these presentation templates. No need to worry to prepare everything from scratch because Slidegeeks experts have already done a huge research and work for you. You need to download Key Phases In Evolution Of Big Data Developing Strategic Insights Using Big Data Analytics SS V for your upcoming presentation. All the presentation templates are 100 percent editable and you can change the color and personalize the content accordingly. Download now This slide showcases various stages of dig data analytics evolution throughout the years such helps in identifying technological advancements and data enhancement capabilities. It includes elements such as data warehousing, data mining, statistical assessment, opinion mining, social media analytics etc.
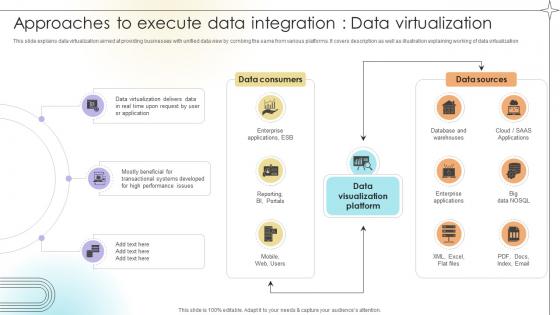
Approaches To Execute Data Integration Data Virtualization Data Analytics SS V
This slide explains data virtualization aimed at providing businesses with unified data view by combing the same from various platforms. It covers description as well as illustration explaining working of data virtualization.If you are looking for a format to display your unique thoughts, then the professionally designed Approaches To Execute Data Integration Data Virtualization Data Analytics SS V is the one for you. You can use it as a Google Slides template or a PowerPoint template. Incorporate impressive visuals, symbols, images, and other charts. Modify or reorganize the text boxes as you desire. Experiment with shade schemes and font pairings. Alter, share or cooperate with other people on your work. Download Approaches To Execute Data Integration Data Virtualization Data Analytics SS V and find out how to give a successful presentation. Present a perfect display to your team and make your presentation unforgettable. This slide explains data virtualization aimed at providing businesses with unified data view by combing the same from various platforms. It covers description as well as illustration explaining working of data virtualization.
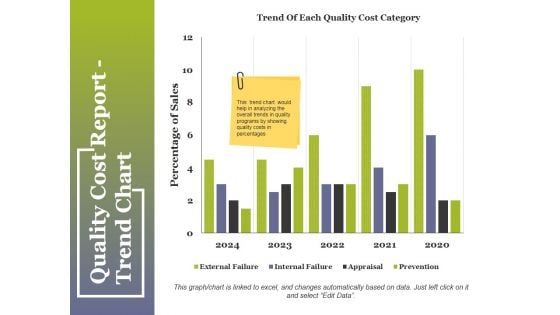
Quality Cost Report Trend Chart Ppt PowerPoint Presentation Summary Pictures
This is a quality cost report trend chart ppt powerpoint presentation summary pictures. This is a two stage process. The stages in this process are compare, business, table, marketing, strategy.

Quality Cost Report Trend Chart Ppt PowerPoint Presentation Portfolio Maker
This is a quality cost report trend chart ppt powerpoint presentation portfolio maker. This is a two stage process. The stages in this process are compare, marketing, business, strategy, planning.
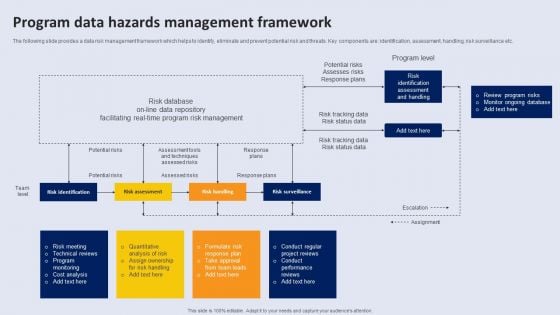
Program Data Hazards Management Framework Microsoft PDF
The following slide provides a data risk management framework which helps to identify, eliminate and prevent potential risk and threats. Key components are identification, assessment, handling, risk surveillance etc.Showcasing this set of slides titled Program Data Hazards Management Framework Microsoft PDF. The topics addressed in these templates are Risk Identification, Risk Surveillance. All the content presented in this PPT design is completely editable. Download it and make adjustments in color, background, font etc. as per your unique business setting.
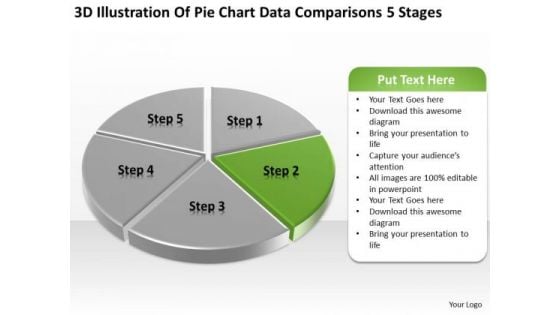
Pie Chart Data Comparisons 5 Stages Business Plan PowerPoint Templates
We present our pie chart data comparisons 5 stages business plan PowerPoint templates.Download and present our Marketing PowerPoint Templates because Our PowerPoint Templates and Slides offer you the widest possible range of options. Use our Finance PowerPoint Templates because You should Ascend the ladder of success with ease. Our PowerPoint Templates and Slides will provide strong and sturdy steps. Download and present our Business PowerPoint Templates because You should Throw the gauntlet with our PowerPoint Templates and Slides. They are created to take up any challenge. Present our Sales PowerPoint Templates because Our PowerPoint Templates and Slides help you pinpoint your timelines. Highlight the reasons for your deadlines with their use. Present our Success PowerPoint Templates because It will Raise the bar of your Thoughts. They are programmed to take you to the next level.Use these PowerPoint slides for presentations relating to Analysis, Analyzing, Brands, Business, Chart, Colorful, Commerce, Compare, Comparison, Data, Economical, Finance, Financial, Grow, Growth, Market, Market Share, Marketing, Measure, Pen, Pie, Pie Chart, Presentation, Profit, Revenue, Sales, Sales Chat, Sales Increase, Share, Statistical, Success, Successful. The prominent colors used in the PowerPoint template are Green, Gray, White. Our Pie Chart Data Comparisons 5 Stages Business Plan PowerPoint Templates are experts in convincing the crowd. They will be greatly assured by your ideas.
Key Performance Indicators Accounting Ppt Powerpoint Presentation Portfolio Master Slide Cpb
This is a key performance indicators accounting ppt powerpoint presentation portfolio master slide cpb. This is a five stage process. The stages in this process are key performance indicators accounting.

Data Lake Architecture Future Of Data Analysis Ppt PowerPoint Presentation Complete Deck With Slides
This complete presentation has PPT slides on wide range of topics highlighting the core areas of your business needs. It has professionally designed templates with relevant visuals and subject driven content. This presentation deck has total of seventy five slides. Get access to the customizable templates. Our designers have created editable templates for your convenience. You can edit the colour, text and font size as per your need. You can add or delete the content if required. You are just a click to away to have this ready made presentation. Click the download button now.
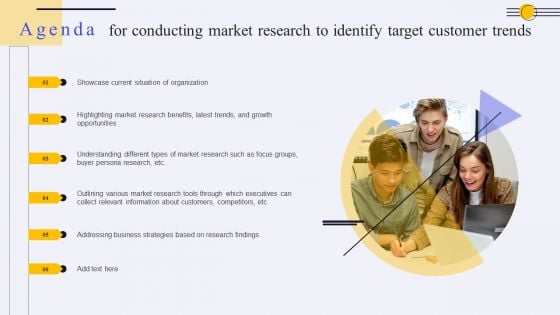
Agenda For Conducting Market Research To Identify Target Customer Trends Ppt PowerPoint Presentation File Inspiration PDF
The Agenda For Conducting Market Research To Identify Target Customer Trends Ppt PowerPoint Presentation File Inspiration PDF is a compilation of the most recent design trends as a series of slides. It is suitable for any subject or industry presentation, containing attractive visuals and photo spots for businesses to clearly express their messages. This template contains a variety of slides for the user to input data, such as structures to contrast two elements, bullet points, and slides for written information. Slidegeeks is prepared to create an impression.
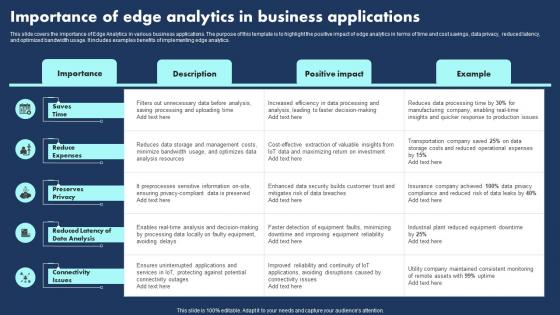
Importance Of Edge Analytics In Business Applications Ideas Pdf
This slide covers the importance of Edge Analytics in various business applications. The purpose of this template is to highlight the positive impact of edge analytics in terms of time and cost savings, data privacy, reduced latency, and optimized bandwidth usage. It includes examples benefits of implementing edge analytics.Showcasing this set of slides titled Importance Of Edge Analytics In Business Applications Ideas Pdf The topics addressed in these templates are Reduce Expenses, Reduced Latency, Connectivity Issues All the content presented in this PPT design is completely editable. Download it and make adjustments in color, background, font etc. as per your unique business setting. This slide covers the importance of Edge Analytics in various business applications. The purpose of this template is to highlight the positive impact of edge analytics in terms of time and cost savings, data privacy, reduced latency, and optimized bandwidth usage. It includes examples benefits of implementing edge analytics.
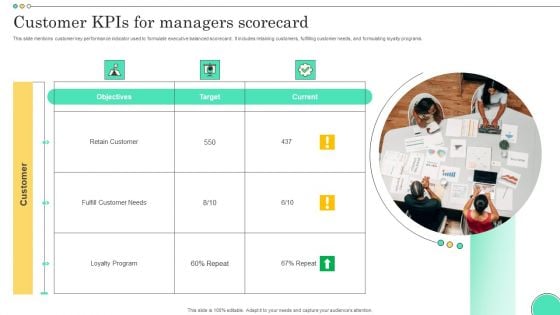
Customer Kpis For Managers Scorecard Template PDF
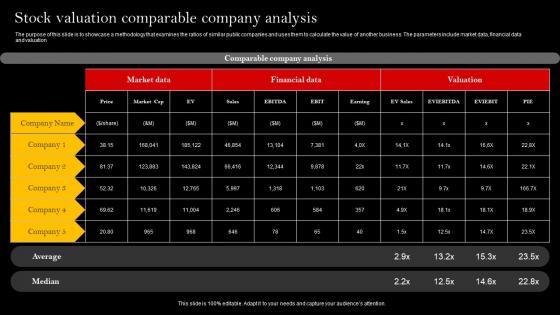
Stock Valuation Comparable Company Analysis Microsoft Pdf
The purpose of this slide is to showcase a methodology that examines the ratios of similar public companies and uses them to calculate the value of another business. The parameters include market data, financial data and valuation Pitch your topic with ease and precision using this Stock Valuation Comparable Company Analysis Microsoft Pdf This layout presents information on Market Data, Financial Data, Company Analysis It is also available for immediate download and adjustment. So, changes can be made in the color, design, graphics or any other component to create a unique layout. The purpose of this slide is to showcase a methodology that examines the ratios of similar public companies and uses them to calculate the value of another business. The parameters include market data, financial data and valuation
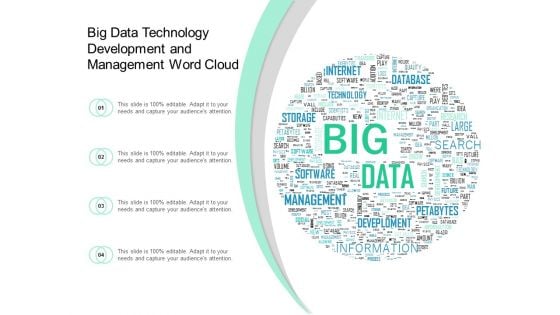
Big Data Technology Development And Management Word Cloud Ppt PowerPoint Presentation File Background Image
Presenting this set of slides with name big data technology development and management word cloud ppt powerpoint presentation file background image. This is a four stage process. The stages in this process are word cloud, term cloud, phrase cloud. This is a completely editable PowerPoint presentation and is available for immediate download. Download now and impress your audience.
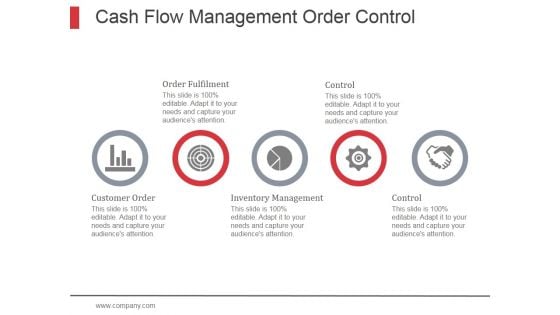
Cash Flow Management Order Control Ppt PowerPoint Presentation Design Ideas
This is a cash flow management order control ppt powerpoint presentation design ideas. This is a five stage process. The stages in this process are management, cash flow management, budget, financial analysis.
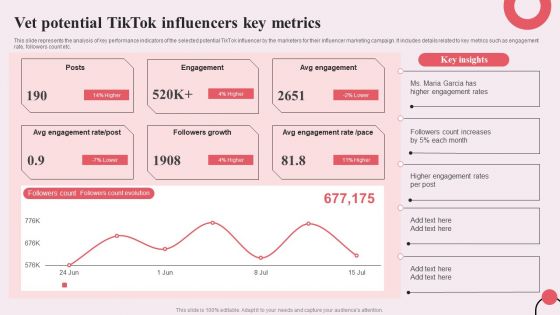
Tiktok Digital Marketing Campaign Vet Potential Tiktok Influencers Key Metrics Download PDF
This slide represents the analysis of key performance indicators of the selected potential TikTok influencer by the marketers for their influencer marketing campaign. It includes details related to key metrics such as engagement rate, followers count etc. Do you have to make sure that everyone on your team knows about any specific topic I yes, then you should give Tiktok Digital Marketing Campaign Vet Potential Tiktok Influencers Key Metrics Download PDF a try. Our experts have put a lot of knowledge and effort into creating this impeccable Tiktok Digital Marketing Campaign Vet Potential Tiktok Influencers Key Metrics Download PDF. You can use this template for your upcoming presentations, as the slides are perfect to represent even the tiniest detail. You can download these templates from the Slidegeeks website and these are easy to edit. So grab these today
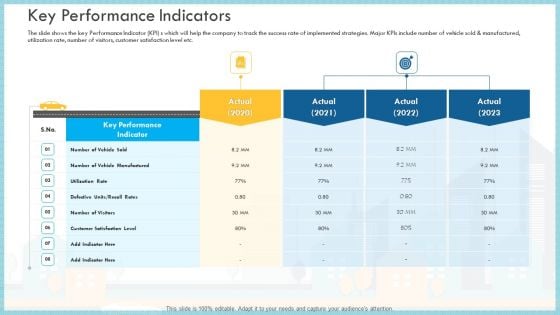
Loss Of Income And Financials Decline In An Automobile Organization Case Study Key Performance Indicators Brochure PDF
The slide shows the key Performance Indicator KPI s which will help the company to track the success rate of implemented strategies. Major KPIs include number of vehicle sold and manufactured, utilization rate, number of visitors, customer satisfaction level etc.Deliver an awe inspiring pitch with this creative loss of income and financials decline in an automobile organization case study key performance indicators brochure pdf bundle. Topics like key performance indicator, utilization rate, customer satisfaction level can be discussed with this completely editable template. It is available for immediate download depending on the needs and requirements of the user
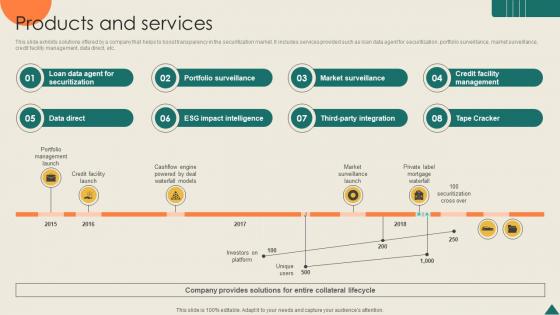
Products And Services Financial Analytics Platform Investor Elevator Pitch Deck
This slide exhibits solutions offered by a company that helps to boost transparency in the securitization market. It includes services provided such as loan data agent for securitization, portfolio surveillance, market surveillance, credit facility management, data direct, etc. Do you have an important presentation coming up Are you looking for something that will make your presentation stand out from the rest Look no further than Products And Services Financial Analytics Platform Investor Elevator Pitch Deck. With our professional designs, you can trust that your presentation will pop and make delivering it a smooth process. And with Slidegeeks, you can trust that your presentation will be unique and memorable. So why wait Grab Products And Services Financial Analytics Platform Investor Elevator Pitch Deck today and make your presentation stand out from the rest This slide exhibits solutions offered by a company that helps to boost transparency in the securitization market. It includes services provided such as loan data agent for securitization, portfolio surveillance, market surveillance, credit facility management, data direct, etc.
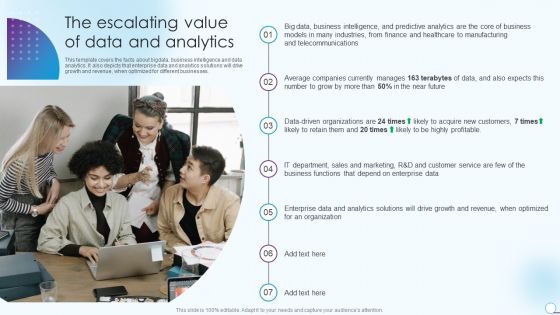
Information Analytics And Ml Strategy Playbook The Escalating Value Of Data And Analytics Elements PDF
This template covers the facts about bigdata, business intelligence and data analytics. It also depicts that enterprise data and analytics solutions will drive growth and revenue, when optimized for different businesses. Presenting Information Analytics And Ml Strategy Playbook The Escalating Value Of Data And Analytics Elements PDF to provide visual cues and insights. Share and navigate important information on seven stages that need your due attention. This template can be used to pitch topics like Sales And Marketing, Enterprise Data, Customer Service. In addtion, this PPT design contains high resolution images, graphics, etc, that are easily editable and available for immediate download.
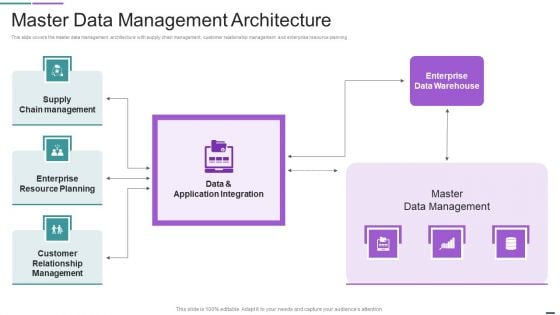
Master Data Management Architecture Mockup PDF
Deliver and pitch your topic in the best possible manner with this Master Data Management Architecture Mockup PDF. Use them to share invaluable insights on Supply Chain Management, Enterprise Resource Planning, Customer Relationship Management and impress your audience. This template can be altered and modified as per your expectations. So, grab it now.
Data Processing Cloud Services Icon Infographics PDF
Pitch your topic with ease and precision using this Data Processing Cloud Services Icon Infographics PDF. This layout presents information on Security Compliance, Monitor Visibility, Authentication. It is also available for immediate download and adjustment. So, changes can be made in the color, design, graphics or any other component to create a unique layout.
Icons Slide For Data Structure Mockup PDF
Introducing our well designed Icons Slide For Data Structure Mockup PDF set of slides. The slide displays editable icons to enhance your visual presentation. The icons can be edited easily. So customize according to your business to achieve a creative edge. Download and share it with your audience.
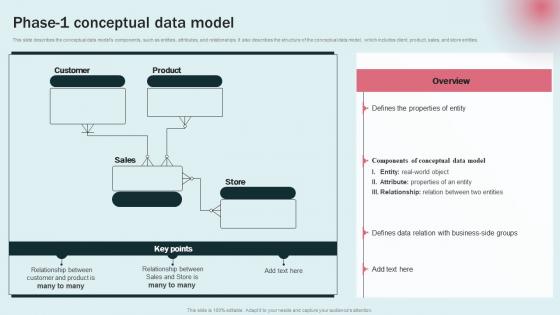
Phase 1 Conceptual Data Model Data Modeling Approaches For Modern Analytics Download Pdf
This slide describes the conceptual data models components, such as entities, attributes, and relationships. It also describes the structure of the conceptual data model, which includes client, product, sales, and store entities. This Phase 1 Conceptual Data Model Data Modeling Approaches For Modern Analytics Download Pdf is perfect for any presentation, be it in front of clients or colleagues. It is a versatile and stylish solution for organizing your meetings. The Phase 1 Conceptual Data Model Data Modeling Approaches For Modern Analytics Download Pdf features a modern design for your presentation meetings. The adjustable and customizable slides provide unlimited possibilities for acing up your presentation. Slidegeeks has done all the homework before launching the product for you. So, do not wait, grab the presentation templates today This slide describes the conceptual data models components, such as entities, attributes, and relationships. It also describes the structure of the conceptual data model, which includes client, product, sales, and store entities.
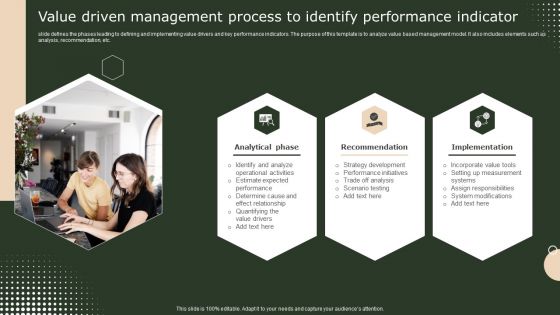
Value Driven Management Process To Identify Performance Indicator Themes PDF
slide defines the phases leading to defining and implementing value drivers and key performance indicators. The purpose of this template is to analyze value based management model. It also includes elements such as analysis, recommendation, etc. Persuade your audience using this Value Driven Management Process To Identify Performance Indicator Themes PDF. This PPT design covers three stages, thus making it a great tool to use. It also caters to a variety of topics including Recommendation, Analytical Phase, Implementation. Download this PPT design now to present a convincing pitch that not only emphasizes the topic but also showcases your presentation skills.
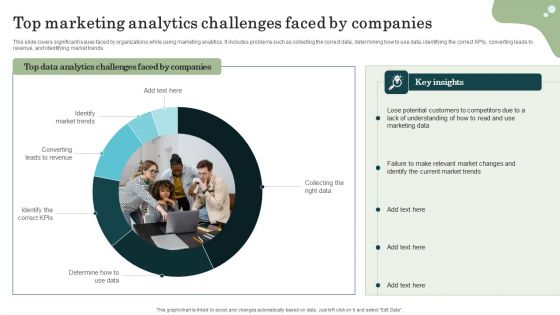
Marketing Success Metrics Top Marketing Analytics Challenges Faced By Inspiration PDF
This slide covers significant issues faced by organizations while using marketing analytics. It includes problems such as collecting the correct data, determining how to use data, identifying the correct KPIs, converting leads to revenue, and identifying market trends. Boost your pitch with our creative Marketing Success Metrics Top Marketing Analytics Challenges Faced By Inspiration PDF. Deliver an awe-inspiring pitch that will mesmerize everyone. Using these presentation templates you will surely catch everyones attention. You can browse the ppts collection on our website. We have researchers who are experts at creating the right content for the templates. So you dont have to invest time in any additional work. Just grab the template now and use them.
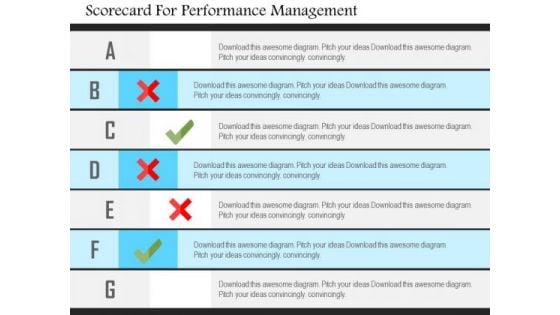
Business Diagram Scorecard For Performance Management Presentation Template
This business diagram is designed with graphics of scorecard. You may use this business slide to present performance management. This diagram provides an effective way of displaying information you can edit text, color, shade and style as per you need.
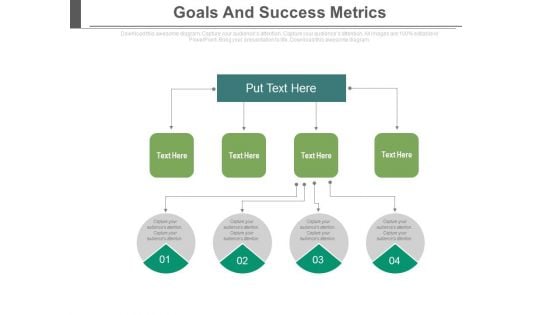
Goals And Success Metrics Ppt Slides
This is a goals and success metrics ppt slides. This is a four stage process. The stages in this process are process and flows, success, business.
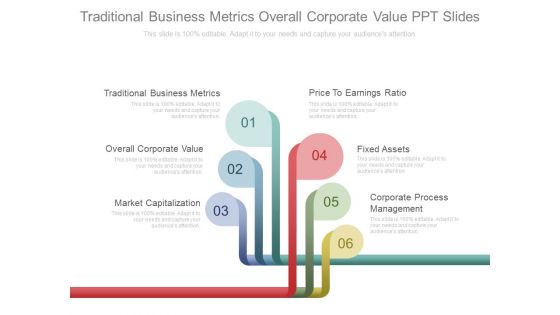
Traditional Business Metrics Overall Corporate Value Ppt Slides
This is a traditional business metrics overall corporate value ppt slides. This is a six stage process. The stages in this process are success, business, marketing.
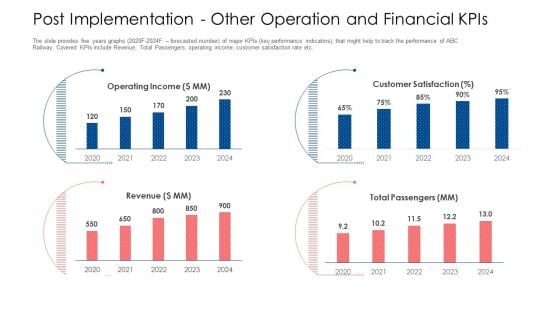
Post Implementation Other Operation And Financial Kpis Ppt Infographic Template PDF
The slide provides five years graphs 2020F-2024F forecasted number of major KPIs key performance indicators, that might help to track the performance of ABC Railway. Covered KPIs include Revenue, Total Passengers, operating income, customer satisfaction rate etc. Deliver an awe inspiring pitch with this creative post implementation other operation and financial kpis ppt infographic template pdf bundle. Topics like operating income, revenue, customer satisfaction can be discussed with this completely editable template. It is available for immediate download depending on the needs and requirements of the user.
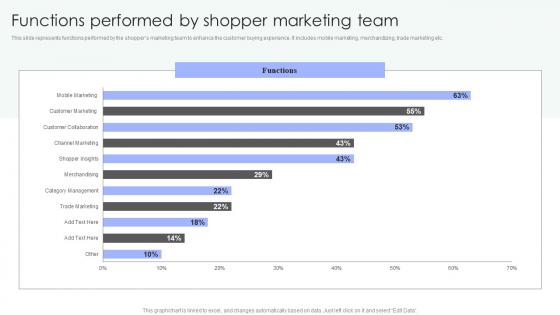
Shopper Marketing Strategy To Enhance Functions Performed By Shopper Marketing Infographics Pdf
This slide represents functions performed by the shoppers marketing team to enhance the customer buying experience. It includes mobile marketing, merchandizing, trade marketing etc. If your project calls for a presentation, then Slidegeeks is your go-to partner because we have professionally designed, easy-to-edit templates that are perfect for any presentation. After downloading, you can easily edit Shopper Marketing Strategy To Enhance Functions Performed By Shopper Marketing Infographics Pdf and make the changes accordingly. You can rearrange slides or fill them with different images. Check out all the handy templates This slide represents functions performed by the shoppers marketing team to enhance the customer buying experience. It includes mobile marketing, merchandizing, trade marketing etc.
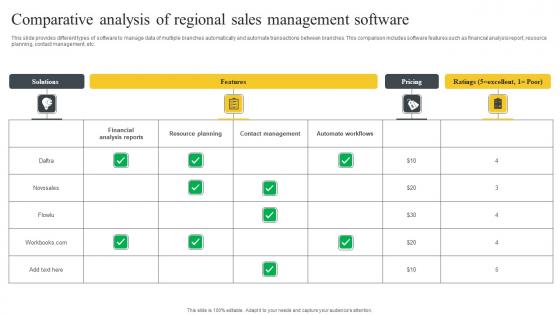
Comparative Analysis Of Regional Sales Management Software Background Pdf
This slide provides different types of software to manage data of multiple branches automatically and automate transactions between branches. This comparison includes software features such as financial analysis report, resource planning, contact management, etc. Pitch your topic with ease and precision using this Comparative Analysis Of Regional Sales Management Software Background Pdf. This layout presents information on Solutions, Features, Pricing. It is also available for immediate download and adjustment. So, changes can be made in the color, design, graphics or any other component to create a unique layout. This slide provides different types of software to manage data of multiple branches automatically and automate transactions between branches. This comparison includes software features such as financial analysis report, resource planning, contact management, etc.
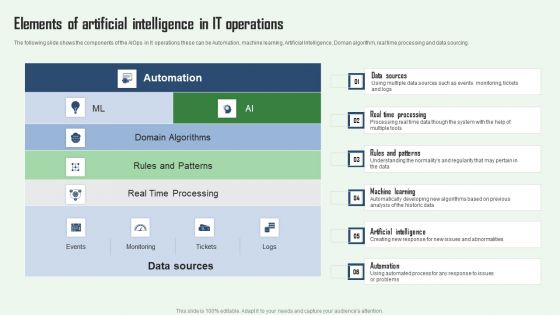
Elements Of Artificial Intelligence In IT Operations Aiops Integration Summary Report Demonstration PDF
The following slide shows the components of the AIOps in It operations these can be Automation, machine learning, Artificial Intelligence, Doman algorithm, real time processing and data sourcing. This modern and well arranged Elements Of Artificial Intelligence In IT Operations Aiops Integration Summary Report Demonstration PDF provides lots of creative possibilities. It is very simple to customize and edit with the Powerpoint Software. Just drag and drop your pictures into the shapes. All facets of this template can be edited with Powerpoint no extra software is necessary. Add your own material, put your images in the places assigned for them, adjust the colors, and then you can show your slides to the world, with an animated slide included.
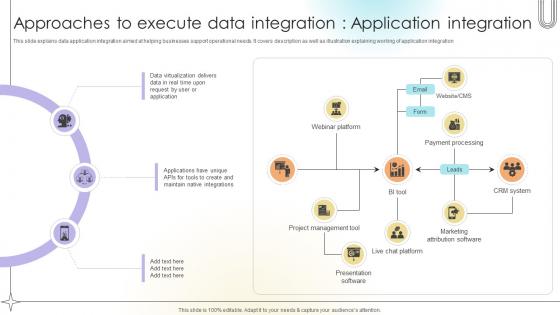
Approaches To Execute Data Integration Application Integration Data Analytics SS V
This slide explains data application integration aimed at helping businesses support operational needs. It covers description as well as illustration explaining working of application integration.Find highly impressive Approaches To Execute Data Integration Application Integration Data Analytics SS V on Slidegeeks to deliver a meaningful presentation. You can save an ample amount of time using these presentation templates. No need to worry to prepare everything from scratch because Slidegeeks experts have already done a huge research and work for you. You need to download Approaches To Execute Data Integration Application Integration Data Analytics SS V for your upcoming presentation. All the presentation templates are 100 percent editable and you can change the color and personalize the content accordingly. Download now This slide explains data application integration aimed at helping businesses support operational needs. It covers description as well as illustration explaining working of application integration.
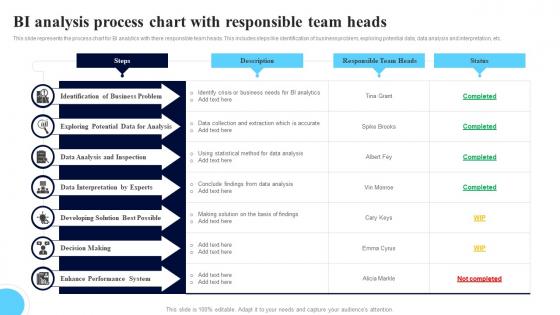
BI Analysis Process Chart With Responsible Team Heads Mockup Pdf
This slide represents the process chart for BI analytics with there responsible team heads. This includes steps like identification of business problem, exploring potential data, data analysis and interpretation, etc. Showcasing this set of slides titled BI Analysis Process Chart With Responsible Team Heads Mockup Pdf. The topics addressed in these templates are Identification Of Business, Data Analysis, Data Interpretation. All the content presented in this PPT design is completely editable. Download it and make adjustments in color, background, font etc. as per your unique business setting. This slide represents the process chart for BI analytics with there responsible team heads. This includes steps like identification of business problem, exploring potential data, data analysis and interpretation, etc.
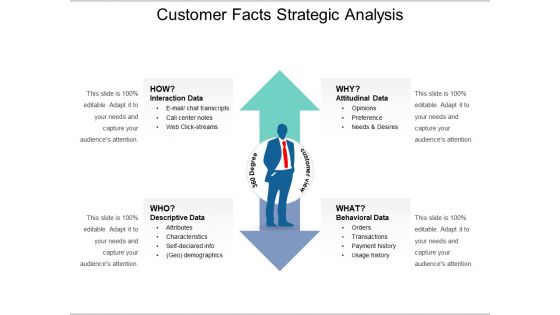
Customer Facts Strategic Analysis Ppt PowerPoint Presentation Inspiration Demonstration PDF
Presenting this set of slides with name customer facts strategic analysis ppt powerpoint presentation inspiration demonstration pdf. This is a two stage process. The stages in this process are interaction data, attitudinal data, descriptive data, behavioral data. This is a completely editable PowerPoint presentation and is available for immediate download. Download now and impress your audience.
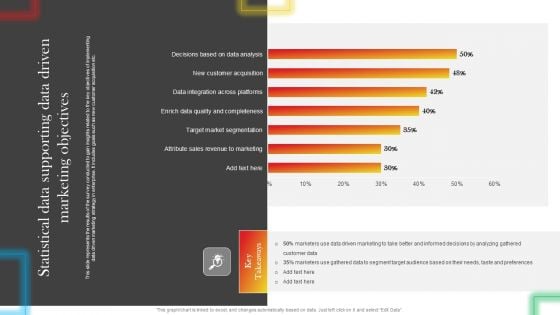
Statistical Data Supporting Data Driven Marketing Objectives Summary PDF
This slide represents the results of the survey conducted to gain insights related to the key objectives of implementing data driven marketing strategy in enterprise. It includes goals such as new customer acquisition etc. Are you in need of a template that can accommodate all of your creative concepts This one is crafted professionally and can be altered to fit any style. Use it with Google Slides or PowerPoint. Include striking photographs, symbols, depictions, and other visuals. Fill, move around, or remove text boxes as desired. Test out color palettes and font mixtures. Edit and save your work, or work with colleagues. Download Statistical Data Supporting Data Driven Marketing Objectives Summary PDF and observe how to make your presentation outstanding. Give an impeccable presentation to your group and make your presentation unforgettable.
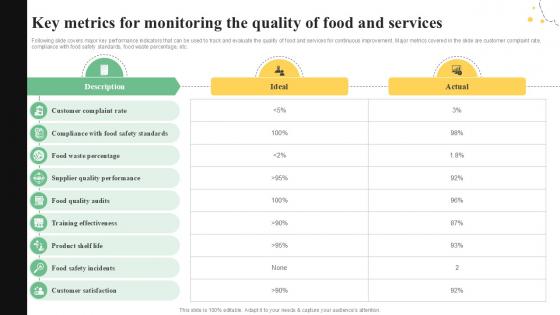
Key Metrics For Monitoring The Quality Control Guide For Food PPT Slide
Following slide covers major key performance indicators that can be used to track and evaluate the quality of food and services for continuous improvement. Major metrics covered in the slide are customer complaint rate, compliance with food safety standards, food waste percentage, etc. Explore a selection of the finest Key Metrics For Monitoring The Quality Control Guide For Food PPT Slide here. With a plethora of professionally designed and pre-made slide templates, you can quickly and easily find the right one for your upcoming presentation. You can use our Key Metrics For Monitoring The Quality Control Guide For Food PPT Slide to effectively convey your message to a wider audience. Slidegeeks has done a lot of research before preparing these presentation templates. The content can be personalized and the slides are highly editable. Grab templates today from Slidegeeks. Following slide covers major key performance indicators that can be used to track and evaluate the quality of food and services for continuous improvement. Major metrics covered in the slide are customer complaint rate, compliance with food safety standards, food waste percentage, etc.
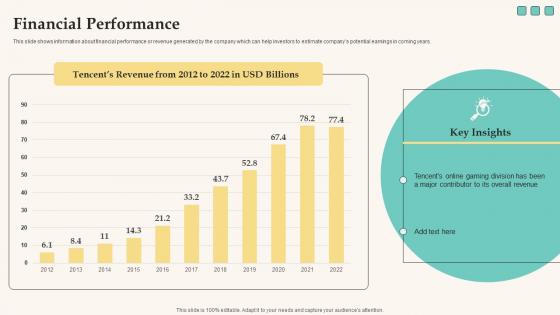
Financial Performance Elevator Pitch Deck For Funding Tech Company Infographics Pdf
This slide shows information about financial performance or revenue generated by the company which can help investors to estimate companys potential earnings in coming years. From laying roadmaps to briefing everything in detail, our templates are perfect for you. You can set the stage with your presentation slides. All you have to do is download these easy-to-edit and customizable templates. Financial Performance Elevator Pitch Deck For Funding Tech Company Infographics Pdf will help you deliver an outstanding performance that everyone would remember and praise you for. Do download this presentation today. This slide shows information about financial performance or revenue generated by the company which can help investors to estimate companys potential earnings in coming years.
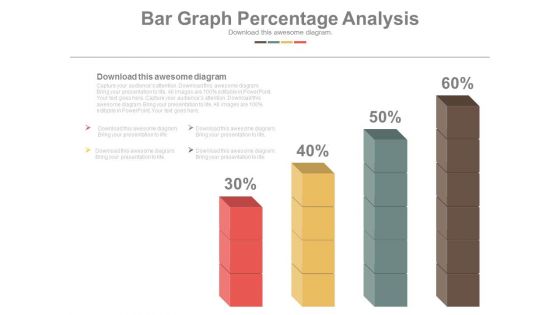
Bar Graph Displaying Profit Growth Powerpoint Slides
This PowerPoint template has been designed with six point?s bar graph with icons. This PPT slide can be used to prepare presentations for marketing reports and also for financial data analysis. You can download finance PowerPoint template to prepare awesome presentations.
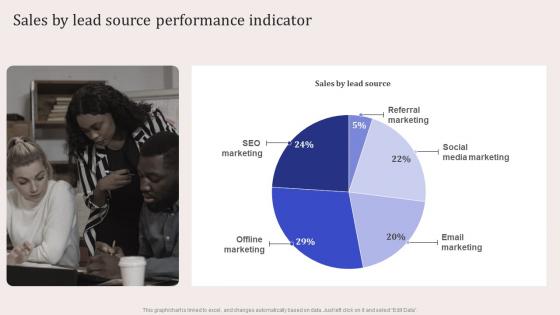
Sales By Lead Source Performance Indicator Virtual Event Promotion To Capture Infographics Pdf
The Sales By Lead Source Performance Indicator Virtual Event Promotion To Capture Infographics Pdf is a compilation of the most recent design trends as a series of slides. It is suitable for any subject or industry presentation, containing attractive visuals and photo spots for businesses to clearly express their messages. This template contains a variety of slides for the user to input data, such as structures to contrast two elements, bullet points, and slides for written information. Slidegeeks is prepared to create an impression. Our Sales By Lead Source Performance Indicator Virtual Event Promotion To Capture Infographics Pdf are topically designed to provide an attractive backdrop to any subject. Use them to look like a presentation pro.
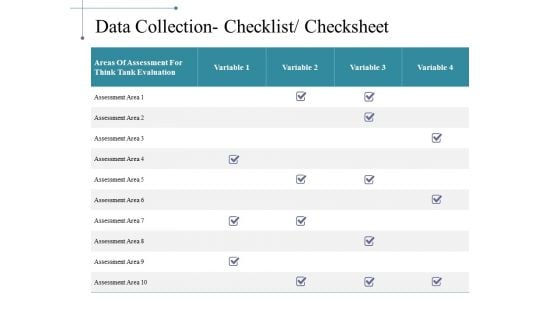
Data Collection Checklist Checksheet Ppt PowerPoint Presentation File Example File
This is a data collection checklist checksheet ppt powerpoint presentation file example file. This is a four stage process. The stages in this process are areas of assessment for think tank evaluation, table, data analysis, management.

Benefits Data Modeling DBMS Data Modeling Approaches For Modern Analytics Topics Pdf
This slide covers the benefits of data modeling such as reducing data redundancy, improved coordination, reducing complexity, minimizing cost of production, and well defined data relationships. Slidegeeks is one of the best resources for PowerPoint templates. You can download easily and regulate Benefits Data Modeling DBMS Data Modeling Approaches For Modern Analytics Topics Pdf for your personal presentations from our wonderful collection. A few clicks is all it takes to discover and get the most relevant and appropriate templates. Use our Templates to add a unique zing and appeal to your presentation and meetings. All the slides are easy to edit and you can use them even for advertisement purposes. This slide covers the benefits of data modeling such as reducing data redundancy, improved coordination, reducing complexity, minimizing cost of production, and well defined data relationships.

Gap Analysis Of Actual Vs Desired Sales Performance Enhancement Infographics Pdf
This slide illustrates gap analysis of organizational current and target state to develop action plan for filling performance gaps. It provides information about qualified leads, sales win rates, business profits and customer satisfaction rate. Do you have an important presentation coming up Are you looking for something that will make your presentation stand out from the rest Look no further than Gap Analysis Of Actual Vs Desired Sales Performance Enhancement Infographics Pdf. With our professional designs, you can trust that your presentation will pop and make delivering it a smooth process. And with Slidegeeks, you can trust that your presentation will be unique and memorable. So why wait Grab Gap Analysis Of Actual Vs Desired Sales Performance Enhancement Infographics Pdf today and make your presentation stand out from the rest. This slide illustrates gap analysis of organizational current and target state to develop action plan for filling performance gaps. It provides information about qualified leads, sales win rates, business profits and customer satisfaction rate.
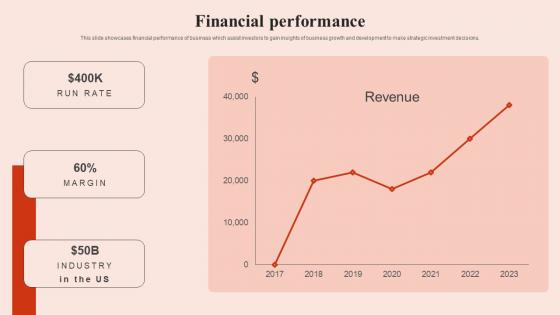
Financial Performance Beauty Brands And Retailers Company Fund Raising Infographics Pdf
This slide showcases financial performance of business which assist investors to gain insights of business growth and development to make strategic investment decisions. Boost your pitch with our creative Financial Performance Beauty Brands And Retailers Company Fund Raising Infographics Pdf. Deliver an awe-inspiring pitch that will mesmerize everyone. Using these presentation templates you will surely catch everyones attention. You can browse the ppts collection on our website. We have researchers who are experts at creating the right content for the templates. So you do not have to invest time in any additional work. Just grab the template now and use them. This slide showcases financial performance of business which assist investors to gain insights of business growth and development to make strategic investment decisions.
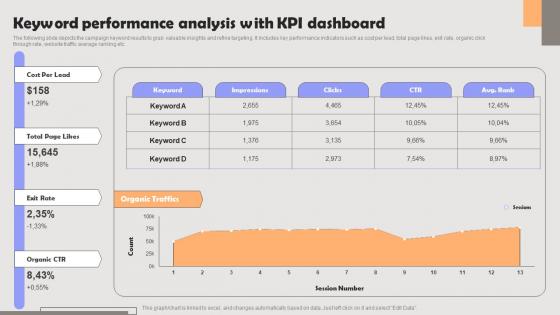
Improving PPC Campaign Results Keyword Performance Analysis With KPI Sample Pdf
The following slide depicts the campaign keyword results to grab valuable insights and refine targeting. It includes key performance indicators such as cost per lead, total page likes, exit rate, organic click through rate, website traffic average ranking etc. This Improving PPC Campaign Results Keyword Performance Analysis With KPI Sample Pdf is perfect for any presentation, be it in front of clients or colleagues. It is a versatile and stylish solution for organizing your meetings. The Improving PPC Campaign Results Keyword Performance Analysis With KPI Sample Pdf features a modern design for your presentation meetings. The adjustable and customizable slides provide unlimited possibilities for acing up your presentation. Slidegeeks has done all the homework before launching the product for you. So, do not wait, grab the presentation templates today The following slide depicts the campaign keyword results to grab valuable insights and refine targeting. It includes key performance indicators such as cost per lead, total page likes, exit rate, organic click through rate, website traffic average ranking etc.

Digital Content Performance Assessment Top Of The Funnel Digital Content Strategy SS V
The following slide depicts key performance indicators of digital content marketing to monitor results. It includes elements such as page views, social shares, click through rate, blog subscribers, conversions, opportunities influenced, average time on page etc. Find highly impressive Digital Content Performance Assessment Top Of The Funnel Digital Content Strategy SS V on Slidegeeks to deliver a meaningful presentation. You can save an ample amount of time using these presentation templates. No need to worry to prepare everything from scratch because Slidegeeks experts have already done a huge research and work for you. You need to download Digital Content Performance Assessment Top Of The Funnel Digital Content Strategy SS V for your upcoming presentation. All the presentation templates are 100 percent editable and you can change the color and personalize the content accordingly. Download now The following slide depicts key performance indicators of digital content marketing to monitor results. It includes elements such as page views, social shares, click through rate, blog subscribers, conversions, opportunities influenced, average time on page etc.
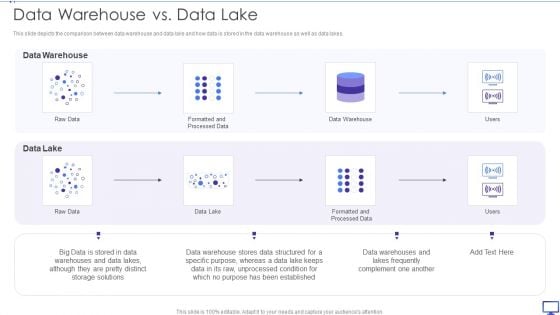
Decision Support System Data Warehouse Vs Data Lake Ppt Infographics Layout Ideas PDF
This slide depicts the comparison between data warehouse and data lake and how data is stored in the data warehouse as well as data lakes. Presenting Decision Support System Data Warehouse Vs Data Lake Ppt Infographics Layout Ideas PDF to provide visual cues and insights. Share and navigate important information on one stages that need your due attention. This template can be used to pitch topics like Data Warehouse, Data Lake, Raw Data. In addtion, this PPT design contains high resolution images, graphics, etc, that are easily editable and available for immediate download.
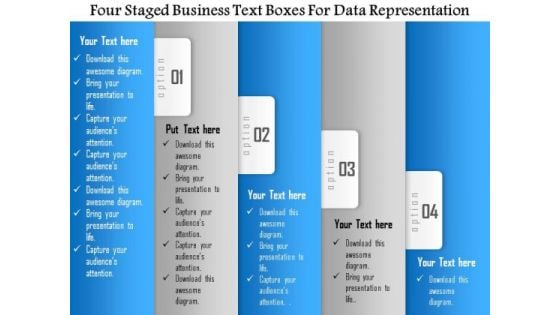
Business Diagram Four Staged Business Text Boxes For Data Representation Presentation Template
Four staged business text boxes are used to design this Power Point template slide. This PPT slide contains the concept of data representation. Use this PPT slide for your business and sales data analysis related topics in any presentation.
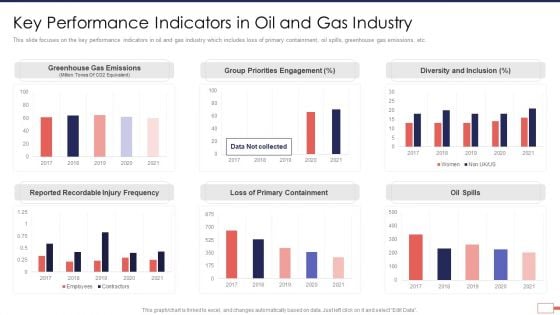
Iot Digital Twin Technology Post Covid Expenditure Management Key Performance Indicators Background PDF
This slide focuses on the key performance indicators in oil and gas industry which includes loss of primary containment, oil spills, greenhouse gas emissions, etc. Deliver an awe inspiring pitch with this creative iot digital twin technology post covid expenditure management key performance indicators background pdf bundle. Topics like key performance indicators in oil and gas industry can be discussed with this completely editable template. It is available for immediate download depending on the needs and requirements of the user.
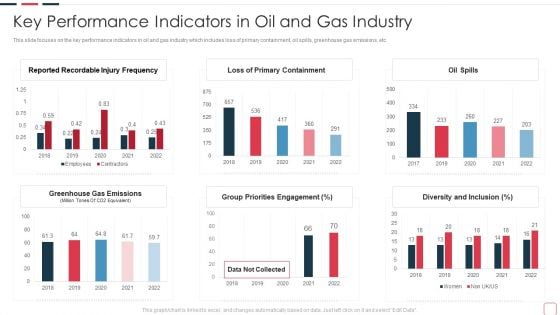
Price Benefit Internet Things Digital Twins Execution After Covid Key Performance Indicators In Oil Slides PDF
This slide focuses on the key performance indicators in oil and gas industry which includes loss of primary containment, oil spills, greenhouse gas emissions, etc. Deliver an awe inspiring pitch with this creative price benefit internet things digital twins execution after covid key performance indicators in oil slides pdf bundle. Topics like key performance indicators in oil and gas industry can be discussed with this completely editable template. It is available for immediate download depending on the needs and requirements of the user.
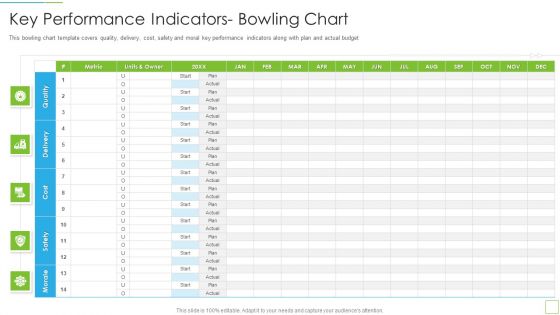
Hoshin Kanri Pitch Deck Key Performance Indicators Bowling Chart Introduction PDF
This bowling chart template covers quality, delivery, cost, safety and moral key performance indicators along with plan and actual budget Deliver an awe inspiring pitch with this creative hoshin kanri pitch deck key performance indicators bowling chart introduction pdf bundle. Topics like key performance indicators bowling chart can be discussed with this completely editable template. It is available for immediate download depending on the needs and requirements of the user.
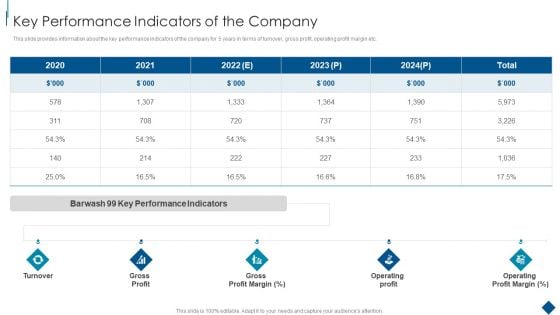
Confidential Information Memorandum Key Performance Indicators Of The Company Inspiration PDF
This slide provides information about the key performance indicators of the company for 5 years in terms of turnover, gross profit, operating profit margin etc. Deliver an awe inspiring pitch with this creative Confidential Information Memorandum Key Performance Indicators Of The Company Inspiration PDF bundle. Topics like Key Performance Indicators, Turnover Gross Profit, Gross Profit Margin can be discussed with this completely editable template. It is available for immediate download depending on the needs and requirements of the user.
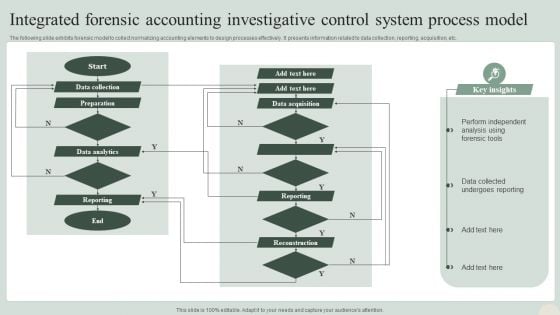
Integrated Forensic Accounting Investigative Control System Process Model Topics PDF
The following slide exhibits forensic model to collect normalizing accounting elements to design processes effectively. It presents information related to data collection, reporting, acquisition, etc. Showcasing this set of slides titled Integrated Forensic Accounting Investigative Control System Process Model Topics PDF. The topics addressed in these templates are Analysis, Data Acquisition, Data Collection. All the content presented in this PPT design is completely editable. Download it and make adjustments in color, background, font etc. as per your unique business setting.
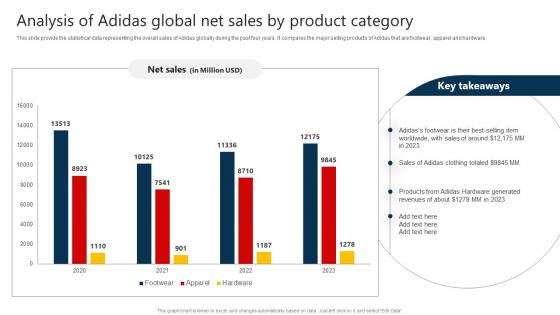
The Marketing Mix Of Analysis Of Adidas Global Net Sales By Product Category Strategy SS V
This slide provide the statistical data representing the overall sales of Adidas globally during the past four years. It compares the major selling products of Adidas that are footwear, apparel and hardware. The The Marketing Mix Of Analysis Of Adidas Global Net Sales By Product Category Strategy SS V is a compilation of the most recent design trends as a series of slides. It is suitable for any subject or industry presentation, containing attractive visuals and photo spots for businesses to clearly express their messages. This template contains a variety of slides for the user to input data, such as structures to contrast two elements, bullet points, and slides for written information. Slidegeeks is prepared to create an impression. This slide provide the statistical data representing the overall sales of Adidas globally during the past four years. It compares the major selling products of Adidas that are footwear, apparel and hardware.
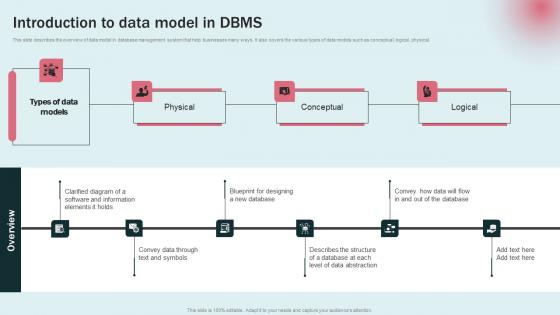
Introduction To Data Model In DBMS Data Modeling Approaches For Modern Analytics Pictures Pdf
This slide describes the overview of data model in database management system that help businesses many ways . It also covers the various types of data models such as conceptual, logical, physical. Make sure to capture your audiences attention in your business displays with our gratis customizable Introduction To Data Model In DBMS Data Modeling Approaches For Modern Analytics Pictures Pdf. These are great for business strategies, office conferences, capital raising or task suggestions. If you desire to acquire more customers for your tech business and ensure they stay satisfied, create your own sales presentation with these plain slides. This slide describes the overview of data model in database management system that help businesses many ways . It also covers the various types of data models such as conceptual, logical, physical.
Chart With Magnifying Glass For Business Research Ppt PowerPoint Presentation Inspiration Shapes
This is a chart with magnifying glass for business research ppt powerpoint presentation inspiration shapes. This is a two stage process. The stages in this process are metrics icon, kpis icon, statistics icon.
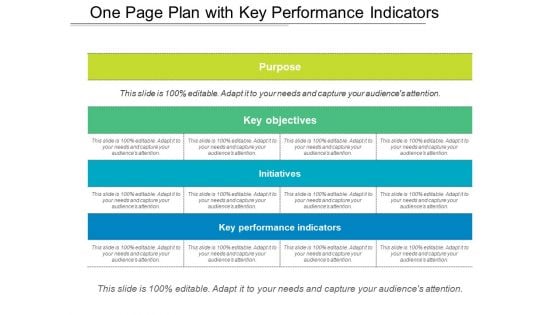
One Page Plan With Key Performance Indicators Ppt PowerPoint Presentation Model Smartart PDF
Presenting this set of slides with name one page plan with key performance indicators ppt powerpoint presentation model smartart pdf. The topics discussed in these slides are purpose, key objectives, initiatives, key performance indicators. This is a completely editable PowerPoint presentation and is available for immediate download. Download now and impress your audience.
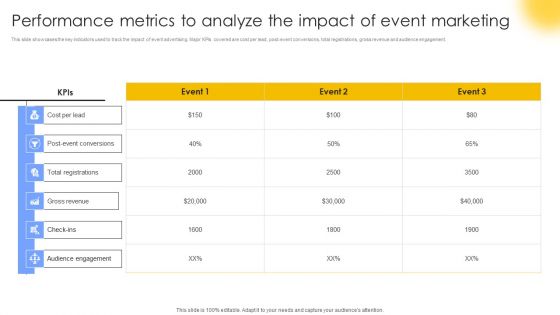
Performance Metrics To Analyze The Impact Of Event Marketing Structure PDF
This slide showcases the key indicators used to track the impact of event advertising. Major KPIs covered are cost per lead, post-event conversions, total registrations, gross revenue and audience engagement. The best PPT templates are a great way to save time, energy, and resources. Slidegeeks have 100 percent editable powerpoint slides making them incredibly versatile. With these quality presentation templates, you can create a captivating and memorable presentation by combining visually appealing slides and effectively communicating your message. Download Performance Metrics To Analyze The Impact Of Event Marketing Structure PDF from Slidegeeks and deliver a wonderful presentation.


 Continue with Email

 Home
Home


