Dashboards
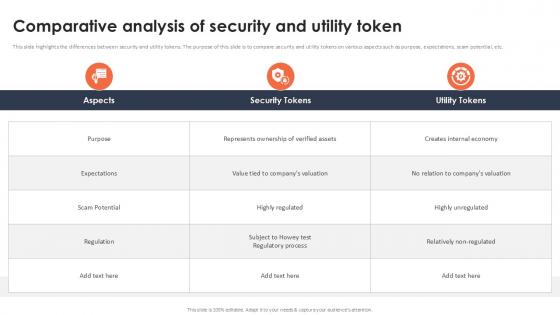
Comparative Analysis Of Security And Utility Token Securing Your Data Ppt Template
This slide highlights the differences between security and utility tokens. The purpose of this slide is to compare security and utility tokens on various aspects such as purpose, expectations, scam potential, etc. Whether you have daily or monthly meetings, a brilliant presentation is necessary. Comparative Analysis Of Security And Utility Token Securing Your Data Ppt Template can be your best option for delivering a presentation. Represent everything in detail using Comparative Analysis Of Security And Utility Token Securing Your Data Ppt Template and make yourself stand out in meetings. The template is versatile and follows a structure that will cater to your requirements. All the templates prepared by Slidegeeks are easy to download and edit. Our research experts have taken care of the corporate themes as well. So, give it a try and see the results. This slide highlights the differences between security and utility tokens. The purpose of this slide is to compare security and utility tokens on various aspects such as purpose, expectations, scam potential, etc.

Regression Model For Predictive Analytics Forward Looking Analysis IT Topics PDF
This slide represents the regression model of predictive analytics that is most commonly used in statistical analysis. This model is used to identify patterns in large amounts of data and works by calculating a formula. Presenting this PowerPoint presentation, titled Regression Model For Predictive Analytics Forward Looking Analysis IT Topics PDF, with topics curated by our researchers after extensive research. This editable presentation is available for immediate download and provides attractive features when used. Download now and captivate your audience. Presenting this Regression Model For Predictive Analytics Forward Looking Analysis IT Topics PDF. Our researchers have carefully researched and created these slides with all aspects taken into consideration. This is a completely customizable Regression Model For Predictive Analytics Forward Looking Analysis IT Topics PDF that is available for immediate downloading. Download now and make an impact on your audience. Highlight the attractive features available with our PPTs.
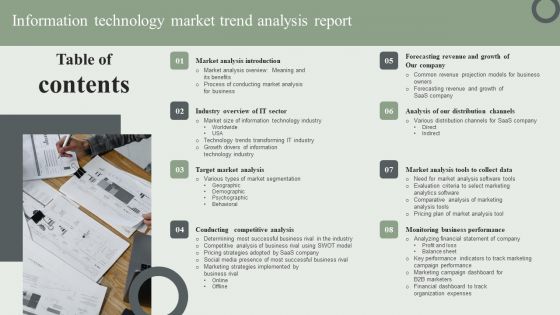
Table Of Contents Information Technology Market Trend Analysis Report Ppt PowerPoint Presentation File Inspiration PDF
Crafting an eye catching presentation has never been more straightforward. Let your presentation shine with this tasteful yet straightforward Table Of Contents Information Technology Market Trend Analysis Report Ppt PowerPoint Presentation File Inspiration PDF template. It offers a minimalistic and classy look that is great for making a statement. The colors have been employed intelligently to add a bit of playfulness while still remaining professional. Construct the ideal Table Of Contents Information Technology Market Trend Analysis Report Ppt PowerPoint Presentation File Inspiration PDF that effortlessly grabs the attention of your audience. Begin now and be certain to wow your customers.
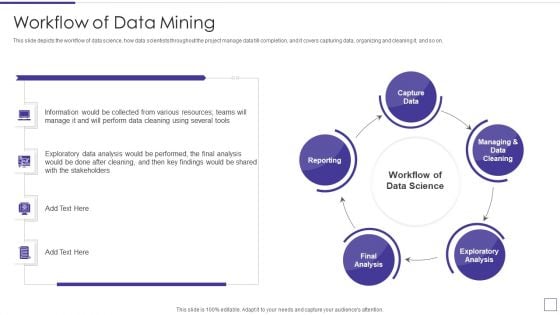
Data Mining Implementation Workflow Of Data Mining Microsoft PDF
This slide depicts the workflow of data science, how data scientists throughout the project manage data till completion, and it covers capturing data, organizing and cleaning it, and so on.This is a data mining implementation workflow of data mining microsoft pdf template with various stages. Focus and dispense information on five stages using this creative set, that comes with editable features. It contains large content boxes to add your information on topics like capture data, managing and data cleaning, exploratory analysis You can also showcase facts, figures, and other relevant content using this PPT layout. Grab it now.
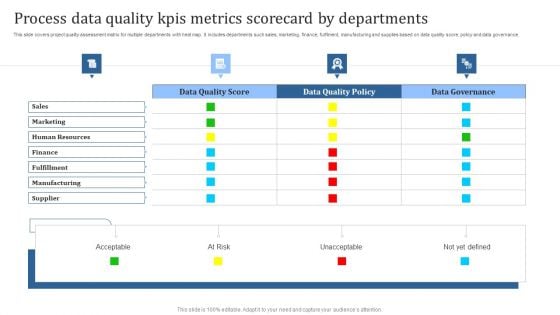
Process Data Quality Kpis Metrics Scorecard By Departments Template PDF
This slide covers project quality assessment matrix for multiple departments with heat map. It includes departments such sales, marketing, finance, fulfilment, manufacturing and supplies based on data quality score, policy and data governance. Showcasing this set of slides titled Process Data Quality Kpis Metrics Scorecard By Departments Template PDF. The topics addressed in these templates are Acceptable, At Risk, Unacceptable. All the content presented in this PPT design is completely editable. Download it and make adjustments in color, background, font etc. as per your unique business setting.
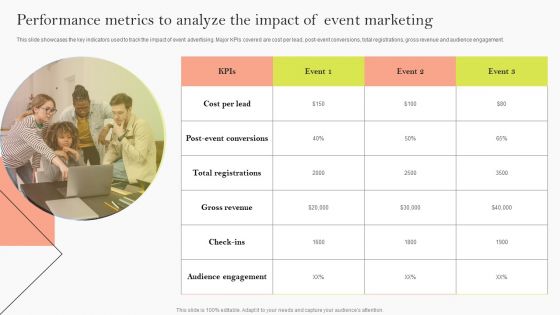
Performance Metrics To Analyze The Impact Of Event Marketing Ppt Model Good PDF
This slide showcases the key indicators used to track the impact of event advertising. Major KPIs covered are cost per lead, post-event conversions, total registrations, gross revenue and audience engagement. This modern and well arranged Performance Metrics To Analyze The Impact Of Event Marketing Ppt Model Good PDF provides lots of creative possibilities. It is very simple to customize and edit with the Powerpoint Software. Just drag and drop your pictures into the shapes. All facets of this template can be edited with Powerpoint no extra software is necessary. Add your own material, put your images in the places assigned for them, adjust the colors, and then you can show your slides to the world, with an animated slide included.

Remote Healthcare Services Industry Report Powerpoint Presentation Slides IR V

Global Security Industry Report Ppt Presentation IR CD V

Cryptocurrency Industry Report Powerpoint Presentation Slides Ppt Slides
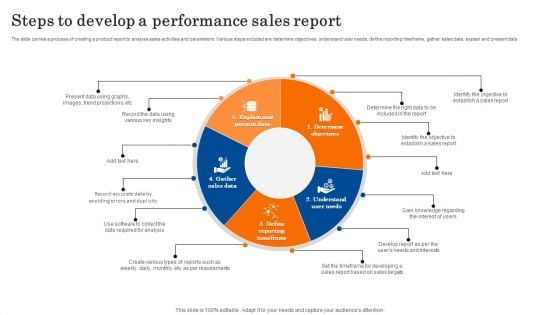
Steps To Develop A Performance Sales Report Mockup PDF
The slide carries a process of creating a product report to analyse sales activities and parameters. Various steps included are determine objectives, understand user needs, define reporting timeframe, gather sales data, explain and present data. Persuade your audience using this Steps To Develop A Performance Sales Report Mockup PDF. This PPT design covers five stages, thus making it a great tool to use. It also caters to a variety of topics including Determine Objectives, Understand User Needs, Define Reporting Timeframe. Download this PPT design now to present a convincing pitch that not only emphasizes the topic but also showcases your presentation skills.

Various Metrics To Analyze Business Project Evaluation Inspiration PDF
This slide signifies the various key performance indicator or metrics to evaluate project investment. It covers information about metrics like net present value, discount cash flow, expected commercial value and weighted average cost of capital. Pitch your topic with ease and precision using this Various Metrics To Analyze Business Project Evaluation Inspiration PDF. This layout presents information on KPI, Metrics, Key Description, Expected, Actual, Variance. It is also available for immediate download and adjustment. So, changes can be made in the color, design, graphics or any other component to create a unique layout.

Competitive Intelligence Guide To Determine Market Other Methods For Data Collection Ideas Pdf
This slide showcases various methods to collect data which are subscription and registration data, in store traffic monitoring, forms, transactional data and observations. Its purpose is to ensure reliable data is gathered for statistical analysis. Formulating a presentation can take up a lot of effort and time, so the content and message should always be the primary focus. The visuals of the PowerPoint can enhance the presenters message, so our Competitive Intelligence Guide To Determine Market Other Methods For Data Collection Ideas Pdf was created to help save time. Instead of worrying about the design, the presenter can concentrate on the message while our designers work on creating the ideal templates for whatever situation is needed. Slidegeeks has experts for everything from amazing designs to valuable content, we have put everything into Competitive Intelligence Guide To Determine Market Other Methods For Data Collection Ideas Pdf. This slide showcases various methods to collect data which are subscription and registration data, in store traffic monitoring, forms, transactional data and observations. Its purpose is to ensure reliable data is gathered for statistical analysis.
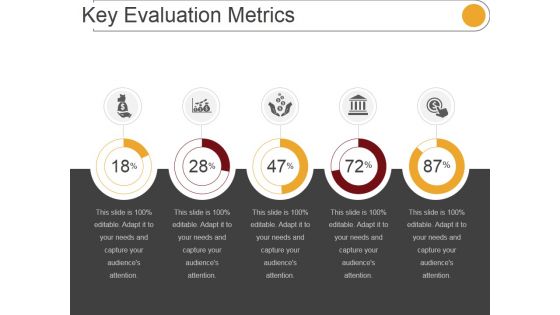
Key Evaluation Metrics Ppt PowerPoint Presentation Influencers
This is a key evaluation metrics ppt powerpoint presentation influencers. This is a five stage process. The stages in this process are icons, percentage, marketing, management.
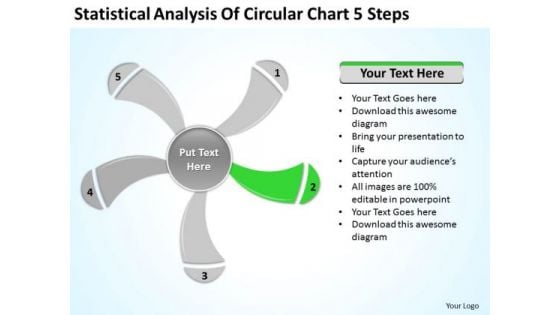
Statistical Analysis Of Circular Chart 5 Steps Ppt Business Plan PowerPoint Slide
We present our statistical analysis of circular chart 5 steps ppt business plan PowerPoint Slide.Download and present our Business PowerPoint Templates because Our PowerPoint Templates and Slides will definately Enhance the stature of your presentation. Adorn the beauty of your thoughts with their colourful backgrounds. Use our Signs PowerPoint Templates because Our PowerPoint Templates and Slides will give good value for money. They also have respect for the value of your time. Download our Shapes PowerPoint Templates because Our PowerPoint Templates and Slides team portray an attitude of elegance. Personify this quality by using them regularly. Use our Metaphors-Visual Concepts PowerPoint Templates because Our PowerPoint Templates and Slides will effectively help you save your valuable time. They are readymade to fit into any presentation structure. Use our Process and Flows PowerPoint Templates because our PowerPoint Templates and Slides are the string of your bow. Fire of your ideas and conquer the podium.Use these PowerPoint slides for presentations relating to graphically, graphic, vector, layout, business, computation, sign, infochart, visual, symbol, template, diagram, calculations, sector, data, revenue, schedule, element, analysis, drawing, report, technology, contour, classification, graph, modern, illustration, icon, comparison, object, chart, collection, science, color, growth, composition, professional, set, education, math, profits, information, symmetry, statistic, structure, infographics, button. The prominent colors used in the PowerPoint template are Green, Gray, White. Get a blue-chip client list with your ideas. Attract the best customers with our Statistical Analysis Of Circular Chart 5 Steps Ppt Business Plan PowerPoint Slide.
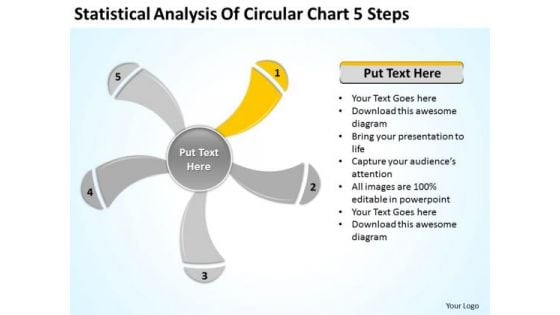
Statistical Analysis Of Circular Chart 5 Steps Ppt Business Plan PowerPoint Slides
We present our statistical analysis of circular chart 5 steps ppt business plan PowerPoint Slides.Download and present our Business PowerPoint Templates because Timeline crunches are a fact of life. Meet all deadlines using our PowerPoint Templates and Slides. Present our Signs PowerPoint Templates because You can Zap them with our PowerPoint Templates and Slides. See them reel under the impact. Use our Shapes PowerPoint Templates because It can Bubble and burst with your ideas. Download our Metaphors-Visual Concepts PowerPoint Templates because You can Create a matrix with our PowerPoint Templates and Slides. Feel the strength of your ideas click into place. Present our Process and Flows PowerPoint Templates because Our PowerPoint Templates and Slides has conjured up a web of all you need with the help of our great team. Use them to string together your glistening ideas.Use these PowerPoint slides for presentations relating to graphically, graphic, vector, layout, business, computation, sign, infochart, visual, symbol, template, diagram, calculations, sector, data, revenue, schedule, element, analysis, drawing, report, technology, contour, classification, graph, modern, illustration, icon, comparison, object, chart, collection, science, color, growth, composition, professional, set, education, math, profits, information, symmetry, statistic, structure, infographics, button. The prominent colors used in the PowerPoint template are Yellow, Gray, White. Use our Statistical Analysis Of Circular Chart 5 Steps Ppt Business Plan PowerPoint Slides to brainstorm. You will be amazed at the ideas that emerge.
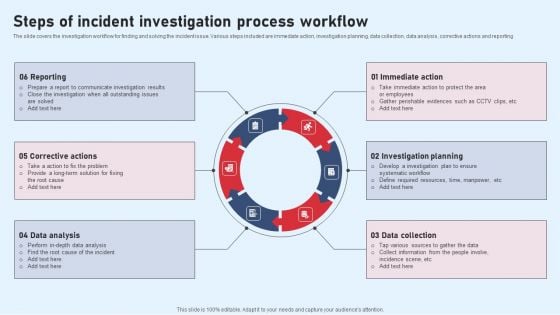
Steps Of Incident Investigation Process Workflow Designs PDF
The slide covers the investigation workflow for finding and solving the incident issue. Various steps included are immediate action, investigation planning, data collection, data analysis, corrective actions and reporting Presenting Steps Of Incident Investigation Process Workflow Designs PDF to dispense important information. This template comprises six stages. It also presents valuable insights into the topics including Reporting, Corrective Actions, Data Analysis. This is a completely customizable PowerPoint theme that can be put to use immediately. So, download it and address the topic impactfully.
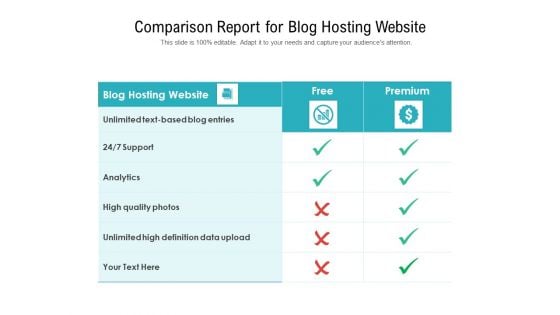
Comparison Report For Blog Hosting Website Ppt PowerPoint Presentation Inspiration Slideshow PDF
Pitch your topic with ease and precision using this comparison report for blog hosting website ppt powerpoint presentation inspiration slideshow pdf. This layout presents information on blog hosting website, premium, analytics, high quality photos, unlimited high definition data upload. It is also available for immediate download and adjustment. So, changes can be made in the color, design, graphics or any other component to create a unique layout.
Icons Slide For Information Technology Market Trend Analysis Report Ppt PowerPoint Presentation File Ideas PDF
Introducing our well designed Icons Slide For Information Technology Market Trend Analysis Report Ppt PowerPoint Presentation File Ideas PDF set of slides. The slide displays editable icons to enhance your visual presentation. The icons can be edited easily. So customize according to your business to achieve a creative edge. Download and share it with your audience.
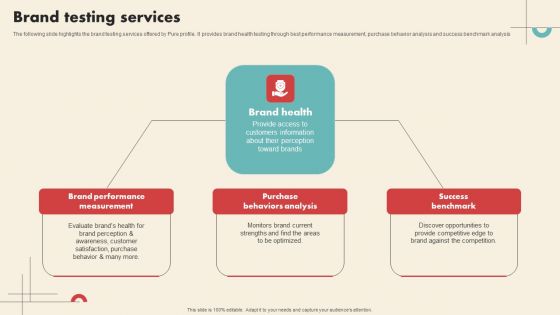
Data Driven Marketing Solutions Firm Company Profile Brand Testing Services Structure PDF
The following slide highlights the brand testing services offered by Pure profile. It provides brand health testing through best performance measurement, purchase behavior analysis and success benchmark analysis Create an editable Data Driven Marketing Solutions Firm Company Profile Brand Testing Services Structure PDF that communicates your idea and engages your audience. Whether youre presenting a business or an educational presentation, pre designed presentation templates help save time. Data Driven Marketing Solutions Firm Company Profile Brand Testing Services Structure PDF is highly customizable and very easy to edit, covering many different styles from creative to business presentations. Slidegeeks has creative team members who have crafted amazing templates. So, go and get them without any delay.

Key Metrics Ppt PowerPoint Presentation Professional Slideshow
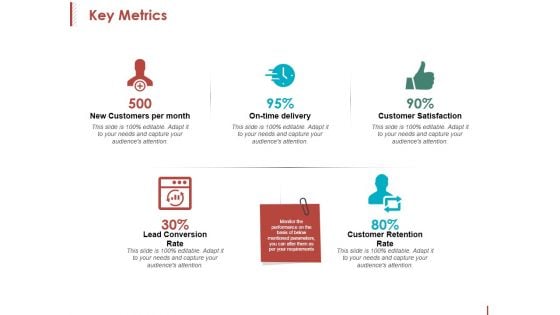
This is a key metrics ppt powerpoint presentation professional slideshow. This is a five stage process. The stages in this process are new customers per month, on time delivery, customer satisfaction, lead conversion rate, customer retention rate.
Key Metrics Ppt PowerPoint Presentation Inspiration Format
This is a key metrics ppt powerpoint presentation inspiration format. This is a five stage process. The stages in this process are new customers per month, on time delivery, customer satisfaction, customer retention rate.
Classified Data Memo Record With Strategic Goals Table Of Contents Marketing Portrait PDF
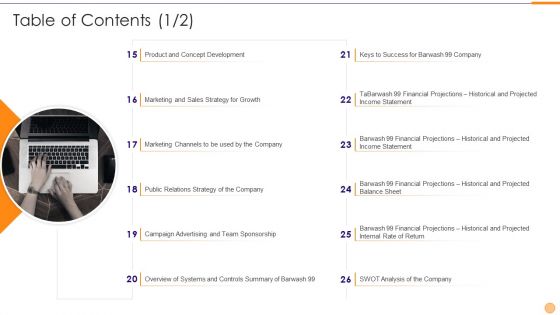
This is a classified data memo record with strategic goals table of contents marketing portrait pdf template with various stages. Focus and dispense information on twelve stages using this creative set, that comes with editable features. It contains large content boxes to add your information on topics like analysis, financial, campaign, strategy, marketing. You can also showcase facts, figures, and other relevant content using this PPT layout. Grab it now.
Gear Infographic For Business Analysis PowerPoint Templates
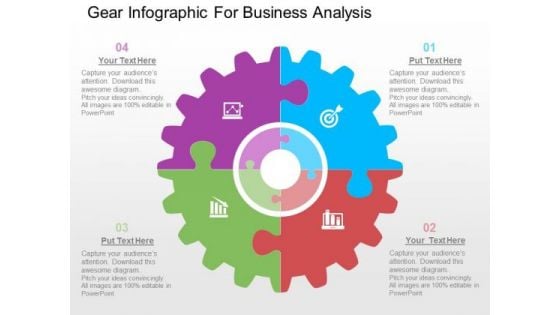
Our above slide contains diagram of gear infographic. This gear infographic slide helps to exhibit business analysis. Use this diagram to impart more clarity to data and to create more sound impact on viewers.
Integrated Business Analysis Powerpoint Slides Design
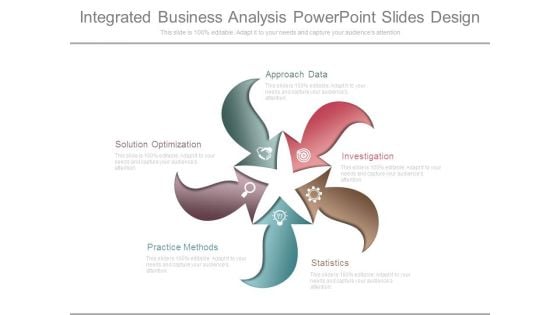
This is a integrated business analysis powerpoint slides design. This is a five stage process. The stages in this process are approach data, investigation, statistics, practice methods, solution optimization.
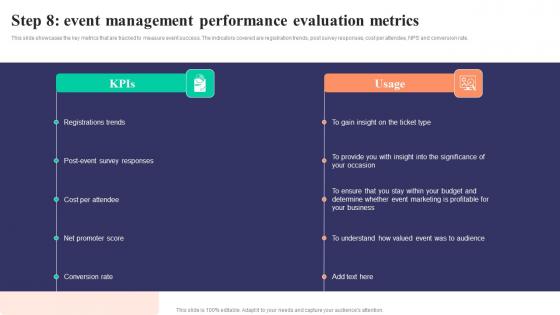
Step 8 Event Management Performance Strategies To Develop Successful Mockup Pdf
This slide showcases the key metrics that are tracked to measure event success. The indicators covered are registration trends, post survey responses, cost per attendee, NPS and conversion rate. This Step 8 Event Management Performance Strategies To Develop Successful Mockup Pdf from Slidegeeks makes it easy to present information on your topic with precision. It provides customization options, so you can make changes to the colors, design, graphics, or any other component to create a unique layout. It is also available for immediate download, so you can begin using it right away. Slidegeeks has done good research to ensure that you have everything you need to make your presentation stand out. Make a name out there for a brilliant performance. This slide showcases the key metrics that are tracked to measure event success. The indicators covered are registration trends, post survey responses, cost per attendee, NPS and conversion rate.
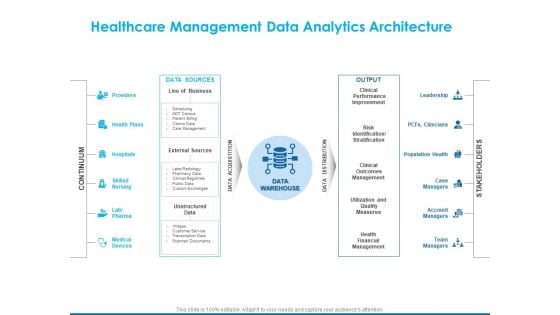
Overview Healthcare Business Management Healthcare Management Data Analytics Architecture Guidelines PDF
Presenting this set of slides with name overview healthcare business management healthcare management data analytics architecture guidelines pdf. The topics discussed in these slides are providers, health plans, hospitals, skilled nursing, lab or pharma, medical devices. This is a completely editable PowerPoint presentation and is available for immediate download. Download now and impress your audience.
Transforming Big Data Analytics To Knowledge Icons Slide Ppt Infographic Template Tips PDF
Introducing our well designed transforming big data analytics to knowledge icons slide ppt infographic template tips pdf set of slides. The slide displays editable icons to enhance your visual presentation. The icons can be edited easily. So customize according to your business to achieve a creative edge. Download and share it with your audience.
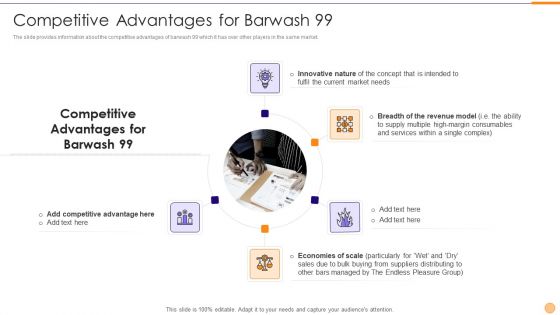
Classified Data Memo Record With Strategic Goals Competitive Advantages For Barwash 99 Background PDF
The slide provides information about the competitive advantages of barwash 99 which it has over other players in the same market. This is a classified data memo record with strategic goals competitive advantages for barwash 99 background pdf template with various stages. Focus and dispense information on five stages using this creative set, that comes with editable features. It contains large content boxes to add your information on topics like economies of scale, breadth of the revenue model, innovative nature. You can also showcase facts, figures, and other relevant content using this PPT layout. Grab it now.
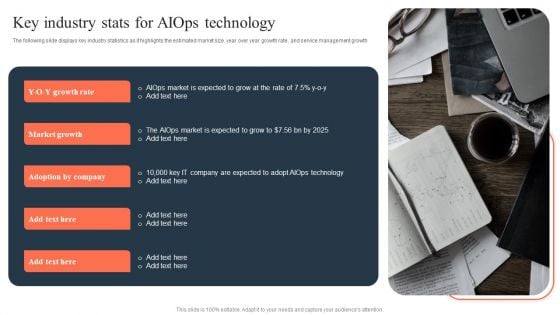
Ml And Big Data In Information Technology Processes Key Industry Stats For Aiops Technology Background PDF
The following slide displays key industry statistics as it highlights the estimated market size, year over year growth rate, and service management growth The best PPT templates are a great way to save time, energy, and resources. Slidegeeks have 100 percent editable powerpoint slides making them incredibly versatile. With these quality presentation templates, you can create a captivating and memorable presentation by combining visually appealing slides and effectively communicating your message. Download Ml And Big Data In Information Technology Processes Key Industry Stats For Aiops Technology Background PDF from Slidegeeks and deliver a wonderful presentation.
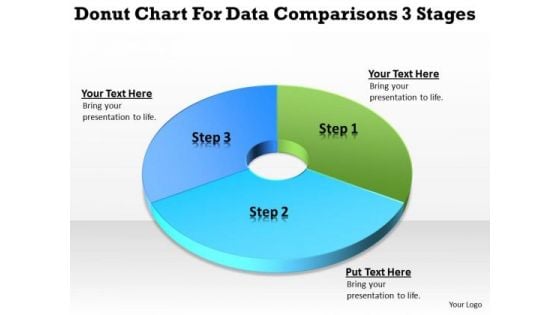
Donut Chart For Data Comparisons 3 Stages Business Planning PowerPoint Slides
We present our donut chart for data comparisons 3 stages business planning PowerPoint Slides.Present our Business PowerPoint Templates because It will Strengthen your hand with your thoughts. They have all the aces you need to win the day. Use our Finance PowerPoint Templates because You will get more than you ever bargained for. Use our Circle Charts PowerPoint Templates because It will Give impetus to the hopes of your colleagues. Our PowerPoint Templates and Slides will aid you in winning their trust. Present our Shapes PowerPoint Templates because You can Raise a toast with our PowerPoint Templates and Slides. Spread good cheer amongst your audience. Download our Process and Flows PowerPoint Templates because Our PowerPoint Templates and Slides help you meet the demand of the Market. Just browse and pick the slides that appeal to your intuitive senses.Use these PowerPoint slides for presentations relating to chart, donut, market, isolated, diminishing, rate, downtrend, business, three-dimensional, success, presentation, diagram, circle, uptrend, percentage, graphic, finance, data, stock, holdings, report, marketing, analyzing, trading, graph, illustration, pie, sale, up, money, design, currency, growth, descriptive, representing, painting, moving, progress, part, increases, background, investment, index, financial, multi, counter, portion, exchange. The prominent colors used in the PowerPoint template are Blue , Blue light, Green. Upgrade your presentation with our Donut Chart For Data Comparisons 3 Stages Business Planning PowerPoint Slides. Download without worries with our money back guaranteee.
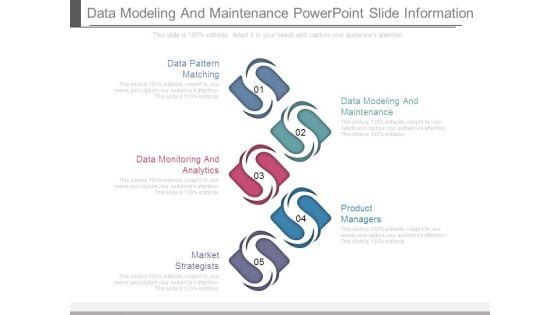
Data Modeling And Maintenance Powerpoint Slide Information
This is a data modeling and maintenance powerpoint slide information. This is a five stage process. The stages in this process are data pattern matching, data modeling and maintenance, data monitoring and analytics, product managers, market strategists.
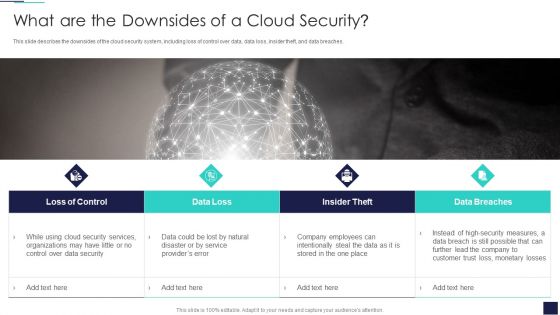
Cloud Information Security What Are The Downsides Of A Cloud Security Ppt Infographics Files PDF
This slide describes the downsides of the cloud security system, including loss of control over data, data loss, insider theft, and data breaches. Presenting Cloud Information Security What Are The Downsides Of A Cloud Security Ppt Infographics Files PDF to provide visual cues and insights. Share and navigate important information on four stages that need your due attention. This template can be used to pitch topics like Data Loss, Loss Control, Insider Theft, Data Breaches. In addtion, this PPT design contains high resolution images, graphics, etc, that are easily editable and available for immediate download.
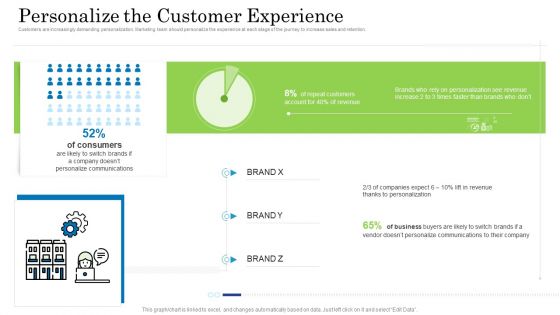
Customer Behavioral Data And Analytics Personalize The Customer Experience Guidelines PDF
Customers are increasingly demanding personalization. Marketing team should personalize the experience at each stage of the journey to increase sales and retention. Deliver an awe inspiring pitch with this creative customer behavioral data and analytics personalize the customer experience guidelines pdf bundle. Topics like very satisfied, satisfied, neutral, dissatisfied, very dissatisfied can be discussed with this completely editable template. It is available for immediate download depending on the needs and requirements of the user.
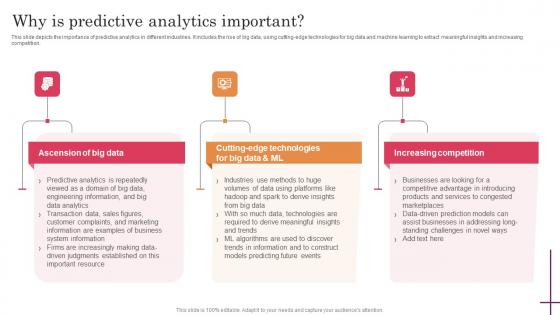
Why Is Predictive Analytics Important Predictive Analytics For Improved Guidelines Pdf
This slide depicts the importance of predictive analytics in different industries. It includes the rise of big data, using cutting-edge technologies for big data and machine learning to extract meaningful insights and increasing competition. If your project calls for a presentation, then Slidegeeks is your go-to partner because we have professionally designed, easy-to-edit templates that are perfect for any presentation. After downloading, you can easily edit Why Is Predictive Analytics Important Predictive Analytics For Improved Guidelines Pdf and make the changes accordingly. You can rearrange slides or fill them with different images. Check out all the handy templates This slide depicts the importance of predictive analytics in different industries. It includes the rise of big data, using cutting-edge technologies for big data and machine learning to extract meaningful insights and increasing competition.
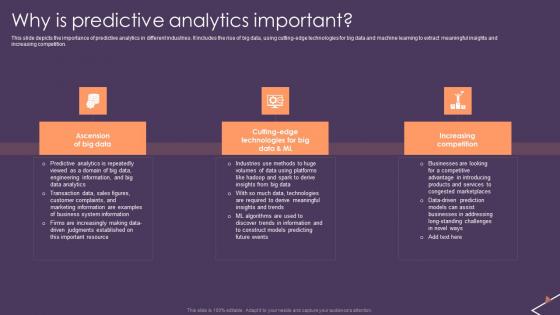
Predictive Analytics For Empowering Why Is Predictive Analytics Important Pictures Pdf
This slide depicts the importance of predictive analytics in different industries. It includes the rise of big data, using cutting-edge technologies for big data and machine learning to extract meaningful insights and increasing competition. Slidegeeks is here to make your presentations a breeze with Predictive Analytics For Empowering Why Is Predictive Analytics Important Pictures Pdf With our easy-to-use and customizable templates, you can focus on delivering your ideas rather than worrying about formatting. With a variety of designs to choose from, you are sure to find one that suits your needs. And with animations and unique photos, illustrations, and fonts, you can make your presentation pop. So whether you are giving a sales pitch or presenting to the board, make sure to check out Slidegeeks first. This slide depicts the importance of predictive analytics in different industries. It includes the rise of big data, using cutting-edge technologies for big data and machine learning to extract meaningful insights and increasing competition.
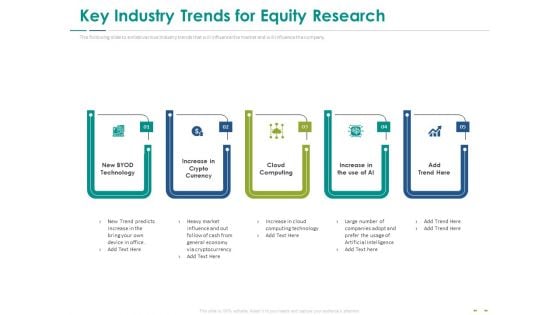
Stock Market Research Report Key Industry Trends For Equity Research Mockup PDF
The following slide to enlists various Industry trends that will influence the market and will influence the company. This is a stock market research report key industry trends for equity research mockup pdf template with various stages. Focus and dispense information on five stages using this creative set, that comes with editable features. It contains large content boxes to add your information on topics like new byod technology, increase crypto currency, coud computing, increase use ai. You can also showcase facts, figures, and other relevant content using this PPT layout. Grab it now.
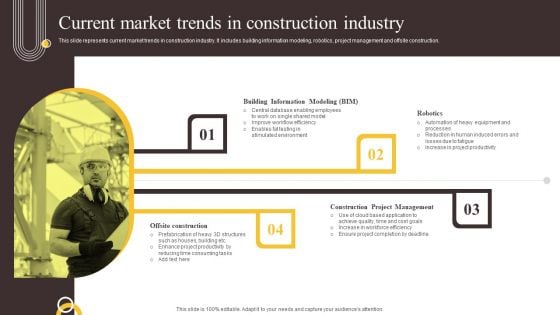
Global Construction Sector Industry Report Current Market Trends In Construction Industry Demonstration PDF
This slide represents current market trends in construction industry. It includes building information modeling, robotics, project management and offsite construction. This modern and well arranged Global Construction Sector Industry Report Current Market Trends In Construction Industry Demonstration PDF provides lots of creative possibilities. It is very simple to customize and edit with the Powerpoint Software. Just drag and drop your pictures into the shapes. All facets of this template can be edited with Powerpoint no extra software is necessary. Add your own material, put your images in the places assigned for them, adjust the colors, and then you can show your slides to the world, with an animated slide included.

Christmas Scene Festival PowerPoint Backgrounds And Templates 1210
Microsoft PowerPoint Template and Background with Snapshots of Christmas scenes on textured red background Empowerment is the aim of our Christmas Scene Festival PowerPoint Backgrounds And Templates 1210. They put their all behind your thoughts.
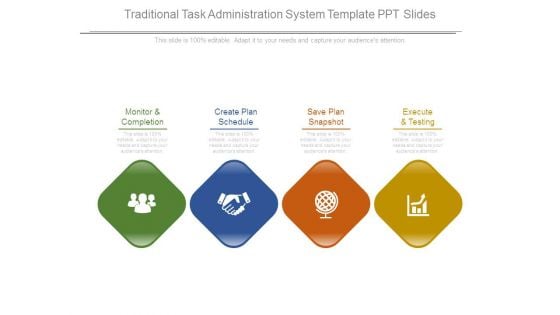
Traditional Task Administration System Template Ppt Slides
This is a traditional task administration system template ppt slides. This is a four stage process. The stages in this process are monitor and completion, create plan schedule, save plan snapshot, execute and testing.
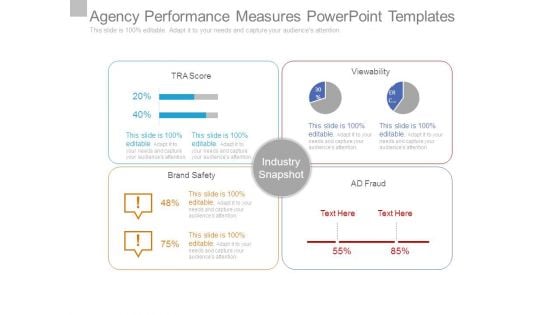
Agency Performance Measures Powerpoint Templates
This is a agency performance measures powerpoint templates. This is a four stage process. The stages in this process are industry snapshot, brand safety, ad fraud, viewability, tra score.
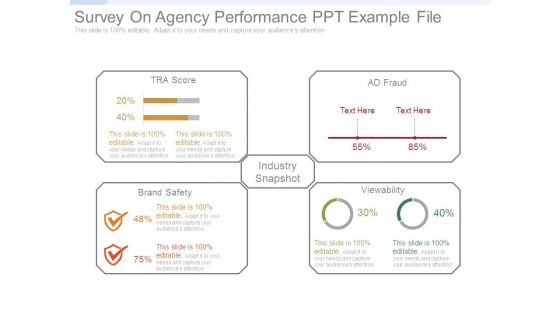
Survey On Agency Performance Ppt Example File
This is a survey on agency performance ppt example file. This is a four stage process. The stages in this process are industry snapshot, brand safety, ad fraud, viewability, tra score.
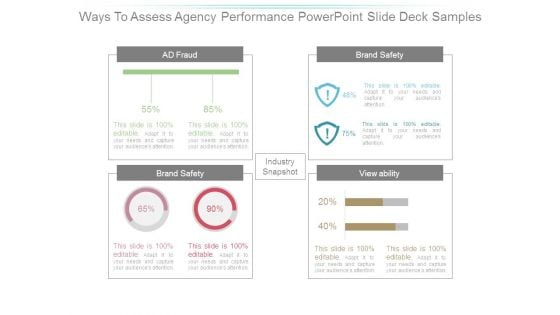
Ways To Assess Agency Performance Powerpoint Slide Deck Samples
This is a ways to assess agency performance powerpoint slide deck samples. This is a four stage process. The stages in this process are industry snapshot, brand safety, ad fraud, viewability, tra score.
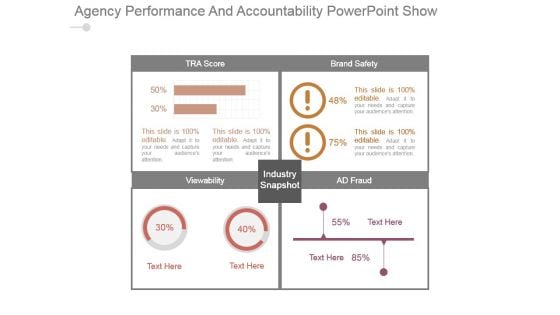
Agency Performance And Accountability Powerpoint Show
This is a agency performance and accountability powerpoint show. This is a four stage process. The stages in this process are tra score, brand safety, view ability, ad fraud, industry snapshot.
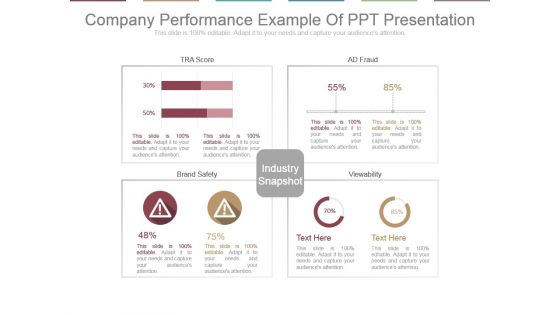
Company Performance Example Of Ppt Presentation
This is a company performance example of ppt presentation. This is a four stage process. The stages in this process are tra score, ad fraud, brand safety, view ability, industry snapshot.
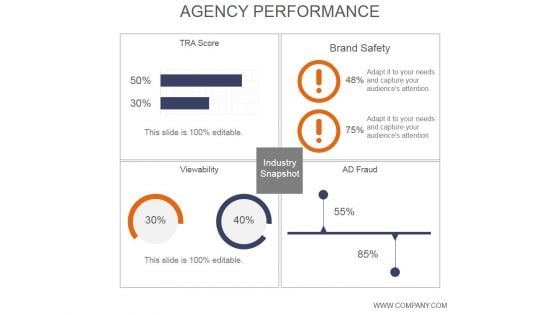
Agency Performance Ppt PowerPoint Presentation Layout
This is a agency performance ppt powerpoint presentation layout. This is a four stage process. The stages in this process are tra score, viewability, industry snapshot, brand safety, ad fraud.
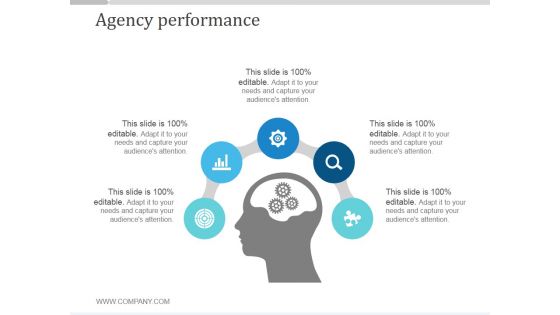
Agency Performance Slide2 Ppt PowerPoint Presentation Deck
This is a agency performance slide2 ppt powerpoint presentation deck. This is a four stage process. The stages in this process are tra store, ad fraud, brand safety, industry snapshot, viewability.
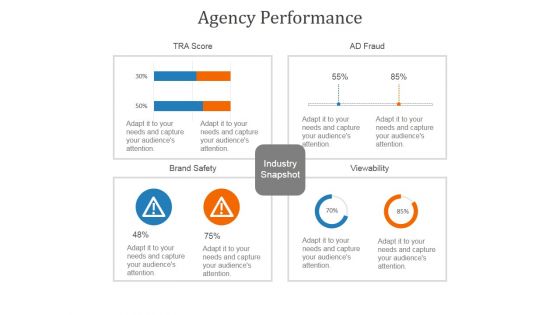
Agency Performance Template 2 Ppt PowerPoint Presentation Background Images
This is a agency performance template 2 ppt powerpoint presentation background images. This is a four stage process. The stages in this process are brand safety, viewability, industry snapshot.
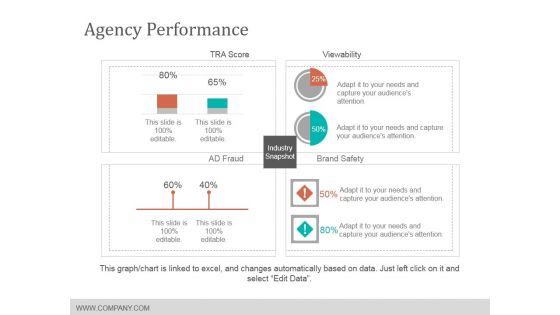
Agency Performance Template 2 Ppt Powerpoint Presentation Slides Designs
This is a agency performance template 2 ppt powerpoint presentation slides designs. This is a four stage process. The stages in this process are tra score, viewability, brand safety, industry snapshot.
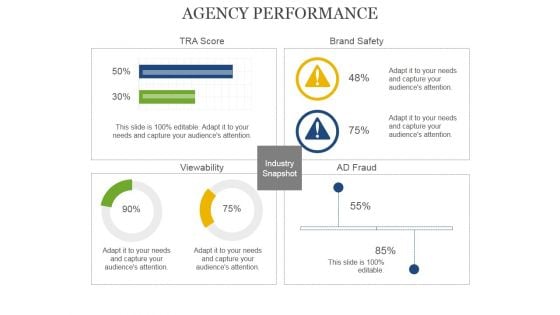
Agency Performance Template 2 Ppt PowerPoint Presentation Graphics
This is a agency performance template 2 ppt powerpoint presentation graphics. This is a four stage process. The stages in this process are view ability, ad fraud, industry snapshot, brand safety, tra score.
Total Marketing Concepts Many 5 Stages Flow Chart Business Strategy Plan Template
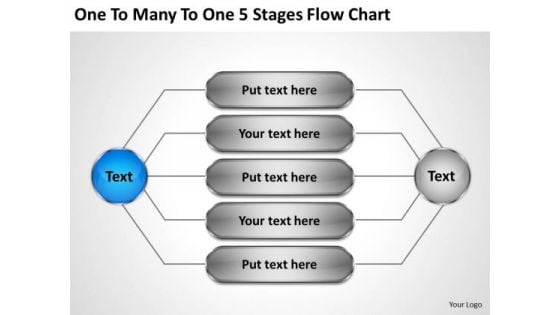
We present our total marketing concepts many 5 stages flow chart business strategy plan template.Use our Business PowerPoint Templates because You are well armed with penetrative ideas. Our PowerPoint Templates and Slides will provide the gunpowder you need. Use our Marketing PowerPoint Templates because Our PowerPoint Templates and Slides provide you with a vast range of viable options. Select the appropriate ones and just fill in your text. Present our Circle Charts PowerPoint Templates because our PowerPoint Templates and Slides will give your ideas the shape. Use our Communication PowerPoint Templates because These PowerPoint Templates and Slides will give the updraft to your ideas. See them soar to great heights with ease. Use our Process and Flows PowerPoint Templates because Our PowerPoint Templates and Slides are focused like a searchlight beam. They highlight your ideas for your target audience.Use these PowerPoint slides for presentations relating to chart, options, flow, arrow, diagram, circular, isolated, sequence, numbers, square, choose, statement, corporate, order, business, sequential, vector, consecutive, presentation, template, circle, data, description, cog, report, marketing, work-flow, illustration, connection, strategy, registry, catalog, segments, web, text, banner, five, progress, information, demonstration, navigation, 4, structure, button, goals, communication. The prominent colors used in the PowerPoint template are Blue, Gray, Black. Exhibit high fibre with our Total Marketing Concepts Many 5 Stages Flow Chart Business Strategy Plan Template. They display your fearless character.
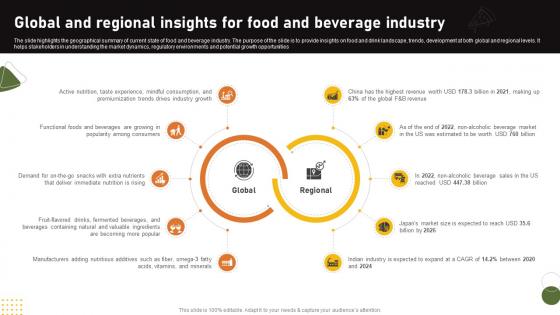
Food And Drink Industry Report Global And Regional Insights For Food And Beverage Industry IR SS V
The slide highlights the geographical summary of current state of food and beverage industry. The purpose of the slide is to provide insights on food and drink landscape, trends, development at both global and regional levels. It helps stakeholders in understanding the market dynamics, regulatory environments and potential growth opportunities. If your project calls for a presentation, then Slidegeeks is your go-to partner because we have professionally designed, easy-to-edit templates that are perfect for any presentation. After downloading, you can easily edit Food And Drink Industry Report Global And Regional Insights For Food And Beverage Industry IR SS V and make the changes accordingly. You can rearrange slides or fill them with different images. Check out all the handy templates The slide highlights the geographical summary of current state of food and beverage industry. The purpose of the slide is to provide insights on food and drink landscape, trends, development at both global and regional levels. It helps stakeholders in understanding the market dynamics, regulatory environments and potential growth opportunities.
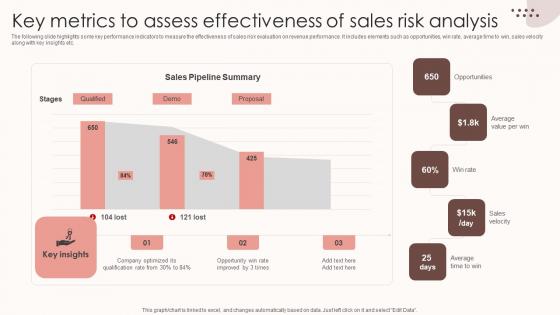
Assessing Sales Risks Key Metrics To Assess Effectiveness Of Sales Risk Analysis Diagrams PDF
The following slide highlights some key performance indicators to measure the effectiveness of sales risk evaluation on revenue performance. It includes elements such as opportunities, win rate, average time to win, sales velocity along with key insights etc. This Assessing Sales Risks Key Metrics To Assess Effectiveness Of Sales Risk Analysis Diagrams PDF is perfect for any presentation, be it in front of clients or colleagues. It is a versatile and stylish solution for organizing your meetings. The Assessing Sales Risks Key Metrics To Assess Effectiveness Of Sales Risk Analysis Diagrams PDF features a modern design for your presentation meetings. The adjustable and customizable slides provide unlimited possibilities for acing up your presentation. Slidegeeks has done all the homework before launching the product for you. So, do not wait, grab the presentation templates today The following slide highlights some key performance indicators to measure the effectiveness of sales risk evaluation on revenue performance. It includes elements such as opportunities, win rate, average time to win, sales velocity along with key insights etc.
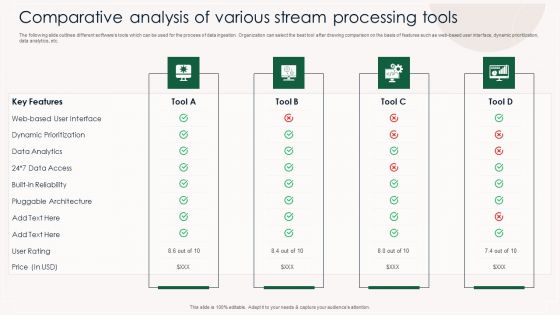
Comparative Analysis Of Various Stream Processing Tools Demonstration PDF
The following slide outlines different softwares tools which can be used for the process of data ingestion. Organization can select the best tool after drawing comparison on the basis of features such as web-based user interface, dynamic prioritization, data analytics, etc. Showcasing this set of slides titled Comparative Analysis Of Various Stream Processing Tools Demonstration PDF. The topics addressed in these templates are Data Analytics, Key Features, Dynamic Prioritization. All the content presented in this PPT design is completely editable. Download it and make adjustments in color, background, font etc. as per your unique business setting.
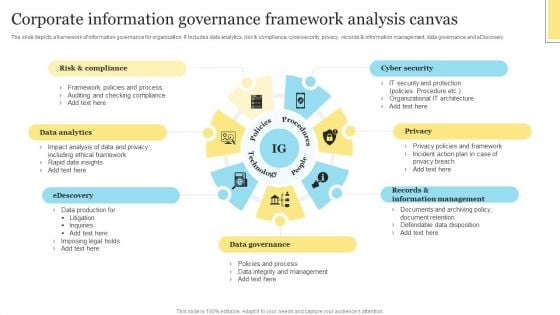
Corporate Information Governance Framework Analysis Canvas Clipart PDF
The slide depicts a framework of information governance for organization. It includes data analytics, risk and compliance, cybersecurity, privacy, records and information management, data governance and eDiscovery. Persuade your audience using this Corporate Information Governance Framework Analysis Canvas Clipart PDF. This PPT design covers four stages, thus making it a great tool to use. It also caters to a variety of topics including Risk Compliance, Data Analytics, Edescovery. Download this PPT design now to present a convincing pitch that not only emphasizes the topic but also showcases your presentation skills.
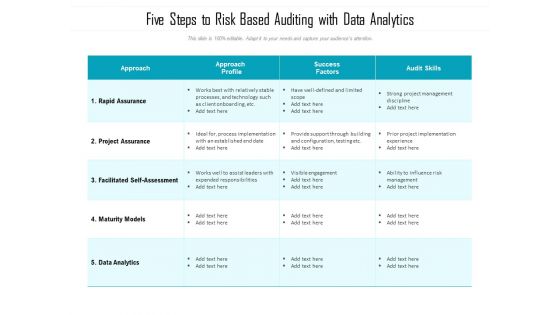
Five Steps To Risk Based Auditing With Data Analytics Ppt PowerPoint Presentation File Grid PDF
Showcasing this set of slides titled five steps to risk based auditing with data analytics ppt powerpoint presentation file grid pdf. The topics addressed in these templates are data analytics, implementation, management. All the content presented in this PPT design is completely editable. Download it and make adjustments in color, background, font etc. as per your unique business setting.
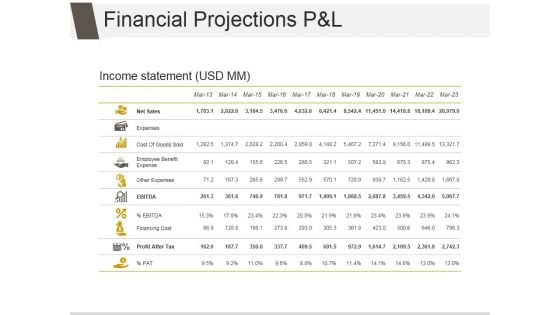
Financial Projections P And L Ppt PowerPoint Presentation Design Ideas
This is a financial projections p and l ppt powerpoint presentation design ideas. This is a eleven stage process. The stages in this process are net sales, expenses, cost of goods sold, employee benefit expense, other expenses, financing cost.
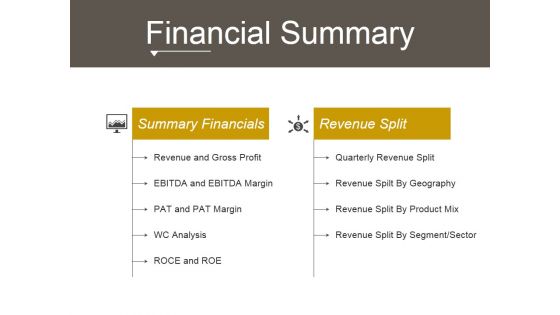
Financial Summary Ppt PowerPoint Presentation Information
This is a financial summary ppt powerpoint presentation information. This is a two stage process. The stages in this process are revenue and gross profit, quarterly revenue split, revenue spilt by geography, revenue split by product mix, revenue split by segment sector.
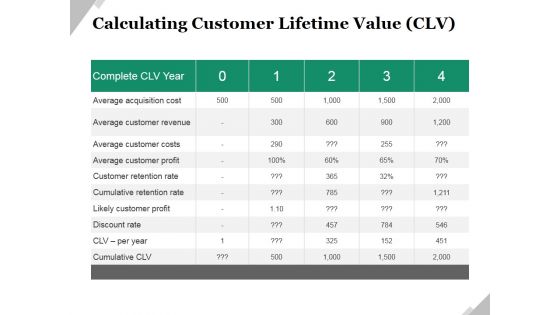
Calculating Customer Lifetime Value Clv Ppt PowerPoint Presentation Styles Good
This is a calculating customer lifetime value clv ppt powerpoint presentation styles good. This is a five stage process. The stages in this process are average acquisition cost, average customer revenue, average customer costs, average customer profit, customer retention rate, cumulative retention rate, likely customer profit.
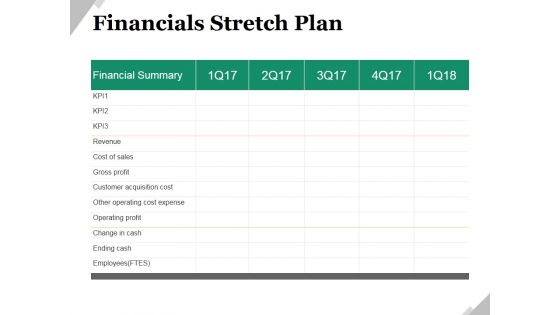
Financials Stretch Plan Ppt PowerPoint Presentation Ideas Shapes
This is a financials stretch plan ppt powerpoint presentation ideas shapes. This is a five stage process. The stages in this process are revenue, cost of sales, gross profit, customer acquisition cost, other operating cost expense, operating profit.
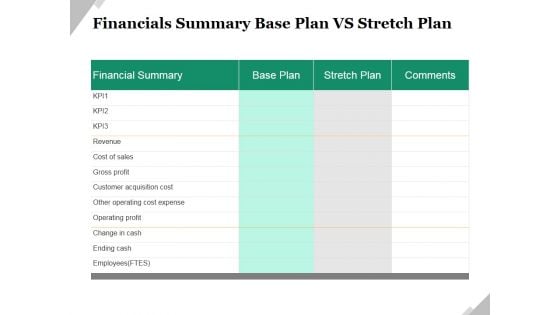
Financials Summary Base Plan Vs Stretch Plan Ppt PowerPoint Presentation Slides Information
This is a financials summary base plan vs stretch plan ppt powerpoint presentation slides information. This is a two stage process. The stages in this process are revenue, cost of sales, gross profit, customer acquisition cost, other operating cost expense, operating profit.


 Continue with Email

 Home
Home


