Dashboards
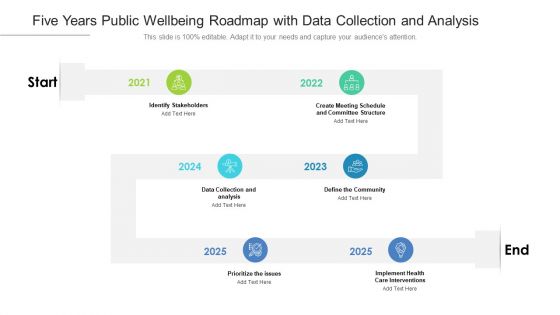
Five Years Public Wellbeing Roadmap With Data Collection And Analysis Topics
Presenting the five years public wellbeing roadmap with data collection and analysis topics. The template includes a roadmap that can be used to initiate a strategic plan. Not only this, the PowerPoint slideshow is completely editable and you can effortlessly modify the font size, font type, and shapes according to your needs. This PPT slide can be easily reached in standard screen and widescreen aspect ratios. The set is also available in various formats like PDF, PNG, and JPG. So download and use it multiple times as per your knowledge.
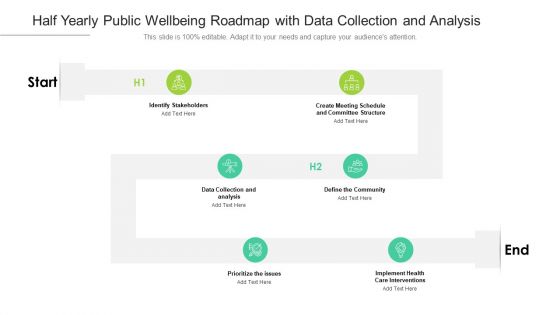
Half Yearly Public Wellbeing Roadmap With Data Collection And Analysis Graphics
Presenting the half yearly public wellbeing roadmap with data collection and analysis graphics. The template includes a roadmap that can be used to initiate a strategic plan. Not only this, the PowerPoint slideshow is completely editable and you can effortlessly modify the font size, font type, and shapes according to your needs. This PPT slide can be easily reached in standard screen and widescreen aspect ratios. The set is also available in various formats like PDF, PNG, and JPG. So download and use it multiple times as per your knowledge.
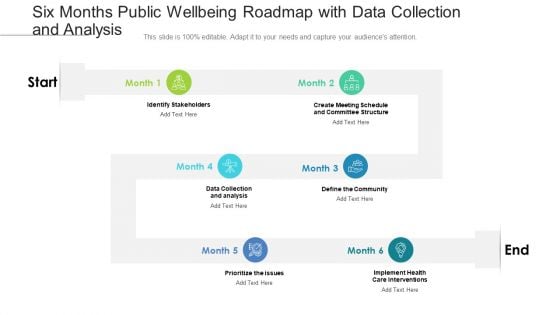
Six Months Public Wellbeing Roadmap With Data Collection And Analysis Clipart
Presenting the six months public wellbeing roadmap with data collection and analysis clipart. The template includes a roadmap that can be used to initiate a strategic plan. Not only this, the PowerPoint slideshow is completely editable and you can effortlessly modify the font size, font type, and shapes according to your needs. This PPT slide can be easily reached in standard screen and widescreen aspect ratios. The set is also available in various formats like PDF, PNG, and JPG. So download and use it multiple times as per your knowledge.
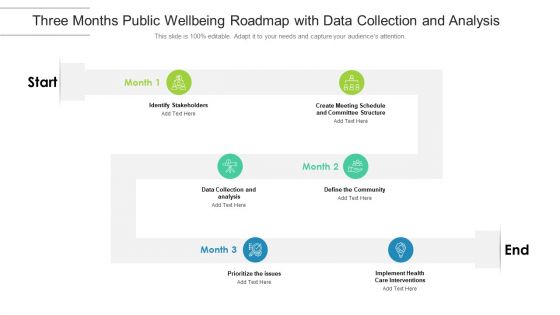
Three Months Public Wellbeing Roadmap With Data Collection And Analysis Guidelines
Presenting the three months public wellbeing roadmap with data collection and analysis guidelines. The template includes a roadmap that can be used to initiate a strategic plan. Not only this, the PowerPoint slideshow is completely editable and you can effortlessly modify the font size, font type, and shapes according to your needs. This PPT slide can be easily reached in standard screen and widescreen aspect ratios. The set is also available in various formats like PDF, PNG, and JPG. So download and use it multiple times as per your knowledge.
Business Operation Modeling Approaches Cost Of Quality Data Analysis Tool Icons PDF
This slide provides the glimpse about the cost of quality technique which focuses on cost of conformance such as prevention and appraisal cost and non conformance such as internal and external failure costs.This is a business operation modeling approaches cost of quality data analysis tool icons pdf template with various stages. Focus and dispense information on two stages using this creative set, that comes with editable features. It contains large content boxes to add your information on topics like cost of quality, cost of conformance, external failure costs You can also showcase facts, figures, and other relevant content using this PPT layout. Grab it now.
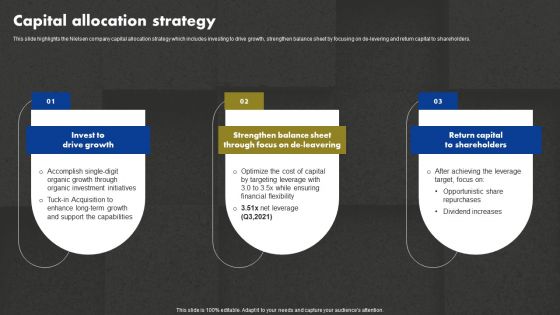
Data And Customer Analysis Company Outline Capital Allocation Strategy Information PDF

Data And Customer Analysis Company Outline Diversified And Growing Business Elements PDF
This slide highlights the Nielsen diversified and growing business which includes solutions revenue share, customer base and revenue by geography, contracted revenue and years of experience. Find a pre designed and impeccable Data And Customer Analysis Company Outline Diversified And Growing Business Elements PDF. The templates can ace your presentation without additional effort. You can download these easy to edit presentation templates to make your presentation stand out from others. So, what are you waiting for Download the template from Slidegeeks today and give a unique touch to your presentation.
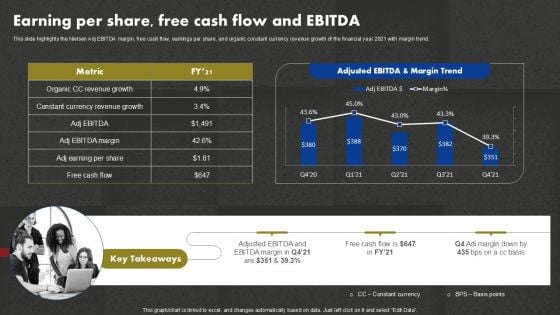
Data And Customer Analysis Company Outline Earning Per Share Free Cash Flow And EBITDA Structure PDF
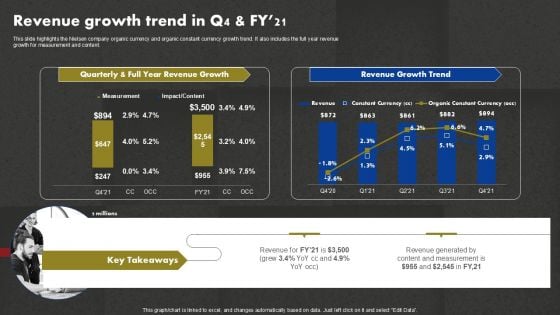
Data And Customer Analysis Company Outline Revenue Growth Trend In Q4 And Fy21 Template PDF
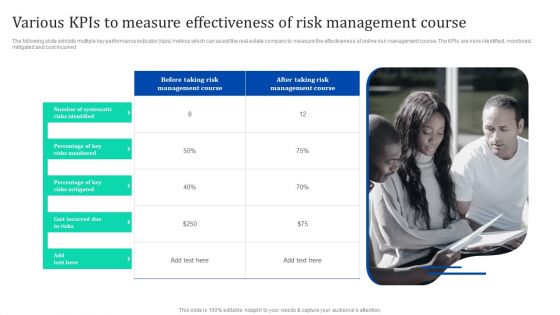
Various KPIS To Measure Effectiveness Of Risk Management Enhancing Process Improvement By Regularly Information PDF
The following slide exhibits multiple key performance indicator kpis metrics which can assist the real estate company to measure the effectiveness of online risk management course. The KPIs are risks identified, monitored, mitigated and cost incurred. Get a simple yet stunning designed Various KPIS To Measure Effectiveness Of Risk Management Enhancing Process Improvement By Regularly Information PDF. It is the best one to establish the tone in your meetings. It is an excellent way to make your presentations highly effective. So, download this PPT today from Slidegeeks and see the positive impacts. Our easy-to-edit Various KPIS To Measure Effectiveness Of Risk Management Enhancing Process Improvement By Regularly Information PDF can be your go-to option for all upcoming conferences and meetings. So, what are you waiting for Grab this template today.
Data And Analytics Roadmap Developing Algorithm Digital Data Analytics Ppt PowerPoint Presentation Complete Deck
Presenting this set of slides with name data and analytics roadmap developing algorithm digital data analytics ppt powerpoint presentation complete deck. The topics discussed in these slides are developing, algorithm, digital data analytics, data governance, optimizations. This is a completely editable PowerPoint presentation and is available for immediate download. Download now and impress your audience.
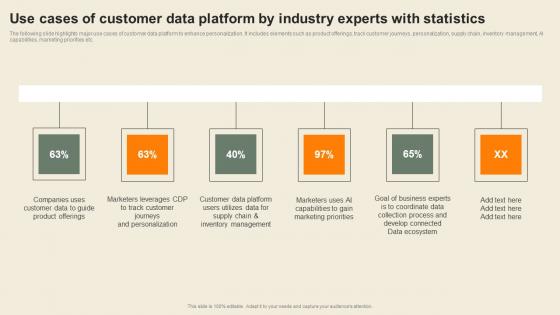
Use Cases Of Customer Data Platform By Industry Usability Of CDP Software Tool Mockup Pdf
The following slide highlights major use cases of customer data platform to enhance personalization. It includes elements such as product offerings, track customer journeys, personalization, supply chain, inventory management, AI capabilities, marketing priorities etc. Present like a pro with Use Cases Of Customer Data Platform By Industry Usability Of CDP Software Tool Mockup Pdf Create beautiful presentations together with your team, using our easy-to-use presentation slides. Share your ideas in real-time and make changes on the fly by downloading our templates. So whether you are in the office, on the go, or in a remote location, you can stay in sync with your team and present your ideas with confidence. With Slidegeeks presentation got a whole lot easier. Grab these presentations today. The following slide highlights major use cases of customer data platform to enhance personalization. It includes elements such as product offerings, track customer journeys, personalization, supply chain, inventory management, AI capabilities, marketing priorities etc.
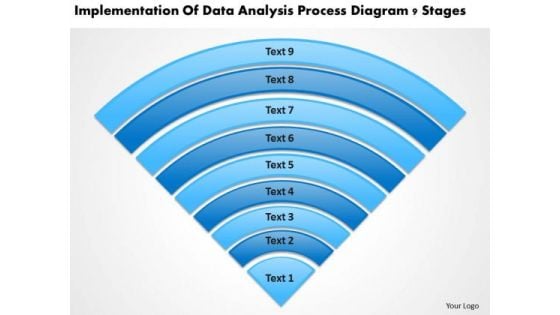
Data Analysis Process Diagram 9 Stages Help With Business Plan PowerPoint Slides
We present our data analysis process diagram 9 stages help with business plan PowerPoint Slides.Use our Computer PowerPoint Templates because Our PowerPoint Templates and Slides will let you Leave a lasting impression to your audiences. They possess an inherent longstanding recall factor. Use our Communication PowerPoint Templates because you can Break through with our PowerPoint Templates and Slides. Bring down the mental barriers of your audience. Use our Semicircles PowerPoint Templates because Our PowerPoint Templates and Slides will let your words and thoughts hit bullseye everytime. Present our Shapes PowerPoint Templates because Our PowerPoint Templates and Slides will let you meet your Deadlines. Use our Business PowerPoint Templates because Our PowerPoint Templates and Slides have the Brilliant backdrops. Guaranteed to illuminate the minds of your audience.Use these PowerPoint slides for presentations relating to Catalogue, chart, checking, choice, circle, swatch, computer, design, equipment, fan, gamma, guide, mix, object, paint, palette, pantone, paper, press, print, printout, process, profile, publishing, rainbow, round, scale, select, selection, semicircle, spectrum, system, template, typographic, typography, variation. The prominent colors used in the PowerPoint template are Blue, Gray, Black. Identify targets with our Data Analysis Process Diagram 9 Stages Help With Business Plan PowerPoint Slides. Download without worries with our money back guaranteee.
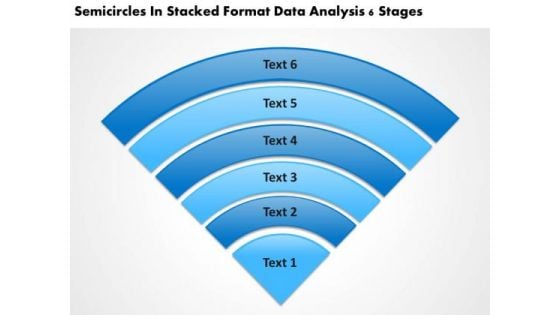
In Stacked Format Data Analysis 6 Stages Agency Business Plan PowerPoint Templates
We present our in stacked format data analysis 6 stages agency business plan PowerPoint templates.Use our Business PowerPoint Templates because You are working at that stage with an air of royalty. Let our PowerPoint Templates and Slides be the jewels in your crown. Download and present our Leadership PowerPoint Templates because Our PowerPoint Templates and Slides offer you the needful to organise your thoughts. Use them to list out your views in a logical sequence. Present our Layers PowerPoint Templates because Your audience will believe you are the cats whiskers. Download our Shapes PowerPoint Templates because Our PowerPoint Templates and Slides has conjured up a web of all you need with the help of our great team. Use them to string together your glistening ideas. Download and present our Triangles PowerPoint Templates because They will Put your wonderful verbal artistry on display. Our PowerPoint Templates and Slides will provide you the necessary glam and glitter.Use these PowerPoint slides for presentations relating to layers, icon, stratum, 3d, surface, isolated, segment, grow, blank, presentation, illustration, section, cutting, coat, set, background, thickness, spread, multiple. The prominent colors used in the PowerPoint template are Blue light, Blue navy, White. Arrive at your desired destination. Complete the distance with our In Stacked Format Data Analysis 6 Stages Agency Business Plan PowerPoint Templates.
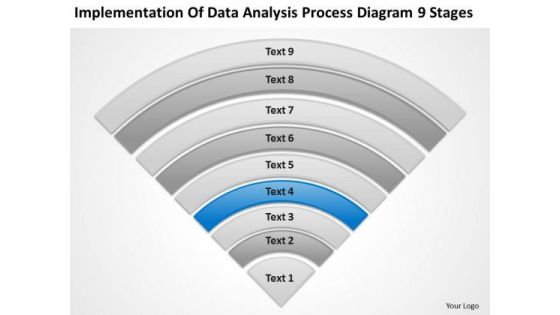
Data Analysis Process Diagram 9 Stages Develop Business Plan PowerPoint Slides
We present our data analysis process diagram 9 stages develop business plan PowerPoint Slides.Present our Process and Flows PowerPoint Templates because You should Press the right buttons with our PowerPoint Templates and Slides. They will take your ideas down the perfect channel. Download and present our Flow Charts PowerPoint Templates because Our PowerPoint Templates and Slides are created with admirable insight. Use them and give your group a sense of your logical mind. Use our Business PowerPoint Templates because Our PowerPoint Templates and Slides provide you with a vast range of viable options. Select the appropriate ones and just fill in your text. Download our Shapes PowerPoint Templates because Our PowerPoint Templates and Slides offer you the widest possible range of options. Download and present our Triangles PowerPoint Templates because Our PowerPoint Templates and Slides will let you Hit the target. Go the full distance with ease and elan.Use these PowerPoint slides for presentations relating to Saturation, strip, saturated, line, spectrum, pantone, bright, diagram, circle, sampler, guide, element, paint, scale,shape, ten, multicolored, palette, illustration, spectral, guidance, chart, collection, abstraction, selection, choice, visible, variation, painter, contrast, ,gradient, pattern, chooser, analyzer. The prominent colors used in the PowerPoint template are Blue, White, Gray. Brake for no one with our Data Analysis Process Diagram 9 Stages Develop Business Plan PowerPoint Slides. You will come out on top.
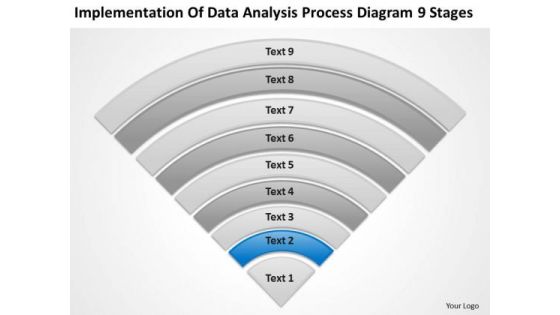
Data Analysis Process Diagram 9 Stages Ppt Business Plan PowerPoint Slide
We present our data analysis process diagram 9 stages ppt business plan PowerPoint Slide.Download our Process and Flows PowerPoint Templates because Our PowerPoint Templates and Slides will help you be quick off the draw. Just enter your specific text and see your points hit home. Use our Flow Charts PowerPoint Templates because Our PowerPoint Templates and Slides will definately Enhance the stature of your presentation. Adorn the beauty of your thoughts with their colourful backgrounds. Download and present our Business PowerPoint Templates because Our PowerPoint Templates and Slides will let Your superior ideas hit the target always and everytime. Present our Triangles PowerPoint Templates because Our PowerPoint Templates and Slides will embellish your thoughts. See them provide the desired motivation to your team. Download and present our Shapes PowerPoint Templates because You can Rise to the occasion with our PowerPoint Templates and Slides. You will bring your audience on their feet in no time.Use these PowerPoint slides for presentations relating to Saturation, strip, saturated, line, spectrum, pantone, bright, diagram, circle, sampler, guide, element, paint, scale,shape, ten, multicolored, palette, illustration, spectral, guidance, chart, collection, abstraction, selection, choice, visible, variation, painter, contrast, ,gradient, pattern, chooser, analyzer. The prominent colors used in the PowerPoint template are Gray, White, Blue. Put your best foot forward with our Data Analysis Process Diagram 9 Stages Ppt Business Plan PowerPoint Slide. You will appear that much better.
Data Analysis Deployment Cost Ppt PowerPoint Presentation Complete Deck With Slides
This data analysis deployment cost ppt powerpoint presentation complete deck with slides acts as backup support for your ideas, vision, thoughts, etc. Use it to present a thorough understanding of the topic. This PPT slideshow can be utilized for both in-house and outside presentations depending upon your needs and business demands. Entailing twelve slides with a consistent design and theme, this template will make a solid use case. As it is intuitively designed, it suits every business vertical and industry. All you have to do is make a few tweaks in the content or any other component to design unique presentations. The biggest advantage of this complete deck is that it can be personalized multiple times once downloaded. The color, design, shapes, and other elements are free to modify to add personal touches. You can also insert your logo design in this PPT layout. Therefore a well-thought and crafted presentation can be delivered with ease and precision by downloading this data analysis deployment cost ppt powerpoint presentation complete deck with slides PPT slideshow.
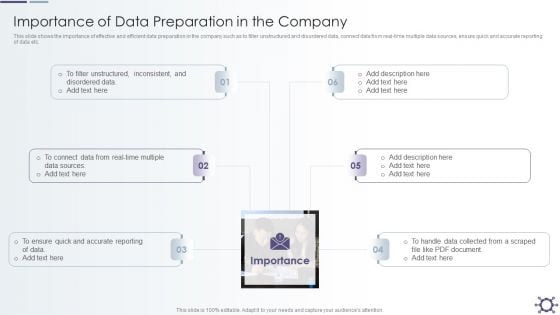
Outline Of Data Preprocessing Strategies And Importance Importance Of Data Preparation In The Company Guidelines PDF
This slide shows the importance of effective and efficient data preparation in the company such as to filter unstructured and disordered data, connect data from real-time multiple data sources, ensure quick and accurate reporting of data etc. Presenting Outline Of Data Preprocessing Strategies And Importance Importance Of Data Preparation In The Company Guidelines PDF to provide visual cues and insights. Share and navigate important information on six stages that need your due attention. This template can be used to pitch topics like Disordered Data, Data Sources, Document. In addtion, this PPT design contains high resolution images, graphics, etc, that are easily editable and available for immediate download.
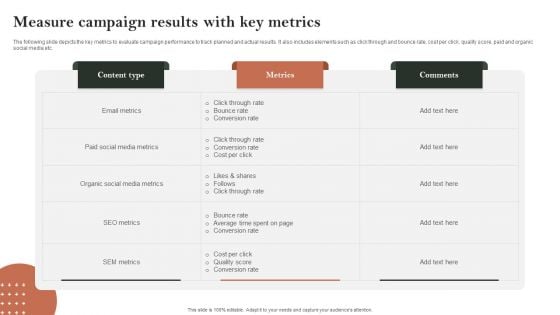
Search Engine Marketing Measure Campaign Results With Key Metrics Infographics PDF
The following slide depicts the key metrics to evaluate campaign performance to track planned and actual results. It also includes elements such as click through and bounce rate, cost per click, quality score, paid and organic social media etc. Slidegeeks is here to make your presentations a breeze with Search Engine Marketing Measure Campaign Results With Key Metrics Infographics PDF With our easy-to-use and customizable templates, you can focus on delivering your ideas rather than worrying about formatting. With a variety of designs to choose from, youre sure to find one that suits your needs. And with animations and unique photos, illustrations, and fonts, you can make your presentation pop. So whether youre giving a sales pitch or presenting to the board, make sure to check out Slidegeeks first.
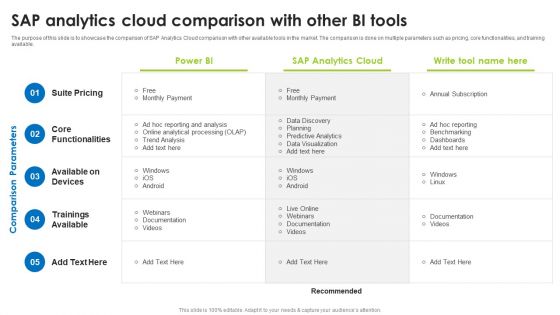
BI Technique For Data Informed Decisions Sap Analytics Cloud Comparison With Other BI Tools Structure PDF
The purpose of this slide is to showcase the comparison of SAP Analytics Cloud comparison with other available tools in the market. The comparison is done on multiple parameters such as pricing, core functionalities, and training available. Formulating a presentation can take up a lot of effort and time, so the content and message should always be the primary focus. The visuals of the PowerPoint can enhance the presenters message, so our BI Technique For Data Informed Decisions Sap Analytics Cloud Comparison With Other BI Tools Structure PDF was created to help save time. Instead of worrying about the design, the presenter can concentrate on the message while our designers work on creating the ideal templates for whatever situation is needed. Slidegeeks has experts for everything from amazing designs to valuable content, we have put everything into BI Technique For Data Informed Decisions Sap Analytics Cloud Comparison With Other BI Tools Structure PDF.
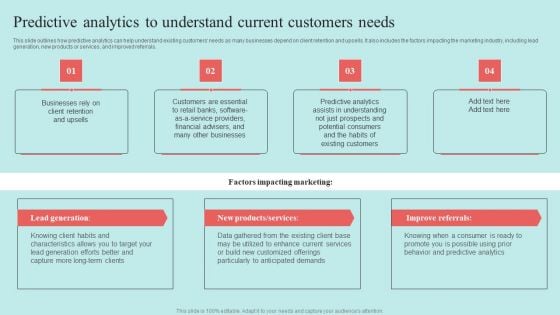
Predictive Data Model Predictive Analytics To Understand Current Customers Needs Infographics PDF
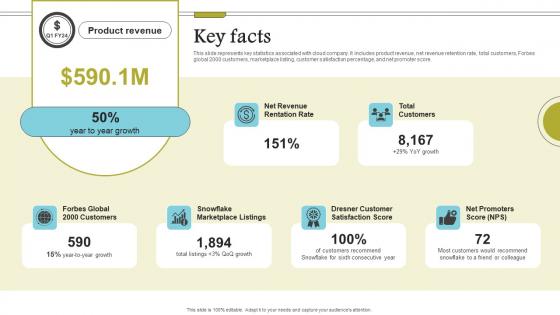
Key Facts Cloud Data Computing Company Fund Raising Mockup PDF
This slide represents key statistics associated with cloud company. It includes product revenue, net revenue retention rate, total customers, Forbes global 2000 customers, marketplace listing, customer satisfaction percentage, and net promoter score. If your project calls for a presentation, then Slidegeeks is your go-to partner because we have professionally designed, easy-to-edit templates that are perfect for any presentation. After downloading, you can easily edit Key Facts Cloud Data Computing Company Fund Raising Mockup PDF and make the changes accordingly. You can rearrange slides or fill them with different images. Check out all the handy templates This slide represents key statistics associated with cloud company. It includes product revenue, net revenue retention rate, total customers, Forbes global 2000 customers, marketplace listing, customer satisfaction percentage, and net promoter score.
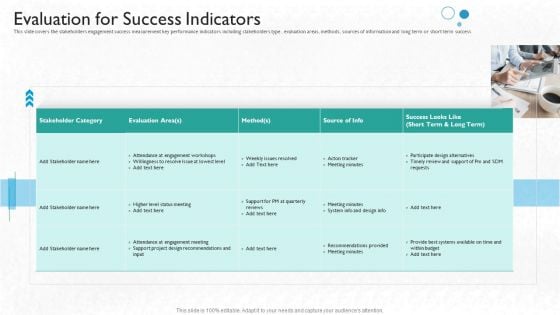
Partner Engagement Planning Procedure Evaluation For Success Indicators Mockup PDF
This slide covers the stakeholders engagement success measurement key performance indicators including stakeholders type, evaluation areas, methods, sources of information and long term or short term success. Deliver an awe-inspiring pitch with this creative partner engagement planning procedure evaluation for success indicators mockup pdf bundle. Topics like evaluation area, success, measurement, stakeholders, key performance can be discussed with this completely editable template. It is available for immediate download depending on the needs and requirements of the user.
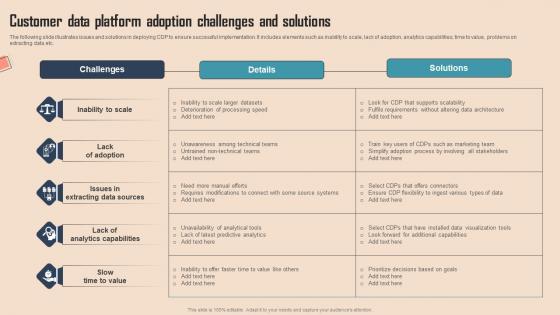
Customer Data Platform Adoption Comprehensive CDP Guide For Promoters Ideas Pdf
The following slide illustrates issues and solutions in deploying CDP to ensure successful implementation. It includes elements such as inability to scale, lack of adoption, analytics capabilities, time to value, problems on extracting data etc.There are so many reasons you need a Customer Data Platform Adoption Comprehensive CDP Guide For Promoters Ideas Pdf. The first reason is you can not spend time making everything from scratch, Thus, Slidegeeks has made presentation templates for you too. You can easily download these templates from our website easily. The following slide illustrates issues and solutions in deploying CDP to ensure successful implementation. It includes elements such as inability to scale, lack of adoption, analytics capabilities, time to value, problems on extracting data etc.
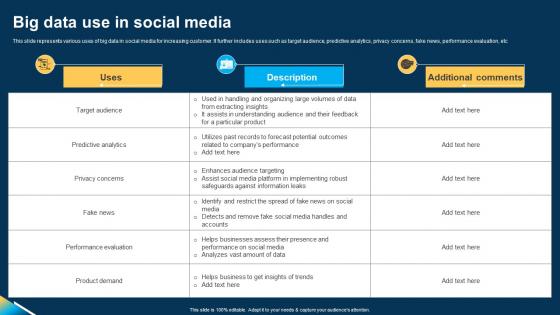
Big Data Use In Social Media Ppt Layouts Example File pdf
This slide represents various uses of big data in social media for increasing customer. It further includes uses such as target audience, predictive analytics, privacy concerns, fake news, performance evaluation, etc. Showcasing this set of slides titled Big Data Use In Social Media Ppt Layouts Example File pdf. The topics addressed in these templates are Privacy Concerns, Fake News, Performance Evaluation. All the content presented in this PPT design is completely editable. Download it and make adjustments in color, background, font etc. as per your unique business setting. This slide represents various uses of big data in social media for increasing customer. It further includes uses such as target audience, predictive analytics, privacy concerns, fake news, performance evaluation, etc.
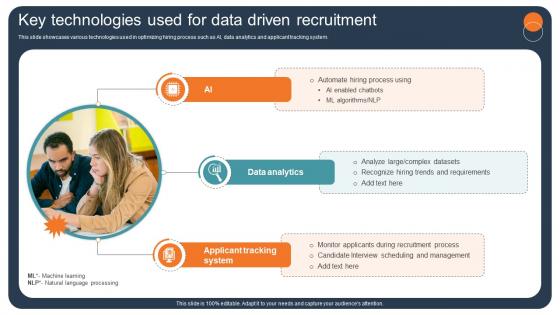
Transforming Recruitment Process Key Technologies Used For Data Driven Recruitment CRP DK SS
This slide showcases various technologies used in optimizing hiring process such as AI, data analytics and applicant tracking system. Retrieve professionally designed Transforming Recruitment Process Key Technologies Used For Data Driven Recruitment CRP DK SS to effectively convey your message and captivate your listeners. Save time by selecting pre-made slideshows that are appropriate for various topics, from business to educational purposes. These themes come in many different styles, from creative to corporate, and all of them are easily adjustable and can be edited quickly. Access them as PowerPoint templates or as Google Slides themes. You do not have to go on a hunt for the perfect presentation because Slidegeeks got you covered from everywhere. This slide showcases various technologies used in optimizing hiring process such as AI, data analytics and applicant tracking system.
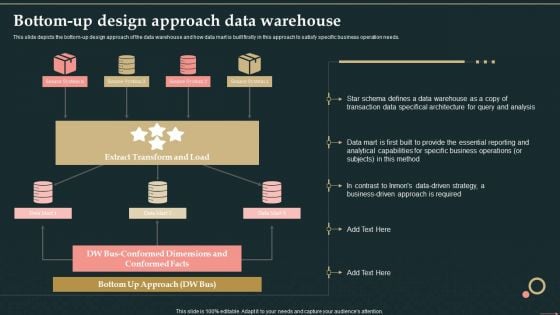
Management Information System Bottom Up Design Approach Data Warehouse Graphics PDF
This slide depicts the bottom-up design approach of the data warehouse and how data mart is built firstly in this approach to satisfy specific business operation needs.Deliver an awe inspiring pitch with this creative Management Information System Bottom Up Design Approach Data Warehouse Graphics PDF bundle. Topics like Extract Transform, Conformed Dimensions, Bottom Approach can be discussed with this completely editable template. It is available for immediate download depending on the needs and requirements of the user.
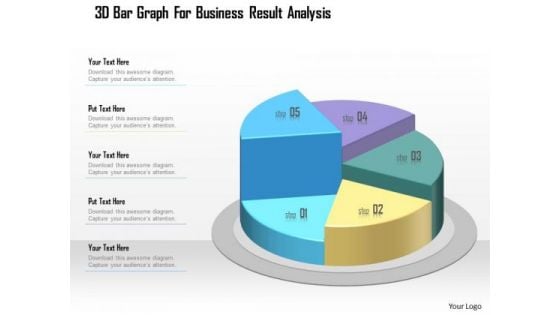
Business Diagram 3d Bar Graph For Business Result Analysis Presentation Template
This business slide displays five staged pie chart. This diagram is a data visualization tool that gives you a simple way to present statistical information. This slide helps your audience examine and interpret the data you present.
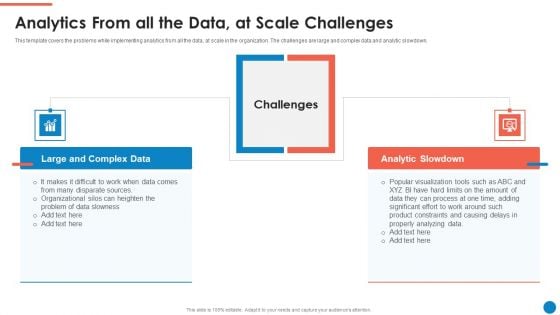
Data And Analytics Playbook Analytics From All The Data At Scale Challenges Summary PDF
This template covers the problems while implementing analytics from all the data, at scale in the organization. The challenges are large and complex data and analytic slowdown. This is a Data And Analytics Playbook Analytics From All The Data At Scale Challenges Summary PDF template with various stages. Focus and dispense information on two stages using this creative set, that comes with editable features. It contains large content boxes to add your information on topics like Large And Complex Data, Analytic Slowdown, Challenges, Data Slowness. You can also showcase facts, figures, and other relevant content using this PPT layout. Grab it now.

E Commerce Business Development Plan TAM SAM SOM Analysis Of Target Market Elements PDF
The purpose of this slide is to depict the market potential of e-commerce business in terms of TAM, SAM, and SOM to evaluate feasibility of their product. It showcases total addressable market, serviceable available market and serviceable obtainable market. The E Commerce Business Development Plan TAM SAM SOM Analysis Of Target Market Elements PDF is a compilation of the most recent design trends as a series of slides. It is suitable for any subject or industry presentation, containing attractive visuals and photo spots for businesses to clearly express their messages. This template contains a variety of slides for the user to input data, such as structures to contrast two elements, bullet points, and slides for written information. Slidegeeks is prepared to create an impression.
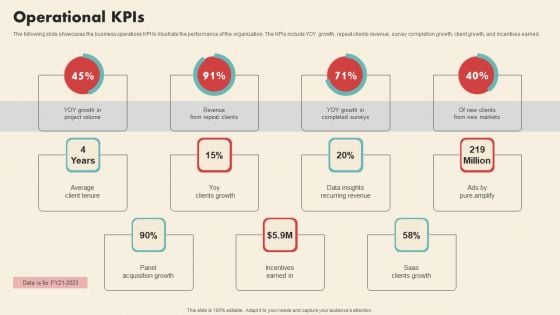
Data Driven Marketing Solutions Firm Company Profile Operational Kpis Graphics PDF
The following slide showcases the business operations KPI to illustrate the performance of the organization. The KPIs include YOY growth, repeat clients revenue, survey completion growth, client growth, and incentives earned. Are you searching for a Data Driven Marketing Solutions Firm Company Profile Operational Kpis Graphics PDF that is uncluttered, straightforward, and original Its easy to edit, and you can change the colors to suit your personal or business branding. For a presentation that expresses how much effort you have put in, this template is ideal. With all of its features, including tables, diagrams, statistics, and lists, its perfect for a business plan presentation. Make your ideas more appealing with these professional slides. Download Data Driven Marketing Solutions Firm Company Profile Operational Kpis Graphics PDF from Slidegeeks today.
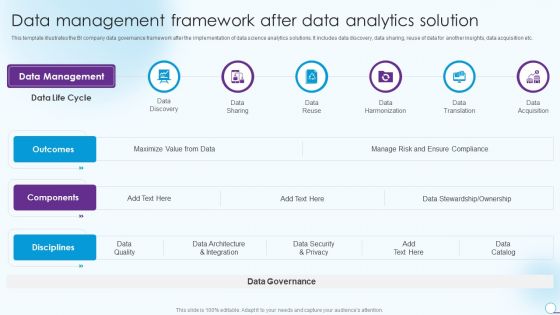
Information Analytics And Ml Strategy Playbook Data Management Framework After Data Analytics Solution Introduction PDF
This template illustrates the BI company data governance framework after the implementation of data science analytics solutions. It includes data discovery, data sharing, reuse of data for another insights, data acquisition etc. Presenting Information Analytics And Ml Strategy Playbook Data Management Framework After Data Analytics Solution Introduction PDF to provide visual cues and insights. Share and navigate important information on six stages that need your due attention. This template can be used to pitch topics like Data Management, Data Harmonization, Data Translation. In addtion, this PPT design contains high resolution images, graphics, etc, that are easily editable and available for immediate download.
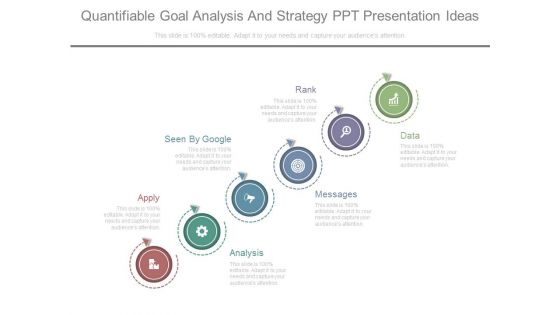
Quantifiable Goal Analysis And Strategy Ppt Presentation Ideas
This is a quantifiable goal analysis and strategy ppt presentation ideas. This is a six stage process. The stages in this process are apply, seen by google, rank, analysis, messages, data.
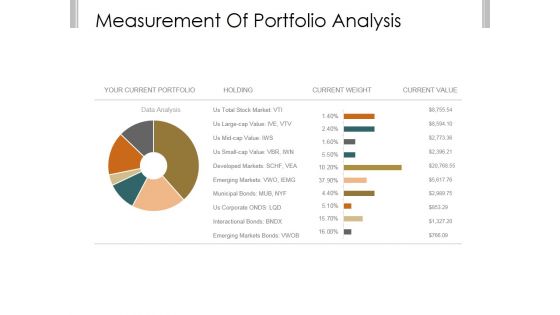
Measurement Of Portfolio Analysis Ppt PowerPoint Presentation Clipart
This is a measurement of portfolio analysis ppt powerpoint presentation clipart. This is a two stage process. The stages in this process are your current portfolio, holding, current weight, current value, data analysis.
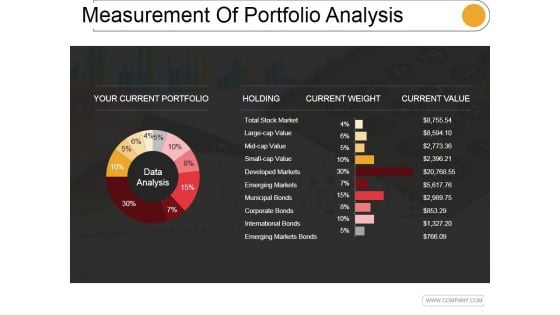
Measurement Of Portfolio Analysis Ppt PowerPoint Presentation Topics
This is a measurement of portfolio analysis ppt powerpoint presentation topics. This is a ten stage process. The stages in this process are data analysis, holding, current weight, current value.
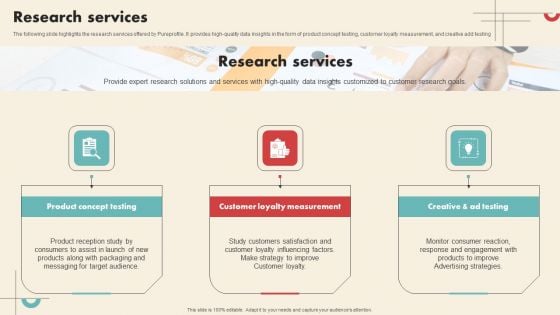
Data Driven Marketing Solutions Firm Company Profile Research Services Infographics PDF
The following slide highlights the research services offered by Pureprofile. It provides high-quality data insights in the form of product concept testing, customer loyalty measurement, and creative add testing This Data Driven Marketing Solutions Firm Company Profile Research Services Infographics PDF from Slidegeeks makes it easy to present information on your topic with precision. It provides customization options, so you can make changes to the colors, design, graphics, or any other component to create a unique layout. It is also available for immediate download, so you can begin using it right away. Slidegeeks has done good research to ensure that you have everything you need to make your presentation stand out. Make a name out there for a brilliant performance.
Pie Chart Data Comparisons 5 Stages Business Plan Templates PowerPoint Slides
We present our pie chart data comparisons 5 stages business plan templates PowerPoint Slides.Present our Marketing PowerPoint Templates because Our PowerPoint Templates and Slides are Clear and concise. Use them and dispel any doubts your team may have. Present our Finance PowerPoint Templates because You can Create a matrix with our PowerPoint Templates and Slides. Feel the strength of your ideas click into place. Download our Business PowerPoint Templates because You can Inspire your team with our PowerPoint Templates and Slides. Let the force of your ideas flow into their minds. Present our Sales PowerPoint Templates because Our PowerPoint Templates and Slides are aesthetically designed to attract attention. We gaurantee that they will grab all the eyeballs you need. Present our Success PowerPoint Templates because Our PowerPoint Templates and Slides are specially created by a professional team with vast experience. They diligently strive to come up with the right vehicle for your brilliant Ideas. Use these PowerPoint slides for presentations relating to Analysis, Analyzing, Brands, Business, Chart, Colorful, Commerce, Compare, Comparison, Data, Economical, Finance, Financial, Grow, Growth, Market, Market Share, Marketing, Measure, Pen, Pie, Pie Chart, Presentation, Profit, Revenue, Sales, Sales Chat, Sales Increase, Share, Statistical, Success, Successful. The prominent colors used in the PowerPoint template are Blue, Gray, White. Start a company with our Pie Chart Data Comparisons 5 Stages Business Plan Templates PowerPoint Slides. Just download, type and present.
Pie Chart Data Comparisons 5 Stages Examples Small Business Plans PowerPoint Slides
We present our pie chart data comparisons 5 stages examples small business plans PowerPoint Slides.Download our Marketing PowerPoint Templates because you can Set pulses racing with our PowerPoint Templates and Slides. They will raise the expectations of your team. Present our Finance PowerPoint Templates because Our PowerPoint Templates and Slides are the chords of your song. String them along and provide the lilt to your views. Download and present our Business PowerPoint Templates because It will Raise the bar of your Thoughts. They are programmed to take you to the next level. Download our Sales PowerPoint Templates because Our PowerPoint Templates and Slides will fulfill your every need. Use them and effectively satisfy the desires of your audience. Present our Success PowerPoint Templates because You can Be the puppeteer with our PowerPoint Templates and Slides as your strings. Lead your team through the steps of your script.Use these PowerPoint slides for presentations relating to Analysis, Analyzing, Brands, Business, Chart, Colorful, Commerce, Compare, Comparison, Data, Economical, Finance, Financial, Grow, Growth, Market, Market Share, Marketing, Measure, Pen, Pie, Pie Chart, Presentation, Profit, Revenue, Sales, Sales Chat, Sales Increase, Share, Statistical, Success, Successful. The prominent colors used in the PowerPoint template are Yellow, Gray, White. Ambiguity can be exasperating. Give definite answers with our Pie Chart Data Comparisons 5 Stages Examples Small Business Plans PowerPoint Slides.
Pie Chart Data Comparisons 5 Stages How To Develop Business Plan PowerPoint Templates
We present our pie chart data comparisons 5 stages how to develop business plan PowerPoint templates.Present our Marketing PowerPoint Templates because You can Be the star of the show with our PowerPoint Templates and Slides. Rock the stage with your ideas. Download and present our Finance PowerPoint Templates because Timeline crunches are a fact of life. Meet all deadlines using our PowerPoint Templates and Slides. Use our Business PowerPoint Templates because You can Be the puppeteer with our PowerPoint Templates and Slides as your strings. Lead your team through the steps of your script. Download and present our Sales PowerPoint Templates because Our PowerPoint Templates and Slides are a sure bet. Gauranteed to win against all odds. Download our Success PowerPoint Templates because Our PowerPoint Templates and Slides will provide weight to your words. They will bring out the depth of your thought process.Use these PowerPoint slides for presentations relating to Analysis, Analyzing, Brands, Business, Chart, Colorful, Commerce, Compare, Comparison, Data, Economical, Finance, Financial, Grow, Growth, Market, Market Share, Marketing, Measure, Pen, Pie, Pie Chart, Presentation, Profit, Revenue, Sales, Sales Chat, Sales Increase, Share, Statistical, Success, Successful. The prominent colors used in the PowerPoint template are Blue, Gray, White. Motivate your team to excellent performances. Nurture their abilities through our Pie Chart Data Comparisons 5 Stages How To Develop Business Plan PowerPoint Templates.
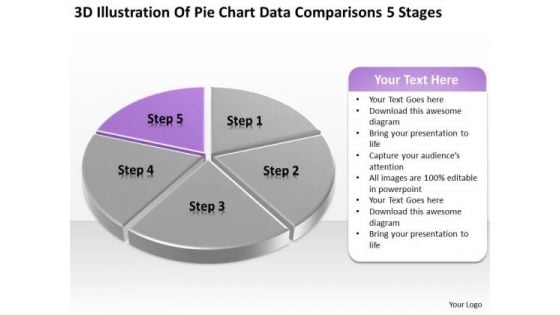
Pie Chart Data Comparisons 5 Stages Ppt Designing Business Plan PowerPoint Templates
We present our pie chart data comparisons 5 stages ppt designing business plan PowerPoint templates.Use our Marketing PowerPoint Templates because Our PowerPoint Templates and Slides are innately eco-friendly. Their high recall value negate the need for paper handouts. Download our Finance PowerPoint Templates because Our PowerPoint Templates and Slides are truly out of this world. Even the MIB duo has been keeping tabs on our team. Use our Business PowerPoint Templates because You should Bet on your luck with our PowerPoint Templates and Slides. Be assured that you will hit the jackpot. Present our Sales PowerPoint Templates because Our PowerPoint Templates and Slides are created with admirable insight. Use them and give your group a sense of your logical mind. Present our Success PowerPoint Templates because Our PowerPoint Templates and Slides are focused like a searchlight beam. They highlight your ideas for your target audience.Use these PowerPoint slides for presentations relating to Analysis, Analyzing, Brands, Business, Chart, Colorful, Commerce, Compare, Comparison, Data, Economical, Finance, Financial, Grow, Growth, Market, Market Share, Marketing, Measure, Pen, Pie, Pie Chart, Presentation, Profit, Revenue, Sales, Sales Chat, Sales Increase, Share, Statistical, Success, Successful. The prominent colors used in the PowerPoint template are Purple, Gray, White. Make instructive presentations with our Pie Chart Data Comparisons 5 Stages Ppt Designing Business Plan PowerPoint Templates. Dont waste time struggling with PowerPoint. Let us do it for you.

Business Financial Metrics Data Analysis Ppt PowerPoint Presentation Complete Deck With Slides
Improve your presentation delivery using this business financial metrics data analysis ppt powerpoint presentation complete deck with slides. Support your business vision and objectives using this well-structured PPT deck. This template offers a great starting point for delivering beautifully designed presentations on the topic of your choice. Comprising twenty nine this professionally designed template is all you need to host discussion and meetings with collaborators. Each slide is self-explanatory and equipped with high-quality graphics that can be adjusted to your needs. Therefore, you will face no difficulty in portraying your desired content using this PPT slideshow. This PowerPoint slideshow contains every important element that you need for a great pitch. It is not only editable but also available for immediate download and utilization. The color, font size, background, shapes everything can be modified to create your unique presentation layout. Therefore, download it now.
Application Ppt Mobile Screens Data Analysis Ppt PowerPoint Presentation Complete Deck With Slides
If designing a presentation takes a lot of your time and resources and you are looking for a better alternative, then this application ppt mobile screens data analysis ppt powerpoint presentation complete deck with slides is the right fit for you. This is a prefabricated set that can help you deliver a great presentation on the topic. All the twelve slides included in this sample template can be used to present a birds-eye view of the topic. These slides are also fully editable, giving you enough freedom to add specific details to make this layout more suited to your business setting. Apart from the content, all other elements like color, design, theme are also replaceable and editable. This helps in designing a variety of presentations with a single layout. Not only this, you can use this PPT design in formats like PDF, PNG, and JPG once downloaded. Therefore, without any further ado, download and utilize this sample presentation as per your liking.
Customer Data Analysis Team Target Ppt PowerPoint Presentation Complete Deck With Slides
If designing a presentation takes a lot of your time and resources and you are looking for a better alternative, then this customer data analysis team target ppt powerpoint presentation complete deck with slides is the right fit for you. This is a prefabricated set that can help you deliver a great presentation on the topic. All the twelve slides included in this sample template can be used to present a birds-eye view of the topic. These slides are also fully editable, giving you enough freedom to add specific details to make this layout more suited to your business setting. Apart from the content, all other elements like color, design, theme are also replaceable and editable. This helps in designing a variety of presentations with a single layout. Not only this, you can use this PPT design in formats like PDF, PNG, and JPG once downloaded. Therefore, without any further ado, download and utilize this sample presentation as per your liking.

Brand Measurement Data Analysis Ppt PowerPoint Presentation Complete Deck With Slides
Improve your presentation delivery using this brand measurement data analysis ppt powerpoint presentation complete deck with slides. Support your business vision and objectives using this well-structured PPT deck. This template offers a great starting point for delivering beautifully designed presentations on the topic of your choice. Comprising fourteen this professionally designed template is all you need to host discussion and meetings with collaborators. Each slide is self-explanatory and equipped with high-quality graphics that can be adjusted to your needs. Therefore, you will face no difficulty in portraying your desired content using this PPT slideshow. This PowerPoint slideshow contains every important element that you need for a great pitch. It is not only editable but also available for immediate download and utilization. The color, font size, background, shapes everything can be modified to create your unique presentation layout. Therefore, download it now.
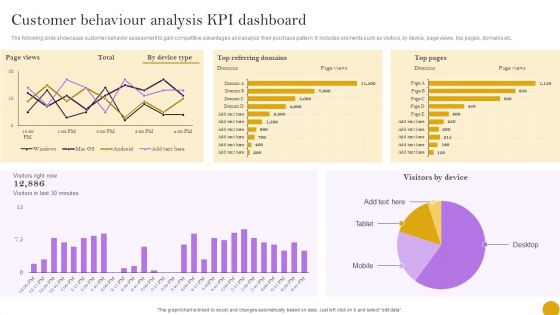
Comprehensive Customer Data Platform Guide Optimizing Promotional Initiatives Customer Behaviour Analysis KPI Brochure PDF
The following slide showcases customer behavior assessment to gain competitive advantages and analyze their purchase pattern. It includes elements such as visitors, by device, page views, top pages, domains etc. Coming up with a presentation necessitates that the majority of the effort goes into the content and the message you intend to convey. The visuals of a PowerPoint presentation can only be effective if it supplements and supports the story that is being told. Keeping this in mind our experts created Comprehensive Customer Data Platform Guide Optimizing Promotional Initiatives Customer Behaviour Analysis KPI Brochure PDF to reduce the time that goes into designing the presentation. This way, you can concentrate on the message while our designers take care of providing you with the right template for the situation.
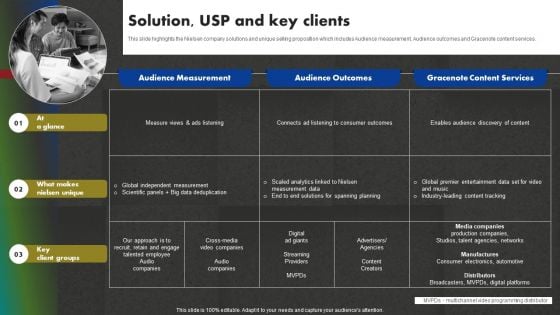
Data And Customer Analysis Company Outline Solution USP And Key Clients Microsoft PDF
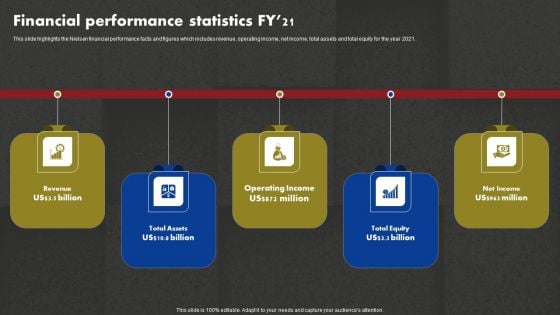
Data And Customer Analysis Company Outline Financial Performance Statistics FY21 Professional PDF
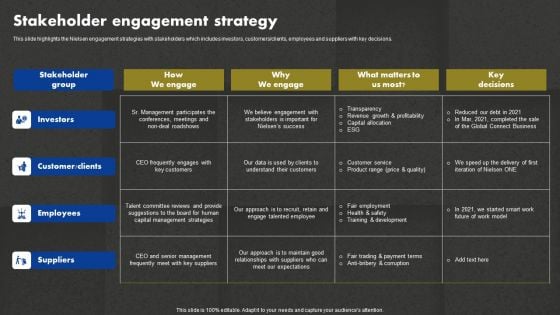
Data And Customer Analysis Company Outline Stakeholder Engagement Strategy Template PDF
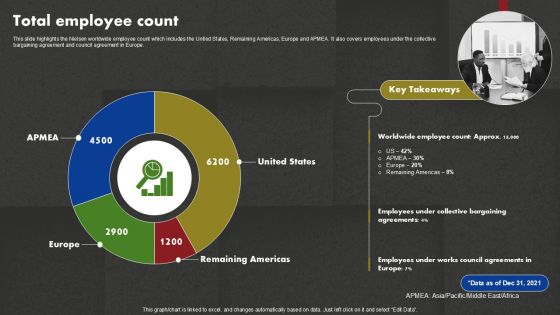
Data And Customer Analysis Company Outline Total Employee Count Designs PDF
Half Yearly Business Plan Icon With Data Utilization And Management Ppt PowerPoint Presentation Slides Icons PDF
Showcasing this set of slides titled Half Yearly Business Plan Icon With Data Utilization And Management Ppt PowerPoint Presentation Slides Icons PDF. The topics addressed in these templates are Half Yearly Business, Plan Icon, Data Utilization. All the content presented in this PPT design is completely editable. Download it and make adjustments in color, background, font etc. as per your unique business setting.
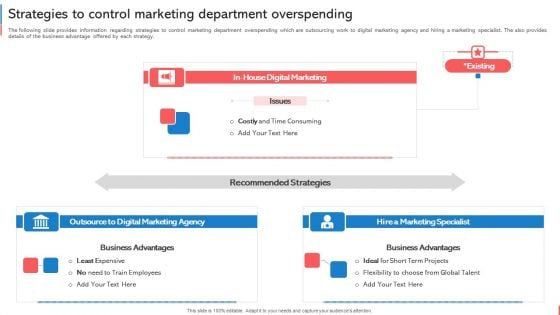
Company Budget Analysis Strategies To Control Marketing Department Overspending Mockup PDF
The following slide provides information regarding strategies to control marketing department overspending which are outsourcing work to digital marketing agency and hiring a marketing specialist. The also provides details of the business advantage offered by each strategy. The Company Budget Analysis Strategies To Control Marketing Department Overspending Mockup PDF is a compilation of the most recent design trends as a series of slides. It is suitable for any subject or industry presentation, containing attractive visuals and photo spots for businesses to clearly express their messages. This template contains a variety of slides for the user to input data, such as structures to contrast two elements, bullet points, and slides for written information. Slidegeeks is prepared to create an impression.
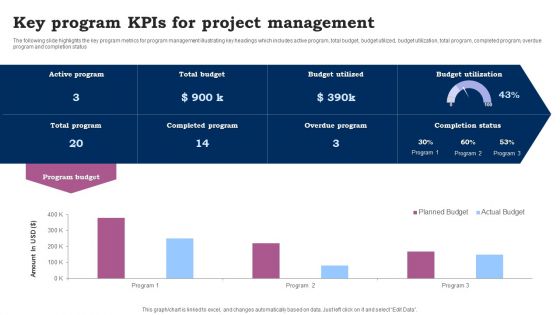
Key Program Kpis For Project Management Ppt Slides Graphic Images PDF
The following slide highlights the key program metrics for program management illustrating key headings which includes active program, total budget, budget utilized, budget utilization, total program, completed program, overdue program and completion status. Pitch your topic with ease and precision using this Key Program Kpis For Project Management Ppt Slides Graphic Images PDF. This layout presents information on Program Budget, Active Program, Total Budget. It is also available for immediate download and adjustment. So, changes can be made in the color, design, graphics or any other component to create a unique layout.
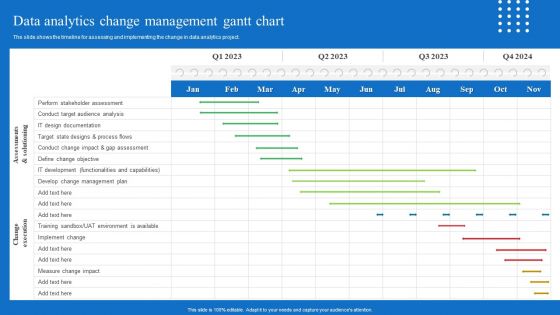
Toolkit For Data Science And Analytics Transition Data Analytics Change Management Gantt Chart Portrait PDF
The slide shows the timeline for assessing and implementing the change in data analytics project. Get a simple yet stunning designed Toolkit For Data Science And Analytics Transition Data Analytics Change Management Gantt Chart Portrait PDF It is the best one to establish the tone in your meetings. It is an excellent way to make your presentations highly effective. So, download this PPT today from Slidegeeks and see the positive impacts. Our easy to edit Toolkit For Data Science And Analytics Transition Data Analytics Change Management Gantt Chart Portrait PDF can be your go to option for all upcoming conferences and meetings. So, what are you waiting for Grab this template today.
Information Visualizations Playbook Business Intelligence And Predictive Analytics Challenges Icons PDF
This template covers the problems while implementing BI and predictive analytics in the organization. The challenges are undefined KPIs and metrics, and unable to hire right data science talent. Presenting Information Visualizations Playbook Business Intelligence And Predictive Analytics Challenges Icons PDF to provide visual cues and insights. Share and navigate important information on two stages that need your due attention. This template can be used to pitch topics like Raw Data Organized, Security Vulnerabilities, Perform Analysis. In addtion, this PPT design contains high resolution images, graphics, etc, that are easily editable and available for immediate download.
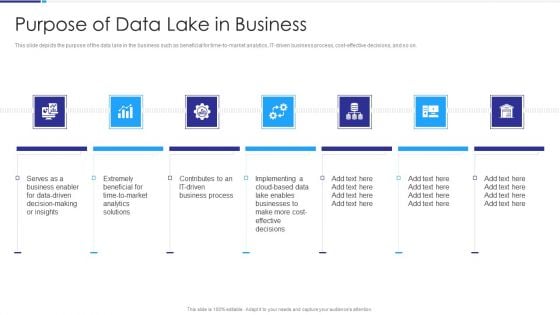
Data Lake Architecture Purpose Of Data Lake In Business Ppt Visual Aids Outline PDF
This slide depicts the purpose of the data lake in the business such as beneficial for time-to-market analytics, IT-driven business process, cost-effective decisions, and so on. This is a Data Lake Architecture Purpose Of Data Lake In Business Ppt Visual Aids Outline PDF template with various stages. Focus and dispense information on seven stages using this creative set, that comes with editable features. It contains large content boxes to add your information on topics like Business Enabler, Data Driven, Time To Market, Analytics Solutions, IT Driven Business Process. You can also showcase facts, figures, and other relevant content using this PPT layout. Grab it now.
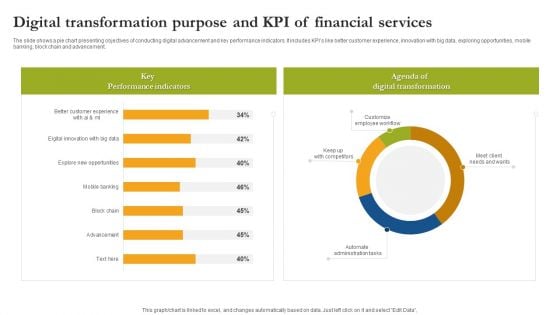
Digital Transformation Purpose And Kpi Of Financial Services Guidelines PDF
The slide shows a pie chart presenting objectives of conducting digital advancement and key performance indicators. It includes KPIs like better customer experience, innovation with big data, exploring opportunities, mobile banking, block chain and advancement. Showcasing this set of slides titled Digital Transformation Purpose And Kpi Of Financial Services Guidelines PDF. The topics addressed in these templates are Key Performance Indicators Digital Transformation, Customize Employee Workflow. All the content presented in this PPT design is completely editable. Download it and make adjustments in color, background, font etc. as per your unique business setting.
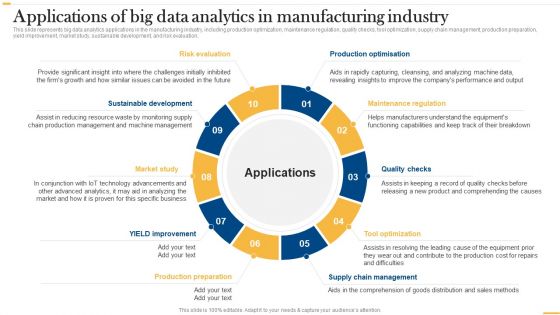
Deploying AI To Enhance Applications Of Big Data Analytics In Manufacturing Graphics PDF
This slide represents big data analytics applications in the manufacturing industry, including production optimization, maintenance regulation, quality checks, tool optimization, supply chain management, production preparation, yield improvement, market study, sustainable development, and risk evaluation. Slidegeeks is one of the best resources for PowerPoint templates. You can download easily and regulate Deploying AI To Enhance Applications Of Big Data Analytics In Manufacturing Graphics PDF for your personal presentations from our wonderful collection. A few clicks is all it takes to discover and get the most relevant and appropriate templates. Use our Templates to add a unique zing and appeal to your presentation and meetings. All the slides are easy to edit and you can use them even for advertisement purposes.
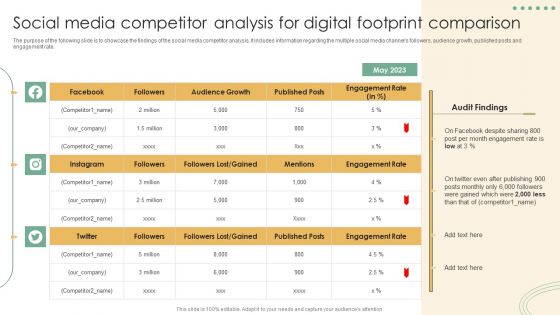
Online Marketing Techniques Assessment Approach Social Media Competitor Analysis For Digital Footprint Microsoft PDF
The purpose of the following slide is to showcase the findings of the social media competitor analysis. It includes information regarding the multiple social media channels followers, audience growth, published posts and engagement rate. The Online Marketing Techniques Assessment Approach Social Media Competitor Analysis For Digital Footprint Microsoft PDF is a compilation of the most recent design trends as a series of slides. It is suitable for any subject or industry presentation, containing attractive visuals and photo spots for businesses to clearly express their messages. This template contains a variety of slides for the user to input data, such as structures to contrast two elements, bullet points, and slides for written information. Slidegeeks is prepared to create an impression.

Business Executive Financial Summary Report
Slidegeeks is one of the best resources for PowerPoint templates. You can download easily and regulate Business Executive Financial Summary Report for your personal presentations from our wonderful collection. A few clicks is all it takes to discover and get the most relevant and appropriate templates. Use our Templates to add a unique zing and appeal to your presentation and meetings. All the slides are easy to edit and you can use them even for advertisement purposes. This slide showcase the executive financial summary report which includes the last four quarters EBITDA calculation and major expense budget variance. It includes elements such as cost of services, operating expenses, depreciation, advertisement, marketing etc.depreciation, advertisement, marketing etc. Presenting our well structured Business Executive Financial Summary Report. The topics discussed in this slide are Financial, Summary, Budget. This is an instantly available PowerPoint presentation that can be edited conveniently. Download it right away and captivate your audience
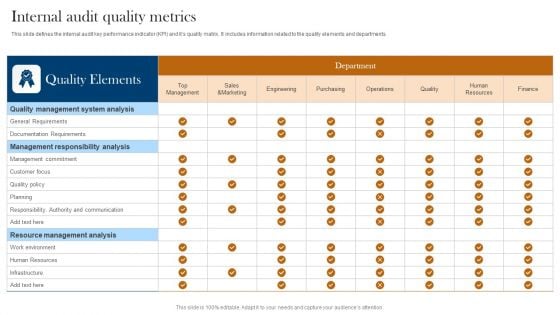
Internal Audit Quality Metrics Ppt Pictures Clipart Images PDF
This slide defines the internal audit key performance indicator KPI and its quality matrix. It includes information related to the quality elements and departments. Showcasing this set of slides titled Internal Audit Quality Metrics Ppt Pictures Clipart Images PDF. The topics addressed in these templates are Quality Elements, Department, Management Responsibility Analysis. All the content presented in this PPT design is completely editable. Download it and make adjustments in color, background, font etc. as per your unique business setting.


 Continue with Email

 Home
Home


