Dashboards
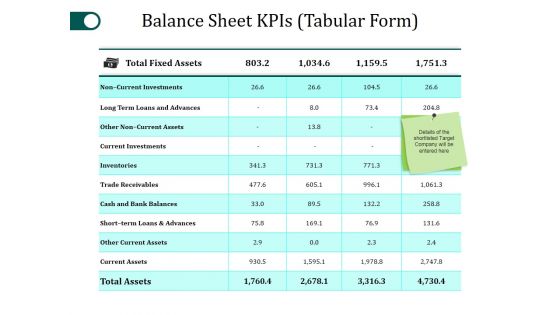
Balance Sheet Kpis Template 1 Ppt PowerPoint Presentation Pictures Example Introduction
This is a balance sheet kpis template 1 ppt powerpoint presentation pictures example introduction. This is a four stage process. The stages in this process are total fixed assets, non current investments, inventories, trade receivables.
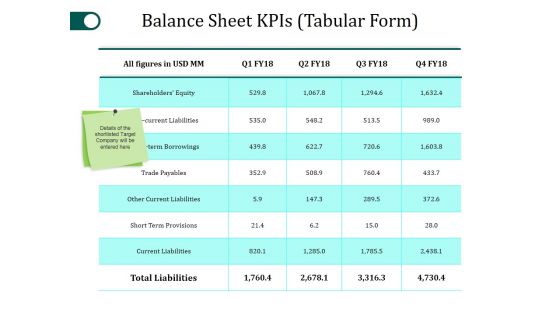
Balance Sheet Kpis Template 2 Ppt PowerPoint Presentation Portfolio Graphics Template
This is a balance sheet kpis template 2 ppt powerpoint presentation portfolio graphics template. This is a four stage process. The stages in this process are shareholders equity, trade payables, other current liabilities, current liabilities, total liabilities.
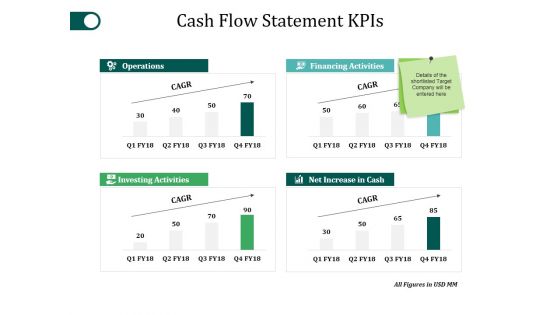
Cash Flow Statement Kpis Template 2 Ppt PowerPoint Presentation Summary Guidelines
This is a cash flow statement kpis template 2 ppt powerpoint presentation summary guidelines. This is a four stage process. The stages in this process are operations, investing activities, net increase in cash, financing activities.
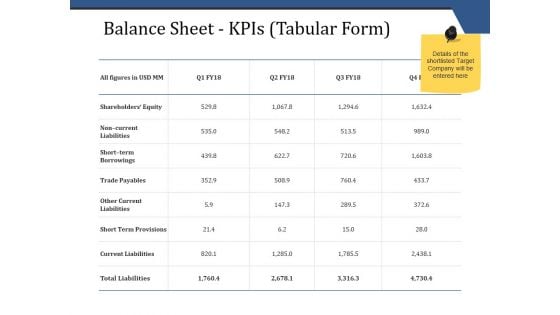
Balance Sheet Kpis Tabular Form Template 1 Ppt PowerPoint Presentation Infographics Picture
This is a balance sheet kpis tabular form template 1 ppt powerpoint presentation infographics picture. This is a four stage process. The stages in this process are business, finance, analysis, investment, strategy.
Balance Sheet Kpis Tabular Form Template 2 Ppt PowerPoint Presentation Icon Clipart
This is a balance sheet kpis tabular form template 2 ppt powerpoint presentation icon clipart. This is a four stage process. The stages in this process are business, finance, analysis, investment, strategy.
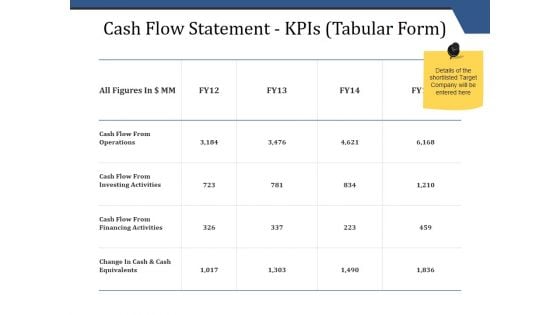
Cash Flow Statement Kpis Tabular Form Ppt PowerPoint Presentation Inspiration Master Slide
This is a cash flow statement kpis tabular form ppt powerpoint presentation inspiration master slide. This is a four stage process. The stages in this process are operations, financing activities, investing activities, net increase in cash.
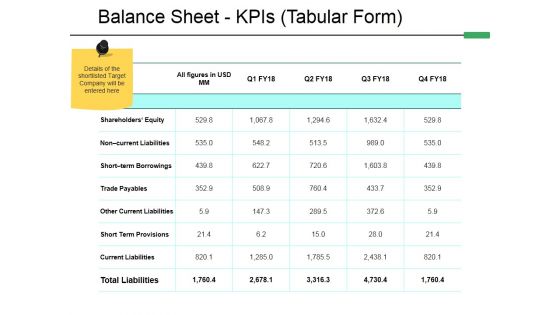
Balance Sheet Kpis Tabular Form Template 1 Ppt PowerPoint Presentation Outline Pictures
This is a balance sheet kpis tabular form template 1 ppt powerpoint presentation outline pictures. This is a five stage process. The stages in this process are compere, business, marketing, table, strategy.
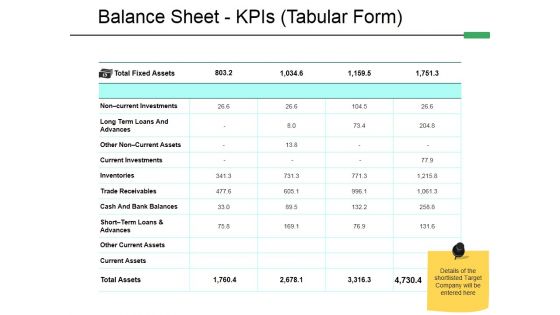
Balance Sheet Kpis Tabular Form Template 2 Ppt PowerPoint Presentation Styles Model
This is a balance sheet kpis tabular form template 2 ppt powerpoint presentation styles model. This is a four stage process. The stages in this process are advances, inventories, trade receivables, current investments, current assets, other current assets.

P And L Kpis Tabular Form Ppt PowerPoint Presentation Ideas Infographics
This is a p and l kpis tabular form ppt powerpoint presentation ideas infographics. This is a four stage process. The stages in this process are other income, expenses, other expenses, depreciation expense, financing cost.
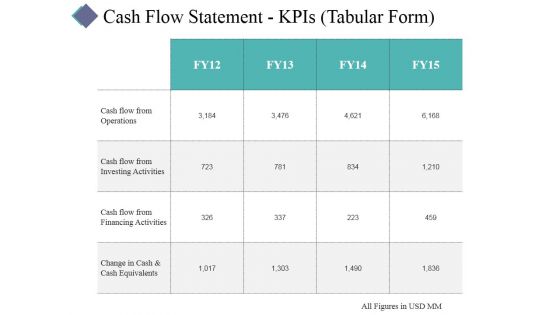
Cash Flow Statement Kpis Template 1 Ppt PowerPoint Presentation Infographic Template Master Slide
This is a cash flow statement kpis template 1 ppt powerpoint presentation infographic template master slide. This is a four stage process. The stages in this process are business, table, management, analysis, success.
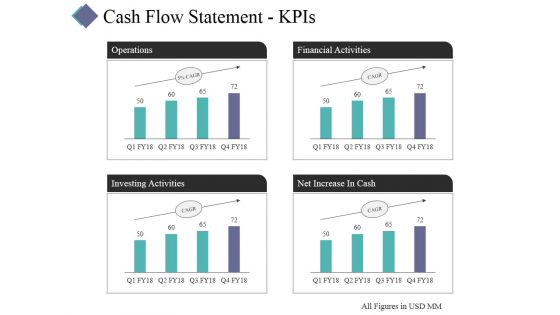
Cash Flow Statement Kpis Template 2 Ppt PowerPoint Presentation Layouts Visuals
This is a cash flow statement kpis template 2 ppt powerpoint presentation layouts visuals. This is a four stage process. The stages in this process are operations, financial activities, investing activities, net increase in cash.
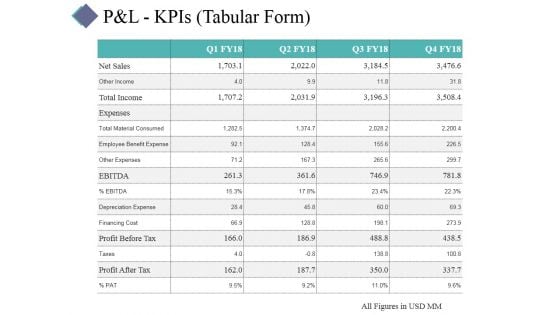
P And L Kpis Template 1 Ppt PowerPoint Presentation Portfolio Visual Aids
This is a p and l kpis template 1 ppt powerpoint presentation portfolio visual aids. This is a four stage process. The stages in this process are business, table, management, analysis, strategy.
P And L Kpis Template 2 Ppt PowerPoint Presentation Summary Icon
This is a p and l kpis template 2 ppt powerpoint presentation summary icon. This is a four stage process. The stages in this process are revenue, cogs, operating profit, net profit.
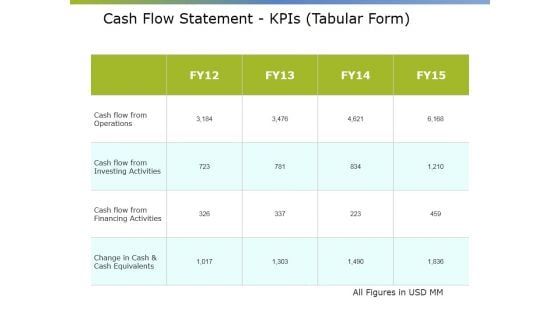
Cash Flow Statement Kpis Tabular Form Ppt PowerPoint Presentation Summary Elements
This is a cash flow statement kpis tabular form ppt powerpoint presentation summary elements. This is a four stage process. The stages in this process are net increase cash, financial activities, operations, investing activities.
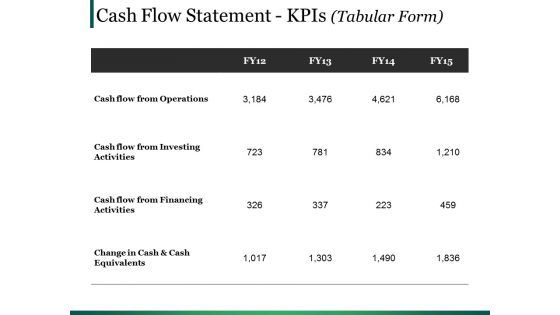
Cash Flow Statement Kpis Template Ppt PowerPoint Presentation Ideas Visual Aids
This is a cash flow statement kpis template ppt powerpoint presentation ideas visual aids. This is a four stage process. The stages in this process are operations, financing activities, investing activities, net increase in cash.
P And L Kpis Template 1 Ppt PowerPoint Presentation Icon Graphics Download
This is a p and l kpis template 1 ppt powerpoint presentation icon graphics download. This is a four stage process. The stages in this process are net sales, total income, expenses, financing cost, profit after tax.
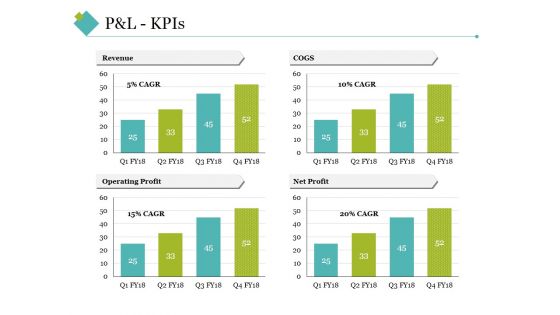
P And L Kpis Template 2 Ppt PowerPoint Presentation Inspiration Grid
This is a p and l kpis template 2 ppt powerpoint presentation inspiration grid. This is a four stage process. The stages in this process are revenue, cogs, operating profit, net profit.
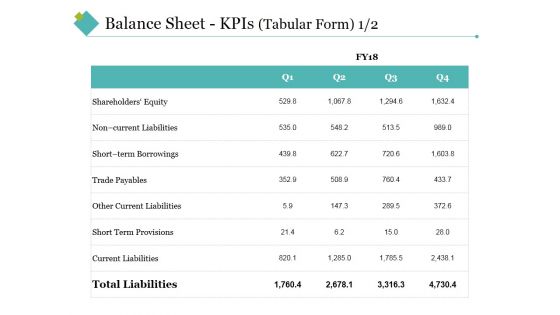
Balance Sheet Kpis Template 1 Ppt PowerPoint Presentation Professional Background Images
This is a balance sheet kpis template 1 ppt powerpoint presentation professional background images. This is a four stage process. The stages in this process are shareholders equity, trade payable, short term provisions, current liabilities, total liabilities.
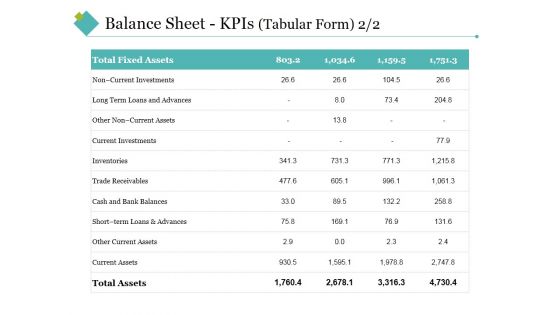
Balance Sheet Kpis Template 2 Ppt PowerPoint Presentation Infographic Template Background Images
This is a balance sheet kpis template 2 ppt powerpoint presentation infographic template background images. This is a four stage process. The stages in this process are total fixed assets, current assets, total assets, inventories, current investments.
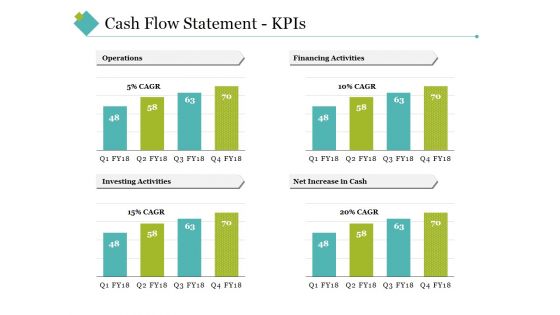
Cash Flow Statement Kpis Template 2 Ppt PowerPoint Presentation Portfolio Template
This is a cash flow statement kpis template 2 ppt powerpoint presentation portfolio template. This is a four stage process. The stages in this process are operations, financing activities, investing activities, net increase in cash.
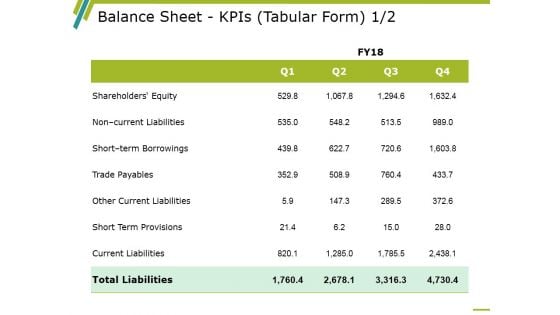
Balance Sheet Kpis Template 1 Ppt PowerPoint Presentation Infographic Template Example 2015
This is a balance sheet kpis template 1 ppt powerpoint presentation infographic template example 2015. This is a four stage process. The stages in this process are balance sheet, finance, marketing, strategy, analysis.
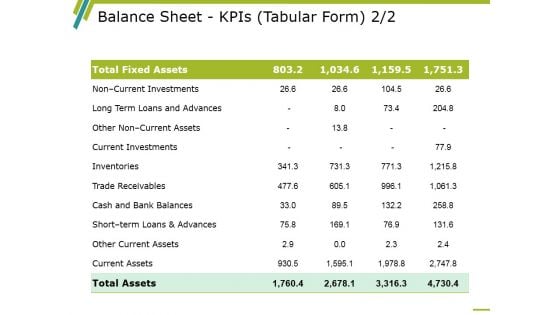
Balance Sheet Kpis Template 2 Ppt PowerPoint Presentation Outline Graphics Pictures
This is a balance sheet kpis template 2 ppt powerpoint presentation outline graphics pictures. This is a four stage process. The stages in this process are balance sheet, finance, marketing, strategy, analysis.
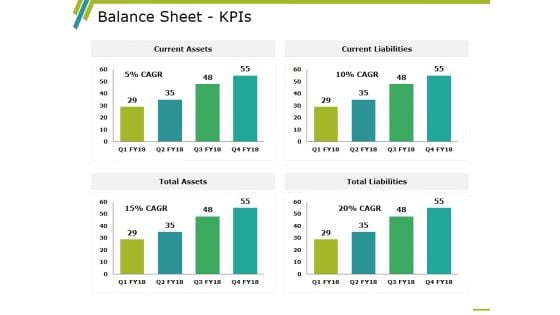
Balance Sheet Kpis Template 3 Ppt PowerPoint Presentation Infographic Template Demonstration
This is a balance sheet kpis template 3 ppt powerpoint presentation infographic template demonstration. This is a four stage process. The stages in this process are balance sheet, finance, marketing, strategy, analysis.

Cash Flow Statement Kpis Template 1 Ppt PowerPoint Presentation Infographics Summary
This is a cash flow statement kpis template 1 ppt powerpoint presentation infographics summary. This is a four stage process. The stages in this process are business, management, table, strategy, analysis.

Cash Flow Statement Kpis Template 2 Ppt PowerPoint Presentation Styles Ideas
This is a cash flow statement kpis template 2 ppt powerpoint presentation styles ideas. This is a four stage process. The stages in this process are cash flow, finance, marketing, strategy, business.
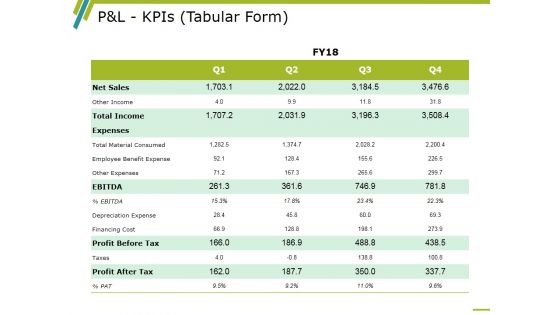
P And L Kpis Template 1 Ppt PowerPoint Presentation Infographics Professional
This is a p and l kpis template 1 ppt powerpoint presentation infographics professional. This is a four stage process. The stages in this process are Other Income, Total Income, Ebitda, Profit Before Tax, Profit After Tax.
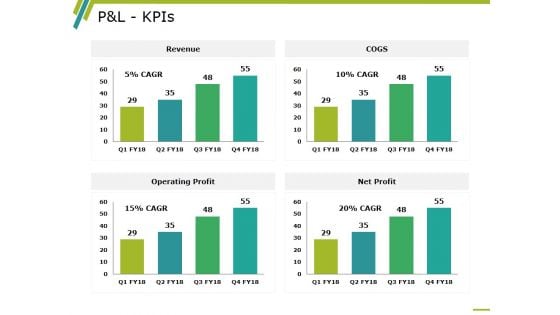
P And L Kpis Template 2 Ppt PowerPoint Presentation Professional Information
This is a p and l kpis template 2 ppt powerpoint presentation professional information. This is a four stage process. The stages in this process are revenue, operating profit, cogs, net profit, business.
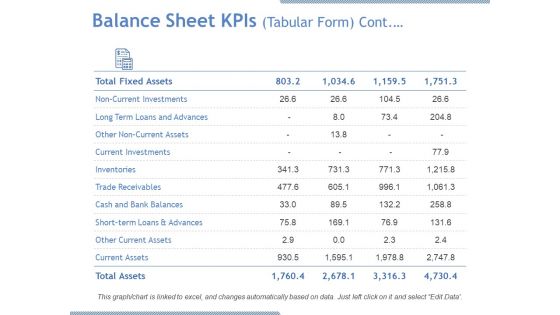
Balance Sheet Kpis Tabular Form Continuous Ppt PowerPoint Presentation Model Graphic Images
This is a balance sheet kpis tabular form continuous ppt powerpoint presentation model graphic images. This is a four stage process. The stages in this process are current investments, inventories, current assets, total assets, trade receivables.
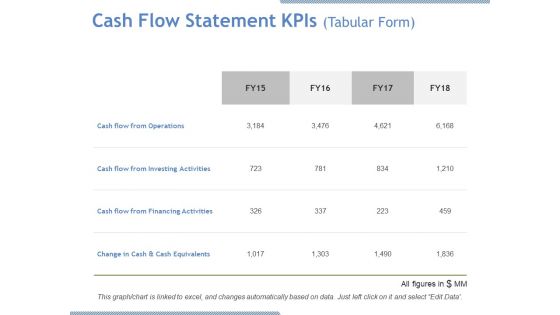
Cash Flow Statement Kpis Tabular Form Ppt PowerPoint Presentation Outline Slides
This is a cash flow statement kpis tabular form ppt powerpoint presentation outline slides. This is a four stage process. The stages in this process are cash flow from operations, cash flow from financing activities.
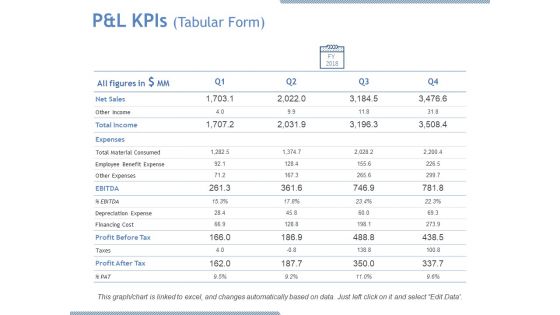
P And L Kpis Tabular Form Ppt PowerPoint Presentation Outline Aids
This is a p and l kpis tabular form ppt powerpoint presentation outline aids. This is a four stage process. The stages in this process are net sales, other income, total income, expenses, taxes.
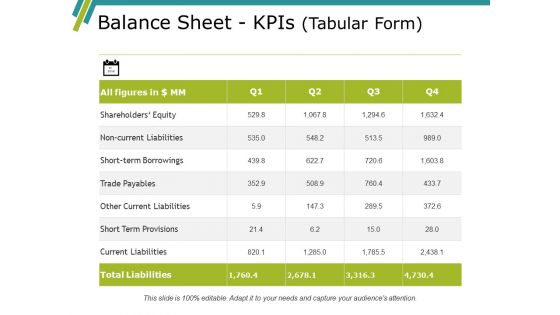
Balance Sheet Kpis Template 1 Ppt PowerPoint Presentation Professional Graphics Download
This is a balance sheet kpis template 1 ppt powerpoint presentation professional graphics download. This is a four stage process. The stages in this process are current assets, current liabilities, total assets, total liabilities.

Balance Sheet Kpis Tabular Form Template 1 Ppt PowerPoint Presentation Pictures Tips
This is a balance sheet kpis tabular form template 1 ppt powerpoint presentation pictures tips. This is a four stage process. The stages in this process are noncurrent liabilities, short term borrowings, trade payables, other current liabilities, short term provisions.
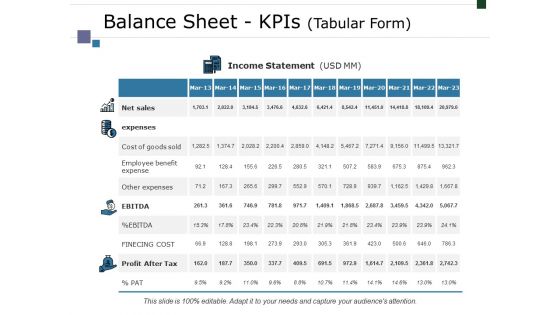
Balance Sheet Kpis Tabular Form Template 2 Ppt PowerPoint Presentation Summary Structure
This is a balance sheet kpis tabular form template 2 ppt powerpoint presentation summary structure. This is a four stage process. The stages in this process are net sales, expenses, ebitda, profit after tax, finecing cost.
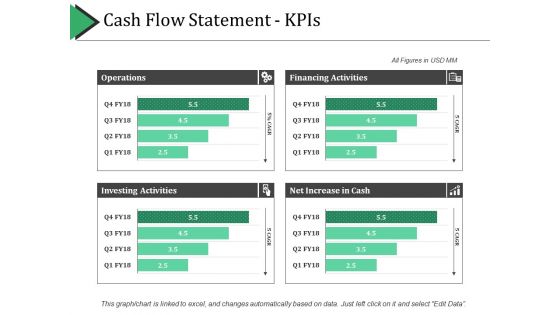
Cash Flow Statement - Kpis Ppt PowerPoint Presentation Layouts Graphics Template
This is a cash flow statement - kpis ppt powerpoint presentation layouts graphics template. This is a four stage process. The stages in this process are operations, financing activities, investing activities, net increase in cash.
P And L Kpis Template 1 Ppt PowerPoint Presentation Icon Background Image
This is a p and l kpis template 1 ppt powerpoint presentation icon background image. This is a four stage process. The stages in this process are business, management, analysis, table, strategy.

Balance Sheet Kpis Tabular Form Cont Ppt PowerPoint Presentation Model Graphics Tutorials
This is a balance sheet kpis tabular form cont ppt powerpoint presentation model graphics tutorials. This is a four stage process. The stages in this process are long term loans and advances, current investments, inventories, trade receivables.
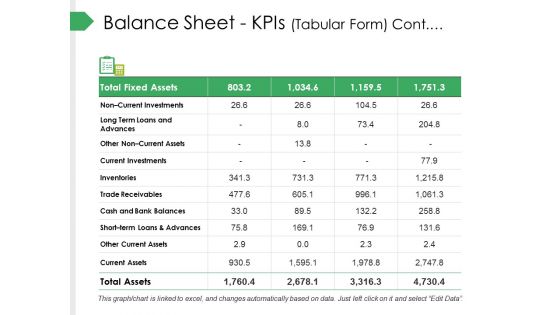
Balance Sheet Kpis Tabular Form Cont Ppt PowerPoint Presentation Summary Templates
This is a balance sheet kpis tabular form cont ppt powerpoint presentation summary templates. This is a four stage process. The stages in this process are current investments, inventories, trade receivables, cash and bank balances.
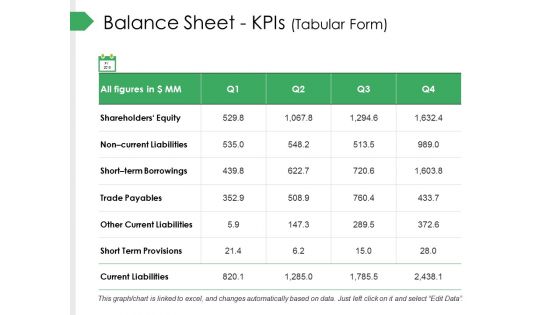
Balance Sheet Kpis Tabular Form Ppt PowerPoint Presentation Slides Designs Download
This is a balance sheet kpis tabular form ppt powerpoint presentation slides designs download. This is a four stage process. The stages in this process are trade payables, other current liabilities, short term provisions, current liabilities, short term borrowings.
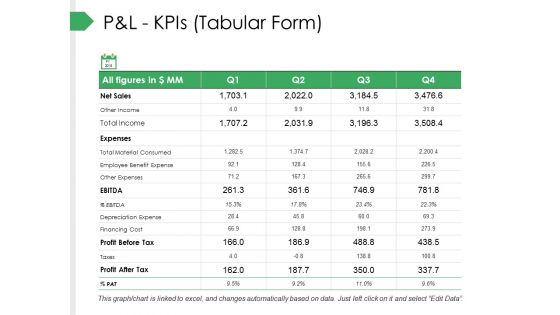
P And L Kpis Tabular Form Ppt PowerPoint Presentation Pictures Gallery
This is a p and l kpis tabular form ppt powerpoint presentation pictures gallery. This is a four stage process. The stages in this process are business, marketing, graph, strategy, finance.
Warehouse Performance KPIS Inventory Accuracy Real Time Reporting Ppt PowerPoint Presentation Icon Maker
This is a warehouse performance kpis inventory accuracy real time reporting ppt powerpoint presentation icon maker. This is a five stage process. The stages in this process are supply chain management, order fulfilment.
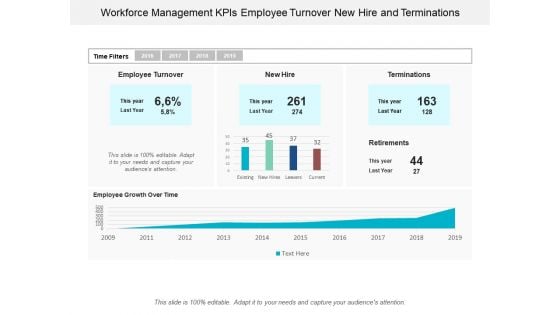
Workforce Management Kpis Employee Turnover New Hire And Terminations Ppt Powerpoint Presentation Portfolio Display
This is a workforce management kpis employee turnover new hire and terminations ppt powerpoint presentation portfolio display. This is a five stage process. The stages in this process are resource management, wealth management, capital management.
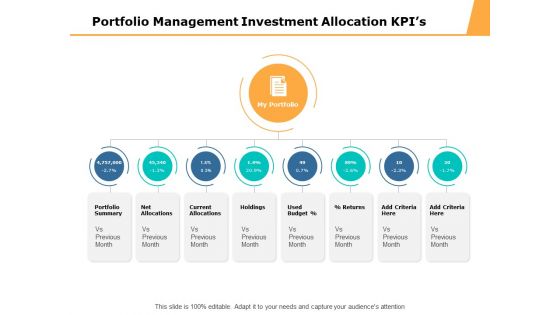
Portfolio Management Investment Allocation Kpis Ppt PowerPoint Presentation File Graphics Download
This is a portfolio management investment allocation kpis ppt powerpoint presentation file graphics download. This is a eight stage process. The stages in this process are business, management, marketing.
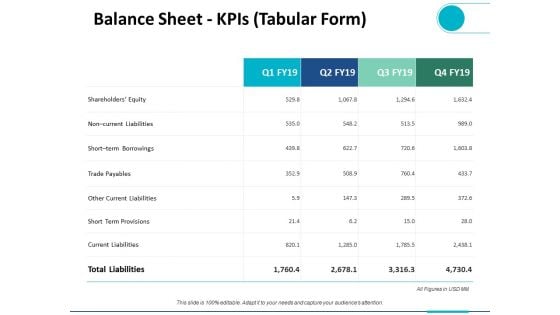
Balance Sheet Kpis Tabular Form Ppt PowerPoint Presentation Ideas Design Templates
This is a balance sheet kpis tabular form ppt powerpoint presentation ideas design templates. This is a four stage process. The stages in this process are finance, analysis, business, investment, marketing.
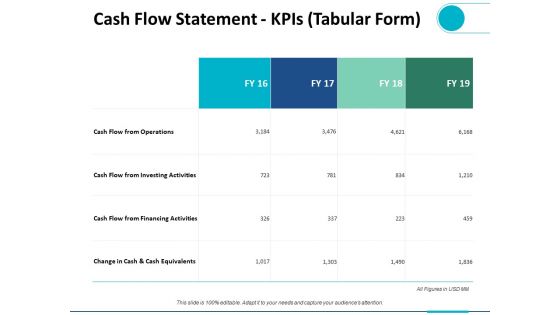
Cash Flow Statement Kpis Tabular Form Ppt PowerPoint Presentation Summary Infographic Template
This is a cash flow statement kpis tabular form ppt powerpoint presentation summary infographic template. This is a four stage process. The stages in this process are finance, analysis, business, investment, marketing.

P And L Kpis Tabular Form Ppt PowerPoint Presentation Ideas Brochure
This is a p and l kpis tabular form ppt powerpoint presentation ideas brochure. This is a four stage process. The stages in this process are business, planning, strategy, marketing, management.

Balance Sheet Kpis Tabular Form Management Ppt PowerPoint Presentation Summary Pictures
This is a balance sheet kpis tabular form management ppt powerpoint presentation summary pictures. This is a four stage process. The stages in this process are compare, marketing, business, management, planning.
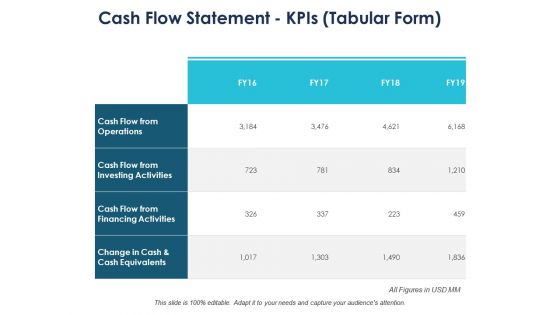
Cash Flow Statement Kpis Tabular Form Ppt PowerPoint Presentation Slides Themes
This is a cash flow statement kpis tabular form ppt powerpoint presentation slides themes. This is a four stage process. The stages in this process are finance, marketing, management, investment, analysis.
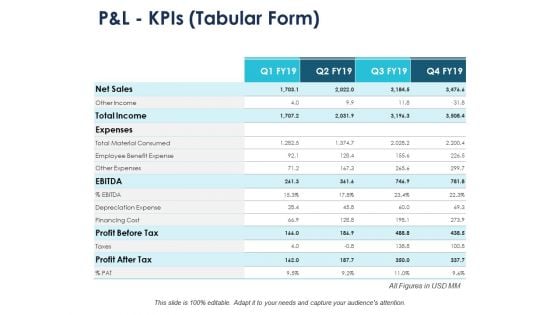
P And L Kpis Tabular Form Compare Ppt PowerPoint Presentation Gallery Maker
This is a p and l kpis tabular form compare ppt powerpoint presentation gallery maker. This is a four stage process. The stages in this process are compare, marketing, business, management, planning.
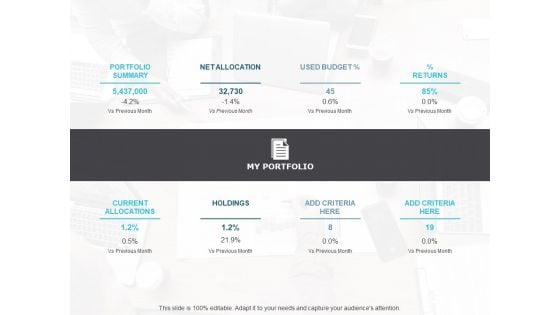
Portfolio Management Investment Allocation Kpis Ppt PowerPoint Presentation Infographic Template Templates
This is a portfolio management investment allocation kpis ppt powerpoint presentation infographic template templates. The topics discussed in this diagram are business, marketing, management. This is a completely editable PowerPoint presentation, and is available for immediate download.
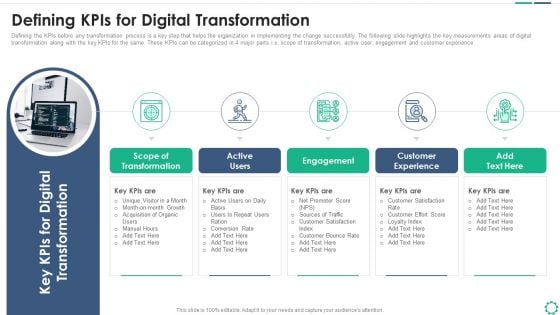
Digitalization Plan For Business Modernization Defining Kpis For Digital Transformation Sample PDF
Defining the KPIs before any transformation process is a key step that helps the organization in implementing the change successfully. The following slide highlights the key measurements areas of digital transformation along with the key KPIs for the same. These KPIs can be categorized in 4 major parts i.e. scope of transformation, active user, engagement and customer experience. This is a digitalization plan for business modernization defining kpis for digital transformation sample pdf template with various stages. Focus and dispense information on five stages using this creative set, that comes with editable features. It contains large content boxes to add your information on topics like scope of transformation, active users, engagement, customer experience. You can also showcase facts, figures, and other relevant content using this PPT layout. Grab it now.
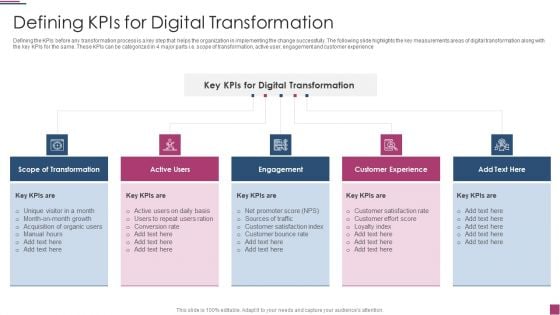
Innovation Procedure For Online Business Defining Kpis For Digital Transformation Summary PDF
Defining the KPIs before any transformation process is a key step that helps the organization in implementing the change successfully. The following slide highlights the key measurements areas of digital transformation along with the key KPIs for the same. These KPIs can be categorized in 4 major parts i.e. scope of transformation, active user, engagement and customer experience This is a Innovation Procedure For Online Business Defining Kpis For Digital Transformation Summary PDF template with various stages. Focus and dispense information on five stages using this creative set, that comes with editable features. It contains large content boxes to add your information on topics like Scope Of Transformation, Customer Experience, Digital Transformation You can also showcase facts, figures, and other relevant content using this PPT layout. Grab it now.
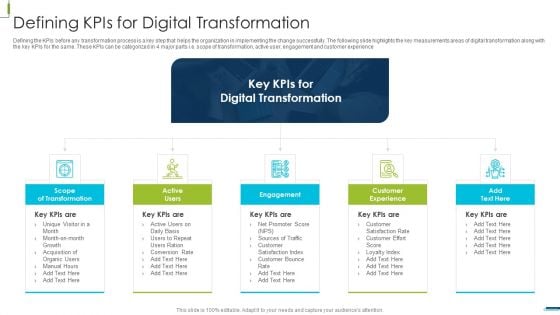
Corporate Digital Transformation Roadmap Defining Kpis For Digital Transformation Summary PDF
Defining the KPIs before any transformation process is a key step that helps the organization in implementing the change successfully. The following slide highlights the key measurements areas of digital transformation along with the key KPIs for the same. These KPIs can be categorized in 4 major parts i.e. scope of transformation, active user, engagement and customer experience This is a Corporate Digital Transformation Roadmap Defining Kpis For Digital Transformation Summary PDF template with various stages. Focus and dispense information on five stages using this creative set, that comes with editable features. It contains large content boxes to add your information on topics like Scope Of Transformation, Customer Experience, Engagement You can also showcase facts, figures, and other relevant content using this PPT layout. Grab it now.
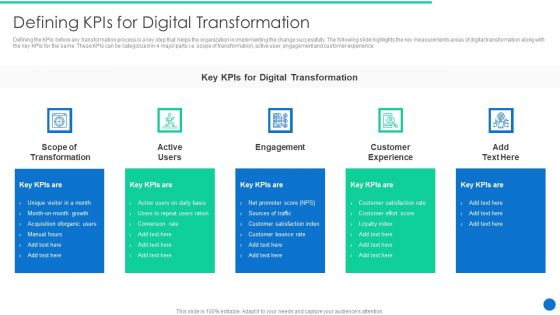
ERP Digital Transformation Journey Defining Kpis For Digital Transformation Sample PDF
Defining the KPIs before any transformation process is a key step that helps the organization in implementing the change successfully. The following slide highlights the key measurements areas of digital transformation along with the key KPIs for the same. These KPIs can be categorized in 4 major parts i.e. scope of transformation, active user, engagement and customer experience. This is a ERP Digital Transformation Journey Defining Kpis For Digital Transformation Sample PDF template with various stages. Focus and dispense information on five stages using this creative set, that comes with editable features. It contains large content boxes to add your information on topics like Scope Transformation, Engagement, Customer Experience. You can also showcase facts, figures, and other relevant content using this PPT layout. Grab it now.
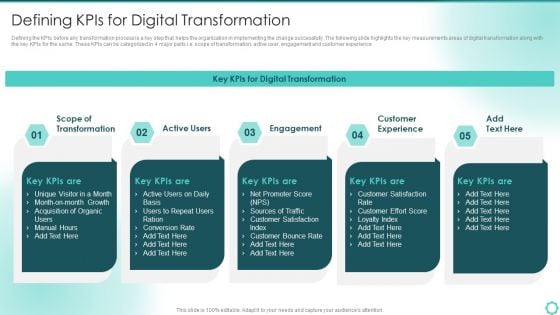
Digitalization Of Transportation Enterprise Defining Kpis For Digital Transformation Mockup PDF
Defining the KPIs before any transformation process is a key step that helps the organization in implementing the change successfully. The following slide highlights the key measurements areas of digital transformation along with the key KPIs for the same. These KPIs can be categorized in 4 major parts i.e. scope of transformation, active user, engagement and customer experience. This is a Digitalization Of Transportation Enterprise Defining Kpis For Digital Transformation Mockup PDF template with various stages. Focus and dispense information on five stages using this creative set, that comes with editable features. It contains large content boxes to add your information on topics like Growth, Conversion Rate, Sources Of Traffic. You can also showcase facts, figures, and other relevant content using this PPT layout. Grab it now.
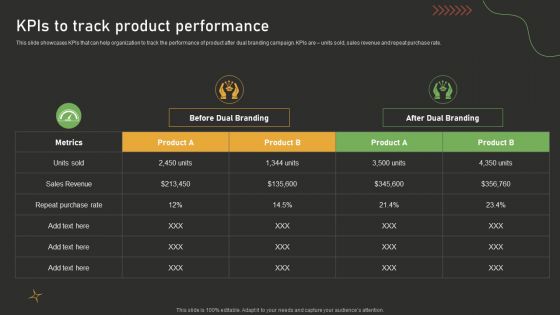
Kpis To Track Product Performance Dual Branding Campaign For Product Promotion Information PDF
This slide showcases KPIs that can help organization to track the performance of product after dual branding campaign. KPIs are units sold, sales revenue and repeat purchase rate.This Kpis To Track Product Performance Dual Branding Campaign For Product Promotion Information PDF is perfect for any presentation, be it in front of clients or colleagues. It is a versatile and stylish solution for organizing your meetings. The Kpis To Track Product Performance Dual Branding Campaign For Product Promotion Information PDF features a modern design for your presentation meetings. The adjustable and customizable slides provide unlimited possibilities for acing up your presentation. Slidegeeks has done all the homework before launching the product for you. So, do not wait, grab the presentation templates today
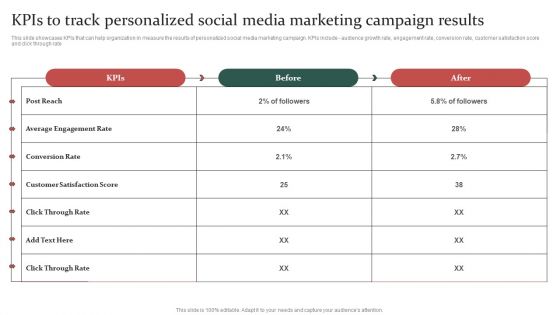
Gathering Customer Kpis To Track Personalized Social Media Marketing Campaign Results Portrait PDF
This slide showcases KPIs that can help organization in measure the results of personalized social media marketing campaign. KPIs include - audience growth rate, engagement rate, conversion rate, customer satisfaction score and click through rate. Do you have to make sure that everyone on your team knows about any specific topic I yes, then you should give Gathering Customer Kpis To Track Personalized Social Media Marketing Campaign Results Portrait PDF a try. Our experts have put a lot of knowledge and effort into creating this impeccable Gathering Customer Kpis To Track Personalized Social Media Marketing Campaign Results Portrait PDF. You can use this template for your upcoming presentations, as the slides are perfect to represent even the tiniest detail. You can download these templates from the Slidegeeks website and these are easy to edit. So grab these today.
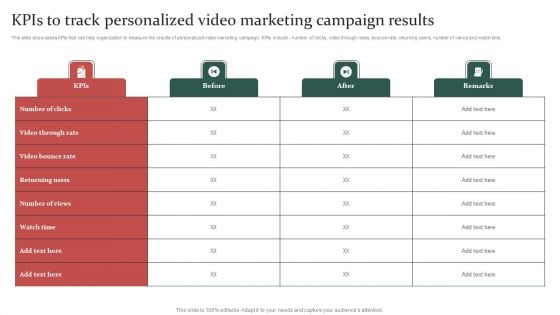
Gathering Customer Kpis To Track Personalized Video Marketing Campaign Results Guidelines PDF
This slide showcases KPIs that can help organization to measure the results of personalized video marketing campaign. KPIs include - number of clicks, video through rates, bounce rate, returning users, number of views and watch time. Get a simple yet stunning designed Gathering Customer Kpis To Track Personalized Video Marketing Campaign Results Guidelines PDF. It is the best one to establish the tone in your meetings. It is an excellent way to make your presentations highly effective. So, download this PPT today from Slidegeeks and see the positive impacts. Our easy-to-edit Gathering Customer Kpis To Track Personalized Video Marketing Campaign Results Guidelines PDF can be your go-to option for all upcoming conferences and meetings. So, what are you waiting for Grab this template today.
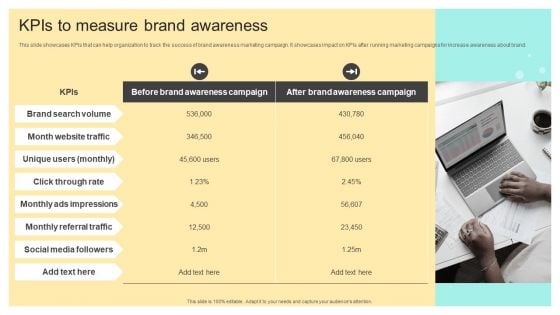
Kpis To Measure Brand Awareness Online And Offline Brand Promotion Techniques Background PDF
This slide showcases KPIs that can help organization to track the success of brand awareness marketing campaign. It showcases impact on KPIs after running marketing campaigns for increase awareness about brand.Here you can discover an assortment of the finest PowerPoint and Google Slides templates. With these templates, you can create presentations for a variety of purposes while simultaneously providing your audience with an eye-catching visual experience. Download Kpis To Measure Brand Awareness Online And Offline Brand Promotion Techniques Background PDF to deliver an impeccable presentation. These templates will make your job of preparing presentations much quicker, yet still, maintain a high level of quality. Slidegeeks has experienced researchers who prepare these templates and write high-quality content for you. Later on, you can personalize the content by editing the Kpis To Measure Brand Awareness Online And Offline Brand Promotion Techniques Background PDF.
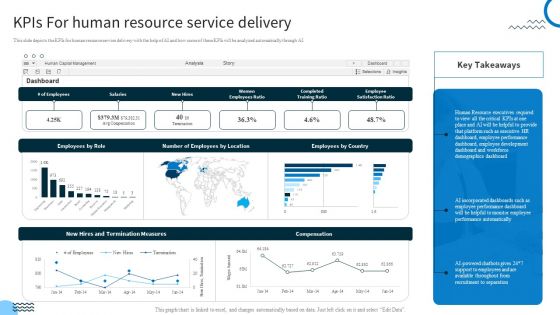
Redefining IT Solutions Delivery In A Post Pandemic Kpis For Human Resource Service Delivery Summary PDF
This slide depicts the KPIs for human resource service delivery with the help of AI and how some of these KPIs will be analyzed automatically through AI. Crafting an eye-catching presentation has never been more straightforward. Let your presentation shine with this tasteful yet straightforward Redefining IT Solutions Delivery In A Post Pandemic Kpis For Human Resource Service Delivery Summary PDF template. It offers a minimalistic and classy look that is great for making a statement. The colors have been employed intelligently to add a bit of playfulness while still remaining professional. Construct the ideal Redefining IT Solutions Delivery In A Post Pandemic Kpis For Human Resource Service Delivery Summary PDF that effortlessly grabs the attention of your audience. Begin now and be certain to wow your customers.
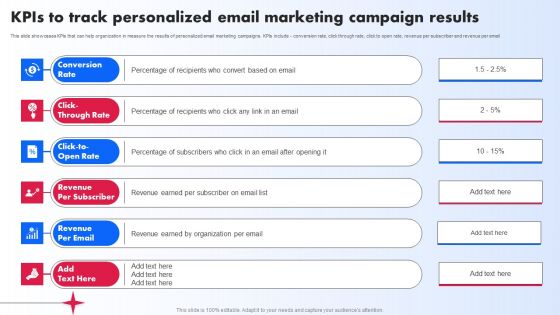
Kpis To Track Personalized Email Marketing Campaign Results Ppt PowerPoint Presentation File Diagrams PDF
This slide showcases KPIs that can help organization in measure the results of personalized email marketing campaigns. KPIs include conversion rate, click through rate, click to open rate, revenue per subscriber and revenue per email. Explore a selection of the finest Kpis To Track Personalized Email Marketing Campaign Results Ppt PowerPoint Presentation File Diagrams PDF here. With a plethora of professionally designed and pre made slide templates, you can quickly and easily find the right one for your upcoming presentation. You can use our Kpis To Track Personalized Email Marketing Campaign Results Ppt PowerPoint Presentation File Diagrams PDF to effectively convey your message to a wider audience. Slidegeeks has done a lot of research before preparing these presentation templates. The content can be personalized and the slides are highly editable. Grab templates today from Slidegeeks.


 Continue with Email

 Home
Home


