Dashboards

Value Chain Techniques For Performance Assessment Competitors Value Analysis Infographics PDF
Deliver an awe-inspiring pitch with this creative value chain techniques for performance assessment competitors value analysis infographics pdf. bundle. Topics like competitors value analysis can be discussed with this completely editable template. It is available for immediate download depending on the needs and requirements of the user.
Stakeholder Administration To Improve Investors Value And Develop Business Performance Post It Notes Infographics PDF
Deliver an awe inspiring pitch with this creative stakeholder administration to improve investors value and develop business performance post it notes infographics pdf bundle. Topics like post it notes can be discussed with this completely editable template. It is available for immediate download depending on the needs and requirements of the user.
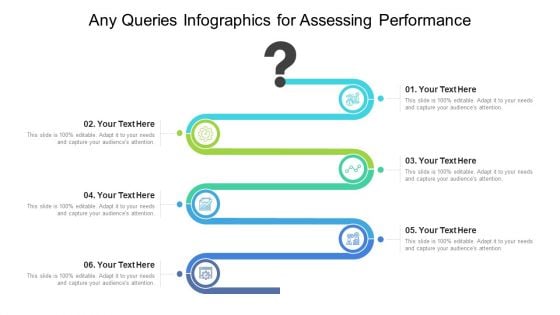
Any Queries Infographics For Assessing Performance Ppt PowerPoint Presentation File Display PDF
Persuade your audience using this . This PPT design covers six stages, thus making it a great tool to use. It also caters to a variety of topics including any queries infographics for assessing performance. Download this PPT design now to present a convincing pitch that not only emphasizes the topic but also showcases your presentation skills.
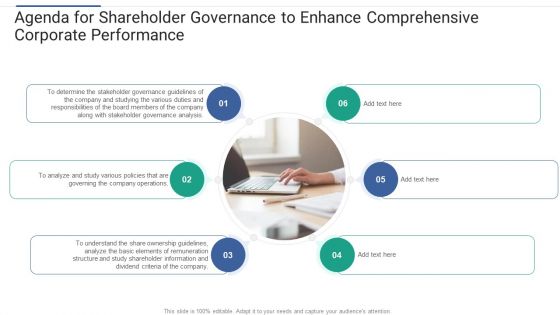
Agenda For Shareholder Governance To Enhance Comprehensive Corporate Performance Infographics PDF
This is a agenda for shareholder governance to enhance comprehensive corporate performance infographics pdf template with various stages. Focus and dispense information on six stages using this creative set, that comes with editable features. It contains large content boxes to add your information on topics like v. You can also showcase facts, figures, and other relevant content using this PPT layout. Grab it now.
Icons Slide For Project Management Outline For Schedule Performance Index Infographics PDF
Presenting our innovatively structured icons slide for project management outline for schedule performance index infographics pdf set of slides. The slides contain a hundred percent editable icons. You can replace these icons without any inconvenience. Therefore, pick this set of slides and create a striking presentation.
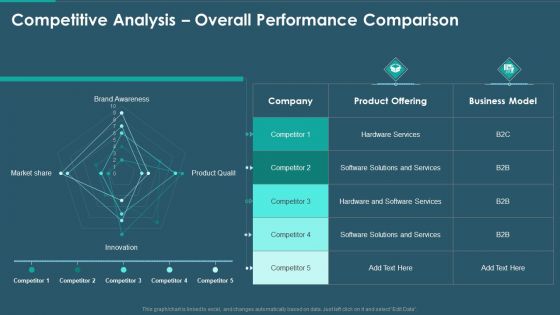
Sales And Promotion Playbook Competitive Analysis Overall Performance Comparison Infographics PDF
Deliver and pitch your topic in the best possible manner with this sales and promotion playbook competitive analysis overall performance comparison infographics pdf. Use them to share invaluable insights on product offering, business model, services and impress your audience. This template can be altered and modified as per your expectations. So, grab it now.
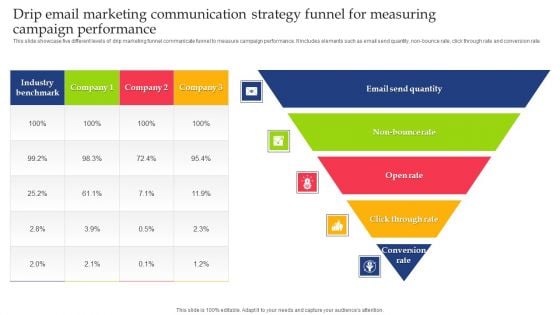
Drip Email Marketing Communication Strategy Funnel For Measuring Campaign Performance Infographics PDF
Showcasing this set of slides titled Drip Email Marketing Communication Strategy Funnel For Measuring Campaign Performance Infographics PDF. The topics addressed in these templates are Drip Email Marketing, Communication Strategy. All the content presented in this PPT design is completely editable. Download it and make adjustments in color, background, font etc. as per your unique business setting.
Icons Slide For Successful Corporate Technique For Enhancing Firms Performance Infographics PDF
Presenting our innovatively structured Icons Slide For Successful Corporate Technique For Enhancing Firms Performance Infographics PDF set of slides. The slides contain a hundred percent editable icons. You can replace these icons without any inconvenience. Therefore, pick this set of slides and create a striking presentation.
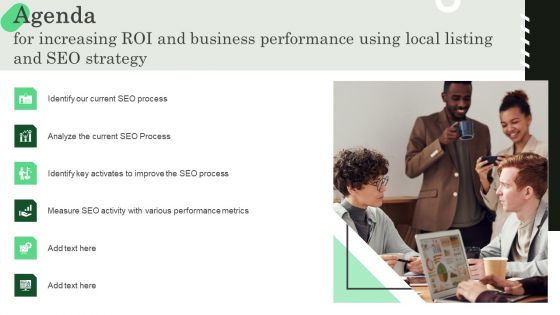
Agenda For Increasing ROI And Business Performance Using Local Listing And SEO Strategy Infographics PDF
There are so many reasons you need a Agenda For Increasing ROI And Business Performance Using Local Listing And SEO Strategy Infographics PDF. The first reason is you cannot spend time making everything from scratch, Thus, Slidegeeks has made presentation templates for you too. You can easily download these templates from our website easily.
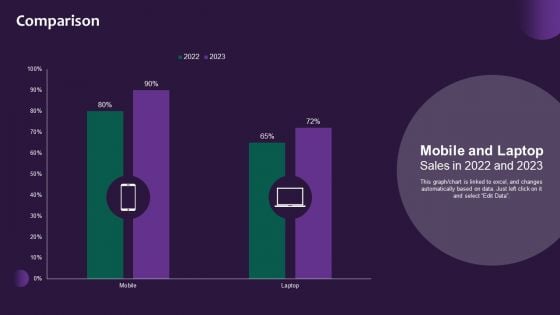
Information Systems Security And Risk Management Plan Comparison Rules PDF
This graph chart is linked to excel, and changes automatically based on data. Just left click on it and select Edit Data. Find highly impressive Information Systems Security And Risk Management Plan Comparison Rules PDF on Slidegeeks to deliver a meaningful presentation. You can save an ample amount of time using these presentation templates. No need to worry to prepare everything from scratch because Slidegeeks experts have already done a huge research and work for you. You need to download Information Systems Security And Risk Management Plan Comparison Rules PDF for your upcoming presentation. All the presentation templates are 100 percent editable and you can change the color and personalize the content accordingly. Download now.

Digital Marketing Progress Report And Insights Ppt PowerPoint Presentation Complete Deck With Slides
This complete deck acts as a great communication tool. It helps you in conveying your business message with personalized sets of graphics, icons etc. Comprising a set of thirty three slides, this complete deck can help you persuade your audience. It also induces strategic thinking as it has been thoroughly researched and put together by our experts. Not only is it easily downloadable but also editable. The colour, graphics, theme any component can be altered to fit your individual needs. So grab it now.

Cloud Based Email Security Market Report Ppt PowerPoint Presentation Complete Deck With Slides

Stock Market Research Report Ppt PowerPoint Presentation Complete Deck With Slides

Monthly Digital Marketing Report Template Ppt PowerPoint Presentation Complete Deck With Slides
This complete deck acts as a great communication tool. It helps you in conveying your business message with personalized sets of graphics, icons etc. Comprising a set of thritytwo slides, this complete deck can help you persuade your audience. It also induces strategic thinking as it has been thoroughly researched and put together by our experts. Not only is it easily downloadable but also editable. The color, graphics, theme any component can be altered to fit your individual needs. So grab it now.
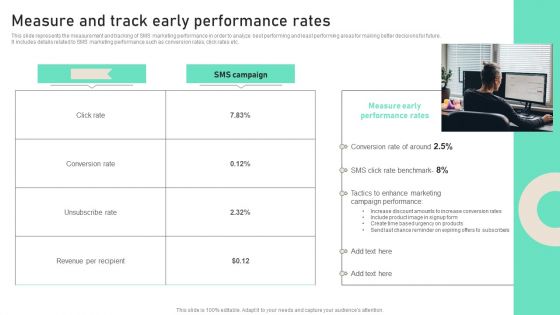
Measure And Track Early Performance Rates Ppt PowerPoint Presentation File Infographic Template PDF
This slide represents the measurement and tracking of SMS marketing performance in order to analyze best performing and least performing areas for making better decisions for future. It includes details related to SMS marketing performance such as conversion rates, click rates etc. Slidegeeks is here to make your presentations a breeze with Measure And Track Early Performance Rates Ppt PowerPoint Presentation File Infographic Template PDF With our easy to use and customizable templates, you can focus on delivering your ideas rather than worrying about formatting. With a variety of designs to choose from, you are sure to find one that suits your needs. And with animations and unique photos, illustrations, and fonts, you can make your presentation pop. So whether you are giving a sales pitch or presenting to the board, make sure to check out Slidegeeks first.
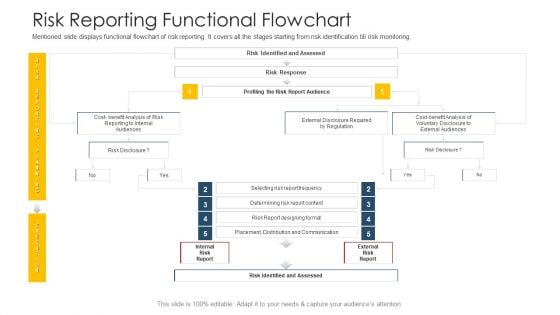
Establishing Operational Risk Framework Banking Risk Reporting Functional Flowchart Formats PDF
Mentioned slide displays functional flowchart of risk reporting. It covers all the stages starting from risk identification till risk monitoring. Deliver and pitch your topic in the best possible manner with this establishing operational risk framework banking risk reporting functional flowchart formats pdf. Use them to share invaluable insights on distribution and communication, risk reporting, cost benefit analysis and impress your audience. This template can be altered and modified as per your expectations. So, grab it now.
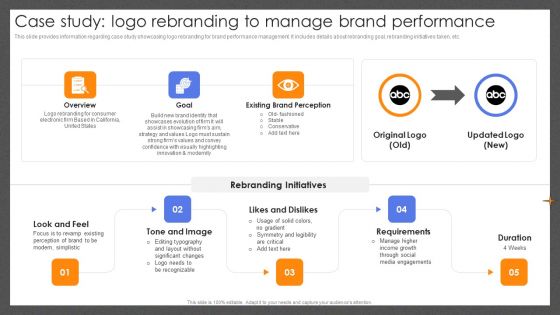
Guide For Effective Brand Case Study Logo Rebranding To Manage Brand Performance Infographics PDF
This slide provides information regarding case study showcasing logo rebranding for brand performance management. It includes details about rebranding goal, rebranding initiatives taken, etc. Crafting an eye-catching presentation has never been more straightforward. Let your presentation shine with this tasteful yet straightforward Guide For Effective Brand Case Study Logo Rebranding To Manage Brand Performance Infographics PDF template. It offers a minimalistic and classy look that is great for making a statement. The colors have been employed intelligently to add a bit of playfulness while still remaining professional. Construct the ideal Guide For Effective Brand Case Study Logo Rebranding To Manage Brand Performance Infographics PDF that effortlessly grabs the attention of your audience Begin now and be certain to wow your customers.
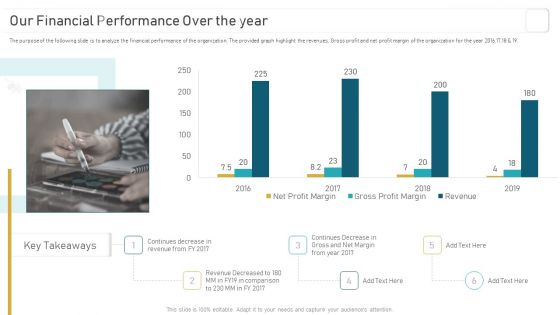
Deploying And Managing Recurring Our Financial Performance Over The Year Infographics PDF
The purpose of the following slide is to analyze the financial performance of the organization. The provided graph highlight the revenues, Gross profit and net profit margin of the organization for the year 2016,17,18 and 19. If you are looking for a format to display your unique thoughts, then the professionally designed Deploying And Managing Recurring Our Financial Performance Over The Year Infographics PDF is the one for you. You can use it as a Google Slides template or a PowerPoint template. Incorporate impressive visuals, symbols, images, and other charts. Modify or reorganize the text boxes as you desire. Experiment with shade schemes and font pairings. Alter, share or cooperate with other people on your work. Download Deploying And Managing Recurring Our Financial Performance Over The Year Infographics PDF and find out how to give a successful presentation. Present a perfect display to your team and make your presentation unforgettable.
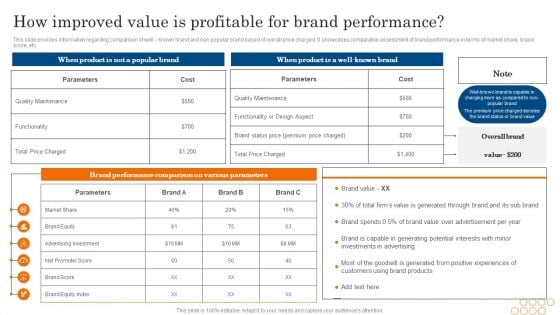
How Improved Value Is Profitable For Brand Performance Ppt PowerPoint Presentation File Infographic Template PDF
This slide provides information regarding comparison of well known brand and non popular brand based of overall price charged. It showcases comparative assessment of brand performance in terms of market share, brand score, etc. Crafting an eye-catching presentation has never been more straightforward. Let your presentation shine with this tasteful yet straightforward How Improved Value Is Profitable For Brand Performance Ppt PowerPoint Presentation File Infographic Template PDF template. It offers a minimalistic and classy look that is great for making a statement. The colors have been employed intelligently to add a bit of playfulness while still remaining professional. Construct the ideal How Improved Value Is Profitable For Brand Performance Ppt PowerPoint Presentation File Infographic Template PDF that effortlessly grabs the attention of your audience Begin now and be certain to wow your customers.
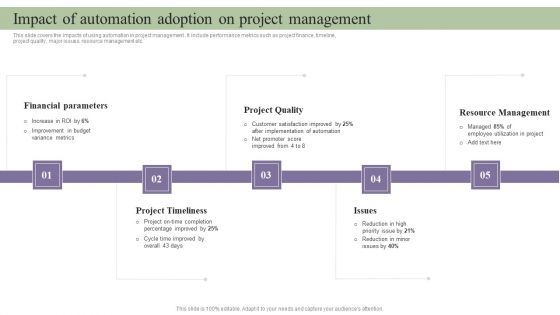
Deployment Of Process Automation To Increase Organisational Performance Impact Of Automation Adoption Infographics PDF
This slide covers the impacts of using automation in project management . It include performance metrics such as project finance, timeline, project quality, major issues, resource management etc. Do you have to make sure that everyone on your team knows about any specific topic I yes, then you should give Deployment Of Process Automation To Increase Organisational Performance Impact Of Automation Adoption Infographics PDF a try. Our experts have put a lot of knowledge and effort into creating this impeccable Deployment Of Process Automation To Increase Organisational Performance Impact Of Automation Adoption Infographics PDF. You can use this template for your upcoming presentations, as the slides are perfect to represent even the tiniest detail. You can download these templates from the Slidegeeks website and these are easy to edit. So grab these today.
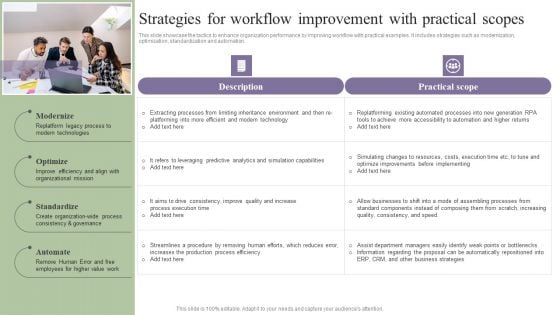
Deployment Of Process Automation To Increase Organisational Performance Strategies For Workflow Improvement Infographics PDF
This slide showcase the tactics to enhance organization performance by improving workflow with practical examples. It includes strategies such as modernization, optimization, standardization and automation. Are you searching for a Deployment Of Process Automation To Increase Organisational Performance Strategies For Workflow Improvement Infographics PDF that is uncluttered, straightforward, and original Its easy to edit, and you can change the colors to suit your personal or business branding. For a presentation that expresses how much effort you have put in, this template is ideal. With all of its features, including tables, diagrams, statistics, and lists, its perfect for a business plan presentation. Make your ideas more appealing with these professional slides. Download Deployment Of Process Automation To Increase Organisational Performance Strategies For Workflow Improvement Infographics PDF from Slidegeeks today.
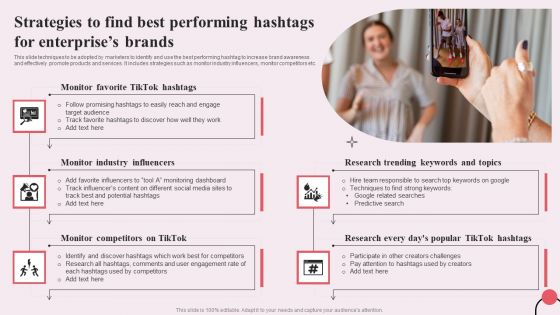
Tiktok Digital Marketing Campaign Strategies To Find Best Performing Hashtags For Enterprises Brands Infographics PDF
This slide techniques to be adopted by marketers to identify and use the best performing hashtag to increase brand awareness and effectively promote products and services. It includes strategies such as monitor industry influencers, monitor competitors etc. Do you have an important presentation coming up Are you looking for something that will make your presentation stand out from the rest Look no further than Tiktok Digital Marketing Campaign Strategies To Find Best Performing Hashtags For Enterprises Brands Infographics PDF. With our professional designs, you can trust that your presentation will pop and make delivering it a smooth process. And with Slidegeeks, you can trust that your presentation will be unique and memorable. So why wait Grab Tiktok Digital Marketing Campaign Strategies To Find Best Performing Hashtags For Enterprises Brands Infographics PDF today and make your presentation stand out from the rest
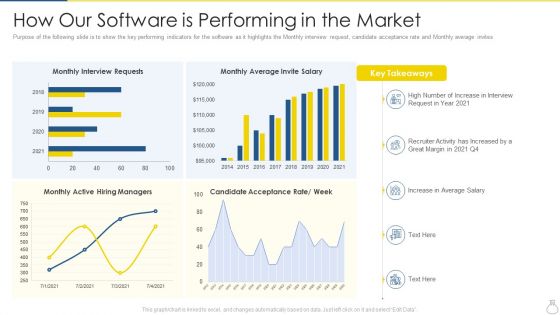
Company Recruitment Application Investor Funding Pitch Deck How Our Software Is Performing In The Market Clipart PDF
Purpose of the following slide is to show the key performing indicators for the software as it highlights the Monthly interview request, candidate acceptance rate and Monthly average invites Deliver and pitch your topic in the best possible manner with this company recruitment application investor funding pitch deck how our software is performing in the market clipart pdf. Use them to share invaluable insights on monthly interview requests, monthly average invite salary, key takeaways and impress your audience. This template can be altered and modified as per your expectations. So, grab it now.
Benefits Using Market Intelligence Marketing Intelligence Guide Data Gathering Icons Pdf
This slide showcases various advantages of using market intelligence for companies to analyze and asses business environment. It showcases benefits such as better insights of actionable data, enhance client retention competencies, increase opportunities for upselling. Boost your pitch with our creative Benefits Using Market Intelligence Marketing Intelligence Guide Data Gathering Icons Pdf. Deliver an awe inspiring pitch that will mesmerize everyone. Using these presentation templates you will surely catch everyones attention. You can browse the ppts collection on our website. We have researchers who are experts at creating the right content for the templates. So you do not have to invest time in any additional work. Just grab the template now and use them. This slide showcases various advantages of using market intelligence for companies to analyze and asses business environment. It showcases benefits such as better insights of actionable data, enhance client retention competencies, increase opportunities for upselling.
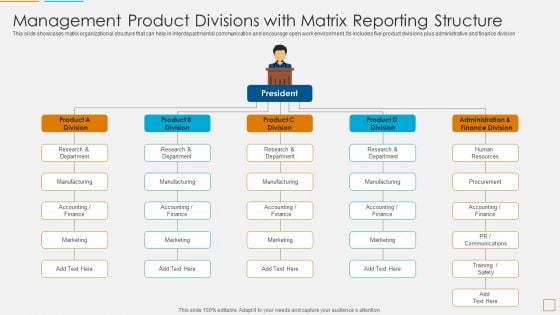
Management Product Divisions With Matrix Reporting Structure Elements PDF
This slide showcases matrix organizational structure that can help in interdepartmental communication and encourage open work environment. Its includes five product divisions plus administrative and finance division Persuade your audience using this management product divisions with matrix reporting structure elements pdf. This PPT design covers five stages, thus making it a great tool to use. It also caters to a variety of topics including research and department, manufacturing, marketing. Download this PPT design now to present a convincing pitch that not only emphasizes the topic but also showcases your presentation skills.
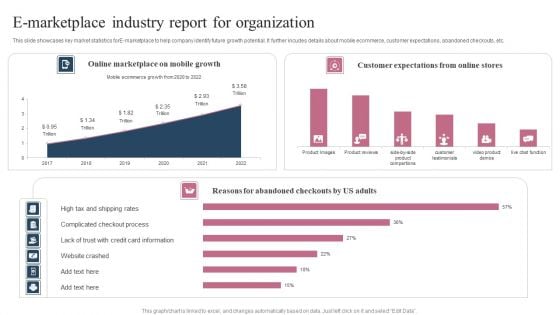
E Marketplace Industry Report For Organization Ppt Pictures Maker PDF
This slide showcases key market statistics forE-marketplace to help company identify future growth potential. It further incudes details about mobile ecommerce, customer expectations, abandoned checkouts, etc. Showcasing this set of slides titled E Marketplace Industry Report For Organization Ppt Pictures Maker PDF. The topics addressed in these templates are Online Marketplace, Mobile Growth, Customer Expectations, Online Stores. All the content presented in this PPT design is completely editable. Download it and make adjustments in color, background, font etc. as per your unique business setting.
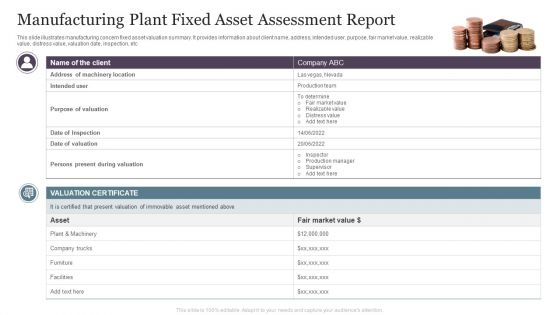
Manufacturing Plant Fixed Asset Assessment Report Graphics PDF
This slide illustrates manufacturing concern fixed asset valuation summary. It provides information about client name, address, intended user, purpose, fair market value, realizable value, distress value, valuation date, inspection, etc.Presenting Manufacturing Plant Fixed Asset Assessment Report Graphics PDF to dispense important information. This template comprises one stage. It also presents valuable insights into the topics including Purpose Valuation, During Valuation, Immovable Asset. This is a completely customizable PowerPoint theme that can be put to use immediately. So, download it and address the topic impactfully.
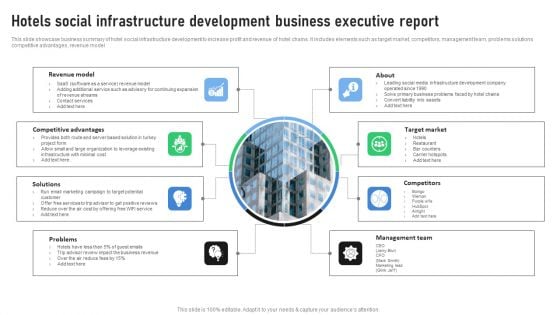
Hotels Social Infrastructure Development Business Executive Report Topics PDF
This slide showcase business summary of hotel social infrastructure development to increase profit and revenue of hotel chains. It includes elements such as target market, competitors, management team, problems solutions competitive advantages, revenue model. Persuade your audience using this Hotels Social Infrastructure Development Business Executive Report Topics PDF. This PPT design covers ten stages, thus making it a great tool to use. It also caters to a variety of topics including Revenue Model, Competitive Advantages, Solutions, Problems. Download this PPT design now to present a convincing pitch that not only emphasizes the topic but also showcases your presentation skills.
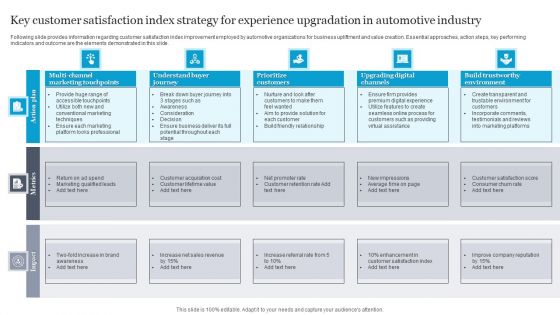
Key Customer Satisfaction Index Strategy For Experience Upgradation In Automotive Industry Download PDF
Following slide provides information regarding customer satisfaction index improvement employed by automotive organizations for business upliftment and value creation. Essential approaches, action steps, key performing indicators and outcome are the elements demonstrated in this slide. Showcasing this set of slides titled Key Customer Satisfaction Index Strategy For Experience Upgradation In Automotive Industry Download PDF. The topics addressed in these templates are Understand Buyer Journey, Prioritize Customers. All the content presented in this PPT design is completely editable. Download it and make adjustments in color, background, font etc. as per your unique business setting.

Steps To Execute Market Intelligence Marketing Intelligence Guide Data Gathering Formats Pdf
The following slide presents various steps to implement market intelligence system for enterprises to gain information about external business environment. It highlights key steps such as coaching and motivation programs for sales representatives, inspiring marketers to explore market intelligence, etc. From laying roadmaps to briefing everything in detail, our templates are perfect for you. You can set the stage with your presentation slides. All you have to do is download these easy to edit and customizable templates. Steps To Execute Market Intelligence Marketing Intelligence Guide Data Gathering Formats Pdf will help you deliver an outstanding performance that everyone would remember and praise you for. Do download this presentation today. The following slide presents various steps to implement market intelligence system for enterprises to gain information about external business environment. It highlights key steps such as coaching and motivation programs for sales representatives, inspiring marketers to explore market intelligence, etc.
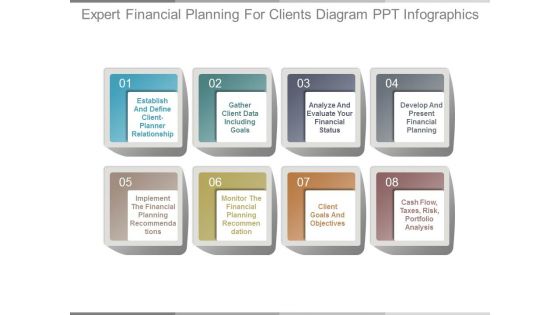
Expert Financial Planning For Clients Diagram Ppt Infographics
This is a expert financial planning for clients diagram ppt infographics. This is a ten stage process. The stages in this process are establish and define client planner relationship, gather client data including goals, analyze and evaluate your financial status, develop and present financial planning, implement the financial planning recommendations, monitor the financial planning recommendation, client goals and objectives, cash flow, taxes, risk, portfolio analysis.
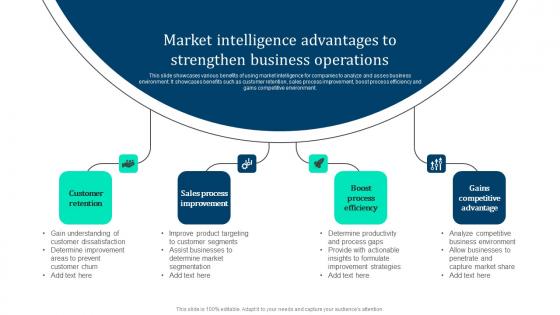
Market Intelligence Advantages Strengthen Marketing Intelligence Guide Data Gathering Demonstration Pdf
This slide showcases various benefits of using market intelligence for companies to analyze and asses business environment. It showcases benefits such as customer retention, sales process improvement, boost process efficiency and gains competitive environment. This Market Intelligence Advantages Strengthen Marketing Intelligence Guide Data Gathering Demonstration Pdf is perfect for any presentation, be it in front of clients or colleagues. It is a versatile and stylish solution for organizing your meetings. The Market Intelligence Advantages Strengthen Marketing Intelligence Guide Data Gathering Demonstration Pdf features a modern design for your presentation meetings. The adjustable and customizable slides provide unlimited possibilities for acing up your presentation. Slidegeeks has done all the homework before launching the product for you. So, do not wait, grab the presentation templates today This slide showcases various benefits of using market intelligence for companies to analyze and asses business environment. It showcases benefits such as customer retention, sales process improvement, boost process efficiency and gains competitive environment.
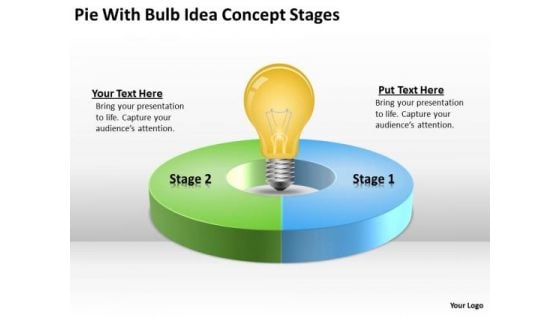
Pie With Bulb Idea Concept Stages What Is Business Continuity Plan PowerPoint Slides
We present our pie with bulb idea concept stages what is business continuity plan PowerPoint Slides.Download our Circle Charts PowerPoint Templates because It will Strengthen your hand with your thoughts. They have all the aces you need to win the day. Present our Signs PowerPoint Templates because Our PowerPoint Templates and Slides team portray an attitude of elegance. Personify this quality by using them regularly. Present our Shapes PowerPoint Templates because It can Bubble and burst with your ideas. Download our Ring Charts PowerPoint Templates because our bewitching PowerPoint Templates and Slides will delight your audience with the magic of your words. Download our Light Bulbs PowerPoint Templates because You can Score a slam dunk with our PowerPoint Templates and Slides. Watch your audience hang onto your every word.Use these PowerPoint slides for presentations relating to pie, chart, network, isolated, nobody, green, copy, white, red, flow, business, three-dimensional, sign, render, symbol, diagram, change, circle, finance, data, rendering, process, flowchart, plastic, graphics, shape, computer, abstract, graph, cycle, illustration, icon, connection, circular, strategy, round, up, shiny, reflection, solution, design, cylinder, color, growth, blue, background, single, financial, 3d. The prominent colors used in the PowerPoint template are Yellow, Blue, Green. Acquire the aura of a champion. Enhance your charisma with our Pie With Bulb Idea Concept Stages What Is Business Continuity Plan PowerPoint Slides.
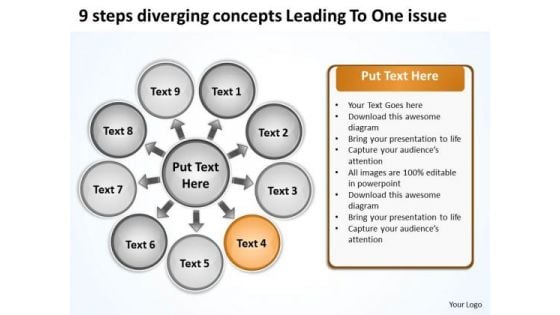
9 Steps Diverging Concepts Leading To One Issue Arrows Chart Software PowerPoint Slides
We present our 9 steps diverging concepts leading to one issue Arrows Chart Software PowerPoint Slides.Use our Circle charts PowerPoint Templates because you can asked to strive to give true form to your great dream. Use our Shapes PowerPoint Templates because the graphic is a symbol of growth and success. Present our Ring charts PowerPoint Templates because this diagram helps to reaffirm to your team your faith in maintaining the highest ethical standards. Present our Process and Flows PowerPoint Templates because you will be able to Highlight these individual targets and the paths to their achievement. Download and present our Signs PowerPoint Templates because this diagram helps in examine each brilliant thought in thorough detail highlighting all the pros and cons as minutely as possible.Use these PowerPoint slides for presentations relating to Business, chart, circle, colors, concept, corporate, cycle, data, design, detail, development, diagram, engineering, graphic, ideas, illustration, image, implement, implementation, life, lifecycle, management, model, objects, organization, plan, process, product, professional, project, quality, schema, shape, stack, stage, steps, strategy, structure, success, symbol. The prominent colors used in the PowerPoint template are Green, Black, White. You can be sure our 9 steps diverging concepts leading to one issue Arrows Chart Software PowerPoint Slides are Dynamic. Presenters tell us our concept PowerPoint templates and PPT Slides are Dynamic. We assure you our 9 steps diverging concepts leading to one issue Arrows Chart Software PowerPoint Slides are aesthetically designed to attract attention. We guarantee that they will grab all the eyeballs you need. Customers tell us our concept PowerPoint templates and PPT Slides are Royal. Presenters tell us our 9 steps diverging concepts leading to one issue Arrows Chart Software PowerPoint Slides have awesome images to get your point across. You can be sure our circle PowerPoint templates and PPT Slides are Quaint. Keep them driven with our 9 Steps Diverging Concepts Leading To One Issue Arrows Chart Software PowerPoint Slides. You will come out on top.
Business Diagram Cloud Computing Data Upload And Download Icons Ppt Slide
Concept of data upload and download has been displayed in this technology diagram. This diagram depicts concept of data transfer in cloud computing. This diagram is suitable to display cloud data transfer related topics.
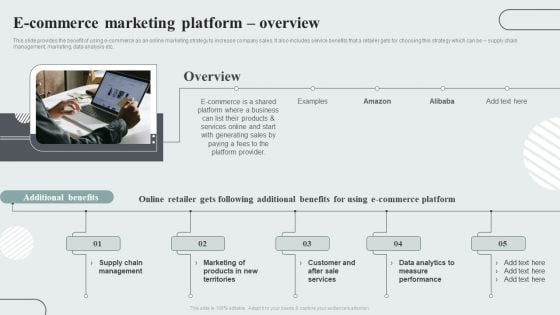
Techniques To Enhance Customer Engagement Via Digital Platforms E Commerce Marketing Platform Overview Diagrams PDF
This slide provides the benefit of using e-commerce as an online marketing strategy to increase company sales. It also includes service benefits that a retailer gets for choosing this strategy which can be supply chain management, marketing, data analysis etc. If your project calls for a presentation, then Slidegeeks is your go-to partner because we have professionally designed, easy-to-edit templates that are perfect for any presentation. After downloading, you can easily edit Techniques To Enhance Customer Engagement Via Digital Platforms E Commerce Marketing Platform Overview Diagrams PDF and make the changes accordingly. You can rearrange slides or fill them with different images. Check out all the handy templates
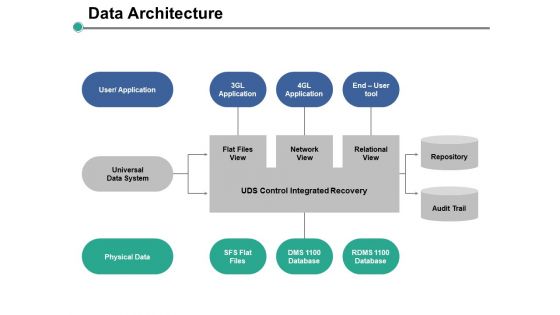
Data Architecture Ppt PowerPoint Presentation Professional Skills
This is a data architecture ppt powerpoint presentation professional skills. This is a three stage process. The stages in this process are business, management, planning, strategy, marketing.
Average Whole Time Equivalent Workforce Report Ppt PowerPoint Presentation Icon Files PDF
Pitch your topic with ease and precision using this average whole time equivalent workforce report ppt powerpoint presentation icon files pdf. This layout presents information on average whole time equivalent workforce report. It is also available for immediate download and adjustment. So, changes can be made in the color, design, graphics or any other component to create a unique layout.
Medical Report With Heart Symbol Vector Icon Ppt Summary Graphics PDF
Pitch your topic with ease and precision using this medical report with heart symbol vector icon ppt summary graphics pdf. This layout presents information on medical report with heart symbol vector icon. It is also available for immediate download and adjustment. So, changes can be made in the color, design, graphics or any other component to create a unique layout.
Patient Medical Report With Conditions Icon Ppt Infographic Template Introduction PDF
Showcasing this set of slides titled patient medical report with conditions icon ppt infographic template introduction pdf. The topics addressed in these templates are patient medical report with conditions icon. All the content presented in this PPT design is completely editable. Download it and make adjustments in color, background, font etc. as per your unique business setting.
Annual Business Statistics Report Charts Vector Icon Ppt Ideas Slideshow PDF
Deliver and pitch your topic in the best possible manner with this annual business statistics report charts vector icon ppt ideas slideshow pdf. Use them to share invaluable insights on annual business statistics report charts vector icon and impress your audience. This template can be altered and modified as per your expectations. So, grab it now.
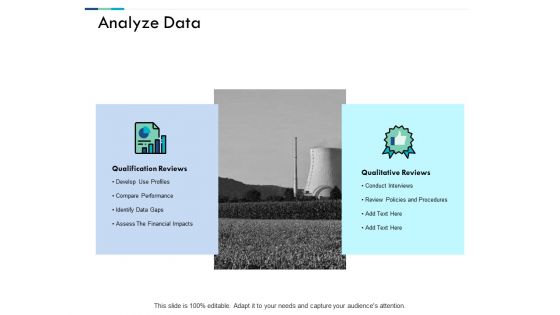
Analyze Data Ppt PowerPoint Presentation Summary Graphics Tutorials
This is a analyze data ppt powerpoint presentation summary graphics tutorials. The topics discussed in this diagram are business, management, planning, strategy, marketing. This is a completely editable PowerPoint presentation, and is available for immediate download.
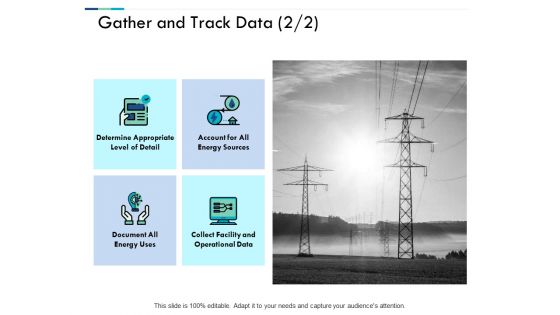
Gather And Track Data Business Ppt PowerPoint Presentation File Samples
This is a gather and track data business ppt powerpoint presentation file samples. The topics discussed in this diagram are business, management, planning, strategy, marketing. This is a completely editable PowerPoint presentation, and is available for immediate download.
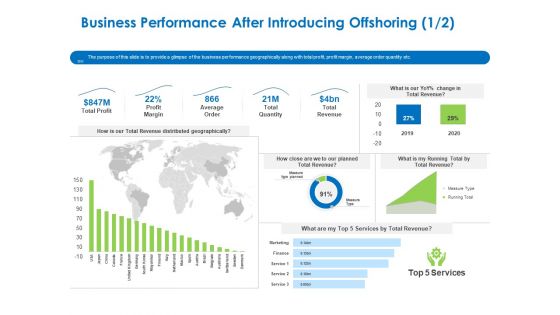
Relocation Of Business Process Offshoring Business Performance After Introducing Offshoring Infographics PDF
The purpose of this slide is to provide a glimpse of the business performance geographically along with total profit, profit margin, average order quantity etc. Deliver and pitch your topic in the best possible manner with this relocation of business process offshoring business performance after introducing offshoring infographics pdf. Use them to share invaluable insights on total profit, profit margin, average order, total quantity, total revenue and impress your audience. This template can be altered and modified as per your expectations. So, grab it now.
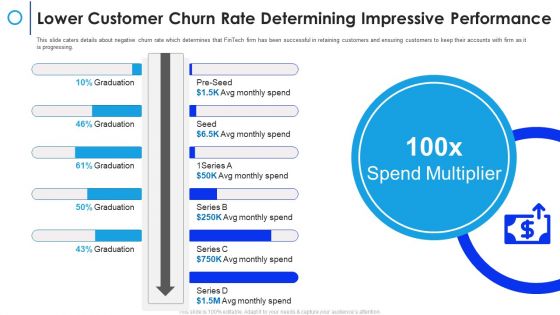
Financial Technology Firm Lower Customer Churn Rate Determining Impressive Performance Infographics PDF
This slide caters details about negative churn rate which determines that FinTech firm has been successful in retaining customers and ensuring customers to keep their accounts with firm as it is progressing. Deliver an awe inspiring pitch with this creative financial technology firm lower customer churn rate determining impressive performance infographics pdf bundle. Topics like lower customer churn rate determining impressive performance can be discussed with this completely editable template. It is available for immediate download depending on the needs and requirements of the user.
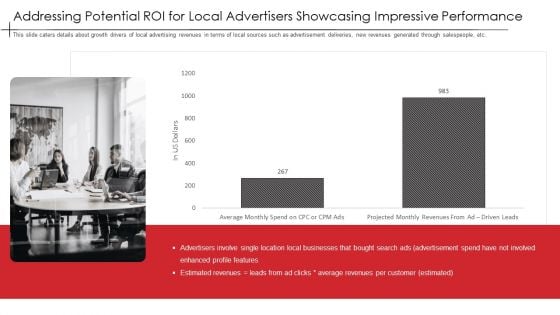
Addressing Potential Roi For Local Advertisers Showcasing Impressive Performance Infographics PDF
This slide caters details about growth drivers of local advertising revenues in terms of local sources such as advertisement deliveries, new revenues generated through salespeople, etc. Deliver and pitch your topic in the best possible manner with this addressing potential roi for local advertisers showcasing impressive performance infographics pdf. Use them to share invaluable insights on addressing potential roi for local advertisers showcasing impressive performance and impress your audience. This template can be altered and modified as per your expectations. So, grab it now.
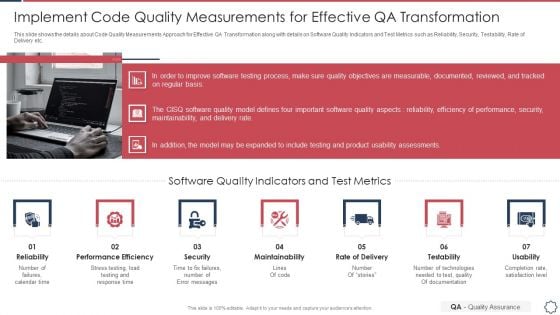
Quality Assurance Transformation Strategies To Improve Business Performance Efficiency Implement Code Quality Measurements Infographics PDF
This slide shows the details about Code Quality Measurements Approach for Effective QA Transformation along with details on Software Quality Indicators and Test Metrics such as Reliability, Security, Testability, Rate of Delivery etc. Presenting quality assurance transformation strategies to improve business performance efficiency implement code quality measurements infographics pdf to provide visual cues and insights. Share and navigate important information on seven stages that need your due attention. This template can be used to pitch topics like performance efficiency, maintainability, rate of delivery, testability, usability. In addtion, this PPT design contains high resolution images, graphics, etc, that are easily editable and available for immediate download.
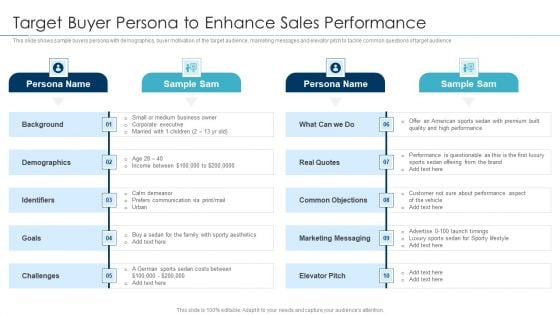
Approaches For New Product Release Target Buyer Persona To Enhance Sales Performance Infographics PDF
This slide shows sample buyers persona with demographics, buyer motivation of the target audience, marketing messages and elevator pitch to tackle common questions of target audience Presenting approaches for new product release target buyer persona to enhance sales performance infographics pdf to provide visual cues and insights. Share and navigate important information on four stages that need your due attention. This template can be used to pitch topics like target buyer persona to enhance sales performance . In addtion, this PPT design contains high resolution images, graphics, etc, that are easily editable and available for immediate download.
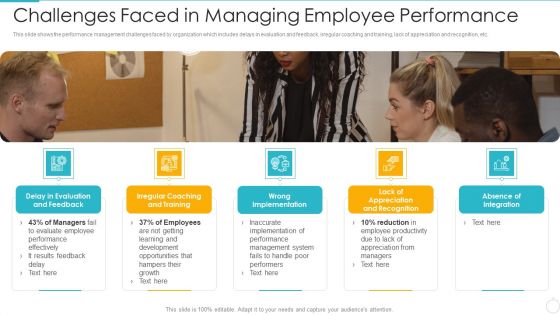
Improving Employee Performance Management System In Organization Challenges Faced Infographics PDF
This slide shows the performance management challenges faced by organization which includes delays in evaluation and feedback, irregular coaching and training, lack of appreciation and recognition, etc.This is a improving employee performance management system in organization challenges faced infographics pdf template with various stages. Focus and dispense information on five stages using this creative set, that comes with editable features. It contains large content boxes to add your information on topics like delay in evaluation and feedback, irregular coaching and training, wrong implementation You can also showcase facts, figures, and other relevant content using this PPT layout. Grab it now.
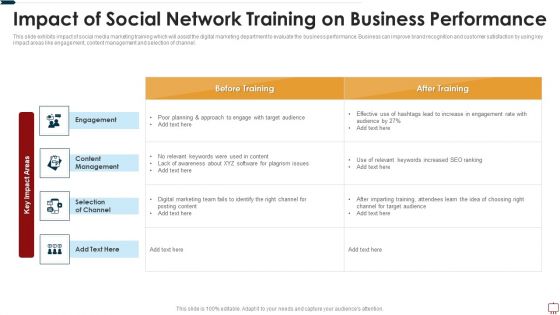
Impact Of Social Network Training On Business Performance Ppt Infographic Template Layouts PDF
This slide exhibits impact of social media marketing training which will assist the digital marketing department to evaluate the business performance. Business can improve brand recognition and customer satisfaction by using key impact areas like engagement, content management and selection of channel. Pitch your topic with ease and precision using this impact of social network training on business performance ppt infographic template layouts pdf. This layout presents information on engagement, content management, selection of channel. It is also available for immediate download and adjustment. So, changes can be made in the color, design, graphics or any other component to create a unique layout.
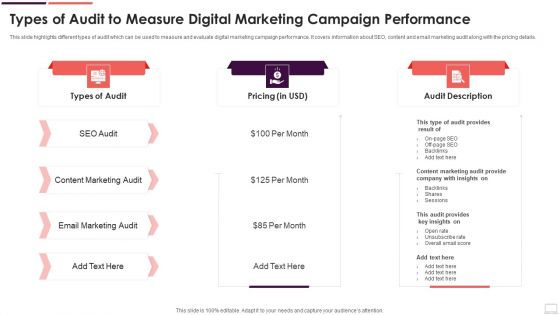
Types Of Audit To Measure Digital Marketing Campaign Performance Infographics PDF
This slide highlights different types of audit which can be used to measure and evaluate digital marketing campaign performance. It covers information about SEO, content and email marketing audit along with the pricing details. Showcasing this set of slides titled Types Of Audit To Measure Digital Marketing Campaign Performance Infographics PDF. The topics addressed in these templates are Email Marketing Audit, SEO Audit, Content Marketing Audit. All the content presented in this PPT design is completely editable. Download it and make adjustments in color, background, font etc. as per your unique business setting.
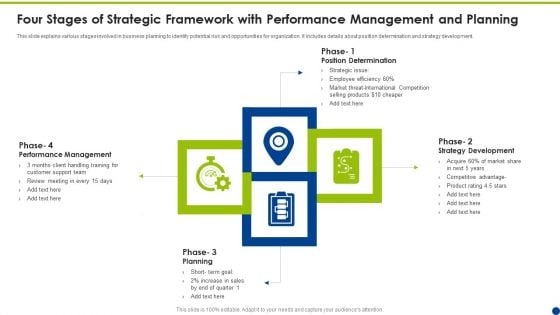
Four Stages Of Strategic Framework With Performance Management And Planning Ppt Infographic Template Template PDF
This slide explains various stages involved in business planning to identify potential risk and opportunities for organization. It includes details about position determination and strategy development. Presenting Four Stages Of Strategic Framework With Performance Management And Planning Ppt Infographic Template Template PDF to dispense important information. This template comprises four stages. It also presents valuable insights into the topics including Position Determination, Strategy Development, Performance Management . This is a completely customizable PowerPoint theme that can be put to use immediately. So, download it and address the topic impactfully.
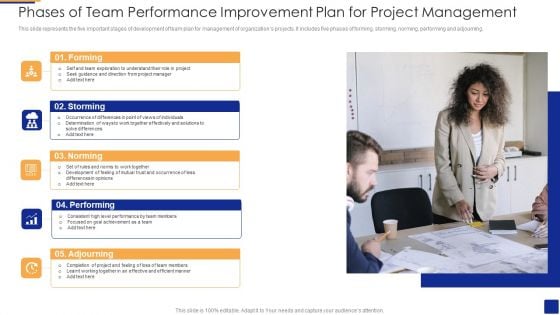
Phases Of Team Performance Improvement Plan For Project Management Infographics PDF
This slide represents the five important stages of development of team plan for management of organizations projects. It includes five phases of forming, storming, norming, performing and adjourning.Presenting Phases Of Team Performance Improvement Plan For Project Management Infographics PDF to dispense important information. This template comprises five stages. It also presents valuable insights into the topics including Team Exploration, Development Of Feeling, Working Together This is a completely customizable PowerPoint theme that can be put to use immediately. So, download it and address the topic impactfully.
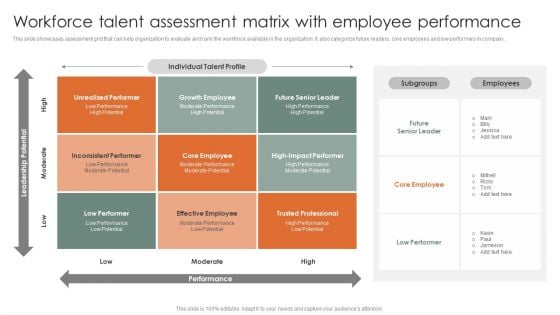
Workforce Talent Assessment Matrix With Employee Performance Ppt Infographics Show PDF
This slide showcases assessment grid that can help organization to evaluate and rank the workforce available in the organization. It also categorize future leaders, core employees and low performers in company. Persuade your audience using this Workforce Talent Assessment Matrix With Employee Performance Ppt Infographics Show PDF. This PPT design covers one stages, thus making it a great tool to use. It also caters to a variety of topics including Employees, Future Senior Leader, Core Employee. Download this PPT design now to present a convincing pitch that not only emphasizes the topic but also showcases your presentation skills.
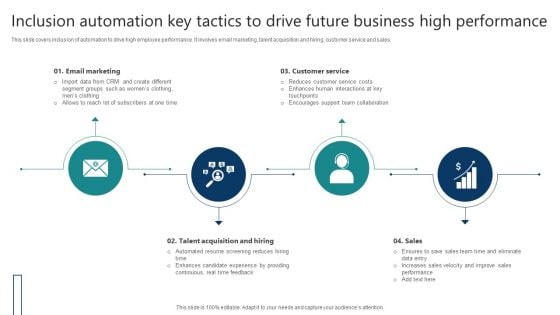
Inclusion Automation Key Tactics To Drive Future Business High Performance Infographics PDF
This slide covers inclusion of automation to drive high employee performance. It involves email marketing, talent acquisition and hiring, customer service and sales. Persuade your audience using this Inclusion Automation Key Tactics To Drive Future Business High Performance Infographics PDF. This PPT design covers four stages, thus making it a great tool to use. It also caters to a variety of topics including Email Marketing, Customer Service, Sales. Download this PPT design now to present a convincing pitch that not only emphasizes the topic but also showcases your presentation skills.
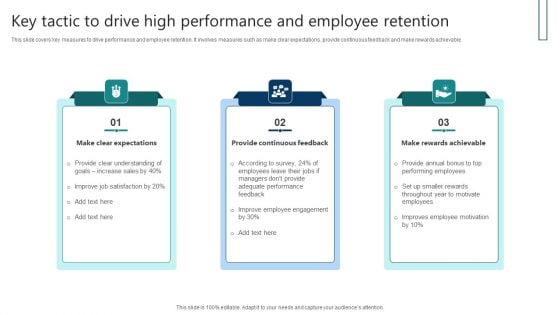
Key Tactic To Drive High Performance And Employee Retention Infographics PDF
This slide covers key measures to drive performance and employee retention. It involves measures such as make clear expectations, provide continuous feedback and make rewards achievable. Presenting Key Tactic To Drive High Performance And Employee Retention Infographics PDF to dispense important information. This template comprises three stages. It also presents valuable insights into the topics including Make Clear Expectations, Provide Continuous Feedback, Make Rewards Achievable. This is a completely customizable PowerPoint theme that can be put to use immediately. So, download it and address the topic impactfully.
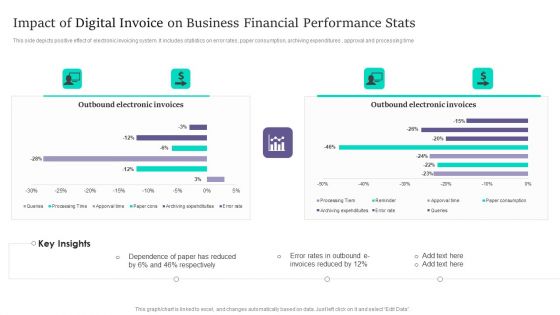
Impact Of Digital Invoice On Business Financial Performance Stats Infographics PDF
This side depicts positive effect of electronic invoicing system. It includes statistics on error rates, paper consumption, archiving expenditures , approval and processing time. Pitch your topic with ease and precision using this Impact Of Digital Invoice On Business Financial Performance Stats Infographics PDF. This layout presents information on Impact Of Digital Invoice, Business Financial Performance Stats. It is also available for immediate download and adjustment. So, changes can be made in the color, design, graphics or any other component to create a unique layout.
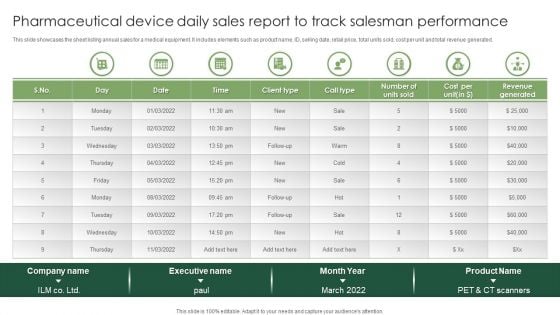
Pharmaceutical Device Daily Sales Report To Track Salesman Performance Infographics PDF
This slide showcases the sheet listing annual sales for a medical equipment. It includes elements such as product name, ID, selling date, retail price, total units sold, cost per unit and total revenue generated. Pitch your topic with ease and precision using this Pharmaceutical Device Daily Sales Report To Track Salesman Performance Infographics PDF. This layout presents information on Pharmaceutical Device Daily, Sales Report To Track, Salesman Performance. It is also available for immediate download and adjustment. So, changes can be made in the color, design, graphics or any other component to create a unique layout.
Tracking Employee Work Performance Tools With Features And Use Cases Infographics PDF
This slide contains the tools that are used for tracking employees performance with their comparison on the basis of features and price. It also shows the use cases of the same the tools are basecamp, workiq, desk time and google streak. Showcasing this set of slides titled Tracking Employee Work Performance Tools With Features And Use Cases Infographics PDF. The topics addressed in these templates are Nonproductive Applications, Categorize Applications, Targets. All the content presented in this PPT design is completely editable. Download it and make adjustments in color, background, font etc. as per your unique business setting.
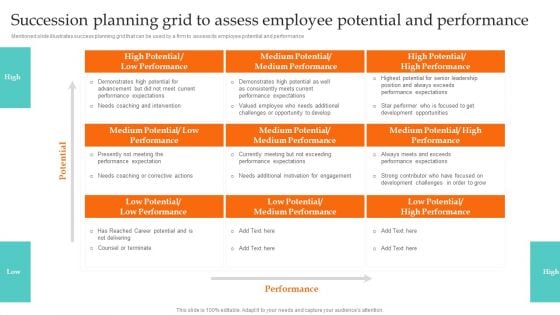
Succession Planning Grid To Assess Employee Potential And Performance Infographics PDF
Mentioned slide illustrates success planning grid that can be used by a firm to assess its employee potential and performance Make sure to capture your audiences attention in your business displays with our gratis customizable Succession Planning Grid To Assess Employee Potential And Performance Infographics PDF. These are great for business strategies, office conferences, capital raising or task suggestions. If you desire to acquire more customers for your tech business and ensure they stay satisfied, create your own sales presentation with these plain slides.


 Continue with Email

 Home
Home


