Dashboards
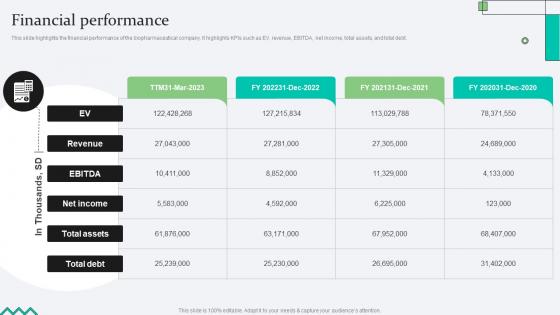
Financial Performance Biopharma Research Organization Pitch Deck
This slide highlights the financial performance of the biopharmaceutical company. It highlights KPIs such as EV, revenue, EBITDA, net income, total assets, and total debt. Present like a pro with Financial Performance Biopharma Research Organization Pitch Deck. Create beautiful presentations together with your team, using our easy-to-use presentation slides. Share your ideas in real-time and make changes on the fly by downloading our templates. So whether you are in the office, on the go, or in a remote location, you can stay in sync with your team and present your ideas with confidence. With Slidegeeks presentation got a whole lot easier. Grab these presentations today. This slide highlights the financial performance of the biopharmaceutical company. It highlights KPIs such as EV, revenue, EBITDA, net income, total assets, and total debt.

Virtual Sales Strategies Timeline To Track Training Of Inside Sales Executives Strategy SS V
This slide showcases timeline that can help organization to conduct training of inside sales employees. Key areas for employee training are sales follow up, cold calling, lead nurturing, CRM training and tracking sales kpis. Get a simple yet stunning designed Virtual Sales Strategies Timeline To Track Training Of Inside Sales Executives Strategy SS V. It is the best one to establish the tone in your meetings. It is an excellent way to make your presentations highly effective. So, download this PPT today from Slidegeeks and see the positive impacts. Our easy-to-edit Virtual Sales Strategies Timeline To Track Training Of Inside Sales Executives Strategy SS V can be your go-to option for all upcoming conferences and meetings. So, what are you waiting for Grab this template today. This slide showcases timeline that can help organization to conduct training of inside sales employees. Key areas for employee training are sales follow up, cold calling, lead nurturing, CRM training and tracking sales kpis.

Brand Equity Management Analyzing The Impact On Brand Value Perception
This slide depicts the positive impact of the strategic brand management process on brand value perception. It includes various KPIs such as customers, satisfaction, and purchase. Boost your pitch with our creative Brand Equity Management Analyzing The Impact On Brand Value Perception. Deliver an awe-inspiring pitch that will mesmerize everyone. Using these presentation templates you will surely catch everyones attention. You can browse the ppts collection on our website. We have researchers who are experts at creating the right content for the templates. So you do not have to invest time in any additional work. Just grab the template now and use them. This slide depicts the positive impact of the strategic brand management process on brand value perception. It includes various KPIs such as customers, satisfaction, and purchase.
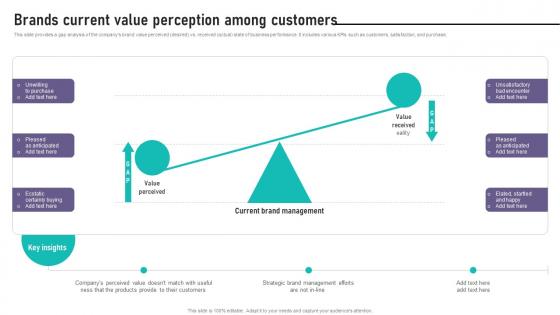
Brand Equity Management To Raise Brands Current Value Perception Among Customers
This slide provides a gap analysis of the companys brand value perceived desired vs received actual state of business performance. It includes various KPIs such as customers, satisfaction, and purchase. Do you have an important presentation coming up Are you looking for something that will make your presentation stand out from the rest Look no further than Brand Equity Management To Raise Brands Current Value Perception Among Customers. With our professional designs, you can trust that your presentation will pop and make delivering it a smooth process. And with Slidegeeks, you can trust that your presentation will be unique and memorable. So why wait Grab Brand Equity Management To Raise Brands Current Value Perception Among Customers today and make your presentation stand out from the rest This slide provides a gap analysis of the companys brand value perceived desired vs received actual state of business performance. It includes various KPIs such as customers, satisfaction, and purchase.
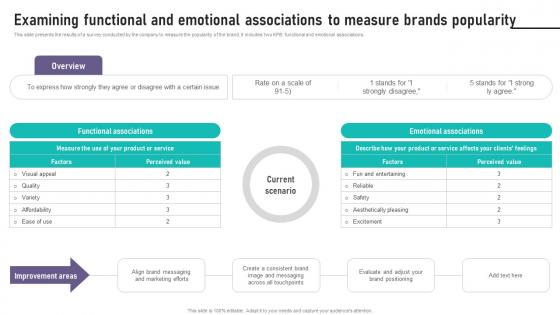
Brand Equity Management To Raise Examining Functional And Emotional Associations
This slide presents the results of a survey conducted by the company to measure the popularity of the brand. It includes two KPIS functional and emotional associations. The Brand Equity Management To Raise Examining Functional And Emotional Associations is a compilation of the most recent design trends as a series of slides. It is suitable for any subject or industry presentation, containing attractive visuals and photo spots for businesses to clearly express their messages. This template contains a variety of slides for the user to input data, such as structures to contrast two elements, bullet points, and slides for written information. Slidegeeks is prepared to create an impression. This slide presents the results of a survey conducted by the company to measure the popularity of the brand. It includes two KPIS functional and emotional associations.
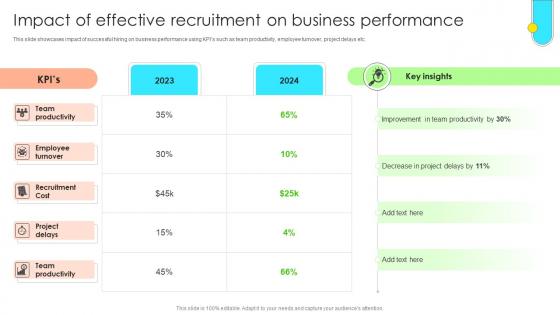
Data Driven Approach To Optimise Impact Of Effective Recruitment On Business CRP SS V
This slide showcases impact of successful hiring on business performance using KPIs such as team productivity, employee turnover, project delays etc. Explore a selection of the finest Data Driven Approach To Optimise Impact Of Effective Recruitment On Business CRP SS V here. With a plethora of professionally designed and pre-made slide templates, you can quickly and easily find the right one for your upcoming presentation. You can use our Data Driven Approach To Optimise Impact Of Effective Recruitment On Business CRP SS V to effectively convey your message to a wider audience. Slidegeeks has done a lot of research before preparing these presentation templates. The content can be personalized and the slides are highly editable. Grab templates today from Slidegeeks. This slide showcases impact of successful hiring on business performance using KPIs such as team productivity, employee turnover, project delays etc.
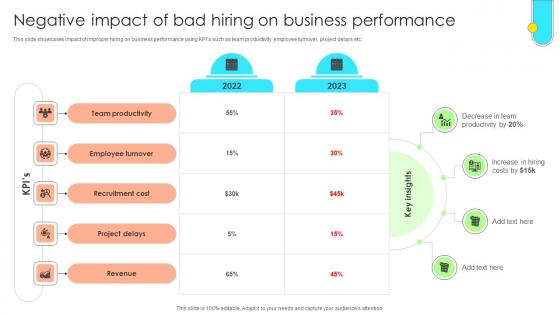
Data Driven Approach To Optimise Negative Impact Of Bad Hiring On Business CRP SS V
This slide showcases impact of improper hiring on business performance using KPIs such as team productivity, employee turnover, project delays etc. This Data Driven Approach To Optimise Negative Impact Of Bad Hiring On Business CRP SS V from Slidegeeks makes it easy to present information on your topic with precision. It provides customization options, so you can make changes to the colors, design, graphics, or any other component to create a unique layout. It is also available for immediate download, so you can begin using it right away. Slidegeeks has done good research to ensure that you have everything you need to make your presentation stand out. Make a name out there for a brilliant performance. This slide showcases impact of improper hiring on business performance using KPIs such as team productivity, employee turnover, project delays etc.
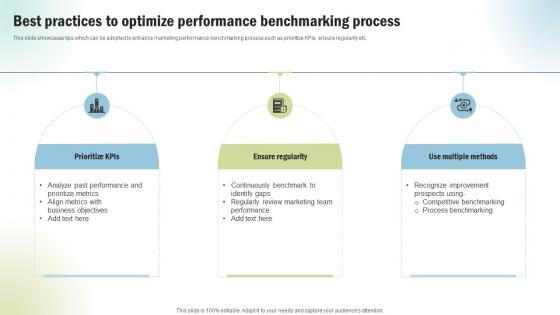
Marketing Project Performance Benchmarking Best Practices To Optimize CRP SS V
This slide showcases tips which can be adopted to enhance marketing performance benchmarking process such as prioritize KPIs, ensure regularity etc. Do you have to make sure that everyone on your team knows about any specific topic I yes, then you should give Marketing Project Performance Benchmarking Best Practices To Optimize CRP SS V a try. Our experts have put a lot of knowledge and effort into creating this impeccable Marketing Project Performance Benchmarking Best Practices To Optimize CRP SS V. You can use this template for your upcoming presentations, as the slides are perfect to represent even the tiniest detail. You can download these templates from the Slidegeeks website and these are easy to edit. So grab these today This slide showcases tips which can be adopted to enhance marketing performance benchmarking process such as prioritize KPIs, ensure regularity etc.

Marketing Project Performance Benchmarking Competitor Benchmarking To Analyze CRP SS V
This slide showcases comparison of business marketing performance with competitors to identify gaps using KPIs such as brand awareness, website traffic etc. Slidegeeks is here to make your presentations a breeze with Marketing Project Performance Benchmarking Competitor Benchmarking To Analyze CRP SS V With our easy-to-use and customizable templates, you can focus on delivering your ideas rather than worrying about formatting. With a variety of designs to choose from, you are sure to find one that suits your needs. And with animations and unique photos, illustrations, and fonts, you can make your presentation pop. So whether you are giving a sales pitch or presenting to the board, make sure to check out Slidegeeks first This slide showcases comparison of business marketing performance with competitors to identify gaps using KPIs such as brand awareness, website traffic etc.
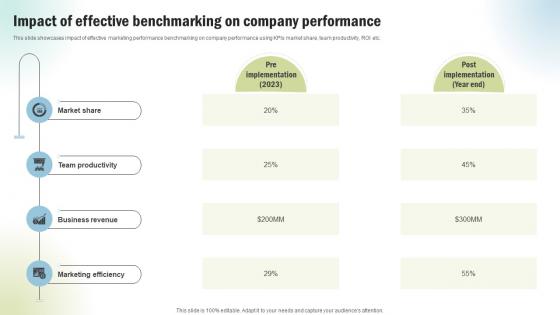
Marketing Project Performance Benchmarking Impact Of Effective Benchmarking CRP SS V
This slide showcases impact of effective marketing performance benchmarking on company performance using KPIs market share, team productivity, ROI etc. Formulating a presentation can take up a lot of effort and time, so the content and message should always be the primary focus. The visuals of the PowerPoint can enhance the presenters message, so our Marketing Project Performance Benchmarking Impact Of Effective Benchmarking CRP SS V was created to help save time. Instead of worrying about the design, the presenter can concentrate on the message while our designers work on creating the ideal templates for whatever situation is needed. Slidegeeks has experts for everything from amazing designs to valuable content, we have put everything into Marketing Project Performance Benchmarking Impact Of Effective Benchmarking CRP SS V. This slide showcases impact of effective marketing performance benchmarking on company performance using KPIs market share, team productivity, ROI etc.
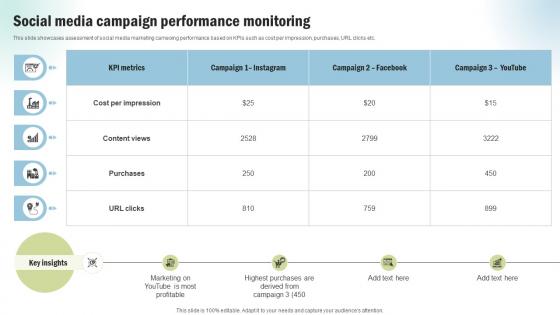
Marketing Project Performance Benchmarking Social Media Campaign Performance CRP SS V
This slide showcases assessment of social media marketing cameoing performance based on KPIs such as cost per impression, purchases, URL clicks etc. Boost your pitch with our creative Marketing Project Performance Benchmarking Social Media Campaign Performance CRP SS V. Deliver an awe-inspiring pitch that will mesmerize everyone. Using these presentation templates you will surely catch everyones attention. You can browse the ppts collection on our website. We have researchers who are experts at creating the right content for the templates. So you do not have to invest time in any additional work. Just grab the template now and use them. This slide showcases assessment of social media marketing cameoing performance based on KPIs such as cost per impression, purchases, URL clicks etc.
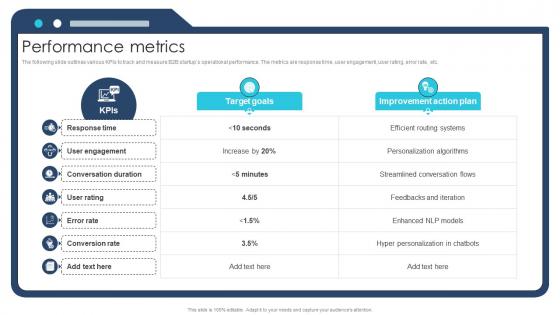
Performance Metrics Ai Chatbot Service Market Entry Strategy
The following slide outlines various KPIs to track and measure B2B startups operational performance. The metrics are response time, user engagement, user rating, error rate, etc.Crafting an eye-catching presentation has never been more straightforward. Let your presentation shine with this tasteful yet straightforward Performance Metrics Ai Chatbot Service Market Entry Strategy template. It offers a minimalistic and classy look that is great for making a statement. The colors have been employed intelligently to add a bit of playfulness while still remaining professional. Construct the ideal Performance Metrics Ai Chatbot Service Market Entry Strategy that effortlessly grabs the attention of your audience Begin now and be certain to wow your customers The following slide outlines various KPIs to track and measure B2B startups operational performance. The metrics are response time, user engagement, user rating, error rate, etc.

Performance Metrics Pastry Shop Market Entry Plan GTM SS V
The following slide outlines various KPIs to track and measure business operational performance The metrics are revenue, sales growth, retention rate, gross profit, inventory turnover, customer feedback, operation efficiency metrics and ROI. Crafting an eye-catching presentation has never been more straightforward. Let your presentation shine with this tasteful yet straightforward Performance Metrics Pastry Shop Market Entry Plan GTM SS V template. It offers a minimalistic and classy look that is great for making a statement. The colors have been employed intelligently to add a bit of playfulness while still remaining professional. Construct the ideal Performance Metrics Pastry Shop Market Entry Plan GTM SS V that effortlessly grabs the attention of your audience Begin now and be certain to wow your customers The following slide outlines various KPIs to track and measure business operational performance The metrics are revenue, sales growth, retention rate, gross profit, inventory turnover, customer feedback, operation efficiency metrics and ROI.

Managing Technical And Non Technical Comparative Assessment Of Goals With Actual
Mentioned slide provides comparative assessment of business performance with set goals. It includes key KPIs such as business revenue, web traffic, customer base, bounce rate, and employee turnover. Do you have an important presentation coming up Are you looking for something that will make your presentation stand out from the rest Look no further than Managing Technical And Non Technical Comparative Assessment Of Goals With Actual. With our professional designs, you can trust that your presentation will pop and make delivering it a smooth process. And with Slidegeeks, you can trust that your presentation will be unique and memorable. So why wait Grab Managing Technical And Non Technical Comparative Assessment Of Goals With Actual today and make your presentation stand out from the rest Mentioned slide provides comparative assessment of business performance with set goals. It includes key KPIs such as business revenue, web traffic, customer base, bounce rate, and employee turnover.

Goals And Objectives Of Operations Strategy Incorporating Banking Operational Growth
The mentioned slide showcases the banking operations transformation strategy by outlining various strategies, missions, and visions along with KPIs to track the overall performance. The best PPT templates are a great way to save time, energy, and resources. Slidegeeks have 100 percent editable powerpoint slides making them incredibly versatile. With these quality presentation templates, you can create a captivating and memorable presentation by combining visually appealing slides and effectively communicating your message. Download Goals And Objectives Of Operations Strategy Incorporating Banking Operational Growth from Slidegeeks and deliver a wonderful presentation. The mentioned slide showcases the banking operations transformation strategy by outlining various strategies, missions, and visions along with KPIs to track the overall performance
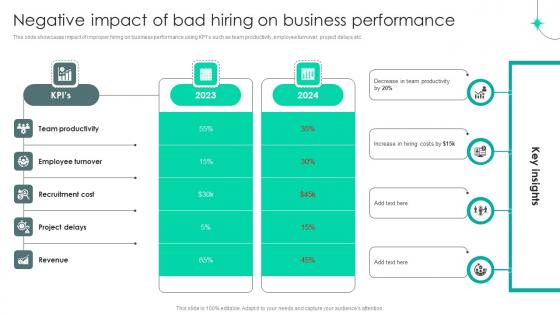
Strategic Staffing Using Data Negative Impact Of Bad Hiring On Business Performance CRP DK SS V
This slide showcases impact of improper hiring on business performance using KPIs such as team productivity, employee turnover, project delays etc. Take your projects to the next level with our ultimate collection of Strategic Staffing Using Data Negative Impact Of Bad Hiring On Business Performance CRP DK SS V. Slidegeeks has designed a range of layouts that are perfect for representing task or activity duration, keeping track of all your deadlines at a glance. Tailor these designs to your exact needs and give them a truly corporate look with your own brand colors they will make your projects stand out from the rest This slide showcases impact of improper hiring on business performance using KPIs such as team productivity, employee turnover, project delays etc.
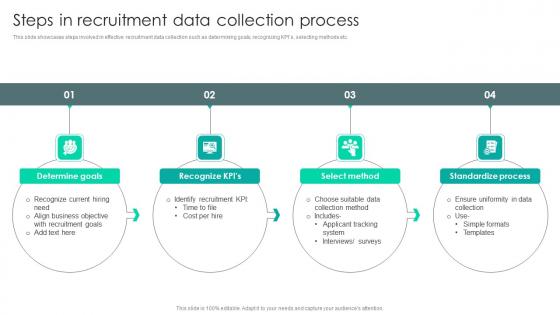
Strategic Staffing Using Data Steps In Recruitment Data Collection Process CRP DK SS V
This slide showcases steps involved in effective recruitment data collection such as determining goals, recognizing KPIs, selecting methods etc. Do you have to make sure that everyone on your team knows about any specific topic I yes, then you should give Strategic Staffing Using Data Steps In Recruitment Data Collection Process CRP DK SS V a try. Our experts have put a lot of knowledge and effort into creating this impeccable Strategic Staffing Using Data Steps In Recruitment Data Collection Process CRP DK SS V. You can use this template for your upcoming presentations, as the slides are perfect to represent even the tiniest detail. You can download these templates from the Slidegeeks website and these are easy to edit. So grab these today This slide showcases steps involved in effective recruitment data collection such as determining goals, recognizing KPIs, selecting methods etc.
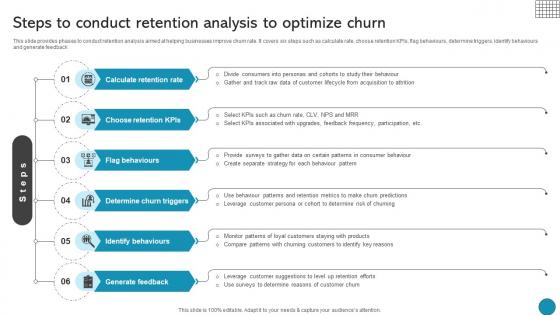
Steps To Conduct Retention Analysis To Optimize Churn Driving Business Success Integrating Product
This slide provides phases to conduct retention analysis aimed at helping businesses improve churn rate. It covers six steps such as calculate rate, choose retention KPIs, flag behaviours, determine triggers, identify behaviours and generate feedback Welcome to our selection of the Steps To Conduct Retention Analysis To Optimize Churn Driving Business Success Integrating Product. These are designed to help you showcase your creativity and bring your sphere to life. Planning and Innovation are essential for any business that is just starting out. This collection contains the designs that you need for your everyday presentations. All of our PowerPoints are 100 percent editable, so you can customize them to suit your needs. This multi-purpose template can be used in various situations. Grab these presentation templates today. This slide provides phases to conduct retention analysis aimed at helping businesses improve churn rate. It covers six steps such as calculate rate, choose retention KPIs, flag behaviours, determine triggers, identify behaviours and generate feedback
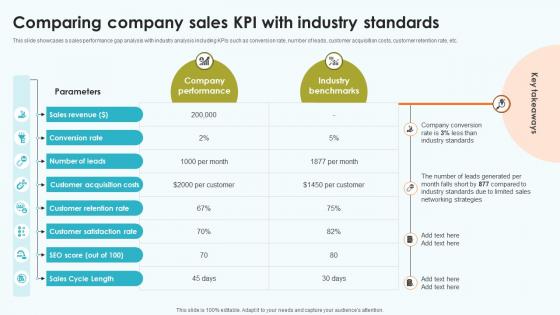
Elevating Sales Networks Comparing Company Sales KPI With Industry Standards SA SS V
This slide showcases a sales performance gap analysis with industry analysis including KPIs such as conversion rate, number of leads, customer acquisition costs, customer retention rate, etc. Get a simple yet stunning designed Elevating Sales Networks Comparing Company Sales KPI With Industry Standards SA SS V. It is the best one to establish the tone in your meetings. It is an excellent way to make your presentations highly effective. So, download this PPT today from Slidegeeks and see the positive impacts. Our easy-to-edit Elevating Sales Networks Comparing Company Sales KPI With Industry Standards SA SS V can be your go-to option for all upcoming conferences and meetings. So, what are you waiting for Grab this template today. This slide showcases a sales performance gap analysis with industry analysis including KPIs such as conversion rate, number of leads, customer acquisition costs, customer retention rate, etc.

Financial Performance Pharmaceutical R And D Company Pitch Deck
This slide highlights the financial performance of the biopharmaceutical company. It highlights KPIs such as EV, revenue, EBITDA, net income, total assets, and total debt. Present like a pro with Financial Performance Pharmaceutical R And D Company Pitch Deck. Create beautiful presentations together with your team, using our easy-to-use presentation slides. Share your ideas in real-time and make changes on the fly by downloading our templates. So whether you are in the office, on the go, or in a remote location, you can stay in sync with your team and present your ideas with confidence. With Slidegeeks presentation got a whole lot easier. Grab these presentations today. This slide highlights the financial performance of the biopharmaceutical company. It highlights KPIs such as EV, revenue, EBITDA, net income, total assets, and total debt.
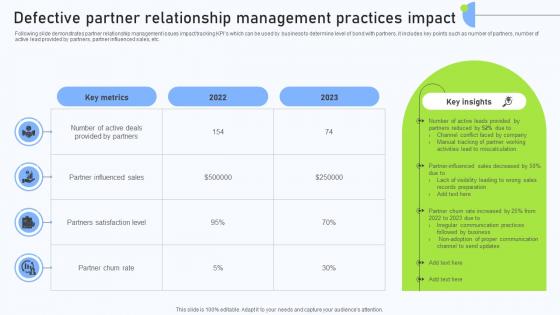
Relationship Management Automation Defective Partner Relationship Management
Following slide demonstrates partner relationship management issues impact tracking KPIs which can be used by business to determine level of bond with partners, it includes key points such as number of partners, number of active lead provided by partners, partner influenced sales, etc. If your project calls for a presentation, then Slidegeeks is your go-to partner because we have professionally designed, easy-to-edit templates that are perfect for any presentation. After downloading, you can easily edit Relationship Management Automation Defective Partner Relationship Management and make the changes accordingly. You can rearrange slides or fill them with different images. Check out all the handy templates Following slide demonstrates partner relationship management issues impact tracking KPIs which can be used by business to determine level of bond with partners, it includes key points such as number of partners, number of active lead provided by partners, partner influenced sales, etc.

Marketing Strategies For Effective Assessing Customer Journey Map For Effective
This slide covers customer journey map for grocery retailing to offer excellent customer service. It involves KPIs such as number of people reaced, increase number of visitors and customer service success rate. Create an editable Marketing Strategies For Effective Assessing Customer Journey Map For Effective that communicates your idea and engages your audience. Whether you are presenting a business or an educational presentation, pre-designed presentation templates help save time. Marketing Strategies For Effective Assessing Customer Journey Map For Effective is highly customizable and very easy to edit, covering many different styles from creative to business presentations. Slidegeeks has creative team members who have crafted amazing templates. So, go and get them without any delay. This slide covers customer journey map for grocery retailing to offer excellent customer service. It involves KPIs such as number of people reaced, increase number of visitors and customer service success rate.
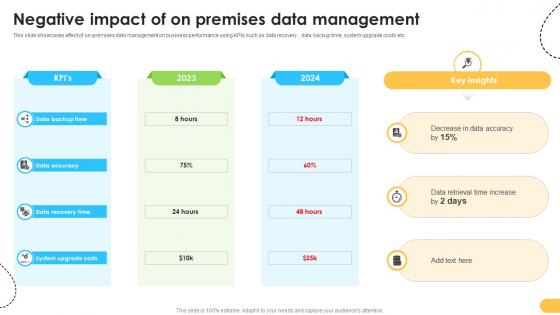
Negative Impact Of On Premises Data Management Data Migration From On Premises
This slide showcases effect of on-premises data management on business performance using KPIs such as data recovery , data backup time, system upgrade costs etc. Do you know about Slidesgeeks Negative Impact Of On Premises Data Management Data Migration From On Premises These are perfect for delivering any kind od presentation. Using it, create PowerPoint presentations that communicate your ideas and engage audiences. Save time and effort by using our pre-designed presentation templates that are perfect for a wide range of topic. Our vast selection of designs covers a range of styles, from creative to business, and are all highly customizable and easy to edit. Download as a PowerPoint template or use them as Google Slides themes. This slide showcases effect of on-premises data management on business performance using KPIs such as data recovery , data backup time, system upgrade costs etc.

B2B Marketing Techniques Analyzing And Optimizing Email Marketing Campaign
This slide showcases assessment of email marketing campaign performance run by wholesale business which helps in identifying performance gaps. It provides information regarding KPIs such as clickthrough rate, conversion rates, bounce rates, unsubscribe rate etc. There are so many reasons you need a B2B Marketing Techniques Analyzing And Optimizing Email Marketing Campaign. The first reason is you can not spend time making everything from scratch, Thus, Slidegeeks has made presentation templates for you too. You can easily download these templates from our website easily. This slide showcases assessment of email marketing campaign performance run by wholesale business which helps in identifying performance gaps. It provides information regarding KPIs such as clickthrough rate, conversion rates, bounce rates, unsubscribe rate etc.

B2B Marketing Techniques Analyzing Wholesale Facebook Marketing Campaign
This slide showcases evaluation of marketing campaign performance run by wholesale business on Facebook which helps in identifying performance gaps. It provides information regarding KPIs such as cost per impression, outbound clicks, content views, add to carts, purchases and URL clicks. Get a simple yet stunning designed B2B Marketing Techniques Analyzing Wholesale Facebook Marketing Campaign. It is the best one to establish the tone in your meetings. It is an excellent way to make your presentations highly effective. So, download this PPT today from Slidegeeks and see the positive impacts. Our easy-to-edit B2B Marketing Techniques Analyzing Wholesale Facebook Marketing Campaign can be your go-to option for all upcoming conferences and meetings. So, what are you waiting for Grab this template today. This slide showcases evaluation of marketing campaign performance run by wholesale business on Facebook which helps in identifying performance gaps. It provides information regarding KPIs such as cost per impression, outbound clicks, content views, add to carts, purchases and URL clicks.
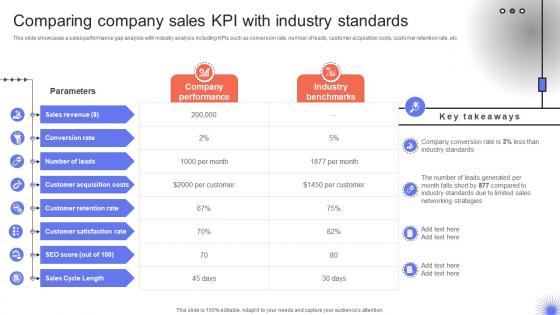
Trade Event Tactics To Boost Comparing Company Sales KPI With Industry Standards SA SS V
This slide showcases a sales performance gap analysis with industry analysis including KPIs such as conversion rate, number of leads, customer acquisition costs, customer retention rate, etc. From laying roadmaps to briefing everything in detail, our templates are perfect for you. You can set the stage with your presentation slides. All you have to do is download these easy-to-edit and customizable templates. Trade Event Tactics To Boost Comparing Company Sales KPI With Industry Standards SA SS V will help you deliver an outstanding performance that everyone would remember and praise you for. Do download this presentation today. This slide showcases a sales performance gap analysis with industry analysis including KPIs such as conversion rate, number of leads, customer acquisition costs, customer retention rate, etc.
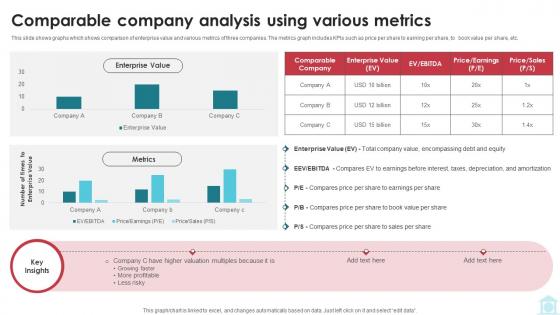
Comparable Company Analysis Using Various Metrics Mastering Investment Banking Fin SS V
This slide shows graphs which shows comparison of enterprise value and various metrics of three companies. The metrics graph includes KPIs such as price per share to earning per share, to book value per share, etc. Get a simple yet stunning designed Comparable Company Analysis Using Various Metrics Mastering Investment Banking Fin SS V It is the best one to establish the tone in your meetings. It is an excellent way to make your presentations highly effective. So, download this PPT today from Slidegeeks and see the positive impacts. Our easy-to-edit Comparable Company Analysis Using Various Metrics Mastering Investment Banking Fin SS V can be your go-to option for all upcoming conferences and meetings. So, what are you waiting for Grab this template today. This slide shows graphs which shows comparison of enterprise value and various metrics of three companies. The metrics graph includes KPIs such as price per share to earning per share, to book value per share, etc.
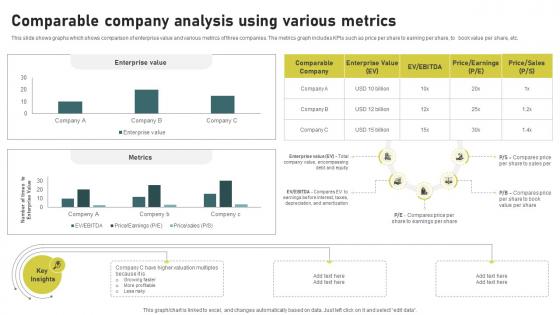
Comparable Company Analysis Using Investment Banking Simplified Functions Fin SS V
This slide shows graphs which shows comparison of enterprise value and various metrics of three companies. The metrics graph includes KPIs such as price per share to earning per share, to book value per share, etc. Get a simple yet stunning designed Comparable Company Analysis Using Investment Banking Simplified Functions Fin SS V. It is the best one to establish the tone in your meetings. It is an excellent way to make your presentations highly effective. So, download this PPT today from Slidegeeks and see the positive impacts. Our easy-to-edit Comparable Company Analysis Using Investment Banking Simplified Functions Fin SS V can be your go-to option for all upcoming conferences and meetings. So, what are you waiting for Grab this template today. This slide shows graphs which shows comparison of enterprise value and various metrics of three companies. The metrics graph includes KPIs such as price per share to earning per share, to book value per share, etc.
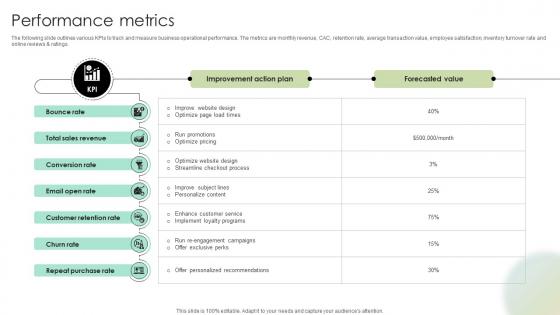
Performance Metrics Digital Fashion Brand Portal Market Entry Plan GTM SS V
The following slide outlines various KPIs to track and measure business operational performance. The metrics are monthly revenue, CAC, retention rate, average transaction value, employee satisfaction, inventory turnover rate and online reviews and ratings.Crafting an eye-catching presentation has never been more straightforward. Let your presentation shine with this tasteful yet straightforward Performance Metrics Digital Fashion Brand Portal Market Entry Plan GTM SS V template. It offers a minimalistic and classy look that is great for making a statement. The colors have been employed intelligently to add a bit of playfulness while still remaining professional. Construct the ideal Performance Metrics Digital Fashion Brand Portal Market Entry Plan GTM SS V that effortlessly grabs the attention of your audience Begin now and be certain to wow your customers The following slide outlines various KPIs to track and measure business operational performance. The metrics are monthly revenue, CAC, retention rate, average transaction value, employee satisfaction, inventory turnover rate and online reviews and ratings.

Performance Metrics Digital Physical Training Business Market Entry Plan GTM SS V
The following slide outlines various KPIs to track and measure business operational performance The metrics are conversion rate, churn rate, retention rate, engagement rate, social media reach and engagement and average session durationMake sure to capture your audiences attention in your business displays with our gratis customizable Performance Metrics Digital Physical Training Business Market Entry Plan GTM SS V. These are great for business strategies, office conferences, capital raising or task suggestions. If you desire to acquire more customers for your tech business and ensure they stay satisfied, create your own sales presentation with these plain slides. The following slide outlines various KPIs to track and measure business operational performance The metrics are conversion rate, churn rate, retention rate, engagement rate, social media reach and engagement and average session duration.
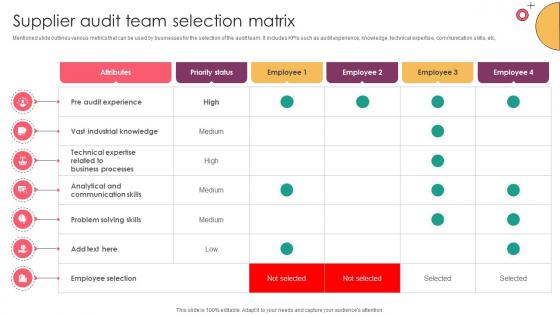
Strategic Supplier Evaluation Supplier Audit Team Selection Matrix
Mentioned slide outlines various metrics that can be used by businesses for the selection of the audit team. It includes KPIs such as audit experience, knowledge, technical expertise, communication skills, etc, Are you searching for a Strategic Supplier Evaluation Supplier Audit Team Selection Matrix that is uncluttered, straightforward, and original Its easy to edit, and you can change the colors to suit your personal or business branding. For a presentation that expresses how much effort you have put in, this template is ideal With all of its features, including tables, diagrams, statistics, and lists, its perfect for a business plan presentation. Make your ideas more appealing with these professional slides. Download Strategic Supplier Evaluation Supplier Audit Team Selection Matrix from Slidegeeks today. Mentioned slide outlines various metrics that can be used by businesses for the selection of the audit team. It includes KPIs such as audit experience, knowledge, technical expertise, communication skills, etc.
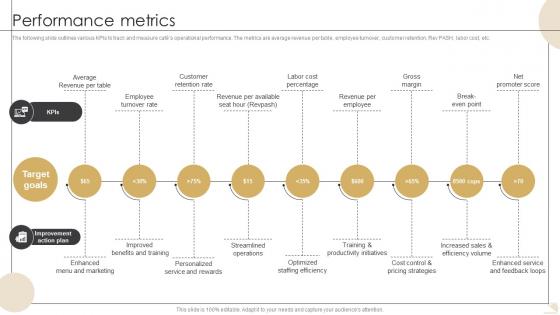
Performance Metrics Bistro Startup GTM Strategy GTM SS V
The following slide outlines various KPIs to track and measure cafes operational performance. The metrics are average revenue per table, employee turnover, customer retention, RevPASH, labor cost, etc.Formulating a presentation can take up a lot of effort and time, so the content and message should always be the primary focus. The visuals of the PowerPoint can enhance the presenters message, so our Performance Metrics Bistro Startup GTM Strategy GTM SS V was created to help save time. Instead of worrying about the design, the presenter can concentrate on the message while our designers work on creating the ideal templates for whatever situation is needed. Slidegeeks has experts for everything from amazing designs to valuable content, we have put everything into Performance Metrics Bistro Startup GTM Strategy GTM SS V. The following slide outlines various KPIs to track and measure cafes operational performance. The metrics are average revenue per table, employee turnover, customer retention, RevPASH, labor cost, etc.
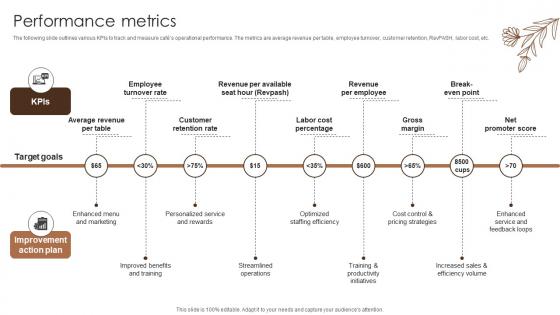
Performance Metrics Coffee Bar Go To Market Strategy GTM SS V
The following slide outlines various KPIs to track and measure cafes operational performance. The metrics are average revenue per table, employee turnover, customer retention, RevPASH, labor cost, etc.Coming up with a presentation necessitates that the majority of the effort goes into the content and the message you intend to convey. The visuals of a PowerPoint presentation can only be effective if it supplements and supports the story that is being told. Keeping this in mind our experts created Performance Metrics Coffee Bar Go To Market Strategy GTM SS V to reduce the time that goes into designing the presentation. This way, you can concentrate on the message while our designers take care of providing you with the right template for the situation. The following slide outlines various KPIs to track and measure cafes operational performance. The metrics are average revenue per table, employee turnover, customer retention, RevPASH, labor cost, etc.

Performance Metrics Domotics Go To Market Strategy GTM SS V
The following slide outlines various KPIs to track and measure smart home automation startup operational performance. The metrics are CAC, CLTV, churn rate MRR, ARPU, etc.This modern and well-arranged Performance Metrics Domotics Go To Market Strategy GTM SS V provides lots of creative possibilities. It is very simple to customize and edit with the Powerpoint Software. Just drag and drop your pictures into the shapes. All facets of this template can be edited with Powerpoint, no extra software is necessary. Add your own material, put your images in the places assigned for them, adjust the colors, and then you can show your slides to the world, with an animated slide included. The following slide outlines various KPIs to track and measure smart home automation startup operational performance. The metrics are CAC, CLTV, churn rate MRR, ARPU, etc.
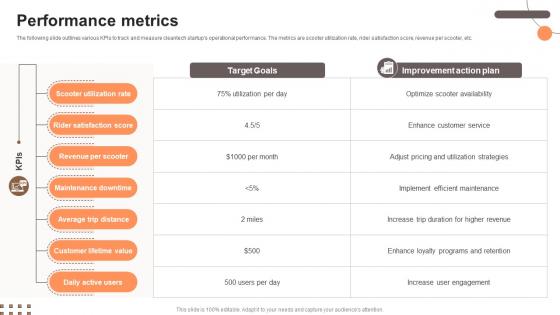
Performance Metrics Electric Scooter Rental Go To Market Strategy GTM SS V
The following slide outlines various KPIs to track and measure cleantech startups operational performance. The metrics are scooter utilization rate, rider satisfaction score, revenue per scooter, etc.This Performance Metrics Electric Scooter Rental Go To Market Strategy GTM SS V is perfect for any presentation, be it in front of clients or colleagues. It is a versatile and stylish solution for organizing your meetings. The Performance Metrics Electric Scooter Rental Go To Market Strategy GTM SS V features a modern design for your presentation meetings. The adjustable and customizable slides provide unlimited possibilities for acing up your presentation. Slidegeeks has done all the homework before launching the product for you. So, do not wait, grab the presentation templates today The following slide outlines various KPIs to track and measure cleantech startups operational performance. The metrics are scooter utilization rate, rider satisfaction score, revenue per scooter, etc.

Performance Metrics Smart Home Startup GTM Strategy GTM SS V
The following slide outlines various KPIs to track and measure smart home automation startup operational performance. The metrics are CAC, CLTV, churn rate MRR, ARPU, etc.Welcome to our selection of the Performance Metrics Smart Home Startup GTM Strategy GTM SS V. These are designed to help you showcase your creativity and bring your sphere to life. Planning and Innovation are essential for any business that is just starting out. This collection contains the designs that you need for your everyday presentations. All of our PowerPoints are 100 percent editable, so you can customize them to suit your needs. This multi-purpose template can be used in various situations. Grab these presentation templates today. The following slide outlines various KPIs to track and measure smart home automation startup operational performance. The metrics are CAC, CLTV, churn rate MRR, ARPU, etc.

Remote Sales Plan For Timeline To Track Training Of Inside Sales Executives Strategy SS V
This slide showcases timeline that can help organization to conduct training of inside sales employees. Key areas for employee training are sales follow up, cold calling, lead nurturing, CRM training and tracking sales KPIs. Present like a pro with Remote Sales Plan For Timeline To Track Training Of Inside Sales Executives Strategy SS V. Create beautiful presentations together with your team, using our easy-to-use presentation slides. Share your ideas in real-time and make changes on the fly by downloading our templates. So whether you are in the office, on the go, or in a remote location, you can stay in sync with your team and present your ideas with confidence. With Slidegeeks presentation got a whole lot easier. Grab these presentations today. This slide showcases timeline that can help organization to conduct training of inside sales employees. Key areas for employee training are sales follow up, cold calling, lead nurturing, CRM training and tracking sales KPIs
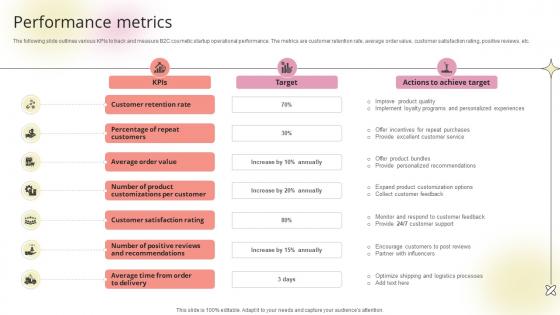
Performance Metrics Beauty Product Company Go To Market Strategy GTM SS V
The following slide outlines various KPIs to track and measure B2C cosmetic startup operational performance. The metrics are customer retention rate, average order value, customer satisfaction rating, positive reviews, etc.The best PPT templates are a great way to save time, energy, and resources. Slidegeeks have 100 percent editable powerpoint slides making them incredibly versatile. With these quality presentation templates, you can create a captivating and memorable presentation by combining visually appealing slides and effectively communicating your message. Download Performance Metrics Beauty Product Company Go To Market Strategy GTM SS V from Slidegeeks and deliver a wonderful presentation. The following slide outlines various KPIs to track and measure B2C cosmetic startup operational performance. The metrics are customer retention rate, average order value, customer satisfaction rating, positive reviews, etc.

Executive Summary C2C Ecommerce Platform Company Profile CP SS V
The slide showcases the executive summary to provide brief insights into eBay company, including a quick overview, global presence, customer segments, employee count, key competitors and operational KPIs.If your project calls for a presentation, then Slidegeeks is your go-to partner because we have professionally designed, easy-to-edit templates that are perfect for any presentation. After downloading, you can easily edit Executive Summary C2C Ecommerce Platform Company Profile CP SS V and make the changes accordingly. You can rearrange slides or fill them with different images. Check out all the handy templates The slide showcases the executive summary to provide brief insights into eBay company, including a quick overview, global presence, customer segments, employee count, key competitors and operational KPIs.
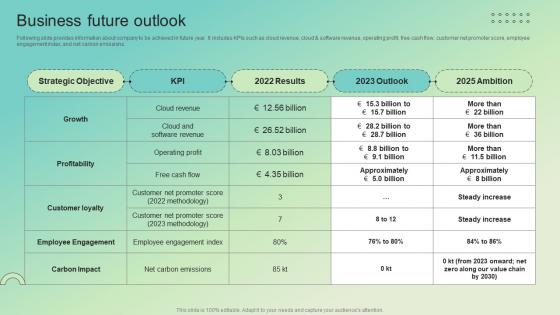
Business Future Outlook Enterprise Software Solution Providing Company Profile CP SS V
Following slide provides information about company to be achieved in future year. It includes KPIs such as cloud revenue, cloud and software revenue, operating profit, free cash flow, customer net promoter score, employee engagement index, and net carbon emissions.Boost your pitch with our creative Business Future Outlook Enterprise Software Solution Providing Company Profile CP SS V. Deliver an awe-inspiring pitch that will mesmerize everyone. Using these presentation templates you will surely catch everyones attention. You can browse the ppts collection on our website. We have researchers who are experts at creating the right content for the templates. So you do not have to invest time in any additional work. Just grab the template now and use them. Following slide provides information about company to be achieved in future year. It includes KPIs such as cloud revenue, cloud and software revenue, operating profit, free cash flow, customer net promoter score, employee engagement index, and net carbon emissions.
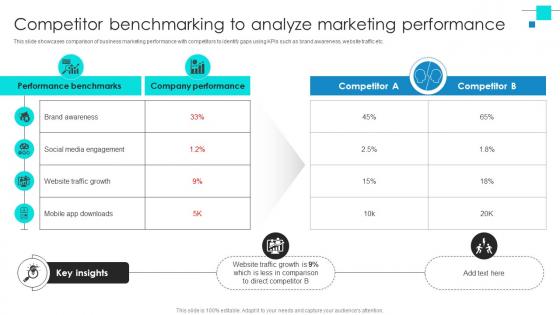
Project Benchmarking Process Competitor Benchmarking To Analyze Marketing CRP DK SS V
This slide showcases comparison of business marketing performance with competitors to identify gaps using KPIs such as brand awareness, website traffic etc. Whether you have daily or monthly meetings, a brilliant presentation is necessary. Project Benchmarking Process Competitor Benchmarking To Analyze Marketing CRP DK SS V can be your best option for delivering a presentation. Represent everything in detail using Project Benchmarking Process Competitor Benchmarking To Analyze Marketing CRP DK SS V and make yourself stand out in meetings. The template is versatile and follows a structure that will cater to your requirements. All the templates prepared by Slidegeeks are easy to download and edit. Our research experts have taken care of the corporate themes as well. So, give it a try and see the results. This slide showcases comparison of business marketing performance with competitors to identify gaps using KPIs such as brand awareness, website traffic etc.

Project Benchmarking Process Effect Of Poor Sales On Business Performance CRP DK SS V
This slide showcases of ineffectual product promotion on business performance using KPIs such as brand awareness, customer acquisition, business ROI etc. Are you in need of a template that can accommodate all of your creative concepts This one is crafted professionally and can be altered to fit any style. Use it with Google Slides or PowerPoint. Include striking photographs, symbols, depictions, and other visuals. Fill, move around, or remove text boxes as desired. Test out color palettes and font mixtures. Edit and save your work, or work with colleagues. Download Project Benchmarking Process Effect Of Poor Sales On Business Performance CRP DK SS V and observe how to make your presentation outstanding. Give an impeccable presentation to your group and make your presentation unforgettable. This slide showcases of ineffectual product promotion on business performance using KPIs such as brand awareness, customer acquisition, business ROI etc.
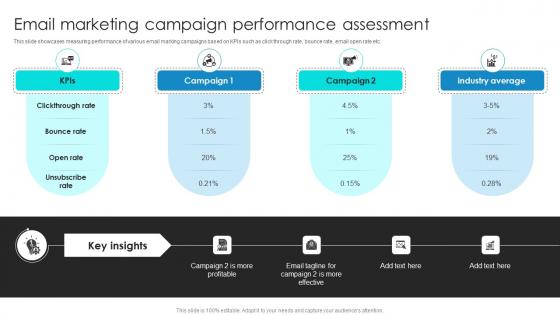
Project Benchmarking Process Email Marketing Campaign Performance Assessment CRP DK SS V
This slide showcases measuring performance of various email marking campaigns based on KPIs such as click through rate, bounce rate, email open rate etc. Coming up with a presentation necessitates that the majority of the effort goes into the content and the message you intend to convey. The visuals of a PowerPoint presentation can only be effective if it supplements and supports the story that is being told. Keeping this in mind our experts created Project Benchmarking Process Email Marketing Campaign Performance Assessment CRP DK SS V to reduce the time that goes into designing the presentation. This way, you can concentrate on the message while our designers take care of providing you with the right template for the situation. This slide showcases measuring performance of various email marking campaigns based on KPIs such as click through rate, bounce rate, email open rate etc.

Project Benchmarking Process Impact Of Effective Benchmarking On Company CRP DK SS V
This slide showcases impact of effective marketing performance benchmarking on company performance using KPIs market share, team productivity, ROI etc. This Project Benchmarking Process Impact Of Effective Benchmarking On Company CRP DK SS V is perfect for any presentation, be it in front of clients or colleagues. It is a versatile and stylish solution for organizing your meetings. The Project Benchmarking Process Impact Of Effective Benchmarking On Company CRP DK SS V features a modern design for your presentation meetings. The adjustable and customizable slides provide unlimited possibilities for acing up your presentation. Slidegeeks has done all the homework before launching the product for you. So, do not wait, grab the presentation templates today This slide showcases impact of effective marketing performance benchmarking on company performance using KPIs market share, team productivity, ROI etc.
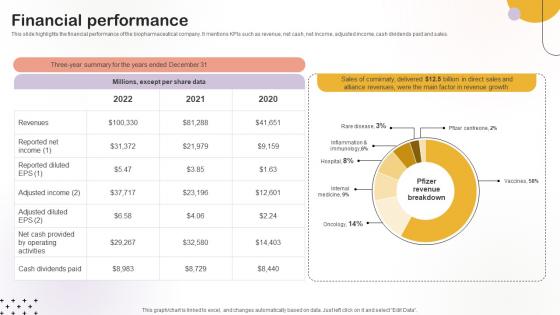
Financial Performance Medical Research Organization Pitch Deck
This slide highlights the financial performance of the biopharmaceutical company. It mentions KPIs such as revenue, net cash, net income, adjusted income, cash dividends paid and sales.From laying roadmaps to briefing everything in detail, our templates are perfect for you. You can set the stage with your presentation slides. All you have to do is download these easy-to-edit and customizable templates. Financial Performance Medical Research Organization Pitch Deck will help you deliver an outstanding performance that everyone would remember and praise you for. Do download this presentation today. This slide highlights the financial performance of the biopharmaceutical company. It mentions KPIs such as revenue, net cash, net income, adjusted income, cash dividends paid and sales.
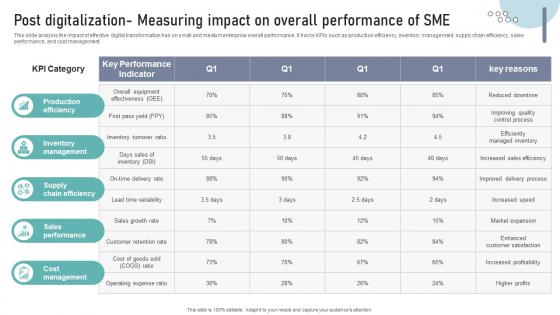
Post Digitalization Measuring Impact On Overall Performance Of SME DT SS V
This slide analysis the impact of effective digital transformation has on small and medium enterprise overall performance. It tracks KPIs such as production efficiency, inventory management, supply chain efficiency, sales performance, and cost management. Explore a selection of the finest Post Digitalization Measuring Impact On Overall Performance Of SME DT SS V here. With a plethora of professionally designed and pre-made slide templates, you can quickly and easily find the right one for your upcoming presentation. You can use our Post Digitalization Measuring Impact On Overall Performance Of SME DT SS V to effectively convey your message to a wider audience. Slidegeeks has done a lot of research before preparing these presentation templates. The content can be personalized and the slides are highly editable. Grab templates today from Slidegeeks. This slide analysis the impact of effective digital transformation has on small and medium enterprise overall performance. It tracks KPIs such as production efficiency, inventory management, supply chain efficiency, sales performance, and cost management.

Performance Metrics P2p Payment Startup Go To Market Strategy GTM SS V
The following slide outlines various KPIs to track and measure innovative fintech startups operational performance. The metrics are transaction volume, time spent on app, conversion rate, etc.Are you in need of a template that can accommodate all of your creative concepts This one is crafted professionally and can be altered to fit any style. Use it with Google Slides or PowerPoint. Include striking photographs, symbols, depictions, and other visuals. Fill, move around, or remove text boxes as desired. Test out color palettes and font mixtures. Edit and save your work, or work with colleagues. Download Performance Metrics P2p Payment Startup Go To Market Strategy GTM SS V and observe how to make your presentation outstanding. Give an impeccable presentation to your group and make your presentation unforgettable. The following slide outlines various KPIs to track and measure innovative fintech startups operational performance. The metrics are transaction volume, time spent on app, conversion rate, etc.

Performance Metrics Blind Shipping GTM Strategy GTM SS V
The following slide outlines various KPIs to track and measure drop shipping startups operational performance. The metrics are conversion rate, subscriptions, CAC, CLV, etc.Crafting an eye-catching presentation has never been more straightforward. Let your presentation shine with this tasteful yet straightforward Performance Metrics Blind Shipping GTM Strategy GTM SS V template. It offers a minimalistic and classy look that is great for making a statement. The colors have been employed intelligently to add a bit of playfulness while still remaining professional. Construct the ideal Performance Metrics Blind Shipping GTM Strategy GTM SS V that effortlessly grabs the attention of your audience Begin now and be certain to wow your customers The following slide outlines various KPIs to track and measure drop shipping startups operational performance. The metrics are conversion rate, subscriptions, CAC, CLV, etc.
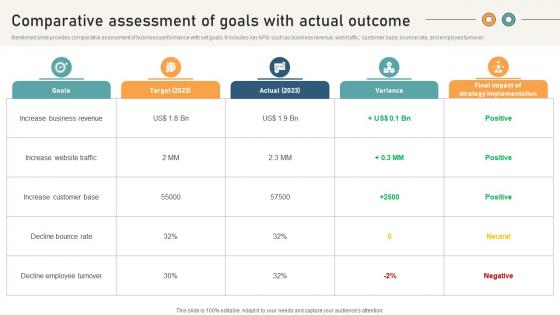
Comprehensive Guide For Website Development Comparative Assessment Of Goals With Actual
Mentioned slide provides comparative assessment of business performance with set goals. It includes key KPIs such as business revenue, web traffic, customer base, bounce rate, and employee turnover. This Comprehensive Guide For Website Development Comparative Assessment Of Goals With Actual is perfect for any presentation, be it in front of clients or colleagues. It is a versatile and stylish solution for organizing your meetings. The Comprehensive Guide For Website Development Comparative Assessment Of Goals With Actual features a modern design for your presentation meetings. The adjustable and customizable slides provide unlimited possibilities for acing up your presentation. Slidegeeks has done all the homework before launching the product for you. So, do not wait, grab the presentation templates today Mentioned slide provides comparative assessment of business performance with set goals. It includes key KPIs such as business revenue, web traffic, customer base, bounce rate, and employee turnover.

Performance Metrics Information Technology Startup Go To Market Strategy GTM SS V
The following slide outlines various KPIs to track and measure IT startup operational performance. The metrics are response time, user satisfaction, error rate, time to resolution, capacity utilization, etc.Make sure to capture your audiences attention in your business displays with our gratis customizable Performance Metrics Information Technology Startup Go To Market Strategy GTM SS V. These are great for business strategies, office conferences, capital raising or task suggestions. If you desire to acquire more customers for your tech business and ensure they stay satisfied, create your own sales presentation with these plain slides. The following slide outlines various KPIs to track and measure IT startup operational performance. The metrics are response time, user satisfaction, error rate, time to resolution, capacity utilization, etc.
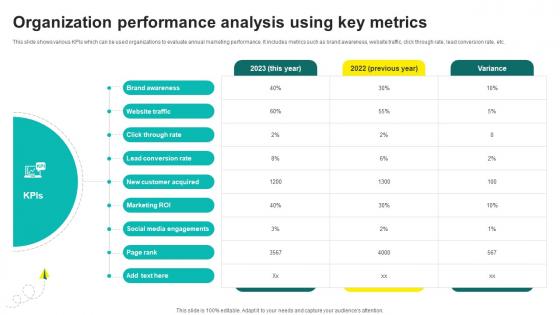
One On One Advertising Organization Performance Analysis Using Key Metrics Strategy SS V
This slide shows various KPIs which can be used organizations to evaluate annual marketing performance. It includes metrics such as brand awareness, website traffic, click through rate, lead conversion rate, etc. Take your projects to the next level with our ultimate collection of One On One Advertising Organization Performance Analysis Using Key Metrics Strategy SS V. Slidegeeks has designed a range of layouts that are perfect for representing task or activity duration, keeping track of all your deadlines at a glance. Tailor these designs to your exact needs and give them a truly corporate look with your own brand colors they will make your projects stand out from the rest This slide shows various KPIs which can be used organizations to evaluate annual marketing performance. It includes metrics such as brand awareness, website traffic, click through rate, lead conversion rate, etc.

Steps To Leverage IoT Solutions For Banking And Fintech IoT In Banking For Digital Future IoT SS V
Following slide represents process to utilize and deploy IoT in banking and finance industry to increase innovation and services efficiency. It includes steps such as understand readiness, determine KPIs, shortlist companies, etc. Take your projects to the next level with our ultimate collection of Steps To Leverage IoT Solutions For Banking And Fintech IoT In Banking For Digital Future IoT SS V. Slidegeeks has designed a range of layouts that are perfect for representing task or activity duration, keeping track of all your deadlines at a glance. Tailor these designs to your exact needs and give them a truly corporate look with your own brand colors they will make your projects stand out from the rest Following slide represents process to utilize and deploy IoT in banking and finance industry to increase innovation and services efficiency. It includes steps such as understand readiness, determine KPIs, shortlist companies, etc.
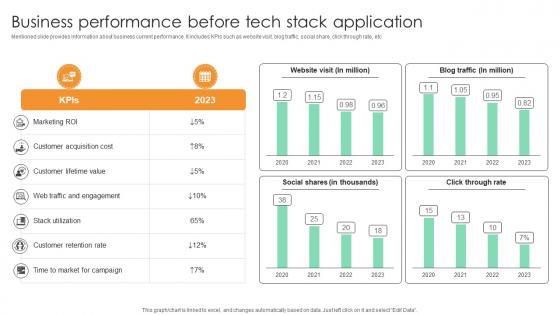
Business Performance Before Tech Stack Application Comprehensive Guide For Marketing Technology
Mentioned slide provides information about business current performance. It includes KPIs such as website visit, blog traffic, social share, click through rate, etcPresent like a pro with Business Performance Before Tech Stack Application Comprehensive Guide For Marketing Technology. Create beautiful presentations together with your team, using our easy-to-use presentation slides. Share your ideas in real-time and make changes on the fly by downloading our templates. So whether you are in the office, on the go, or in a remote location, you can stay in sync with your team and present your ideas with confidence. With Slidegeeks presentation got a whole lot easier. Grab these presentations today. Mentioned slide provides information about business current performance. It includes KPIs such as website visit, blog traffic, social share, click through rate, etc
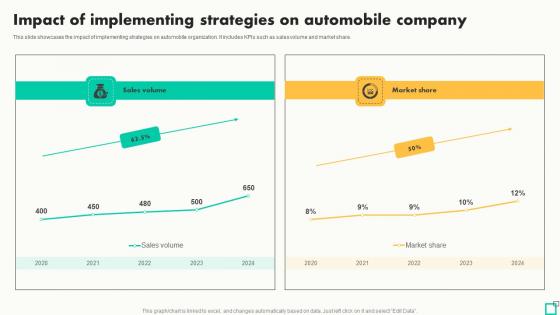
Impact Of Implementing Strategies On Innovative Tactics For Revving Up Strategy SS
This slide showcases the impact of implementing strategies on automobile organization. It includes KPIs such as sales volume and market share. This Impact Of Implementing Strategies On Innovative Tactics For Revving Up Strategy SS is perfect for any presentation, be it in front of clients or colleagues. It is a versatile and stylish solution for organizing your meetings. The Impact Of Implementing Strategies On Innovative Tactics For Revving Up Strategy SS features a modern design for your presentation meetings. The adjustable and customizable slides provide unlimited possibilities for acing up your presentation. Slidegeeks has done all the homework before launching the product for you. So, do not wait, grab the presentation templates today This slide showcases the impact of implementing strategies on automobile organization. It includes KPIs such as sales volume and market share.
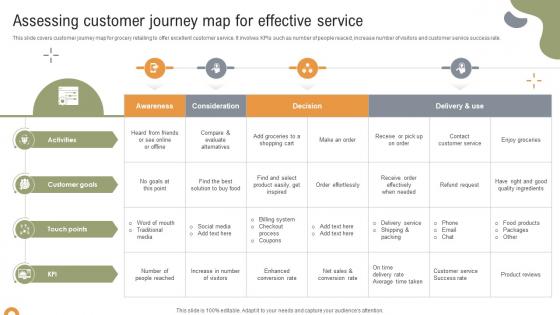
Implementing Strategies To Enhance Assessing Customer Journey Map For Effective Service
This slide covers customer journey map for grocery retailing to offer excellent customer service. It involves KPIs such as number of people reaced, increase number of visitors and customer service success rate. Create an editable Implementing Strategies To Enhance Assessing Customer Journey Map For Effective Service that communicates your idea and engages your audience. Whether you are presenting a business or an educational presentation, pre-designed presentation templates help save time. Implementing Strategies To Enhance Assessing Customer Journey Map For Effective Service is highly customizable and very easy to edit, covering many different styles from creative to business presentations. Slidegeeks has creative team members who have crafted amazing templates. So, go and get them without any delay. This slide covers customer journey map for grocery retailing to offer excellent customer service. It involves KPIs such as number of people reaced, increase number of visitors and customer service success rate.
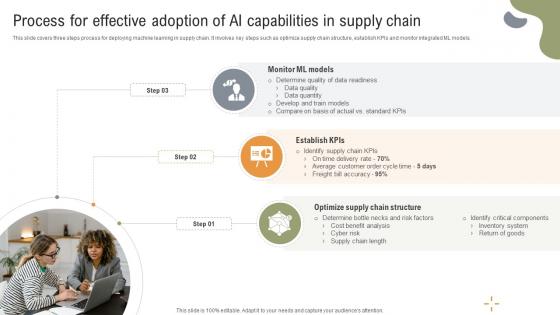
Implementing Strategies To Enhance Process For Effective Adoption Of Ai Capabilities In Supply
This slide covers three steps process for deploying machine learning in supply chain. It involves key steps such as optimize supply chain structure, establish KPIs and monitor integrated ML models. Find a pre-designed and impeccable Implementing Strategies To Enhance Process For Effective Adoption Of Ai Capabilities In Supply. The templates can ace your presentation without additional effort. You can download these easy-to-edit presentation templates to make your presentation stand out from others. So, what are you waiting for Download the template from Slidegeeks today and give a unique touch to your presentation. This slide covers three steps process for deploying machine learning in supply chain. It involves key steps such as optimize supply chain structure, establish KPIs and monitor integrated ML models.

Performance Metrics E Scooter Business Market Entry Strategy
The following slide outlines various KPIs to track and measure cleantech startups operational performance. The metrics are scooter utilization rate, rider satisfaction score, revenue per scooter, etc.Crafting an eye-catching presentation has never been more straightforward. Let your presentation shine with this tasteful yet straightforward Performance Metrics E Scooter Business Market Entry Strategy template. It offers a minimalistic and classy look that is great for making a statement. The colors have been employed intelligently to add a bit of playfulness while still remaining professional. Construct the ideal Performance Metrics E Scooter Business Market Entry Strategy that effortlessly grabs the attention of your audience Begin now and be certain to wow your customers The following slide outlines various KPIs to track and measure cleantech startups operational performance. The metrics are scooter utilization rate, rider satisfaction score, revenue per scooter, etc.
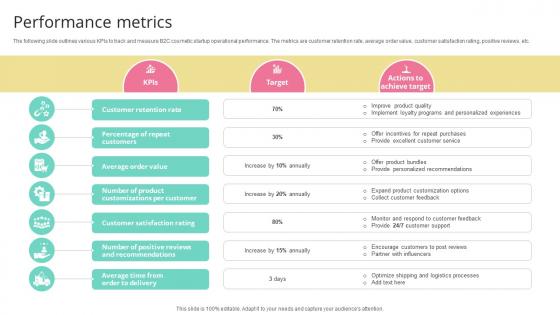
Performance Metrics Skincare Startup GTM Strategy GTM SS V
The following slide outlines various KPIs to track and measure B2C cosmetic startup operational performance. The metrics are customer retention rate, average order value, customer satisfaction rating, positive reviews, etc.Make sure to capture your audiences attention in your business displays with our gratis customizable Performance Metrics Skincare Startup GTM Strategy GTM SS V. These are great for business strategies, office conferences, capital raising or task suggestions. If you desire to acquire more customers for your tech business and ensure they stay satisfied, create your own sales presentation with these plain slides. The following slide outlines various KPIs to track and measure B2C cosmetic startup operational performance. The metrics are customer retention rate, average order value, customer satisfaction rating, positive reviews, etc.
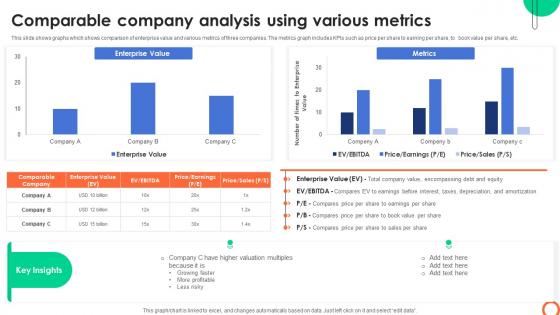
Comparable Company Analysis Using Various Understanding Investment Banking Framework Fin SS V
This slide shows graphs which shows comparison of enterprise value and various metrics of three companies. The metrics graph includes KPIs such as price per share to earning per share, to book value per share, etc. Get a simple yet stunning designed Comparable Company Analysis Using Various Understanding Investment Banking Framework Fin SS V. It is the best one to establish the tone in your meetings. It is an excellent way to make your presentations highly effective. So, download this PPT today from Slidegeeks and see the positive impacts. Our easy-to-edit Comparable Company Analysis Using Various Understanding Investment Banking Framework Fin SS V can be your go-to option for all upcoming conferences and meetings. So, what are you waiting for Grab this template today. This slide shows graphs which shows comparison of enterprise value and various metrics of three companies. The metrics graph includes KPIs such as price per share to earning per share, to book value per share, etc.
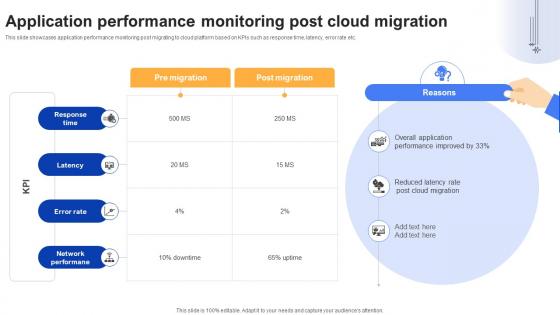
Effective Data Migration Application Performance Monitoring Post Cloud Migration
This slide showcases application performance monitoring post migrating to cloud platform based on KPIs such as response time, latency, error rate etc. Create an editable Effective Data Migration Application Performance Monitoring Post Cloud Migration that communicates your idea and engages your audience. Whether you are presenting a business or an educational presentation, pre-designed presentation templates help save time. Effective Data Migration Application Performance Monitoring Post Cloud Migration is highly customizable and very easy to edit, covering many different styles from creative to business presentations. Slidegeeks has creative team members who have crafted amazing templates. So, go and get them without any delay. This slide showcases application performance monitoring post migrating to cloud platform based on KPIs such as response time, latency, error rate etc.


 Continue with Email

 Home
Home


