Dashboards
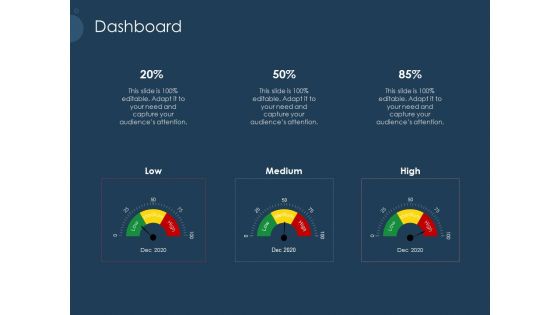
Pitch Deck To Gather Funding From Initial Capital Dashboard Graphics PDF
Deliver and pitch your topic in the best possible manner with this pitch deck to gather funding from initial capital dashboard graphics pdf. Use them to share invaluable insights on low, medium, high and impress your audience. This template can be altered and modified as per your expectations. So, grab it now.
Kpi Dashboard Best Practices For Project Management Ppt Powerpoint Presentation Outline Samples
This is a kpi dashboard best practices for project management ppt powerpoint presentation outline samples. This is a three stage process. The stages in this process are business metrics, business kpi, business dashboard.

Key Performance Indicator Analytics Dashboard Ppt PowerPoint Presentation Model Example Topics
This is a key performance indicator analytics dashboard ppt powerpoint presentation model example topics. This is a five stage process. The stages in this process are kpi proposal, kpi plan, kpi scheme.

Car Dashboard And Speedometer Graphics Ppt PowerPoint Presentation File Graphics Template
This is a car dashboard and speedometer graphics ppt powerpoint presentation file graphics template. This is a four stage process. The stages in this process are fuel gauge, gas gauge, fuel containers.
Four Semi Circular Speedometers Dashboard With Text Holders Ppt PowerPoint Presentation File Layouts
This is a four semi circular speedometers dashboard with text holders ppt powerpoint presentation file layouts. This is a four stage process. The stages in this process are fuel gauge, gas gauge, fuel containers.
Semi Circular Fuel Dashboard With Pointer In Centre Ppt PowerPoint Presentation Outline Visuals
This is a semi circular fuel dashboard with pointer in centre ppt powerpoint presentation outline visuals. This is a three stage process. The stages in this process are fuel gauge, gas gauge, fuel containers.

Three Dashboard Speed Indicators With Text Holders Ppt PowerPoint Presentation Summary Layout
This is a three dashboard speed indicators with text holders ppt powerpoint presentation summary layout. This is a three stage process. The stages in this process are fuel gauge, gas gauge, fuel containers.

Market Entry Strategy Clubs Industry Analytics Dashboard For Gym Health And Fitness Clubs Summary PDF
This slide covers the Key performance indicators for analysing social media platforms, email campaigns and website performance. Presenting market entry strategy clubs industry analytics dashboard for gym health and fitness clubs summary pdf to provide visual cues and insights. Share and navigate important information on seven stages that need your due attention. This template can be used to pitch topics like Analytics Dashboard for Gym Health and Fitness Clubs. In addtion, this PPT design contains high-resolution images, graphics, etc, that are easily editable and available for immediate download.
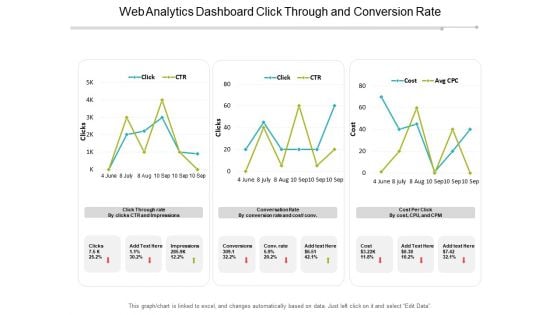
Web Analytics Dashboard Click Through And Conversion Rate Ppt PowerPoint Presentation Professional
This is a web analytics dashboard click through and conversion rate ppt powerpoint presentation professional. This is a three stage process. The stages in this process are marketing analytics, marketing performance, marketing discovery.
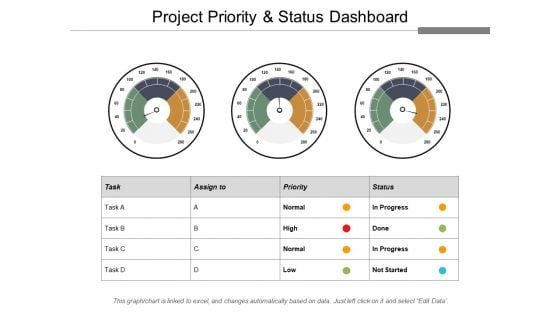
Project Priority And Status Dashboard Ppt PowerPoint Presentation Portfolio Design Templates
This is a project priority and status dashboard ppt powerpoint presentation portfolio design templates. This is a three stage process. The stages in this process are project management, project progress, project growth.
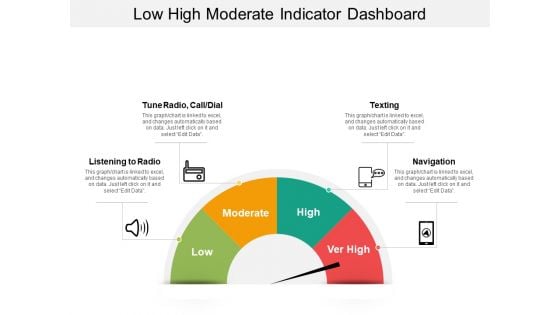
Low High Moderate Indicator Dashboard Ppt Powerpoint Presentation Infographic Template Example 2015
This is a low high moderate indicator dashboard ppt powerpoint presentation infographic template example 2015. This is a four stage process. The stages in this process are disturbance, distraction, interruption, diversion.

Trust Dashboard With Low Medium High Levels Ppt PowerPoint Presentation Ideas Infographics
Presenting this set of slides with name trust dashboard with low medium high levels ppt powerpoint presentation ideas infographics. This is a three stage process. The stages in this process are building trust, opportunity and handshake, partnership. This is a completely editable PowerPoint presentation and is available for immediate download. Download now and impress your audience.
Digital Transformation Strategy Roadmap Marketing Dashboard Ppt PowerPoint Presentation Infographic Template Summary PDF
Presenting this set of slides with name digital transformation strategy roadmap marketing dashboard ppt powerpoint presentation infographic template summary pdf. This is a three stage process. The stages in this process are marketing dashboard. This is a completely editable PowerPoint presentation and is available for immediate download. Download now and impress your audience.
Dashboard For Business Performance Analysis Ppt PowerPoint Presentation File Structure PDF
Presenting this set of slides with name dashboard for business performance analysis ppt powerpoint presentation file structure pdf. This is a three stage process. The stages in this process are dashboard for business performance analysis. This is a completely editable PowerPoint presentation and is available for immediate download. Download now and impress your audience.
Dashboard Icon With Text Holders Ppt PowerPoint Presentation File Outfit PDF
Presenting this set of slides with name dashboard icon with text holders ppt powerpoint presentation file outfit pdf. This is a six stage process. The stages in this process are dashboard icon with text holders. This is a completely editable PowerPoint presentation and is available for immediate download. Download now and impress your audience.
Speedometer Dashboard Vector Icon Ppt PowerPoint Presentation File Designs Download PDF
Presenting this set of slides with name speedometer dashboard vector icon ppt powerpoint presentation file designs download pdf. This is a four stage process. The stages in this process are speedometer dashboard vector icon. This is a completely editable PowerPoint presentation and is available for immediate download. Download now and impress your audience.
Meter Performance Dashboard Vector Icon Ppt PowerPoint Presentation Gallery Backgrounds PDF
Presenting this set of slides with name meter performance dashboard vector icon ppt powerpoint presentation gallery backgrounds pdf. This is a three stage process. The stages in this process are meter performance dashboard vector icon. This is a completely editable PowerPoint presentation and is available for immediate download. Download now and impress your audience.
Performance Tracking Dashboard Vector Icon Ppt PowerPoint Presentation File Background Image PDF
Presenting this set of slides with name performance tracking dashboard vector icon ppt powerpoint presentation file background image pdf. This is a two stage process. The stages in this process are performance tracking dashboard vector icon. This is a completely editable PowerPoint presentation and is available for immediate download. Download now and impress your audience.
Net Promoter Score Assessment Dashboard Icon Ppt PowerPoint Presentation File Icon PDF
Presenting this set of slides with name net promoter score assessment dashboard icon ppt powerpoint presentation file icon pdf. This is a one stage process. The stage in this process is net promoter score assessment dashboard icon. This is a completely editable PowerPoint presentation and is available for immediate download. Download now and impress your audience.
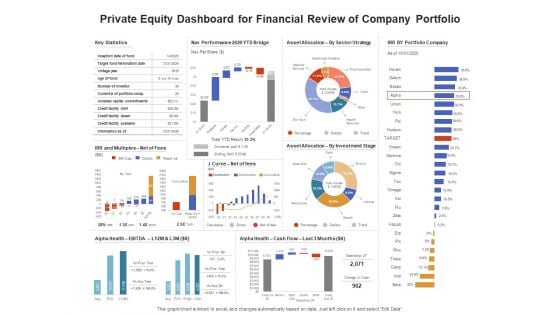
Venture Capitalist Control Board Private Equity Dashboard For Financial Review Of Company Portfolio Information PDF
Presenting this set of slides with name venture capitalist control board private equity dashboard for financial review of company portfolio information pdf. The topics discussed in these slides are contribution margin, margin analysis, income statement, dashboards controls. This is a completely editable PowerPoint presentation and is available for immediate download. Download now and impress your audience.
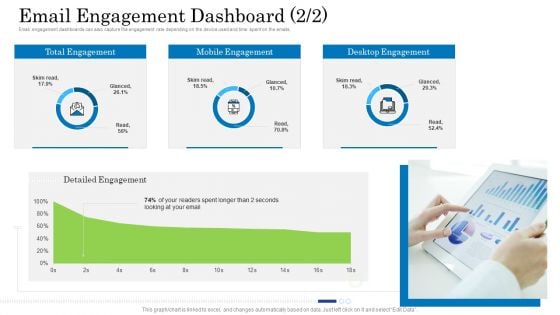
Customer Behavioral Data And Analytics Email Engagement Dashboard Email Structure PDF
Email engagement dashboards can also capture the engagement rate depending on the device used and time spent on the emails. Deliver and pitch your topic in the best possible manner with this customer behavioral data and analytics email engagement dashboard email structure pdf. Use them to share invaluable insights on email engagement dashboard and impress your audience. This template can be altered and modified as per your expectations. So, grab it now.
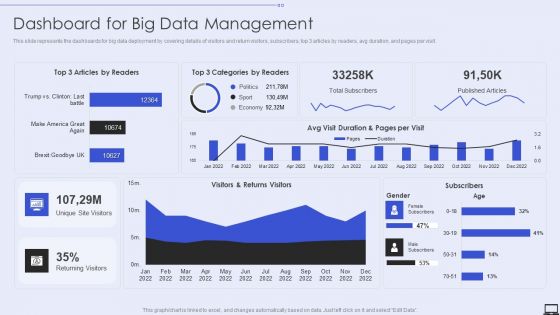
Dashboard For Big Data Management Ppt PowerPoint Presentation File Diagrams PDF
This slide represents the dashboards for big data deployment by covering details of visitors and return visitors, subscribers, top 3 articles by readers, avg duration, and pages per visit. Deliver an awe inspiring pitch with this creative Dashboard For Big Data Management Ppt PowerPoint Presentation File Diagrams PDF bundle. Topics like Dashboard, Big Data Management can be discussed with this completely editable template. It is available for immediate download depending on the needs and requirements of the user.
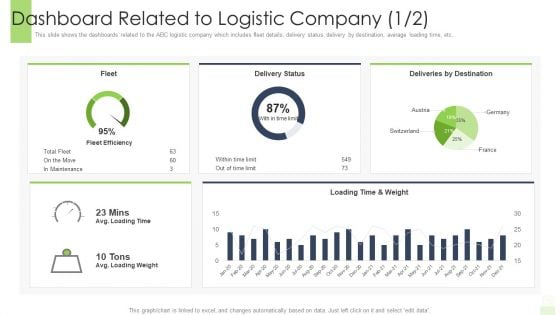
Developing Functional Logistic Plan Business Dashboard Related To Logistic Company Time Microsoft PDF
This slide shows the dashboards related to the ABC logistic company which includes fleet details, delivery status, delivery by destination, average loading time, etc. Deliver an awe inspiring pitch with this creative developing functional logistic plan business dashboard related to logistic company time microsoft pdf bundle. Topics like dashboard related to logistic company can be discussed with this completely editable template. It is available for immediate download depending on the needs and requirements of the user.
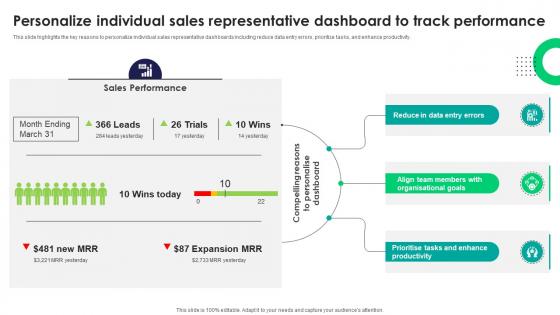
Personalize Individual Sales Representative Dashboard Tactics For Improving Field Sales Team SA SS V
This slide highlights the key reasons to personalize individual sales representative dashboards including reduce data entry errors, prioritize tasks, and enhance productivity. Presenting this PowerPoint presentation, titled Personalize Individual Sales Representative Dashboard Tactics For Improving Field Sales Team SA SS V, with topics curated by our researchers after extensive research. This editable presentation is available for immediate download and provides attractive features when used. Download now and captivate your audience. Presenting this Personalize Individual Sales Representative Dashboard Tactics For Improving Field Sales Team SA SS V. Our researchers have carefully researched and created these slides with all aspects taken into consideration. This is a completely customizable Personalize Individual Sales Representative Dashboard Tactics For Improving Field Sales Team SA SS V that is available for immediate downloading. Download now and make an impact on your audience. Highlight the attractive features available with our PPTs. This slide highlights the key reasons to personalize individual sales representative dashboards including reduce data entry errors, prioritize tasks, and enhance productivity.

Enhance Profit Client Journey Analysis Email Engagement Dashboard Device Template PDF
Email engagement dashboards can also capture the engagement rate depending on the device used and time spent on the emails. Deliver an awe-inspiring pitch with this creative enhance profit client journey analysis email engagement dashboard device template pdf bundle. Topics like total engagement, mobile engagement, desktop engagement, detailed engagement can be discussed with this completely editable template. It is available for immediate download depending on the needs and requirements of the user.
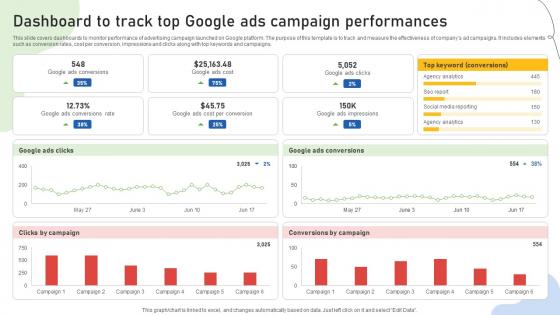
Google Ads Categories Dashboard To Track Top Google Ads Campaign Performances MKT SS V
This slide covers dashboards to monitor performance of advertising campaign launched on Google platform. The purpose of this template is to track and measure the effectiveness of companys ad campaigns. It includes elements such as conversion rates, cost per conversion, impressions and clicks along with top keywords and campaigns. The Google Ads Categories Dashboard To Track Top Google Ads Campaign Performances MKT SS V is a compilation of the most recent design trends as a series of slides. It is suitable for any subject or industry presentation, containing attractive visuals and photo spots for businesses to clearly express their messages. This template contains a variety of slides for the user to input data, such as structures to contrast two elements, bullet points, and slides for written information. Slidegeeks is prepared to create an impression. This slide covers dashboards to monitor performance of advertising campaign launched on Google platform. The purpose of this template is to track and measure the effectiveness of companys ad campaigns. It includes elements such as conversion rates, cost per conversion, impressions and clicks along with top keywords and campaigns.
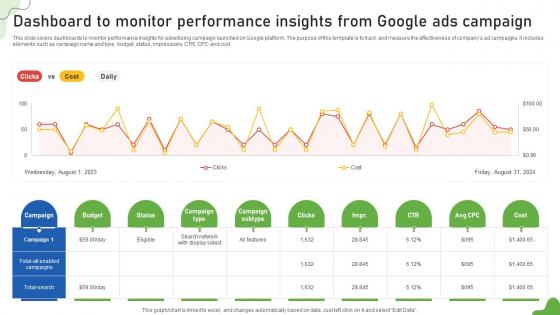
Google Ads Categories Dashboard To Monitor Performance Insights From Google Ads MKT SS V
This slide covers dashboards to monitor performance insights for advertising campaign launched on Google platform. The purpose of this template is to track and measure the effectiveness of companys ad campaigns. It includes elements such as campaign name and type, budget, status, impressions, CTR, CPC and cost. The best PPT templates are a great way to save time, energy, and resources. Slidegeeks have 100 percent editable powerpoint slides making them incredibly versatile. With these quality presentation templates, you can create a captivating and memorable presentation by combining visually appealing slides and effectively communicating your message. Download Google Ads Categories Dashboard To Monitor Performance Insights From Google Ads MKT SS V from Slidegeeks and deliver a wonderful presentation. This slide covers dashboards to monitor performance insights for advertising campaign launched on Google platform. The purpose of this template is to track and measure the effectiveness of companys ad campaigns. It includes elements such as campaign name and type, budget, status, impressions, CTR, CPC and cost.
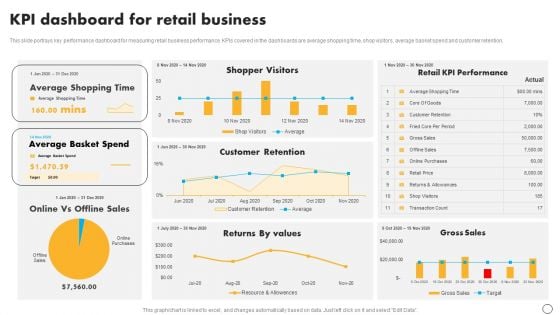
Retail Business Optimization Through Operational Excellence Strategy KPI Dashboard For Retail Business Mockup PDF
This slide portrays key performance dashboard for measuring retail business performance. KPIs covered in the dashboards are average shopping time, shop visitors, average basket spend and customer retention. Boost your pitch with our creative Retail Business Optimization Through Operational Excellence Strategy KPI Dashboard For Retail Business Mockup PDF. Deliver an awe-inspiring pitch that will mesmerize everyone. Using these presentation templates you will surely catch everyones attention. You can browse the ppts collection on our website. We have researchers who are experts at creating the right content for the templates. So you do not have to invest time in any additional work. Just grab the template now and use them.
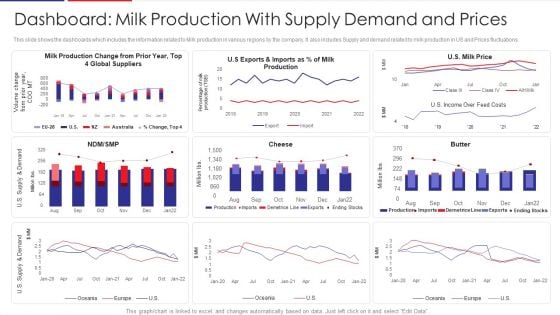
Examination Of Buyer Mindset Towards Dairy Products Dashboard Milk Production With Supply Structure PDF
This slide shows the dashboards which includes the information related to Milk production in various regions by the company. It also includes Supply and demand related to milk production in US and Prices fluctuations. Deliver and pitch your topic in the best possible manner with this examination of buyer mindset towards dairy products dashboard milk production with supply structure pdf. Use them to share invaluable insights on dashboard milk production with supply demand and prices and impress your audience. This template can be altered and modified as per your expectations. So, grab it now.
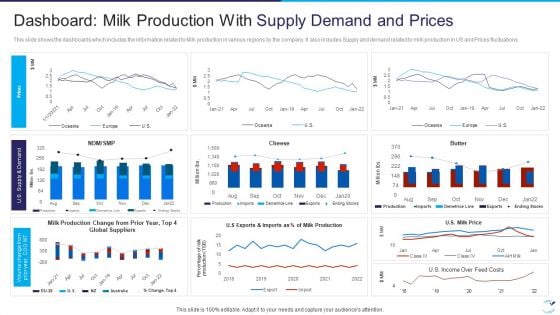
Factor Influencing User Experience Dairy Industry Dashboard Milk Production With Supply Designs PDF
This slide shows the dashboards which includes the information related to Milk production in various regions by the company. It also includes Supply and demand related to milk production in US and Prices fluctuations. Deliver an awe inspiring pitch with this creative factor influencing user experience dairy industry dashboard milk production with supply designs pdf bundle. Topics like dashboard milk production with supply demand and prices can be discussed with this completely editable template. It is available for immediate download depending on the needs and requirements of the user.
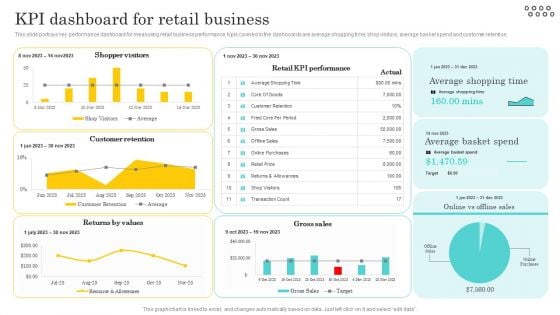
Optimizing And Managing Retail Kpi Dashboard For Retail Business Clipart PDF
This slide portrays key performance dashboard for measuring retail business performance. Kpis covered in the dashboards are average shopping time, shop visitors, average basket spend and customer retention. Explore a selection of the finest Optimizing And Managing Retail Kpi Dashboard For Retail Business Clipart PDF here. With a plethora of professionally designed and pre-made slide templates, you can quickly and easily find the right one for your upcoming presentation. You can use our Optimizing And Managing Retail Kpi Dashboard For Retail Business Clipart PDF to effectively convey your message to a wider audience. Slidegeeks has done a lot of research before preparing these presentation templates. The content can be personalized and the slides are highly editable. Grab templates today from Slidegeeks.
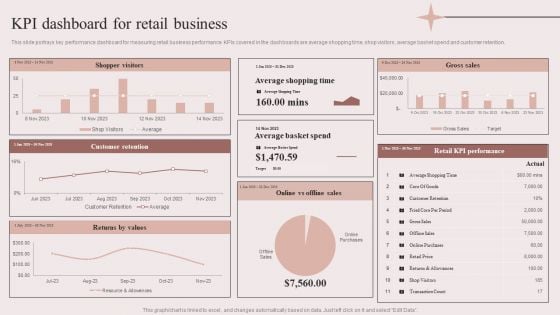
Enhancing Retail Process By Effective Inventory Management KPI Dashboard For Retail Business Inspiration PDF
This slide portrays key performance dashboard for measuring retail business performance. KPIs covered in the dashboards are average shopping time, shop visitors, average basket spend and customer retention. If you are looking for a format to display your unique thoughts, then the professionally designed Enhancing Retail Process By Effective Inventory Management KPI Dashboard For Retail Business Inspiration PDF is the one for you. You can use it as a Google Slides template or a PowerPoint template. Incorporate impressive visuals, symbols, images, and other charts. Modify or reorganize the text boxes as you desire. Experiment with shade schemes and font pairings. Alter, share or cooperate with other people on your work. Download Enhancing Retail Process By Effective Inventory Management KPI Dashboard For Retail Business Inspiration PDF and find out how to give a successful presentation. Present a perfect display to your team and make your presentation unforgettable.
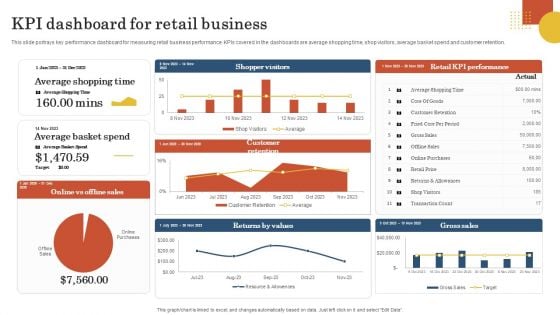
Retail Business Operation Management To Optimize Customer Experience KPI Dashboard For Retail Business Download PDF
This slide portrays key performance dashboard for measuring retail business performance. KPIs covered in the dashboards are average shopping time, shop visitors, average basket spend and customer retention. Are you in need of a template that can accommodate all of your creative concepts This one is crafted professionally and can be altered to fit any style. Use it with Google Slides or PowerPoint. Include striking photographs, symbols, depictions, and other visuals. Fill, move around, or remove text boxes as desired. Test out color palettes and font mixtures. Edit and save your work, or work with colleagues. Download Retail Business Operation Management To Optimize Customer Experience KPI Dashboard For Retail Business Download PDF and observe how to make your presentation outstanding. Give an impeccable presentation to your group and make your presentation unforgettable.
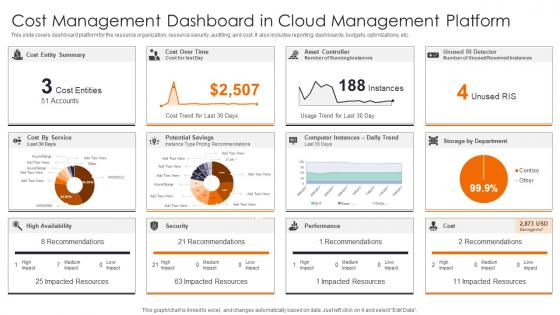
Cost Management Dashboard Enhancing Workload Efficiency Through Cloud Architecture Pictures Pdf
This slide covers dashboard platform for the resource organization, resource security, auditing, and cost. It also includes reporting, dashboards, budgets, optimizations, etc. Explore a selection of the finest Cost Management Dashboard Enhancing Workload Efficiency Through Cloud Architecture Pictures Pdf here. With a plethora of professionally designed and pre made slide templates, you can quickly and easily find the right one for your upcoming presentation. You can use our Cost Management Dashboard Enhancing Workload Efficiency Through Cloud Architecture Pictures Pdf to effectively convey your message to a wider audience. Slidegeeks has done a lot of research before preparing these presentation templates. The content can be personalized and the slides are highly editable. Grab templates today from Slidegeeks. This slide covers dashboard platform for the resource organization, resource security, auditing, and cost. It also includes reporting, dashboards, budgets, optimizations, etc.
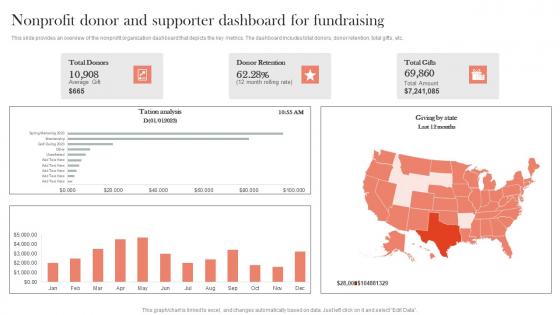
Non profit Donor And Supporter Dashboard For Efficient Nonprofit Marketing Template Pdf
This slide provides an overview of the nonprofit organization dashboard that depicts the key metrics. The dashboard includes total donors, donor retention, total gifts, etc.Create an editable Non profit Donor And Supporter Dashboard For Efficient Nonprofit Marketing Template Pdf that communicates your idea and engages your audience. Whether you are presenting a business or an educational presentation, pre-designed presentation templates help save time. Non profit Donor And Supporter Dashboard For Efficient Nonprofit Marketing Template Pdf is highly customizable and very easy to edit, covering many different styles from creative to business presentations. Slidegeeks has creative team members who have crafted amazing templates. So, go and get them without any delay. This slide provides an overview of the nonprofit organization dashboard that depicts the key metrics. The dashboard includes total donors, donor retention, total gifts, etc.
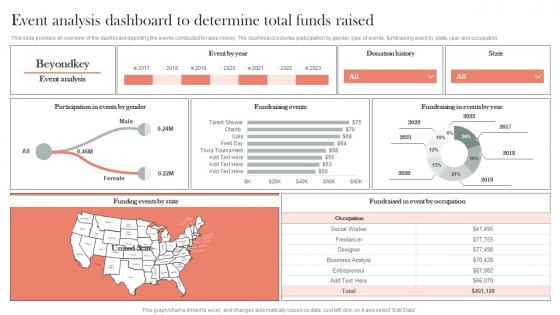
Event Analysis Dashboard To Determine Total Funds Raised Efficient Nonprofit Marketing Clipart Pdf
This slide provides an overview of the dashboard depicting the events conducted to raise money. The dashboard includes participation by gender, type of events, fundraising event by state, year and occupation.This Event Analysis Dashboard To Determine Total Funds Raised Efficient Nonprofit Marketing Clipart Pdf is perfect for any presentation, be it in front of clients or colleagues. It is a versatile and stylish solution for organizing your meetings. The Event Analysis Dashboard To Determine Total Funds Raised Efficient Nonprofit Marketing Clipart Pdf features a modern design for your presentation meetings. The adjustable and customizable slides provide unlimited possibilities for acing up your presentation. Slidegeeks has done all the homework before launching the product for you. So, do not wait, grab the presentation templates today This slide provides an overview of the dashboard depicting the events conducted to raise money. The dashboard includes participation by gender, type of events, fundraising event by state, year and occupation.
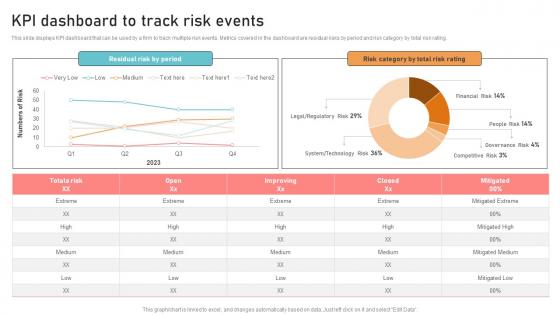
Optimizing Business Integration KPI Dashboard To Track Risk Events Designs Pdf
This slide displays KPI dashboard that can be used by a firm to track multiple risk events. Metrics covered in the dashboard are residual risks by period and risk category by total risk rating. Crafting an eye catching presentation has never been more straightforward. Let your presentation shine with this tasteful yet straightforward Optimizing Business Integration KPI Dashboard To Track Risk Events Designs Pdf template. It offers a minimalistic and classy look that is great for making a statement. The colors have been employed intelligently to add a bit of playfulness while still remaining professional. Construct the ideal Optimizing Business Integration KPI Dashboard To Track Risk Events Designs Pdf that effortlessly grabs the attention of your audience. Begin now and be certain to wow your customers. This slide displays KPI dashboard that can be used by a firm to track multiple risk events. Metrics covered in the dashboard are residual risks by period and risk category by total risk rating.

Predictive Maintained Dashboard To Determine Engine Details Optimizing Inventory Management IoT SS V
This slide provides an overview of the predictive maintenance dashboard used to track engine status. The dashboard includes normal, warning and critical engines, optimal condition, etc. Explore a selection of the finest Predictive Maintained Dashboard To Determine Engine Details Optimizing Inventory Management IoT SS V here. With a plethora of professionally designed and pre-made slide templates, you can quickly and easily find the right one for your upcoming presentation. You can use our Predictive Maintained Dashboard To Determine Engine Details Optimizing Inventory Management IoT SS V to effectively convey your message to a wider audience. Slidegeeks has done a lot of research before preparing these presentation templates. The content can be personalized and the slides are highly editable. Grab templates today from Slidegeeks. This slide provides an overview of the predictive maintenance dashboard used to track engine status. The dashboard includes normal, warning and critical engines, optimal condition, etc.
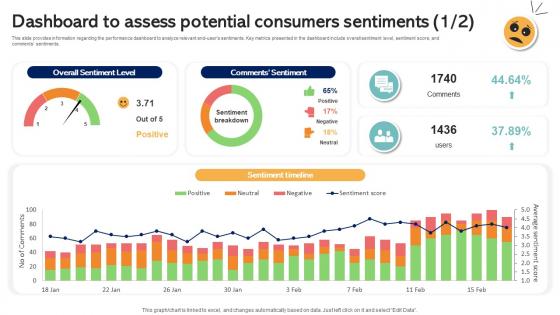
Dashboard To Assess Potential Consumers Sentiments Emotionally Intelligent Insights Leveraging AI SS V
This slide provides information regarding the performance dashboard to analyze relevant end-users sentiments. Key metrics presented in the dashboard include overall sentiment level, sentiment score, and comments sentiments. Do you have an important presentation coming up Are you looking for something that will make your presentation stand out from the rest Look no further than Dashboard To Assess Potential Consumers Sentiments Emotionally Intelligent Insights Leveraging AI SS V. With our professional designs, you can trust that your presentation will pop and make delivering it a smooth process. And with Slidegeeks, you can trust that your presentation will be unique and memorable. So why wait Grab Dashboard To Assess Potential Consumers Sentiments Emotionally Intelligent Insights Leveraging AI SS V today and make your presentation stand out from the rest This slide provides information regarding the performance dashboard to analyze relevant end-users sentiments. Key metrics presented in the dashboard include overall sentiment level, sentiment score, and comments sentiments.
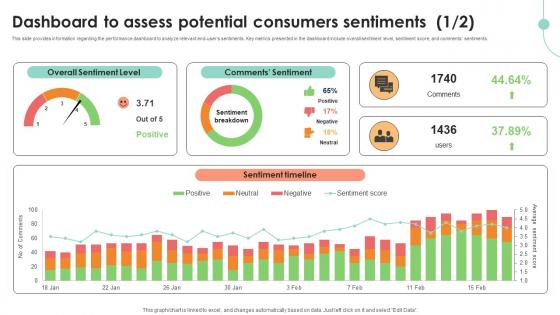
Dashboard To Assess Potential Consumers Decoding User Emotions In Depth Exploration AI SS V
This slide provides information regarding the performance dashboard to analyze relevant end-users sentiments. Key metrics presented in the dashboard include overall sentiment level, sentiment score, and comments sentiments. Do you have an important presentation coming up Are you looking for something that will make your presentation stand out from the rest Look no further than Dashboard To Assess Potential Consumers Decoding User Emotions In Depth Exploration AI SS V. With our professional designs, you can trust that your presentation will pop and make delivering it a smooth process. And with Slidegeeks, you can trust that your presentation will be unique and memorable. So why wait Grab Dashboard To Assess Potential Consumers Decoding User Emotions In Depth Exploration AI SS V today and make your presentation stand out from the rest This slide provides information regarding the performance dashboard to analyze relevant end-users sentiments. Key metrics presented in the dashboard include overall sentiment level, sentiment score, and comments sentiments.
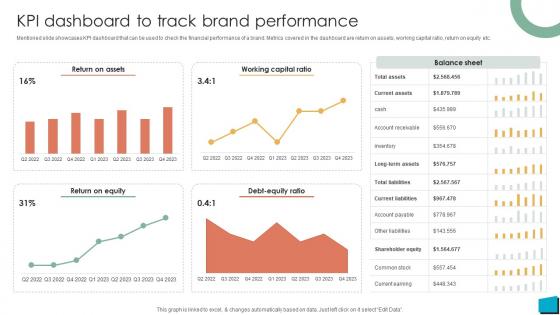
Brand Authority KPI Dashboard To Track Brand Performance Strategy SS V
Mentioned slide showcases KPI dashboard that can be used to check the financial performance of a brand. Metrics covered in the dashboard are return on assets, working capital ratio, return on equity etc. This Brand Authority KPI Dashboard To Track Brand Performance Strategy SS V is perfect for any presentation, be it in front of clients or colleagues. It is a versatile and stylish solution for organizing your meetings. The Brand Authority KPI Dashboard To Track Brand Performance Strategy SS V features a modern design for your presentation meetings. The adjustable and customizable slides provide unlimited possibilities for acing up your presentation. Slidegeeks has done all the homework before launching the product for you. So, do not wait, grab the presentation templates today Mentioned slide showcases KPI dashboard that can be used to check the financial performance of a brand. Metrics covered in the dashboard are return on assets, working capital ratio, return on equity etc.
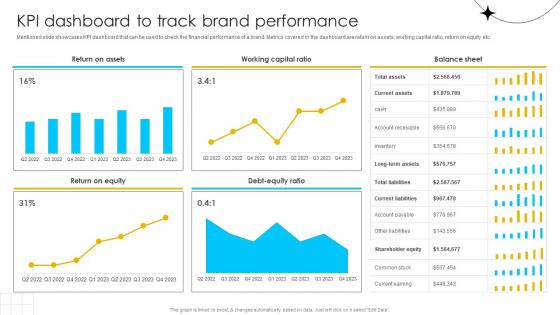
Brand Influence KPI Dashboard To Track Brand Performance Strategy SS V
Mentioned slide showcases KPI dashboard that can be used to check the financial performance of a brand. Metrics covered in the dashboard are return on assets, working capital ratio, return on equity etc. This Brand Influence KPI Dashboard To Track Brand Performance Strategy SS V is perfect for any presentation, be it in front of clients or colleagues. It is a versatile and stylish solution for organizing your meetings. The Brand Influence KPI Dashboard To Track Brand Performance Strategy SS V features a modern design for your presentation meetings. The adjustable and customizable slides provide unlimited possibilities for acing up your presentation. Slidegeeks has done all the homework before launching the product for you. So, do not wait, grab the presentation templates today Mentioned slide showcases KPI dashboard that can be used to check the financial performance of a brand. Metrics covered in the dashboard are return on assets, working capital ratio, return on equity etc.
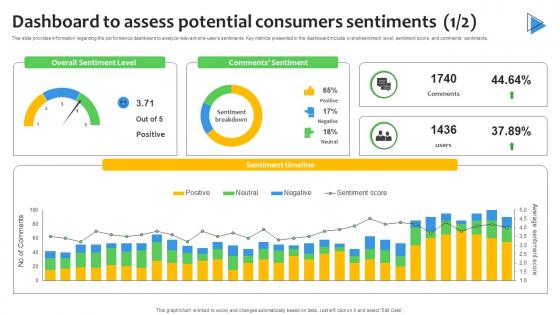
Dashboard To Assess Potential Consumers Sentiment Analysis Demystified Understanding AI SS V
This slide provides information regarding the performance dashboard to analyze relevant end-users sentiments. Key metrics presented in the dashboard include overall sentiment level, sentiment score, and comments sentiments. Do you have an important presentation coming up Are you looking for something that will make your presentation stand out from the rest Look no further than Dashboard To Assess Potential Consumers Sentiment Analysis Demystified Understanding AI SS V. With our professional designs, you can trust that your presentation will pop and make delivering it a smooth process. And with Slidegeeks, you can trust that your presentation will be unique and memorable. So why wait Grab Dashboard To Assess Potential Consumers Sentiment Analysis Demystified Understanding AI SS V today and make your presentation stand out from the rest This slide provides information regarding the performance dashboard to analyze relevant end-users sentiments. Key metrics presented in the dashboard include overall sentiment level, sentiment score, and comments sentiments.
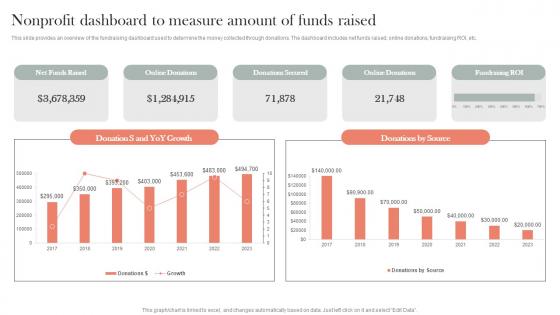
Non profit Dashboard To Measure Amount Of Funds Efficient Nonprofit Marketing Background Pdf
This slide provides an overview of the fundraising dashboard used to determine the money collected through donations. The dashboard includes net funds raised, online donations, fundraising ROI, etc.Boost your pitch with our creative Non profit Dashboard To Measure Amount Of Funds Efficient Nonprofit Marketing Background Pdf. Deliver an awe-inspiring pitch that will mesmerize everyone. Using these presentation templates you will surely catch everyones attention. You can browse the ppts collection on our website. We have researchers who are experts at creating the right content for the templates. So you do not have to invest time in any additional work. Just grab the template now and use them. This slide provides an overview of the fundraising dashboard used to determine the money collected through donations. The dashboard includes net funds raised, online donations, fundraising ROI, etc.
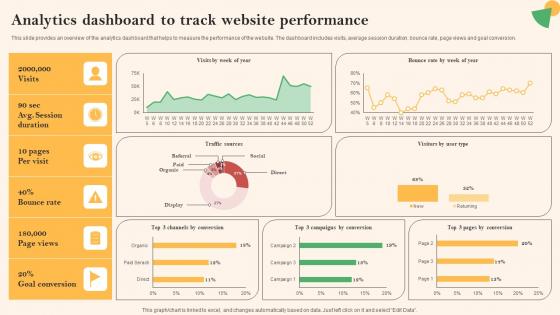
Social Media Marketing To Boost Analytics Dashboard To Track Website Performance Pictures Pdf
This slide provides an overview of the analytics dashboard that helps to measure the performance of the website. The dashboard includes visits, average session duration, bounce rate, page views and goal conversion. Slidegeeks is one of the best resources for PowerPoint templates. You can download easily and regulate Social Media Marketing To Boost Analytics Dashboard To Track Website Performance Pictures Pdf for your personal presentations from our wonderful collection. A few clicks is all it takes to discover and get the most relevant and appropriate templates. Use our Templates to add a unique zing and appeal to your presentation and meetings. All the slides are easy to edit and you can use them even for advertisement purposes. This slide provides an overview of the analytics dashboard that helps to measure the performance of the website. The dashboard includes visits, average session duration, bounce rate, page views and goal conversion.
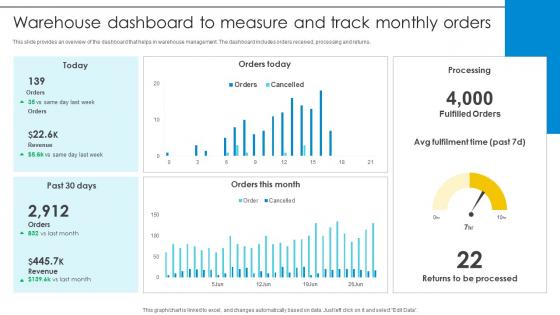
Warehouse Dashboard To Measure And Track Monthly Orders Optimizing Inventory Management IoT SS V
This slide provides an overview of the dashboard that helps in warehouse management. The dashboard includes orders received, processing and returns. Want to ace your presentation in front of a live audience Our Warehouse Dashboard To Measure And Track Monthly Orders Optimizing Inventory Management IoT SS V can help you do that by engaging all the users towards you. Slidegeeks experts have put their efforts and expertise into creating these impeccable powerpoint presentations so that you can communicate your ideas clearly. Moreover, all the templates are customizable, and easy-to-edit and downloadable. Use these for both personal and commercial use. This slide provides an overview of the dashboard that helps in warehouse management. The dashboard includes orders received, processing and returns.
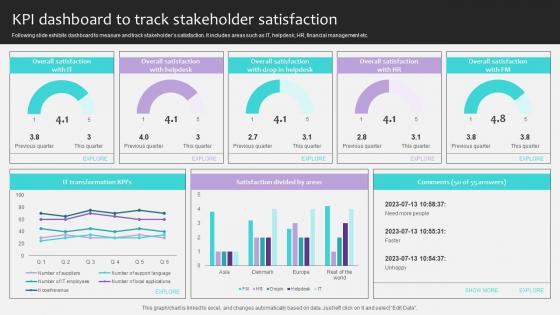
Project Stakeholders Management KPI Dashboard To Track Stakeholder Satisfaction Ppt Powerpoint
Following slide exhibits dashboard to measure and track stakeholders satisfaction. It includes areas such as IT, helpdesk, HR, financial management etc. Presenting this PowerPoint presentation, titled Project Stakeholders Management KPI Dashboard To Track Stakeholder Satisfaction Ppt Powerpoint, with topics curated by our researchers after extensive research. This editable presentation is available for immediate download and provides attractive features when used. Download now and captivate your audience. Presenting this Project Stakeholders Management KPI Dashboard To Track Stakeholder Satisfaction Ppt Powerpoint. Our researchers have carefully researched and created these slides with all aspects taken into consideration. This is a completely customizable Project Stakeholders Management KPI Dashboard To Track Stakeholder Satisfaction Ppt Powerpoint that is available for immediate downloading. Download now and make an impact on your audience. Highlight the attractive features available with our PPTs. Following slide exhibits dashboard to measure and track stakeholders satisfaction. It includes areas such as IT, helpdesk, HR, financial management etc.
Sales Improvement Leading Metrics Dashboard Icon Ppt Summary Design Inspiration Pdf
Showcasing this set of slides titled Sales Improvement Leading Metrics Dashboard Icon Ppt Summary Design Inspiration Pdf. The topics addressed in these templates are Sales Improvement Leading, Metrics Dashboard, Icon. All the content presented in this PPT design is completely editable. Download it and make adjustments in color, background, font etc. as per your unique business setting. Our Sales Improvement Leading Metrics Dashboard Icon Ppt Summary Design Inspiration Pdf are topically designed to provide an attractive backdrop to any subject. Use them to look like a presentation pro.
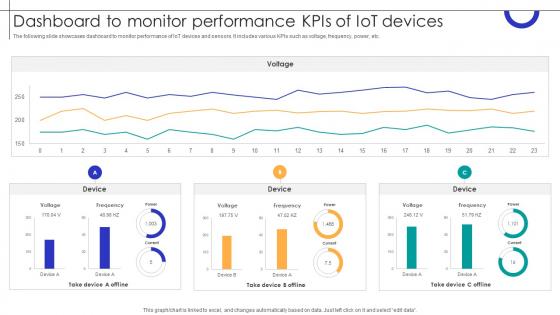
Dashboard To Monitor Performance KPIS Of IOT Devices Streamlining Production Ppt Powerpoint
The following slide showcases dashboard to monitor performance of IoT devices and sensors. It includes various KPIs such as voltage, frequency, power, etc. Formulating a presentation can take up a lot of effort and time, so the content and message should always be the primary focus. The visuals of the PowerPoint can enhance the presenters message, so our Dashboard To Monitor Performance KPIS Of IOT Devices Streamlining Production Ppt Powerpoint was created to help save time. Instead of worrying about the design, the presenter can concentrate on the message while our designers work on creating the ideal templates for whatever situation is needed. Slidegeeks has experts for everything from amazing designs to valuable content, we have put everything into Dashboard To Monitor Performance KPIS Of IOT Devices Streamlining Production Ppt Powerpoint The following slide showcases dashboard to monitor performance of IoT devices and sensors. It includes various KPIs such as voltage, frequency, power, etc.

KPI Dashboard To Measure Brand Marketing Performance Ultimate Guide Implementing Demonstration Pdf
Mentioned slide illustrates KPI dashboard that can be used by organizations to track the performance of their brand performance. Brand, advertising and purchase are the metrics covered in the dashboard. Presenting this PowerPoint presentation, titled KPI Dashboard To Measure Brand Marketing Performance Ultimate Guide Implementing Demonstration Pdf with topics curated by our researchers after extensive research. This editable presentation is available for immediate download and provides attractive features when used. Download now and captivate your audience. Presenting this KPI Dashboard To Measure Brand Marketing Performance Ultimate Guide Implementing Demonstration Pdf Our researchers have carefully researched and created these slides with all aspects taken into consideration. This is a completely customizable KPI Dashboard To Measure Brand Marketing Performance Ultimate Guide Implementing Demonstration Pdf that is available for immediate downloading. Download now and make an impact on your audience. Highlight the attractive features available with our PPTs. Mentioned slide illustrates KPI dashboard that can be used by organizations to track the performance of their brand performance. Brand, advertising and purchase are the metrics covered in the dashboard.
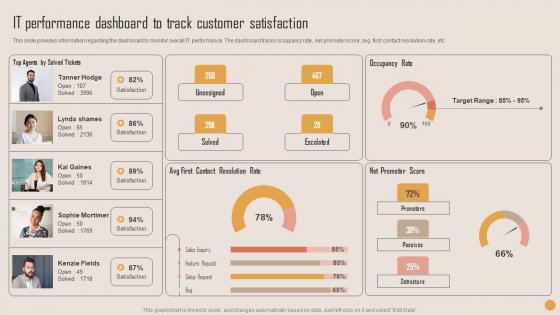
IT Performance Dashboard Playbook For Strategic Actions To Improve IT Performance Rules Pdf
This slide provides information regarding the dashboard to monitor overall IT performance. The dashboard tracks occupancy rate, net promoter score, avg. first contact resolution rate, etc. Presenting this PowerPoint presentation, titled IT Performance Dashboard Playbook For Strategic Actions To Improve IT Performance Rules Pdf, with topics curated by our researchers after extensive research. This editable presentation is available for immediate download and provides attractive features when used. Download now and captivate your audience. Presenting this IT Performance Dashboard Playbook For Strategic Actions To Improve IT Performance Rules Pdf. Our researchers have carefully researched and created these slides with all aspects taken into consideration. This is a completely customizable IT Performance Dashboard Playbook For Strategic Actions To Improve IT Performance Rules Pdf that is available for immediate downloading. Download now and make an impact on your audience. Highlight the attractive features available with our PPTs. This slide provides information regarding the dashboard to monitor overall IT performance. The dashboard tracks occupancy rate, net promoter score, avg. first contact resolution rate, etc.
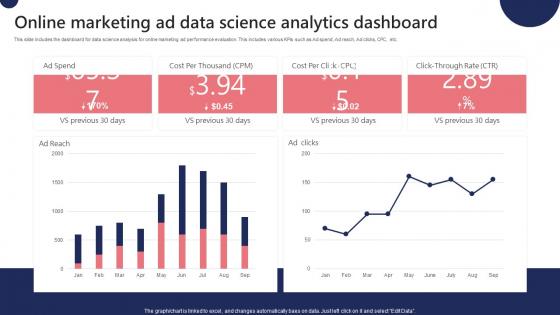
Online Marketing Ad Data Science Analytics Dashboard Ppt File Portfolio Pdf
This slide includes the dashboard for data science analysis for online marketing ad performance evaluation. This includes various KPIs such as Ad spend, Ad reach, Ad clicks, CPC, etc. Showcasing this set of slides titled Online Marketing Ad Data Science Analytics Dashboard Ppt File Portfolio Pdf. The topics addressed in these templates are Data Transformation, Data Visualization, Cross Channel Analytics. All the content presented in this PPT design is completely editable. Download it and make adjustments in color, background, font etc. as per your unique business setting. This slide includes the dashboard for data science analysis for online marketing ad performance evaluation. This includes various KPIs such as Ad spend, Ad reach, Ad clicks, CPC, etc.
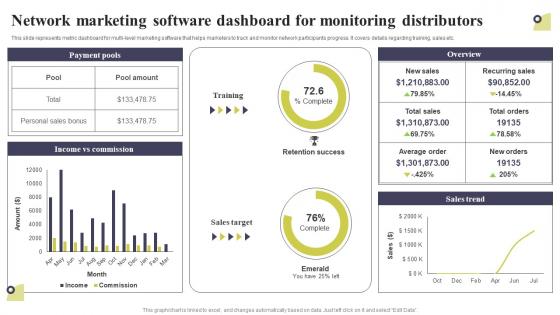
Network Marketing Software Dashboard For Monitoring Distributors Multi Level Marketing Designs Pdf
This slide represents metric dashboard for multi-level marketing software that helps marketers to track and monitor network participants progress. It covers details regarding training, sales etc. Find a pre-designed and impeccable Network Marketing Software Dashboard For Monitoring Distributors Multi Level Marketing Designs Pdf The templates can ace your presentation without additional effort. You can download these easy-to-edit presentation templates to make your presentation stand out from others. So, what are you waiting for Download the template from Slidegeeks today and give a unique touch to your presentation. This slide represents metric dashboard for multi-level marketing software that helps marketers to track and monitor network participants progress. It covers details regarding training, sales etc.
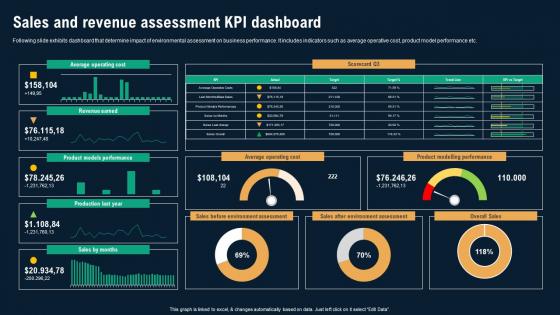
Sales And Revenue Assessment KPI Dashboard Business Environmental Analysis Ideas Pdf
Following slide exhibits dashboard that determine impact of environmental assessment on business performance. It includes indicators such as average operative cost, product model performance etc. There are so many reasons you need a Sales And Revenue Assessment KPI Dashboard Business Environmental Analysis Ideas Pdf The first reason is you can not spend time making everything from scratch, Thus, Slidegeeks has made presentation templates for you too. You can easily download these templates from our website easily. Following slide exhibits dashboard that determine impact of environmental assessment on business performance. It includes indicators such as average operative cost, product model performance etc.
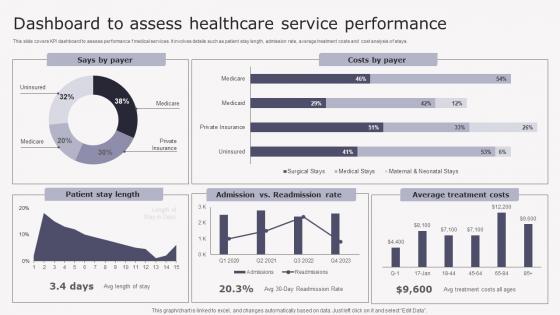
Dashboard To Assess Healthcare Transforming Medicare Services Using Health Background Pdf
This slide covers KPI dashboard to assess performance f medical services. It involves details such as patient stay length, admission rate, average treatment costs and cost analysis of stays. There are so many reasons you need a Dashboard To Assess Healthcare Transforming Medicare Services Using Health Background Pdf. The first reason is you can not spend time making everything from scratch, Thus, Slidegeeks has made presentation templates for you too. You can easily download these templates from our website easily. This slide covers KPI dashboard to assess performance f medical services. It involves details such as patient stay length, admission rate, average treatment costs and cost analysis of stays.
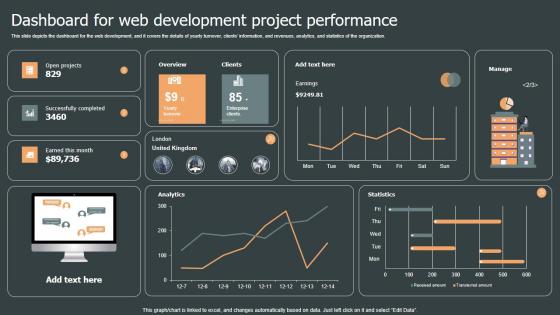
Dashboard For Web Development Role Web Designing User Engagement Topics PDF
This slide depicts the dashboard for the web development, and it covers the details of yearly turnover, clients information, and revenues, analytics, and statistics of the organization. There are so many reasons you need a Dashboard For Web Development Role Web Designing User Engagement Topics PDF. The first reason is you can not spend time making everything from scratch, Thus, Slidegeeks has made presentation templates for you too. You can easily download these templates from our website easily. This slide depicts the dashboard for the web development, and it covers the details of yearly turnover, clients information, and revenues, analytics, and statistics of the organization.
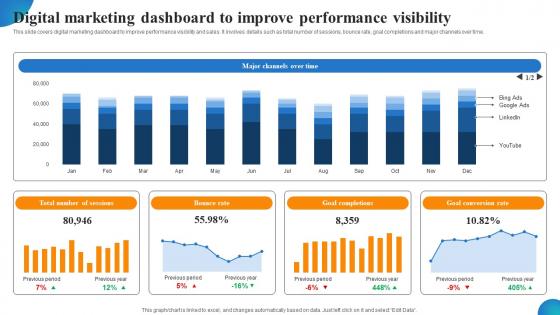
Digital Marketing Dashboard To Improve Performance Visibility MDSS For Enhanced Brochure Pdf
This slide covers digital marketing dashboard to improve performance visibility and sales. It involves details such as total number of sessions, bounce rate, goal completions and major channels over time. There are so many reasons you need a Digital Marketing Dashboard To Improve Performance Visibility MDSS For Enhanced Brochure Pdf The first reason is you can not spend time making everything from scratch, Thus, Slidegeeks has made presentation templates for you too. You can easily download these templates from our website easily. This slide covers digital marketing dashboard to improve performance visibility and sales. It involves details such as total number of sessions, bounce rate, goal completions and major channels over time.
Online Learning And Improvement KPI Training Sessions Dashboard Icon Graphics Pdf
Pitch your topic with ease and precision using this Online Learning And Improvement KPI Training Sessions Dashboard Icon Graphics Pdf. This layout presents information on Online Learning, Improvement KPI, Training Sessions, Dashboard Icon. It is also available for immediate download and adjustment. So, changes can be made in the color, design, graphics or any other component to create a unique layout. Our Online Learning And Improvement KPI Training Sessions Dashboard Icon Graphics Pdf are topically designed to provide an attractive backdrop to any subject. Use them to look like a presentation pro.
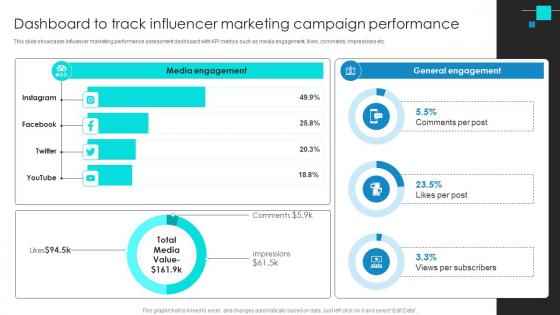
Project Benchmarking Process Dashboard To Track Influencer Marketing Campaign CRP DK SS V
This slide showcases influencer marketing performance assessment dashboard with KPI metrics such as media engagement, likes, comments, impressions etc. If your project calls for a presentation, then Slidegeeks is your go-to partner because we have professionally designed, easy-to-edit templates that are perfect for any presentation. After downloading, you can easily edit Project Benchmarking Process Dashboard To Track Influencer Marketing Campaign CRP DK SS V and make the changes accordingly. You can rearrange slides or fill them with different images. Check out all the handy templates This slide showcases influencer marketing performance assessment dashboard with KPI metrics such as media engagement, likes, comments, impressions etc.
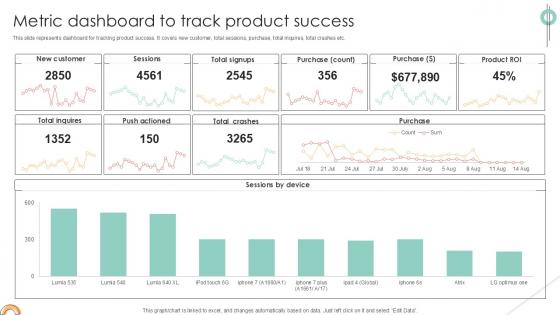
Metric Dashboard To Track Implementing Product Diversification PPT Sample Strategy SS V
This slide represents dashboard for tracking product success. It covers new customer, total sessions, purchase, total inquires, total crashes etc. The best PPT templates are a great way to save time, energy, and resources. Slidegeeks have 100 percent editable powerpoint slides making them incredibly versatile. With these quality presentation templates, you can create a captivating and memorable presentation by combining visually appealing slides and effectively communicating your message. Download Metric Dashboard To Track Implementing Product Diversification PPT Sample Strategy SS V from Slidegeeks and deliver a wonderful presentation. This slide represents dashboard for tracking product success. It covers new customer, total sessions, purchase, total inquires, total crashes etc.


 Continue with Email

 Home
Home


