Dashboards

Dashboard To Evaluate Top Performing Comprehensive Guide To Wholesale Ppt Presentation
This slide showcases dashboard which helps track sales representatives performance by assessing cold calling KPIs. it provides information regarding KPIs such as conversion rates, no. of items sold. No. of deals converted, value generated etc. Coming up with a presentation necessitates that the majority of the effort goes into the content and the message you intend to convey. The visuals of a PowerPoint presentation can only be effective if it supplements and supports the story that is being told. Keeping this in mind our experts created Dashboard To Evaluate Top Performing Comprehensive Guide To Wholesale Ppt Presentation to reduce the time that goes into designing the presentation. This way, you can concentrate on the message while our designers take care of providing you with the right template for the situation. This slide showcases dashboard which helps track sales representatives performance by assessing cold calling KPIs. it provides information regarding KPIs such as conversion rates, no. of items sold. No. of deals converted, value generated etc.
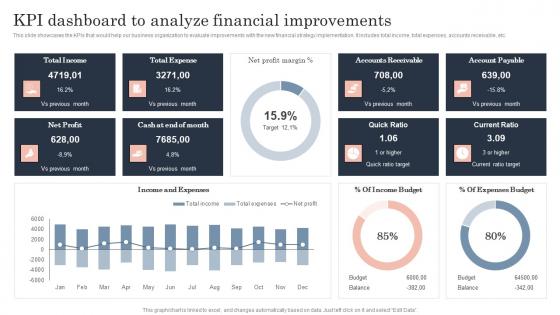
Kpi Dashboard To Analyze Financial Guide To Corporate Financial Growth Plan Designs Pdf
This slide showcases the KPIs that would help our business organization to evaluate improvements with the new financial strategy implementation. It includes total income, total expenses, accounts receivable, etc.Presenting this PowerPoint presentation, titled Kpi Dashboard To Analyze Financial Guide To Corporate Financial Growth Plan Designs Pdf, with topics curated by our researchers after extensive research. This editable presentation is available for immediate download and provides attractive features when used. Download now and captivate your audience. Presenting this Kpi Dashboard To Analyze Financial Guide To Corporate Financial Growth Plan Designs Pdf. Our researchers have carefully researched and created these slides with all aspects taken into consideration. This is a completely customizable Kpi Dashboard To Analyze Financial Guide To Corporate Financial Growth Plan Designs Pdf that is available for immediate downloading. Download now and make an impact on your audience. Highlight the attractive features available with our PPTs. This slide showcases the KPIs that would help our business organization to evaluate improvements with the new financial strategy implementation. It includes total income, total expenses, accounts receivable, etc.
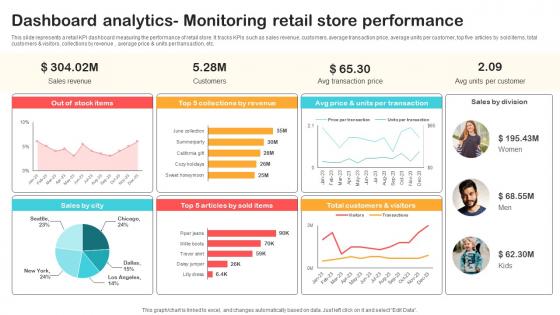
Dashboard Analytics Monitoring Retail Store Performance Optimizing Retail Operations With Digital DT SS V
This slide represents a retail KPI dashboard measuring the performance of retail store. It tracks KPIs such as sales revenue, customers, average transaction price, average units per customer, top five articles by sold items, total customers and visitors, collections by revenue , average price and units per transaction, etc.Are you in need of a template that can accommodate all of your creative concepts This one is crafted professionally and can be altered to fit any style. Use it with Google Slides or PowerPoint. Include striking photographs, symbols, depictions, and other visuals. Fill, move around, or remove text boxes as desired. Test out color palettes and font mixtures. Edit and save your work, or work with colleagues. Download Dashboard Analytics Monitoring Retail Store Performance Optimizing Retail Operations With Digital DT SS V and observe how to make your presentation outstanding. Give an impeccable presentation to your group and make your presentation unforgettable. This slide represents a retail KPI dashboard measuring the performance of retail store. It tracks KPIs such as sales revenue, customers, average transaction price, average units per customer, top five articles by sold items, total customers and visitors, collections by revenue , average price and units per transaction, etc.
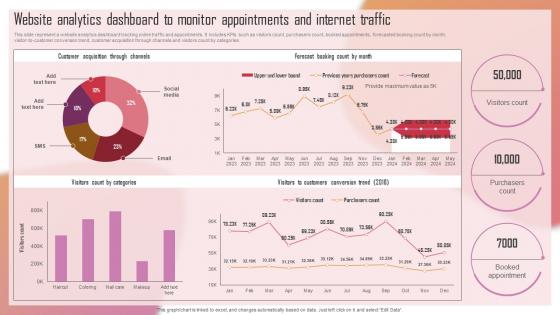
Customizing The Salon Experience Website Analytics Dashboard To Monitor Appointments Strategy SS V
This slide represent a website analytics dashboard tracking online traffic and appointments. It includes KPIs such as visitors count, purchasers count, booked appointments, forecasted booking count by month, visitor-to-customer conversion trend, customer acquisition through channels and visitors count by categories. Retrieve professionally designed Customizing The Salon Experience Website Analytics Dashboard To Monitor Appointments Strategy SS V to effectively convey your message and captivate your listeners. Save time by selecting pre-made slideshows that are appropriate for various topics, from business to educational purposes. These themes come in many different styles, from creative to corporate, and all of them are easily adjustable and can be edited quickly. Access them as PowerPoint templates or as Google Slides themes. You do not have to go on a hunt for the perfect presentation because Slidegeeks got you covered from everywhere. This slide represent a website analytics dashboard tracking online traffic and appointments. It includes KPIs such as visitors count, purchasers count, booked appointments, forecasted booking count by month, visitor-to-customer conversion trend, customer acquisition through channels and visitors count by categories.
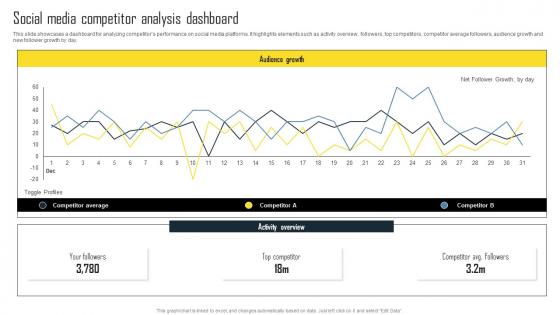
Social Media Competitor Analysis Dashboard Efficient Plan For Conducting Competitor Microsoft Pdf
This slide showcases a dashboard for analyzing competitors performance on social media platforms. It highlights elements such as activity overview, followers, top competitors, competitor average followers, audience growth and new follower growth by day. Are you in need of a template that can accommodate all of your creative concepts This one is crafted professionally and can be altered to fit any style. Use it with Google Slides or PowerPoint. Include striking photographs, symbols, depictions, and other visuals. Fill, move around, or remove text boxes as desired. Test out color palettes and font mixtures. Edit and save your work, or work with colleagues. Download Social Media Competitor Analysis Dashboard Efficient Plan For Conducting Competitor Microsoft Pdf and observe how to make your presentation outstanding. Give an impeccable presentation to your group and make your presentation unforgettable. This slide showcases a dashboard for analyzing competitors performance on social media platforms. It highlights elements such as activity overview, followers, top competitors, competitor average followers, audience growth and new follower growth by day.
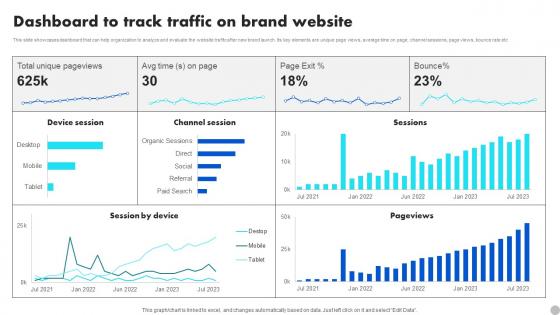
Dashboard To Track Traffic On Brand Website Brand Diversification Approach Rules Pdf
This slide showcases dashboard that can help organization to analyze and evaluate the website traffic after new brand launch. Its key elements are unique page views, average time on page, channel sessions, page views, bounce rate etc. Are you in need of a template that can accommodate all of your creative concepts This one is crafted professionally and can be altered to fit any style. Use it with Google Slides or PowerPoint. Include striking photographs, symbols, depictions, and other visuals. Fill, move around, or remove text boxes as desired. Test out color palettes and font mixtures. Edit and save your work, or work with colleagues. Download Dashboard To Track Traffic On Brand Website Brand Diversification Approach Rules Pdf and observe how to make your presentation outstanding. Give an impeccable presentation to your group and make your presentation unforgettable. This slide showcases dashboard that can help organization to analyze and evaluate the website traffic after new brand launch. Its key elements are unique page views, average time on page, channel sessions, page views, bounce rate etc.
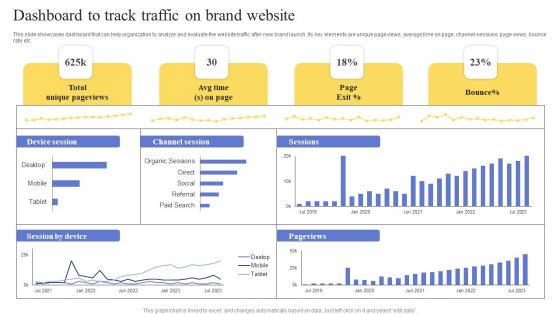
Dashboard To Track Traffic On Brand Website Maximizing Revenue Using Professional Pdf
This slide showcases dashboard that can help organization to analyze and evaluate the website traffic after new brand launch. Its key elements are unique page views, average time on page, channel sessions, page views, bounce rate etc. Are you in need of a template that can accommodate all of your creative concepts This one is crafted professionally and can be altered to fit any style. Use it with Google Slides or PowerPoint. Include striking photographs, symbols, depictions, and other visuals. Fill, move around, or remove text boxes as desired. Test out color palettes and font mixtures. Edit and save your work, or work with colleagues. Download Dashboard To Track Traffic On Brand Website Maximizing Revenue Using Professional Pdf and observe how to make your presentation outstanding. Give an impeccable presentation to your group and make your presentation unforgettable. This slide showcases dashboard that can help organization to analyze and evaluate the website traffic after new brand launch. Its key elements are unique page views, average time on page, channel sessions, page views, bounce rate etc.
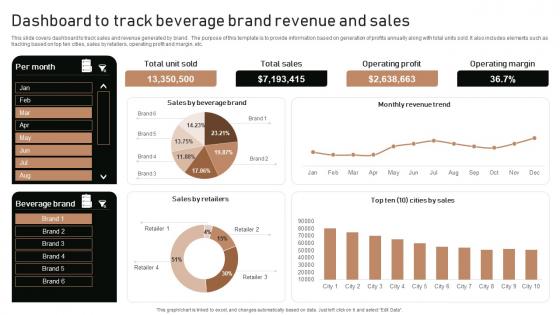
Execution Of Product Lifecycle Dashboard To Track Beverage Brand Revenue And Sales Ideas Pdf
This slide covers dashboard to track sales and revenue generated by brand . The purpose of this template is to provide information based on generation of profits annually along with total units sold. It also includes elements such as tracking based on top ten cities, sales by retailers, operating profit and margin, etc. From laying roadmaps to briefing everything in detail, our templates are perfect for you. You can set the stage with your presentation slides. All you have to do is download these easy-to-edit and customizable templates. Execution Of Product Lifecycle Dashboard To Track Beverage Brand Revenue And Sales Ideas Pdf will help you deliver an outstanding performance that everyone would remember and praise you for. Do download this presentation today. This slide covers dashboard to track sales and revenue generated by brand . The purpose of this template is to provide information based on generation of profits annually along with total units sold. It also includes elements such as tracking based on top ten cities, sales by retailers, operating profit and margin, etc.
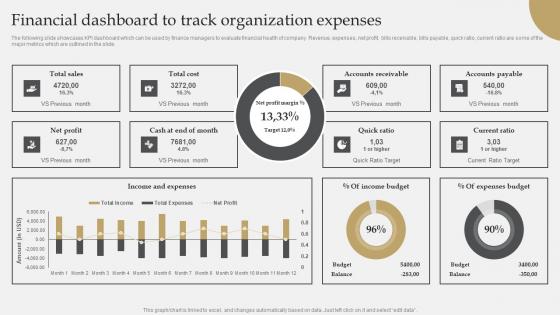
IT Industry Market Research Financial Dashboard To Track Organization Expenses Introduction Pdf
The following slide showcases KPI dashboard which can be used by finance managers to evaluate financial health of company. Revenue, expenses, net profit, bills receivable, bills payable, quick ratio, current ratio are some of the major metrics which are outlined in the slide. Present like a pro with IT Industry Market Research Financial Dashboard To Track Organization Expenses Introduction Pdf Create beautiful presentations together with your team, using our easy-to-use presentation slides. Share your ideas in real-time and make changes on the fly by downloading our templates. So whether you are in the office, on the go, or in a remote location, you can stay in sync with your team and present your ideas with confidence. With Slidegeeks presentation got a whole lot easier. Grab these presentations today. The following slide showcases KPI dashboard which can be used by finance managers to evaluate financial health of company. Revenue, expenses, net profit, bills receivable, bills payable, quick ratio, current ratio are some of the major metrics which are outlined in the slide.
Dashboard To Track Beverage Brand Revenue Comprehensive Guide To Product Lifecycle Graphics Pdf
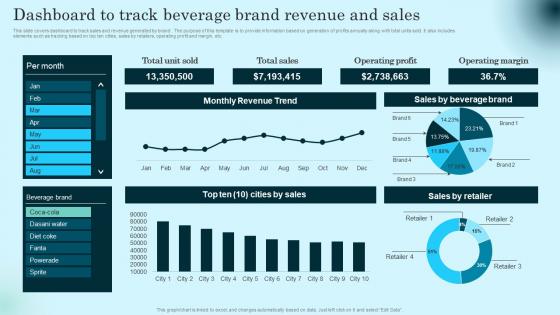
This slide covers dashboard to track sales and revenue generated by brand . The purpose of this template is to provide information based on generation of profits annually along with total units sold. It also includes elements such as tracking based on top ten cities, sales by retailers, operating profit and margin, etc. Present like a pro with Dashboard To Track Beverage Brand Revenue Comprehensive Guide To Product Lifecycle Graphics Pdf Create beautiful presentations together with your team, using our easy to use presentation slides. Share your ideas in real time and make changes on the fly by downloading our templates. So whether you are in the office, on the go, or in a remote location, you can stay in sync with your team and present your ideas with confidence. With Slidegeeks presentation got a whole lot easier. Grab these presentations today. This slide covers dashboard to track sales and revenue generated by brand . The purpose of this template is to provide information based on generation of profits annually along with total units sold. It also includes elements such as tracking based on top ten cities, sales by retailers, operating profit and margin, etc.
Dashboard To Measure Workflow Performance Post Embracing Robotic Process Portrait PDF
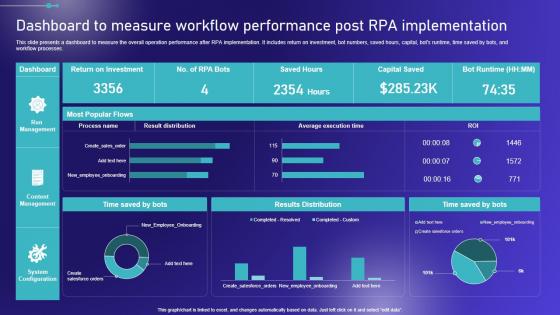
This slide presents a dashboard to measure the overall operation performance after RPA implementation. It includes return on investment, bot numbers, saved hours, capital, bots runtime, time saved by bots, and workflow processes. Are you in need of a template that can accommodate all of your creative concepts This one is crafted professionally and can be altered to fit any style. Use it with Google Slides or PowerPoint. Include striking photographs, symbols, depictions, and other visuals. Fill, move around, or remove text boxes as desired. Test out color palettes and font mixtures. Edit and save your work, or work with colleagues. Download Dashboard To Measure Workflow Performance Post Embracing Robotic Process Portrait PDF and observe how to make your presentation outstanding. Give an impeccable presentation to your group and make your presentation unforgettable. This slide presents a dashboard to measure the overall operation performance after RPA implementation. It includes return on investment, bot numbers, saved hours, capital, bots runtime, time saved by bots, and workflow processes.
Dashboard To Track Traffic On Brand Website Strategic Marketing Plan Structure PDF
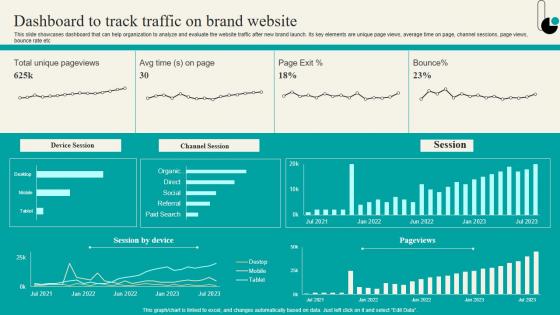
This slide showcases dashboard that can help organization to analyze and evaluate the website traffic after new brand launch. Its key elements are unique page views, average time on page, channel sessions, page views, bounce rate etc. Are you in need of a template that can accommodate all of your creative concepts This one is crafted professionally and can be altered to fit any style. Use it with Google Slides or PowerPoint. Include striking photographs, symbols, depictions, and other visuals. Fill, move around, or remove text boxes as desired. Test out color palettes and font mixtures. Edit and save your work, or work with colleagues. Download Dashboard To Track Traffic On Brand Website Strategic Marketing Plan Structure PDF and observe how to make your presentation outstanding. Give an impeccable presentation to your group and make your presentation unforgettable. This slide showcases dashboard that can help organization to analyze and evaluate the website traffic after new brand launch. Its key elements are unique page views, average time on page, channel sessions, page views, bounce rate etc.
Dashboard To Track Traffic On Brand Website Launching New Product Brand Sample Pdf
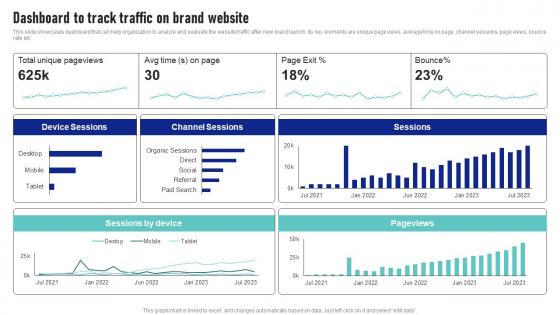
This slide showcases dashboard that can help organization to analyze and evaluate the website traffic after new brand launch. Its key elements are unique page views, average time on page, channel sessions, page views, bounce rate etc Are you in need of a template that can accommodate all of your creative concepts This one is crafted professionally and can be altered to fit any style. Use it with Google Slides or PowerPoint. Include striking photographs, symbols, depictions, and other visuals. Fill, move around, or remove text boxes as desired. Test out color palettes and font mixtures. Edit and save your work, or work with colleagues. Download Dashboard To Track Traffic On Brand Website Launching New Product Brand Sample Pdf and observe how to make your presentation outstanding. Give an impeccable presentation to your group and make your presentation unforgettable. This slide showcases dashboard that can help organization to analyze and evaluate the website traffic after new brand launch. Its key elements are unique page views, average time on page, channel sessions, page views, bounce rate etc
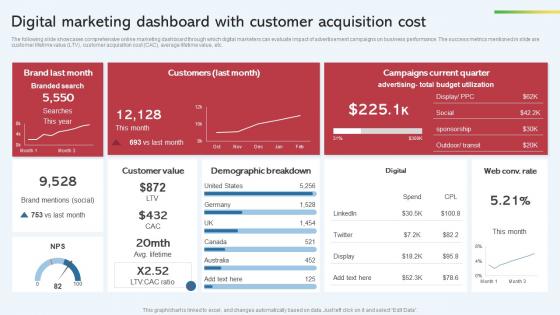
Digital Marketing Dashboard With Customer Acquisition Cost Effective Startup Promotion Plan Formats Pdf
The following slide showcases comprehensive online marketing dashboard through which digital marketers can evaluate impact of advertisement campaigns on business performance. The success metrics mentioned in slide are customer lifetime value LTV, customer acquisition cost CAC, average lifetime value, etc. Slidegeeks is here to make your presentations a breeze with Digital Marketing Dashboard With Customer Acquisition Cost Effective Startup Promotion Plan Formats Pdf With our easy to use and customizable templates, you can focus on delivering your ideas rather than worrying about formatting. With a variety of designs to choose from, you are sure to find one that suits your needs. And with animations and unique photos, illustrations, and fonts, you can make your presentation pop. So whether you are giving a sales pitch or presenting to the board, make sure to check out Slidegeeks first. The following slide showcases comprehensive online marketing dashboard through which digital marketers can evaluate impact of advertisement campaigns on business performance. The success metrics mentioned in slide are customer lifetime value LTV, customer acquisition cost CAC, average lifetime value, etc.
SD Wan Network Performance Tracking Dashboard Wide Area Network Services Portrait Pdf
This slide represents the SD-WAN network performance tracking dashboard. The purpose of this slide is to demonstrate the performance of the SD-WAN network. The main components include control status, site health, transport interface distribution, WAN edge inventory, edge health, and so on. Slidegeeks has constructed SD Wan Network Performance Tracking Dashboard Wide Area Network Services Portrait Pdf after conducting extensive research and examination. These presentation templates are constantly being generated and modified based on user preferences and critiques from editors. Here, you will find the most attractive templates for a range of purposes while taking into account ratings and remarks from users regarding the content. This is an excellent jumping-off point to explore our content and will give new users an insight into our top-notch PowerPoint Templates. This slide represents the SD-WAN network performance tracking dashboard. The purpose of this slide is to demonstrate the performance of the SD-WAN network. The main components include control status, site health, transport interface distribution, WAN edge inventory, edge health, and so on.
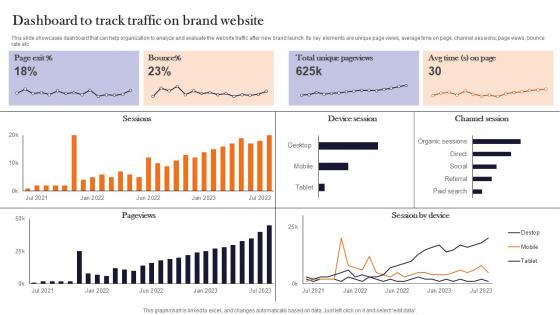
Dashboard To Track Traffic On Brand Website Product Advertising And Positioning Diagrams Pdf
This slide showcases dashboard that can help organization to analyze and evaluate the website traffic after new brand launch. Its key elements are unique page views, average time on page, channel sessions, page views, bounce rate etc. Are you in need of a template that can accommodate all of your creative concepts This one is crafted professionally and can be altered to fit any style. Use it with Google Slides or PowerPoint. Include striking photographs, symbols, depictions, and other visuals. Fill, move around, or remove text boxes as desired. Test out color palettes and font mixtures. Edit and save your work, or work with colleagues. Download Dashboard To Track Traffic On Brand Website Product Advertising And Positioning Diagrams Pdf and observe how to make your presentation outstanding. Give an impeccable presentation to your group and make your presentation unforgettable. This slide showcases dashboard that can help organization to analyze and evaluate the website traffic after new brand launch. Its key elements are unique page views, average time on page, channel sessions, page views, bounce rate etc.
Industrial Robots Performance Tracking Dashboard Applications Of Industrial Robots Portrait Pdf
This slide shows the dashboard to keep a regular track of the performance of industrial robots. The purpose of this slide is to provide a graphical representation of robots performance to enhance the accuracy and effectiveness of these machines. Welcome to our selection of the Industrial Robots Performance Tracking Dashboard Applications Of Industrial Robots Portrait Pdf. These are designed to help you showcase your creativity and bring your sphere to life. Planning and Innovation are essential for any business that is just starting out. This collection contains the designs that you need for your everyday presentations. All of our PowerPoints are 100 percent editable, so you can customize them to suit your needs. This multi-purpose template can be used in various situations. Grab these presentation templates today This slide shows the dashboard to keep a regular track of the performance of industrial robots. The purpose of this slide is to provide a graphical representation of robots performance to enhance the accuracy and effectiveness of these machines.
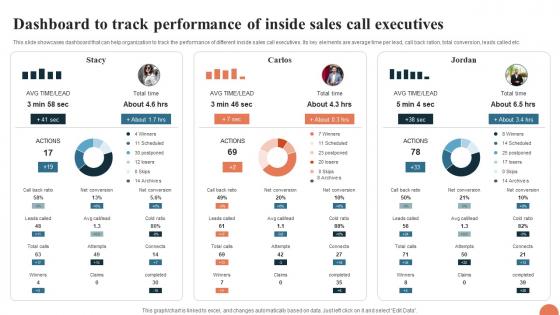
Telesales Strategy For Targeting Large Dashboard To Track Performance Of Inside Sales Strategy SS V
This slide showcases dashboard that can help organization to track the performance of different inside sales call executives. Its key elements are average time per lead, call back ration, total conversion, leads called etc. Retrieve professionally designed Telesales Strategy For Targeting Large Dashboard To Track Performance Of Inside Sales Strategy SS V to effectively convey your message and captivate your listeners. Save time by selecting pre-made slideshows that are appropriate for various topics, from business to educational purposes. These themes come in many different styles, from creative to corporate, and all of them are easily adjustable and can be edited quickly. Access them as PowerPoint templates or as Google Slides themes. You do not have to go on a hunt for the perfect presentation because Slidegeeks got you covered from everywhere. This slide showcases dashboard that can help organization to track the performance of different inside sales call executives. Its key elements are average time per lead, call back ration, total conversion, leads called etc.
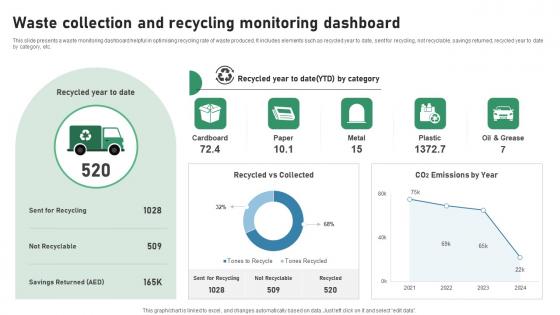
Waste Collection And Recycling Monitoring Dashboard IOT Applications In Smart Waste IoT SS V
This slide presents a waste monitoring dashboard helpful in optimising recycling rate of waste produced. It includes elements such as recycled year to date, sent for recycling, not recyclable, savings returned, recycled year to date by category, etc. Slidegeeks is here to make your presentations a breeze with Waste Collection And Recycling Monitoring Dashboard IOT Applications In Smart Waste IoT SS V With our easy-to-use and customizable templates, you can focus on delivering your ideas rather than worrying about formatting. With a variety of designs to choose from, you are sure to find one that suits your needs. And with animations and unique photos, illustrations, and fonts, you can make your presentation pop. So whether you are giving a sales pitch or presenting to the board, make sure to check out Slidegeeks first This slide presents a waste monitoring dashboard helpful in optimising recycling rate of waste produced. It includes elements such as recycled year to date, sent for recycling, not recyclable, savings returned, recycled year to date by category, etc.
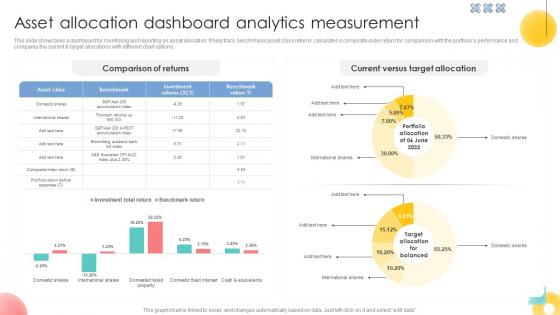
Asset Allocation Dashboard Analytics Measurement Strategic Investment Plan For Optimizing Risk SS V
This slide showcases a dashboard for monitoring and reporting on asset allocation. It help track benchmarks asset class returns, calculates a composite index return for comparison with the portfolios performance and compares the current and target allocations with different chart options.Slidegeeks is one of the best resources for PowerPoint templates. You can download easily and regulate Asset Allocation Dashboard Analytics Measurement Strategic Investment Plan For Optimizing Risk SS V for your personal presentations from our wonderful collection. A few clicks is all it takes to discover and get the most relevant and appropriate templates. Use our Templates to add a unique zing and appeal to your presentation and meetings. All the slides are easy to edit and you can use them even for advertisement purposes. This slide showcases a dashboard for monitoring and reporting on asset allocation. It help track benchmarks asset class returns, calculates a composite index return for comparison with the portfolios performance and compares the current and target allocations with different chart options.
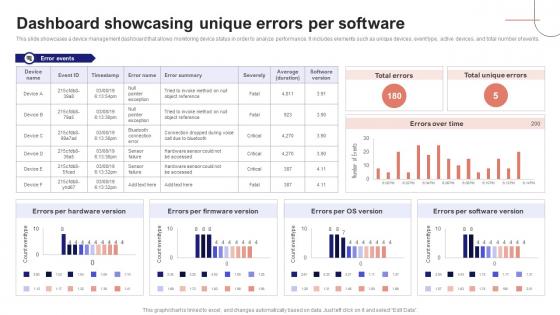
IoT Device Management Fundamentals Dashboard Showcasing Unique Errors Per Software IoT Ss V
This slide showcases a device management dashboard that allows monitoring device status in order to analyze performance. It includes elements such as unique devices, event type, active devices, and total number of events. Are you in need of a template that can accommodate all of your creative concepts This one is crafted professionally and can be altered to fit any style. Use it with Google Slides or PowerPoint. Include striking photographs, symbols, depictions, and other visuals. Fill, move around, or remove text boxes as desired. Test out color palettes and font mixtures. Edit and save your work, or work with colleagues. Download IoT Device Management Fundamentals Dashboard Showcasing Unique Errors Per Software IoT SS V and observe how to make your presentation outstanding. Give an impeccable presentation to your group and make your presentation unforgettable. This slide showcases a device management dashboard that allows monitoring device status in order to analyze performance. It includes elements such as unique devices, event type, active devices, and total number of events.
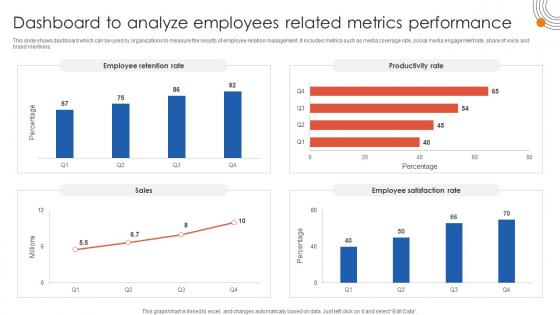
Human Resource Industrial Relationship Dashboard To Analyze Employees Related Metrics Performance
This slide shows dashboard which can be used by organizations to measure the results of employee relation management. It includes metrics such as media coverage rate, social media engagement rate, share of voice and brand mentions. Slidegeeks is here to make your presentations a breeze with Human Resource Industrial Relationship Dashboard To Analyze Employees Related Metrics Performance With our easy-to-use and customizable templates, you can focus on delivering your ideas rather than worrying about formatting. With a variety of designs to choose from, you are sure to find one that suits your needs. And with animations and unique photos, illustrations, and fonts, you can make your presentation pop. So whether you are giving a sales pitch or presenting to the board, make sure to check out Slidegeeks first This slide shows dashboard which can be used by organizations to measure the results of employee relation management. It includes metrics such as media coverage rate, social media engagement rate, share of voice and brand mentions.
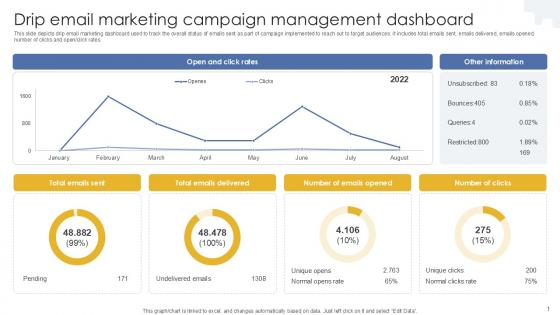
Drip Email Marketing Campaign Management Dashboard PPT Presentation MKT SS V
This slide depicts drip email marketing dashboard used to track the overall status of emails sent as part of campaign implemented to reach out to target audiences. It includes total emails sent, emails delivered, emails opened, number of clicks and open click rates. Present like a pro with Drip Email Marketing Campaign Management Dashboard PPT Presentation MKT SS V. Create beautiful presentations together with your team, using our easy-to-use presentation slides. Share your ideas in real-time and make changes on the fly by downloading our templates. So whether you are in the office, on the go, or in a remote location, you can stay in sync with your team and present your ideas with confidence. With Slidegeeks presentation got a whole lot easier. Grab these presentations today. This slide depicts drip email marketing dashboard used to track the overall status of emails sent as part of campaign implemented to reach out to target audiences. It includes total emails sent, emails delivered, emails opened, number of clicks and open click rates.
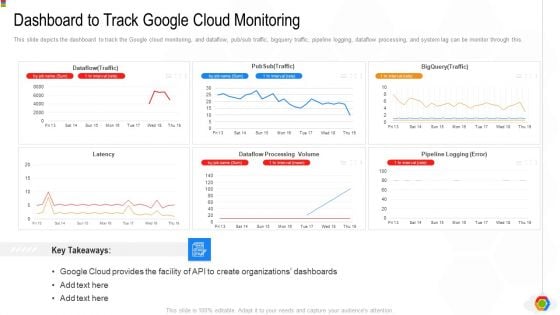
Google Cloud Console IT Dashboard To Track Google Cloud Monitoring Ppt Infographic Template Guide PDF
This slide depicts the dashboard to track the Google cloud monitoring, and dataflow, pub or sub traffic, bigquery traffic, pipeline logging, dataflow processing, and system lag can be monitor through this. Deliver an awe inspiring pitch with this creative google cloud console it dashboard to track google cloud monitoring ppt infographic template guide pdf bundle. Topics like dataflow processing volume, pipeline logging, organizations dashboards, latency can be discussed with this completely editable template. It is available for immediate download depending on the needs and requirements of the user.
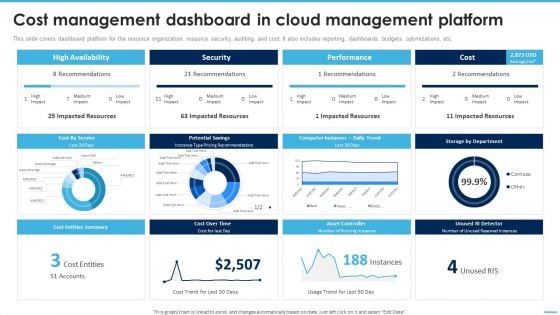
Cost Management Dashboard In Cloud Managing Complexity Of Multiple Cloud Platforms Portrait PDF
This slide covers dashboard platform for the resource organization, resource security, auditing, and cost. It also includes reporting, dashboards, budgets, optimizations, etc. Take your projects to the next level with our ultimate collection of Cost Management Dashboard In Cloud Managing Complexity Of Multiple Cloud Platforms Portrait PDF. Slidegeeks has designed a range of layouts that are perfect for representing task or activity duration, keeping track of all your deadlines at a glance. Tailor these designs to your exact needs and give them a truly corporate look with your own brand colors they all make your projects stand out from the rest.
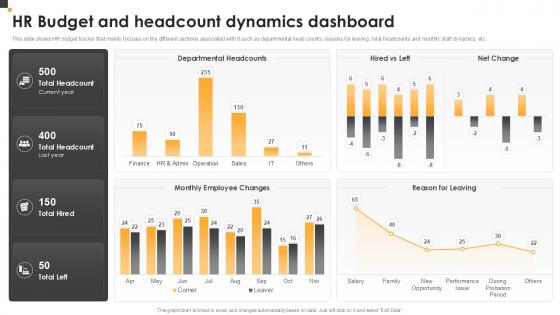
HR Budget And Headcount Dynamics Dashboard HR Budget Planning Ppt Slide
There are so many reasons you need a HR Budget And Headcount Dynamics Dashboard HR Budget Planning Ppt Slide. The first reason is you can not spend time making everything from scratch, Thus, Slidegeeks has made presentation templates for you too. You can easily download these templates from our website easily. This HR Budget Tracker slide provides a comprehensive overview of various key HR metrics, including departmental headcounts, reasons for employee departures, total staff count, and monthly staff dynamics. It is designed to help HR professionals efficiently monitor and manage personnel-related costs, providing valuable insights into workforce changes and trends.
Business Data Report Dashboard Vector Icon Ppt PowerPoint Presentation File Maker PDF
Presenting business data report dashboard vector icon ppt powerpoint presentation file maker pdf to dispense important information. This template comprises three stages. It also presents valuable insights into the topics including business data report dashboard vector icon. This is a completely customizable PowerPoint theme that can be put to use immediately. So, download it and address the topic impactfully.
Business Analytics Dashboard Vector Icon Ppt PowerPoint Presentation File Templates PDF
Presenting this set of slides with name business analytics dashboard vector icon ppt powerpoint presentation file templates pdf. This is a one stage process. The stages in this process is business analytics dashboard vector icon. This is a completely editable PowerPoint presentation and is available for immediate download. Download now and impress your audience.
Project Management Dashboard Vector Icon Ppt PowerPoint Presentation Slides Files PDF
Presenting this set of slides with name project management dashboard vector icon ppt powerpoint presentation slides files pdf. This is a one stage process. The stage in this process is project management dashboard vector icon. This is a completely editable PowerPoint presentation and is available for immediate download. Download now and impress your audience.
Statistical Analysis Of Meta Data Dashboard Vector Icon Ppt PowerPoint Presentation Shapes PDF
Presenting statistical analysis of meta data dashboard vector icon ppt powerpoint presentation shapes pdf to dispense important information. This template comprises three stages. It also presents valuable insights into the topics including statistical analysis of meta data dashboard vector icon. This is a completely customizable PowerPoint theme that can be put to use immediately. So, download it and address the topic impactfully.
Company Payout Dashboard Icon For Data Analysis Ppt Professional Design Inspiration PDF
Presenting Company Payout Dashboard Icon For Data Analysis Ppt Professional Design Inspiration PDF to dispense important information. This template comprises three stages. It also presents valuable insights into the topics including Company Payout, Dashboard Icon, Data Analysis. This is a completely customizable PowerPoint theme that can be put to use immediately. So, download it and address the topic impactfully.
Data Analysis Dashboard Vector Icon Ppt PowerPoint Presentation Gallery Slides PDF
Presenting this set of slides with name data analysis dashboard vector icon ppt powerpoint presentation gallery slides pdf. This is a three stage process. The stages in this process are data analysis dashboard vector icon. This is a completely editable PowerPoint presentation and is available for immediate download. Download now and impress your audience.

Call Center Quality Key Performance Assurance Indicator Metrics Dashboard Portrait PDF
Showcasing this set of slides titled Call Center Quality Key Performance Assurance Indicator Metrics Dashboard Portrait PDF. The topics addressed in these templates are Key Performance, Assurance Indicator, Metrics Dashboard. All the content presented in this PPT design is completely editable. Download it and make adjustments in color, background, font etc. as per your unique business setting.
Utilizing Infrastructure Management Using Latest Methods KPI Metrics And Dashboard Topics PDF
This is a utilizing infrastructure management using latest methods kpi metrics and dashboard topics pdf template with various stages. Focus and dispense information on two stages using this creative set, that comes with editable features. It contains large content boxes to add your information on topics like kpi metrics, kpi dashboards. You can also showcase facts, figures, and other relevant content using this PPT layout. Grab it now.
Civil Infrastructure Designing Services Management Kpi Metrics And Dashboard Topics PDF
This is a civil infrastructure designing services management kpi metrics and dashboard topics pdf template with various stages. Focus and dispense information on two stages using this creative set, that comes with editable features. It contains large content boxes to add your information on topics like kpi metrics, kpi dashboards. You can also showcase facts, figures, and other relevant content using this PPT layout. Grab it now.
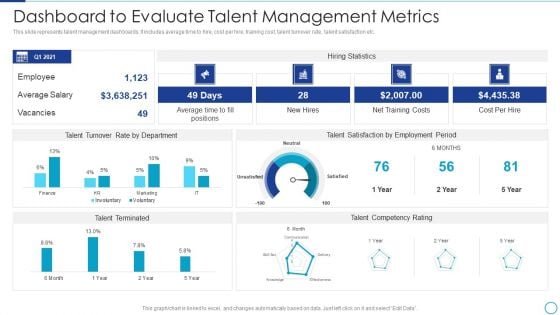
Workforce Management Strategies For Effective Hiring Process Dashboard To Evaluate Talent Ideas PDF
This slide represents talent management dashboards. It includes average time to hire, cost per hire, training cost, talent turnover rate, talent satisfaction etc. Deliver an awe inspiring pitch with this creative Workforce Management Strategies For Effective Hiring Process Dashboard To Evaluate Talent Ideas PDF bundle. Topics like Talent Competency, Talent Terminated, Talent Satisfaction can be discussed with this completely editable template. It is available for immediate download depending on the needs and requirements of the user.
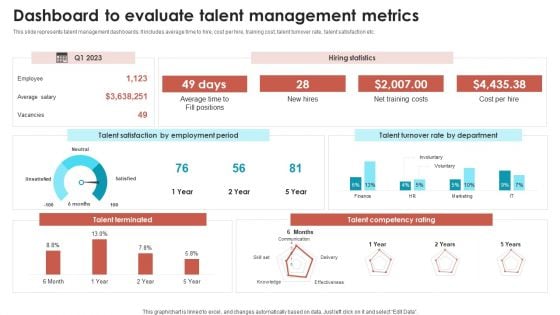
Talent Management Optimization With Workforce Staffing Dashboard To Evaluate Talent Management Metrics Summary PDF
This slide represents talent management dashboards. It includes average time to hire, cost per hire, training cost, talent turnover rate, talent satisfaction etc. There are so many reasons you need a Talent Management Optimization With Workforce Staffing Dashboard To Evaluate Talent Management Metrics Summary PDF. The first reason is you can not spend time making everything from scratch, Thus, Slidegeeks has made presentation templates for you too. You can easily download these templates from our website easily.
Performance Tracking KPI Dashboard Digital Approaches To Increase Business Growth Summary Pdf
Mentioned slide provides information about the key performance indicators that can be used by managers to measure the success of digital marketing strategy, KPIs covered are status, progress, priority and timeline. Formulating a presentation can take up a lot of effort and time, so the content and message should always be the primary focus. The visuals of the PowerPoint can enhance the presenters message, so our Performance Tracking KPI Dashboard Digital Approaches To Increase Business Growth Summary Pdf was created to help save time. Instead of worrying about the design, the presenter can concentrate on the message while our designers work on creating the ideal templates for whatever situation is needed. Slidegeeks has experts for everything from amazing designs to valuable content, we have put everything into Performance Tracking KPI Dashboard Digital Approaches To Increase Business Growth Summary Pdf Mentioned slide provides information about the key performance indicators that can be used by managers to measure the success of digital marketing strategy, KPIs covered are status, progress, priority and timeline.
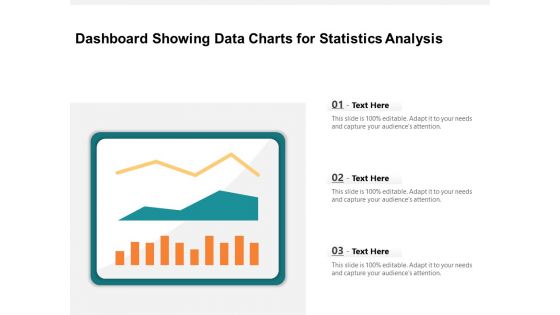
Dashboard Showing Data Charts For Statistics Analysis Ppt PowerPoint Presentation Infographic Template Grid PDF
Pitch your topic with ease and precision using this dashboard showing data charts for statistics analysis ppt powerpoint presentation infographic template grid pdf. This layout presents information on dashboard showing data charts for statistics analysis. It is also available for immediate download and adjustment. So, changes can be made in the color, design, graphics or any other component to create a unique layout.
Icon Of Open Transformation KPI Dashboard With Key Performance Indicators Microsoft PDF
Presenting Icon Of Open Transformation KPI Dashboard With Key Performance Indicators Microsoft PDF to dispense important information. This template comprises four stages. It also presents valuable insights into the topics including Icon Of Open Transformation, KPI Dashboard, Key Performance Indicators. This is a completely customizable PowerPoint theme that can be put to use immediately. So, download it and address the topic impactfully.
Employee Health And Risk Key Performance Indicator Dashboard Icon Ppt Professional Diagrams PDF
Presenting Employee Health And Risk Key Performance Indicator Dashboard Icon Ppt Professional Diagrams PDF to dispense important information. This template comprises four stages. It also presents valuable insights into the topics including Employee, Health And Risk, Key Performance, Indicator Dashboard, Icon. This is a completely customizable PowerPoint theme that can be put to use immediately. So, download it and address the topic impactfully.

Security KPI Dashboard With Various Key Performance Indicators Ppt Portfolio Objects PDF
Showcasing this set of slides titled Security KPI Dashboard With Various Key Performance Indicators Ppt Portfolio Objects PDF. The topics addressed in these templates are Security Kpi Dashboard, Performance Indicators, Analyst Assigned. All the content presented in this PPT design is completely editable. Download it and make adjustments in color, background, font etc. as per your unique business setting.
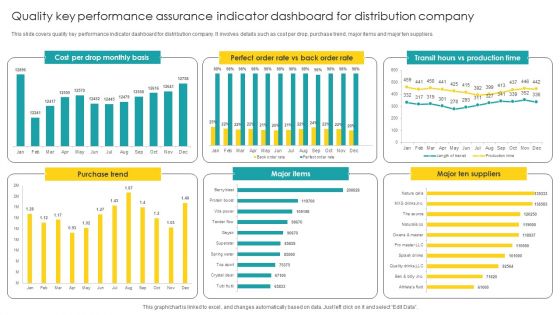
Quality Key Performance Assurance Indicator Dashboard For Distribution Company Mockup PDF
Showcasing this set of slides titled Quality Key Performance Assurance Indicator Dashboard For Distribution Company Mockup PDF. The topics addressed in these templates are Performance Assurance, Indicator Dashboard, Distribution Company. All the content presented in this PPT design is completely editable. Download it and make adjustments in color, background, font etc. as per your unique business setting.
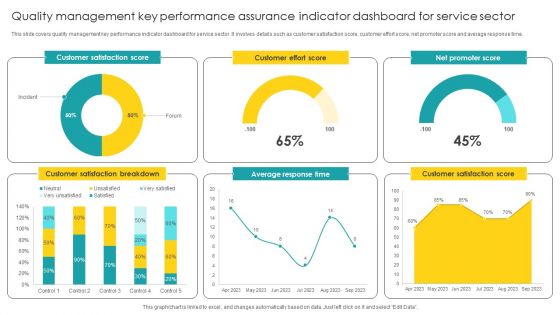
Quality Management Key Performance Assurance Indicator Dashboard For Service Sector Designs PDF
Showcasing this set of slides titled Quality Management Key Performance Assurance Indicator Dashboard For Service Sector Designs PDF. The topics addressed in these templates are Assurance Indicator, Dashboard For Service Sector. All the content presented in this PPT design is completely editable. Download it and make adjustments in color, background, font etc. as per your unique business setting.
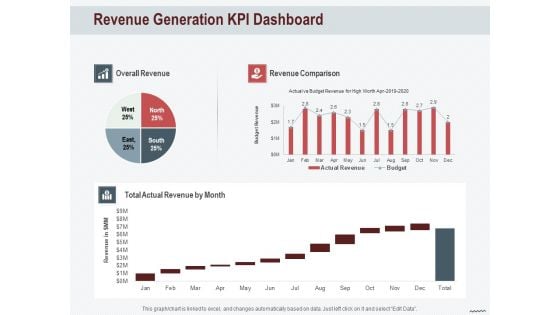
Cross Sell In Banking Industry Revenue Generation KPI Dashboard Ppt Infographic Template Portfolio PDF
Deliver and pitch your topic in the best possible manner with this cross sell in banking industry revenue generation kpi dashboard ppt infographic template portfolio pdf. Use them to share invaluable insights on revenue generation kpi dashboard and impress your audience. This template can be altered and modified as per your expectations. So, grab it now.
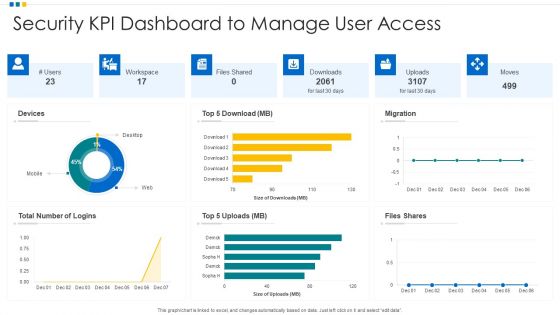
Security KPI Dashboard To Manage User Access Ppt Infographic Template Graphics Pictures PDF
Pitch your topic with ease and precision using this Security KPI Dashboard To Manage User Access Ppt Infographic Template Graphics Pictures PDF. This layout presents information on Devices, Security KPI Dashboard, Workspace. It is also available for immediate download and adjustment. So, changes can be made in the color, design, graphics or any other component to create a unique layout.
Dashboard Showing Stock Market Trends Vector Icon Ppt PowerPoint Presentation File Icons PDF
Presenting dashboard showing stock market trends vector icon ppt powerpoint presentation file icons pdf to dispense important information. This template comprises three stages. It also presents valuable insights into the topics including dashboard showing stock market trends vector icon. This is a completely customizable PowerPoint theme that can be put to use immediately. So, download it and address the topic impactfully.
Actual Vs Target Data Driven Dashboard Ppt PowerPoint Presentation Icon Files PDF
Presenting this set of slides with name actual vs target data driven dashboard ppt powerpoint presentation icon files pdf. The topics discussed in these slide is actual vs target data driven dashboard. This is a completely editable PowerPoint presentation and is available for immediate download. Download now and impress your audience.
Business Data Consumption Dashboard Vector Icon Ppt PowerPoint Presentation File Good PDF
Presenting business data consumption dashboard vector icon ppt powerpoint presentation file good pdf to dispense important information. This template comprises three stages. It also presents valuable insights into the topics including business data consumption dashboard vector icon. This is a completely customizable PowerPoint theme that can be put to use immediately. So, download it and address the topic impactfully.
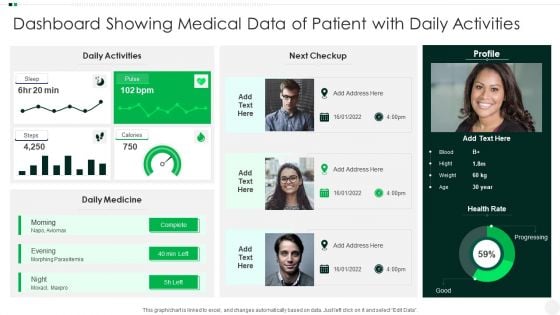
Dashboard Showing Medical Data Of Patient With Daily Activities Brochure PDF
Showcasing this set of slides titled Dashboard Showing Medical Data Of Patient With Daily Activities Brochure PDF. The topics addressed in these templates are Dashboard Showing Medical Data Of Patient With Daily Activities. All the content presented in this PPT design is completely editable. Download it and make adjustments in color, background, font etc. as per your unique business setting.
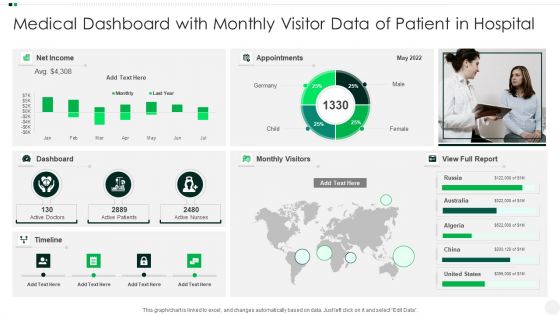
Medical Dashboard With Monthly Visitor Data Of Patient In Hospital Topics PDF
Pitch your topic with ease and precision using this Medical Dashboard With Monthly Visitor Data Of Patient In Hospital Topics PDF. This layout presents information on Medical Dashboard With Monthly Visitor Data Of Patient In Hospital. It is also available for immediate download and adjustment. So, changes can be made in the color, design, graphics or any other component to create a unique layout.
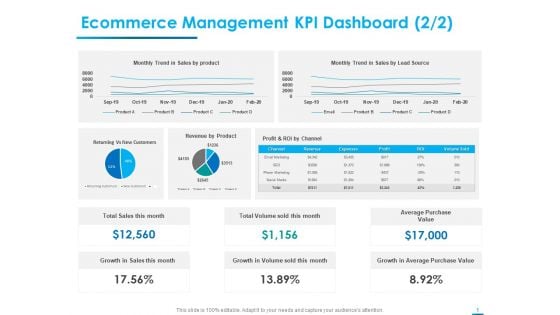
Internet Economy Ecommerce Management KPI Dashboard Trend Ppt Slides Example Topics PDF
Deliver an awe inspiring pitch with this creative internet economy ecommerce management kpi dashboard trend ppt slides example topics pdf bundle. Topics like sales, ecommerce management kpi dashboard can be discussed with this completely editable template. It is available for immediate download depending on the needs and requirements of the user.
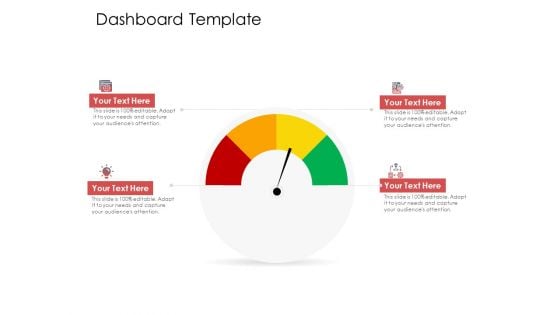
AIM Principles For Data Storage Dashboard Template Ppt Portfolio Topics PDF
Deliver an awe inspiring pitch with this creative aim principles for data storage dashboard template ppt portfolio topics pdf bundle. Topics like dashboard template can be discussed with this completely editable template. It is available for immediate download depending on the needs and requirements of the user.
KPIs Metrics In Dashboard Vector Icon Ppt PowerPoint Presentation Portfolio Graphics Download PDF
Presenting kpis metrics in dashboard vector icon ppt powerpoint presentation portfolio graphics download pdf to dispense important information. This template comprises three stages. It also presents valuable insights into the topics including kpis metrics in dashboard vector icon. This is a completely customizable PowerPoint theme that can be put to use immediately. So, download it and address the topic impactfully.
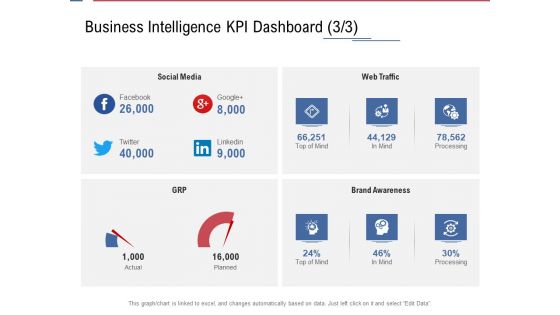
Data Assimilation Business Intelligence KPI Dashboard Media Ppt Layouts Show PDF
Deliver an awe inspiring pitch with this creative data assimilation business intelligence kpi dashboard media ppt layouts show pdf bundle. Topics like business intelligence kpi dashboard can be discussed with this completely editable template. It is available for immediate download depending on the needs and requirements of the user.
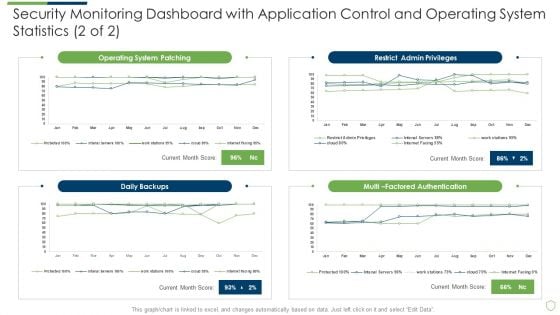
Modern Security Observation Plan To Eradicate Cybersecurity Risk And Data Breach Security Monitoring Dashboard Sample PDF
Deliver an awe inspiring pitch with this creative modern security observation plan to eradicate cybersecurity risk and data breach security monitoring dashboard sample pdf bundle. Topics like security monitoring dashboard with application control and operating system statistics can be discussed with this completely editable template. It is available for immediate download depending on the needs and requirements of the user.
HR Recruitment Dashboard Kpis Icon With Graphs Ppt Slides Slideshow PDF
Presenting HR Recruitment Dashboard Kpis Icon With Graphs Ppt Slides Slideshow PDF to dispense important information. This template comprises three stages. It also presents valuable insights into the topics including HR Recruitment, Dashboard Kpis Icon, Graphs. This is a completely customizable PowerPoint theme that can be put to use immediately. So, download it and address the topic impactfully.
HR Recruitment Dashboard Kpis Icon With Magnifying Glass Ppt Slides Mockup PDF
Presenting HR Recruitment Dashboard Kpis Icon With Magnifying Glass Ppt Slides Mockup PDF to dispense important information. This template comprises three stages. It also presents valuable insights into the topics including HR Recruitment, Dashboard Kpis Icon, Magnifying Glass. This is a completely customizable PowerPoint theme that can be put to use immediately. So, download it and address the topic impactfully.
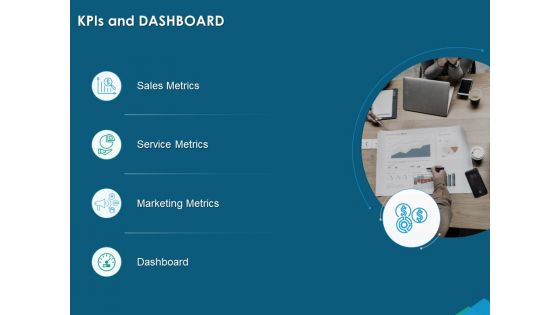
Guide For Managers To Effectively Handle Products KPIs And Dashboard Ppt Slides PDF
Presenting this set of slides with name guide for managers to effectively handle products kpis and dashboard ppt slides pdf. This is a four stage process. The stages in this process are sales metrics, service metrics, marketing metrics, dashboard. This is a completely editable PowerPoint presentation and is available for immediate download. Download now and impress your audience.
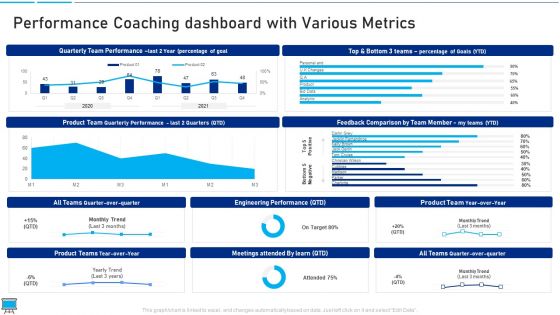
Performance Training Action Plan And Extensive Strategies Performance Coaching Dashboard With Various Metrics Infographics PDF
Deliver an awe inspiring pitch with this creative performance training action plan and extensive strategies performance coaching dashboard with various metrics infographics pdf bundle. Topics like performance coaching dashboard with various metrics can be discussed with this completely editable template. It is available for immediate download depending on the needs and requirements of the user.


 Continue with Email

 Home
Home


