Dashboards
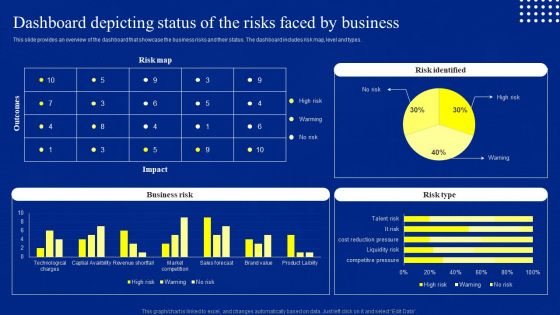
Risk Control And Surveillance Dashboard Depicting Status Of The Risks Faced By Business Elements PDF
This slide provides an overview of the dashboard that showcase the business risks and their status. The dashboard includes risk map, level and types. The best PPT templates are a great way to save time, energy, and resources. Slidegeeks have 100 percent editable powerpoint slides making them incredibly versatile. With these quality presentation templates, you can create a captivating and memorable presentation by combining visually appealing slides and effectively communicating your message. Download Risk Control And Surveillance Dashboard Depicting Status Of The Risks Faced By Business Elements PDF from Slidegeeks and deliver a wonderful presentation.
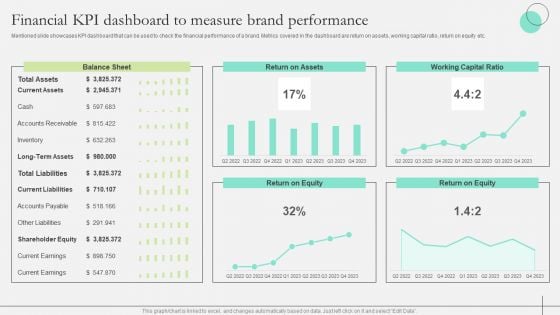
Comprehensive Guide To Strengthen Brand Equity Financial KPI Dashboard Measure Brand Structure PDF
Mentioned slide showcases KPI dashboard that can be used to check the financial performance of a brand. Metrics covered in the dashboard are return on assets, working capital ratio, return on equity etc. Take your projects to the next level with our ultimate collection of Comprehensive Guide To Strengthen Brand Equity Financial KPI Dashboard Measure Brand Structure PDF. Slidegeeks has designed a range of layouts that are perfect for representing task or activity duration, keeping track of all your deadlines at a glance. Tailor these designs to your exact needs and give them a truly corporate look with your own brand colors they will make your projects stand out from the rest
Umbrella Branding Measures To Boost Brand Awareness Activity Tracking Dashboard Umbrella Brand Mockup PDF
This slide provides information regarding activities tracking dashboard for umbrella brand in terms of customer retention, market share, etc. Create an editable Umbrella Branding Measures To Boost Brand Awareness Activity Tracking Dashboard Umbrella Brand Mockup PDF that communicates your idea and engages your audience. Whether you are presenting a business or an educational presentation, pre designed presentation templates help save time. Umbrella Branding Measures To Boost Brand Awareness Activity Tracking Dashboard Umbrella Brand Mockup PDF is highly customizable and very easy to edit, covering many different styles from creative to business presentations. Slidegeeks has creative team members who have crafted amazing templates. So, go and get them without any delay.
Maximizing Brand Growth With Umbrella Branding Activities Activity Tracking Dashboard For Umbrella Brand Icons PDF
This slide provides information regarding activities tracking dashboard for umbrella brand in terms of customer retention, market share, etc. Create an editable Maximizing Brand Growth With Umbrella Branding Activities Activity Tracking Dashboard For Umbrella Brand Icons PDF that communicates your idea and engages your audience. Whether youre presenting a business or an educational presentation, pre designed presentation templates help save time. Maximizing Brand Growth With Umbrella Branding Activities Activity Tracking Dashboard For Umbrella Brand Icons PDF is highly customizable and very easy to edit, covering many different styles from creative to business presentations. Slidegeeks has creative team members who have crafted amazing templates. So, go and get them without any delay.
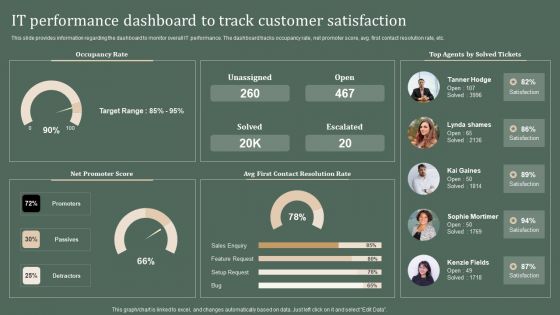
Deploying Corporate Aligned IT Strategy IT Performance Dashboard To Track Customer Satisfaction Clipart PDF
This slide provides information regarding the dashboard to monitor overall IT performance. The dashboard tracks occupancy rate, net promoter score, avg. first contact resolution rate, etc. Boost your pitch with our creative Deploying Corporate Aligned IT Strategy IT Performance Dashboard To Track Customer Satisfaction Clipart PDF. Deliver an awe inspiring pitch that will mesmerize everyone. Using these presentation templates you will surely catch everyones attention. You can browse the ppts collection on our website. We have researchers who are experts at creating the right content for the templates. So you do not have to invest time in any additional work. Just grab the template now and use them.
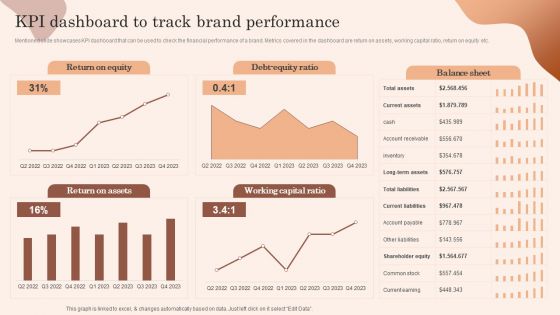
Building Market Brand Leadership Strategies Kpi Dashboard To Track Brand Performance Designs PDF
Mentioned slide showcases KPI dashboard that can be used to check the financial performance of a brand. Metrics covered in the dashboard are return on assets, working capital ratio, return on equity etc. There are so many reasons you need a Building Market Brand Leadership Strategies Kpi Dashboard To Track Brand Performance Designs PDF. The first reason is you cannot spend time making everything from scratch, Thus, Slidegeeks has made presentation templates for you too. You can easily download these templates from our website easily.
Optimizing Consumer Lead Nurturing Procedure Lead Generation Dashboard For Tracking Introduction PDF
This slide covers the KPI dashboard for tracking lead conversion rates. It includes metrics such as visitors, average session rate, per visit, bounce rate, page views, etc. Create an editable Optimizing Consumer Lead Nurturing Procedure Lead Generation Dashboard For Tracking Introduction PDF that communicates your idea and engages your audience. Whether youre presenting a business or an educational presentation, pre designed presentation templates help save time. Optimizing Consumer Lead Nurturing Procedure Lead Generation Dashboard For Tracking Introduction PDF is highly customizable and very easy to edit, covering many different styles from creative to business presentations. Slidegeeks has creative team members who have crafted amazing templates. So, go and get them without any delay.
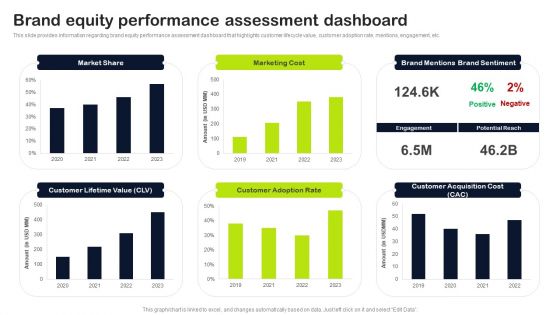
Key Elements Of Strategic Brand Administration Brand Equity Performance Assessment Dashboard Elements PDF
This slide provides information regarding brand equity performance assessment dashboard that highlights customer lifecycle value, customer adoption rate, mentions, engagement, etc. Get a simple yet stunning designed Key Elements Of Strategic Brand Administration Brand Equity Performance Assessment Dashboard Elements PDF. It is the best one to establish the tone in your meetings. It is an excellent way to make your presentations highly effective. So, download this PPT today from Slidegeeks and see the positive impacts. Our easy-to-edit Key Elements Of Strategic Brand Administration Brand Equity Performance Assessment Dashboard Elements PDF can be your go-to option for all upcoming conferences and meetings. So, what are you waiting for Grab this template today.
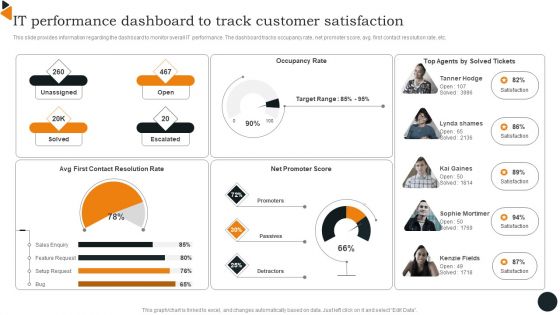
Chief Information Officers Guide On Technology Plan IT Performance Dashboard To Track Summary PDF
This slide provides information regarding the dashboard to monitor overall IT performance. The dashboard tracks occupancy rate, net promoter score, avg. first contact resolution rate, etc. Find a pre designed and impeccable Chief Information Officers Guide On Technology Plan IT Performance Dashboard To Track Summary PDF. The templates can ace your presentation without additional effort. You can download these easy to edit presentation templates to make your presentation stand out from others. So, what are you waiting for Download the template from Slidegeeks today and give a unique touch to your presentation.
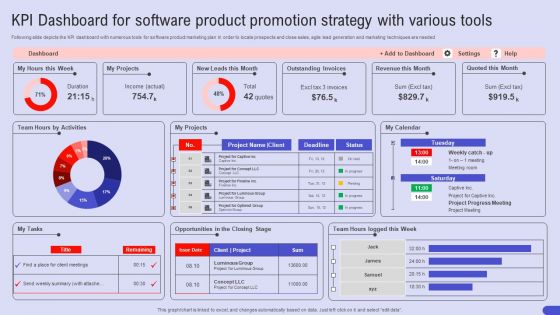
KPI Dashboard For Software Product Promotion Strategy With Various Tools Portrait PDF
Following slide depicts the KPI dashboard with numerous tools for software product marketing plan In order to locate prospects and close sales, agile lead generation and marketing techniques are needed. Pitch your topic with ease and precision using this KPI Dashboard For Software Product Promotion Strategy With Various Tools Portrait PDF. This layout presents information on KPI Dashboard, Software Product Promotion, Strategy With Various Tools. It is also available for immediate download and adjustment. So, changes can be made in the color, design, graphics or any other component to create a unique layout.
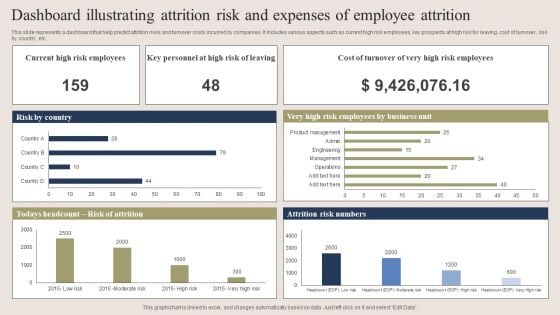
Dashboard Illustrating Attrition Risk And Expenses Of Employee Attrition Clipart PDF
This slide represents a dashboard that help predict attrition risks and turnover costs incurred by companies. It includes various aspects such as current high risk employees, key prospects at high risk for leaving, cost of turnover, risk by country, etc. Pitch your topic with ease and precision using this Dashboard Illustrating Attrition Risk And Expenses Of Employee Attrition Clipart PDF. This layout presents information on Dashboard Illustrating Attrition Risk, Expenses Of Employee Attrition . It is also available for immediate download and adjustment. So, changes can be made in the color, design, graphics or any other component to create a unique layout.
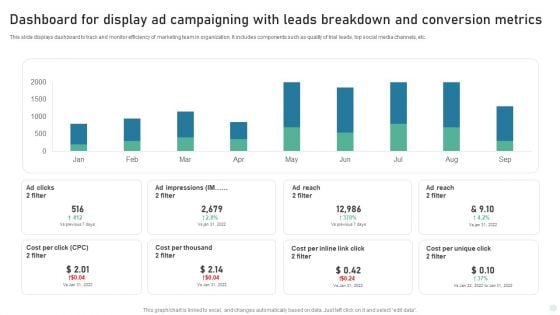
Dashboard For Display Ad Campaigning With Leads Breakdown And Conversion Metrics Inspiration PDF
This slide displays dashboard to track and monitor efficiency of marketing team in organization. It includes components such as quality of trial leads, top social media channels, etc. Showcasing this set of slides titled Dashboard For Display Ad Campaigning With Leads Breakdown And Conversion Metrics Inspiration PDF. The topics addressed in these templates are Dashboard Display, Ad Campaigning, Conversion Metrics. All the content presented in this PPT design is completely editable. Download it and make adjustments in color, background, font etc. as per your unique business setting.
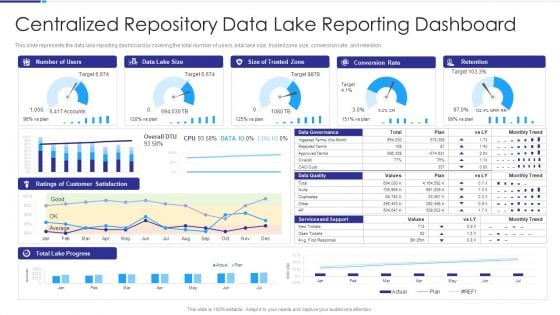
Data Lake Architecture Centralized Repository Data Lake Reporting Dashboard Introduction PDF
This slide represents the data lake reporting dashboard by covering the total number of users, total lake size, trusted zone size, conversion rate, and retention. Deliver an awe inspiring pitch with this creative Data Lake Architecture Centralized Repository Data Lake Reporting Dashboard Introduction PDF bundle. Topics like Data Lake Size, Conversion Rate, Retention, Ratings Customer Satisfaction can be discussed with this completely editable template. It is available for immediate download depending on the needs and requirements of the user.
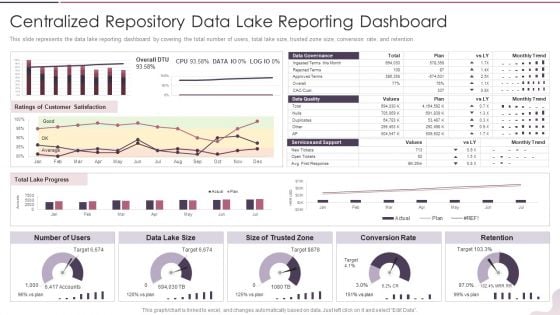
Data Lake Development With Azure Cloud Software Centralized Repository Data Lake Reporting Dashboard Demonstration PDF
This slide represents the data lake reporting dashboard by covering the total number of users, total lake size, trusted zone size, conversion rate, and retention. Deliver an awe inspiring pitch with this creative Data Lake Development With Azure Cloud Software Centralized Repository Data Lake Reporting Dashboard Demonstration PDF bundle. Topics like Conversion Rate, Services And Support can be discussed with this completely editable template. It is available for immediate download depending on the needs and requirements of the user.
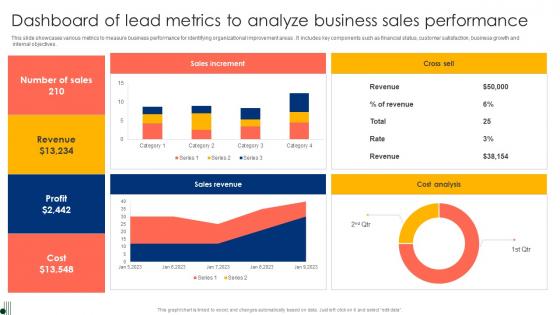
Dashboard Of Lead Metrics To Analyze Business Sales Performance Ppt Summary Graphics Pdf
This slide showcases various metrics to measure business performance for identifying organizational improvement areas. It includes key components such as financial status, customer satisfaction, business growth and internal objectives. Showcasing this set of slides titled Dashboard Of Lead Metrics To Analyze Business Sales Performance Ppt Summary Graphics Pdf. The topics addressed in these templates are Sales Increment, Cross Sell, Cost Analysis. All the content presented in this PPT design is completely editable. Download it and make adjustments in color, background, font etc. as per your unique business setting. This slide showcases various metrics to measure business performance for identifying organizational improvement areas. It includes key components such as financial status, customer satisfaction, business growth and internal objectives.
Vendor Performance KPI Analytical Dashboard Icon For Data Management Background PDF
Persuade your audience using this Vendor Performance KPI Analytical Dashboard Icon For Data Management Background PDF. This PPT design covers three stages, thus making it a great tool to use. It also caters to a variety of topics including Vendor Performance, KPI Analytical Dashboard, Icon Data Management. Download this PPT design now to present a convincing pitch that not only emphasizes the topic but also showcases your presentation skills.
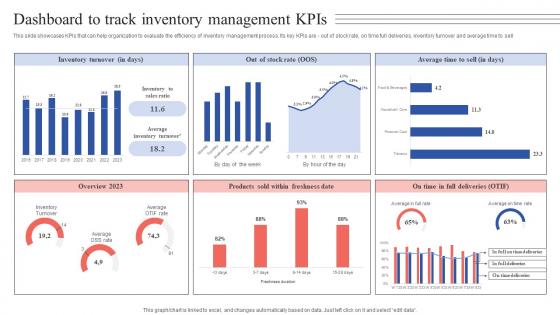
Dashboard To Track Inventory Management Kpis Tactical Guide Stock Administration Pictures Pdf
This slide showcases KPIs that can help organization to evaluate the efficiency of inventory management process. Its key KPIs are - out of stock rate, on time full deliveries, inventory turnover and average time to sell. Present like a pro with Dashboard To Track Inventory Management Kpis Tactical Guide Stock Administration Pictures Pdf Create beautiful presentations together with your team, using our easy-to-use presentation slides. Share your ideas in real-time and make changes on the fly by downloading our templates. So whether you are in the office, on the go, or in a remote location, you can stay in sync with your team and present your ideas with confidence. With Slidegeeks presentation got a whole lot easier. Grab these presentations today. This slide showcases KPIs that can help organization to evaluate the efficiency of inventory management process. Its key KPIs are - out of stock rate, on time full deliveries, inventory turnover and average time to sell.
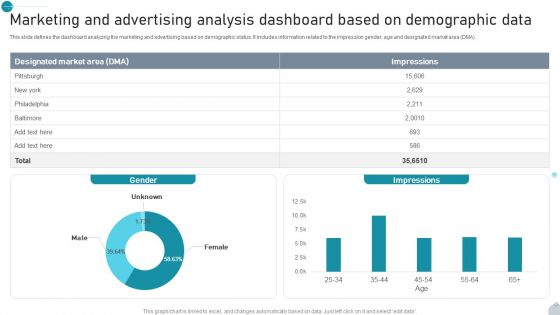
Marketing And Advertising Analysis Dashboard Based On Demographic Data Demonstration PDF
This slide defines the dashboard analyzing the marketing and advertising based on demographic status. It includes information related to the impression gender, age and designated market area DMA. Showcasing this set of slides titled Marketing And Advertising Analysis Dashboard Based On Demographic Data Demonstration PDF. The topics addressed in these templates are Gender, Impressions, Demographic Data All the content presented in this PPT design is completely editable. Download it and make adjustments in color, background, font etc. as per your unique business setting.
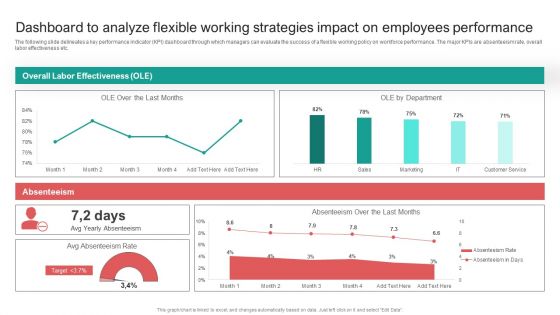
Dashboard To Analyze Flexible Working Strategies Impact On Employees Performance Infographics PDF
The following slide delineates a key performance indicator KPI dashboard through which managers can evaluate the success of a flexible working policy on workforce performance. The major KPIs are absenteeism rate, overall labor effectiveness etc. Presenting this PowerPoint presentation, titled Dashboard To Analyze Flexible Working Strategies Impact On Employees Performance Infographics PDF, with topics curated by our researchers after extensive research. This editable presentation is available for immediate download and provides attractive features when used. Download now and captivate your audience. Presenting this Dashboard To Analyze Flexible Working Strategies Impact On Employees Performance Infographics PDF. Our researchers have carefully researched and created these slides with all aspects taken into consideration. This is a completely customizable Dashboard To Analyze Flexible Working Strategies Impact On Employees Performance Infographics PDF that is available for immediate downloading. Download now and make an impact on your audience. Highlight the attractive features available with our PPTs.
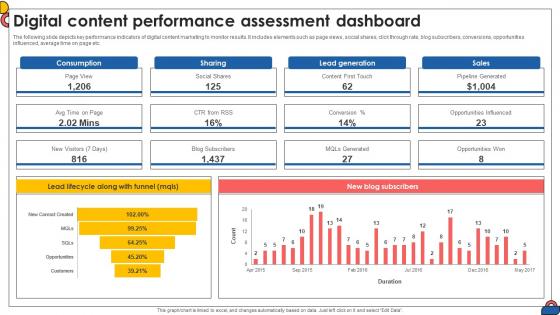
Digital Content Performance Assessment Dashboard Comprehensive Guide To Implement Strategy SS V
The following slide depicts key performance indicators of digital content marketing to monitor results. It includes elements such as page views, social shares, click through rate, blog subscribers, conversions, opportunities influenced, average time on page etc.If your project calls for a presentation, then Slidegeeks is your go-to partner because we have professionally designed, easy-to-edit templates that are perfect for any presentation. After downloading, you can easily edit Digital Content Performance Assessment Dashboard Comprehensive Guide To Implement Strategy SS V and make the changes accordingly. You can rearrange slides or fill them with different images. Check out all the handy templates The following slide depicts key performance indicators of digital content marketing to monitor results. It includes elements such as page views, social shares, click through rate, blog subscribers, conversions, opportunities influenced, average time on page etc.
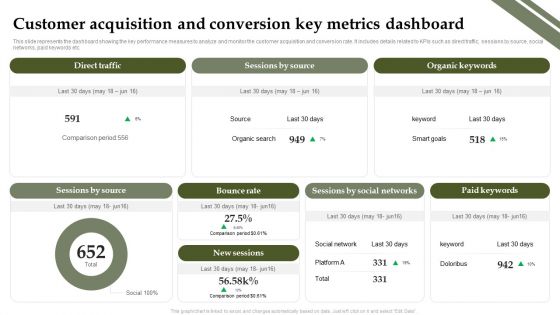
Analyzing And Deploying Effective CMS Customer Acquisition And Conversion Key Metrics Dashboard Infographics PDF
This slide represents the dashboard showing the key performance measures to analyze and monitor the customer acquisition and conversion rate. It includes details related to KPIs such as direct traffic, sessions by source, social networks, paid keywords etc. Presenting this PowerPoint presentation, titled Analyzing And Deploying Effective CMS Customer Acquisition And Conversion Key Metrics Dashboard Infographics PDF, with topics curated by our researchers after extensive research. This editable presentation is available for immediate download and provides attractive features when used. Download now and captivate your audience. Presenting this Analyzing And Deploying Effective CMS Customer Acquisition And Conversion Key Metrics Dashboard Infographics PDF. Our researchers have carefully researched and created these slides with all aspects taken into consideration. This is a completely customizable Analyzing And Deploying Effective CMS Customer Acquisition And Conversion Key Metrics Dashboard Infographics PDF that is available for immediate downloading. Download now and make an impact on your audience. Highlight the attractive features available with our PPTs.
Business Intelligence Dashboard Icon For Data Analysis And Visualization Information PDF
Persuade your audience using this Business Intelligence Dashboard Icon For Data Analysis And Visualization Information PDF. This PPT design covers three stages, thus making it a great tool to use. It also caters to a variety of topics including Business Intelligence Dashboard Icon, Data Analysis And Visualization. Download this PPT design now to present a convincing pitch that not only emphasizes the topic but also showcases your presentation skills.

Manufacturing Plant Sustainability Dashboard Indicating Sourcing And Consumption Ppt Slide SS
The following slide showcases business sustainability innovation model. It provides information about public policy, business case, financing, company level, stakeholders, etc. The Manufacturing Plant Sustainability Dashboard Indicating Sourcing And Consumption Ppt Slide SS is a compilation of the most recent design trends as a series of slides. It is suitable for any subject or industry presentation, containing attractive visuals and photo spots for businesses to clearly express their messages. This template contains a variety of slides for the user to input data, such as structures to contrast two elements, bullet points, and slides for written information. Slidegeeks is prepared to create an impression. The following slide showcases business sustainability innovation model. It provides information about public policy, business case, financing, company level, stakeholders, etc.
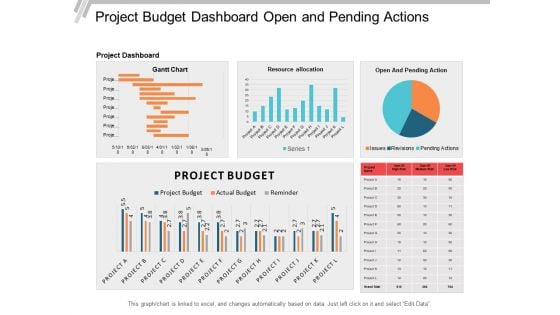
Project Budget Dashboard Open And Pending Actions Ppt PowerPoint Presentation File Templates
This is a project budget dashboard open and pending actions ppt powerpoint presentation file templates. This is a three stage process. The stages in this process are business analytics, ba, organizations data.
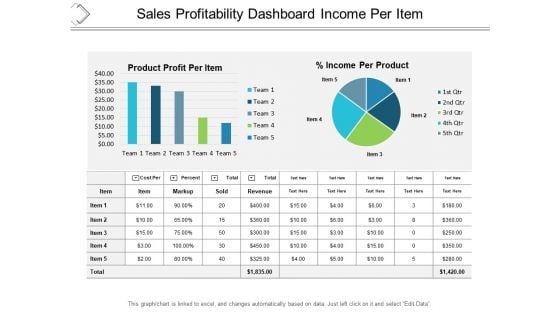
Sales Profitability Dashboard Income Per Item Ppt PowerPoint Presentation Professional Graphic Images
This is a sales profitability dashboard income per item ppt powerpoint presentation professional graphic images. This is a five stage process. The stages in this process are business analytics, ba, organizations data.
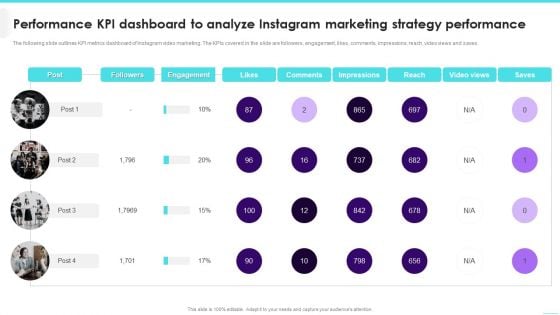
Performance KPI Dashboard To Analyze Instagram Marketing Strategy Performance Infographics PDF
The following slide outlines KPI metrics dashboard of Instagram video marketing. The KPIs covered in the slide are followers, engagement, likes, comments, impressions, reach, video views and saves.Deliver an awe inspiring pitch with this creative Performance KPI Dashboard To Analyze Instagram Marketing Strategy Performance Infographics PDF bundle. Topics like Engagement, Impressions, Comments can be discussed with this completely editable template. It is available for immediate download depending on the needs and requirements of the user.
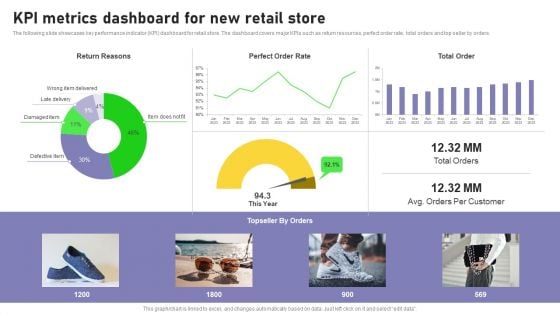
Retail Outlet Opening To Enhance Product Sale Kpi Metrics Dashboard For New Retail Store Mockup PDF
The following slide showcases key performance indicator KPI dashboard for retail store. The dashboard covers major KPIs such as return resources, perfect order rate, total orders and top seller by orders. Do you have to make sure that everyone on your team knows about any specific topic I yes, then you should give Retail Outlet Opening To Enhance Product Sale Kpi Metrics Dashboard For New Retail Store Mockup PDF a try. Our experts have put a lot of knowledge and effort into creating this impeccable Retail Outlet Opening To Enhance Product Sale Kpi Metrics Dashboard For New Retail Store Mockup PDF. You can use this template for your upcoming presentations, as the slides are perfect to represent even the tiniest detail. You can download these templates from the Slidegeeks website and these are easy to edit. So grab these today.

Analyzing And Implementing Effective CMS Customer Acquisition And Conversion Key Metrics Dashboard Professional PDF
This slide represents the dashboard showing the key performance measures to analyze and monitor the customer acquisition and conversion rate. It includes details related to KPIs such as direct traffic, sessions by source, social networks, paid keywords etc. Presenting this PowerPoint presentation, titled Analyzing And Implementing Effective CMS Customer Acquisition And Conversion Key Metrics Dashboard Professional PDF, with topics curated by our researchers after extensive research. This editable presentation is available for immediate download and provides attractive features when used. Download now and captivate your audience. Presenting this Analyzing And Implementing Effective CMS Customer Acquisition And Conversion Key Metrics Dashboard Professional PDF. Our researchers have carefully researched and created these slides with all aspects taken into consideration. This is a completely customizable Analyzing And Implementing Effective CMS Customer Acquisition And Conversion Key Metrics Dashboard Professional PDF that is available for immediate downloading. Download now and make an impact on your audience. Highlight the attractive features available with our PPTs.
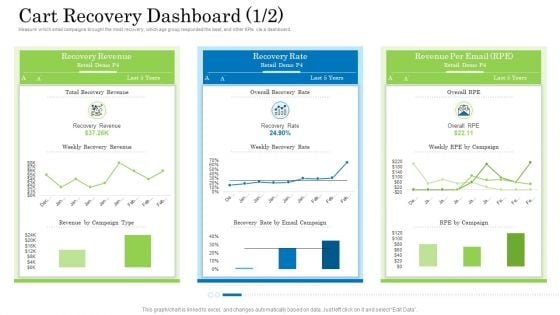
Customer Behavioral Data And Analytics Cart Recovery Dashboard Revenue Background PDF
Measure which email campaigns brought the most recovery, which age group responded the best, and other KPIs via a dashboard. Deliver an awe inspiring pitch with this creative customer behavioral data and analytics cart recovery dashboard revenue background pdf bundle. Topics like recovery revenue, recovery rate, revenue per email can be discussed with this completely editable template. It is available for immediate download depending on the needs and requirements of the user.
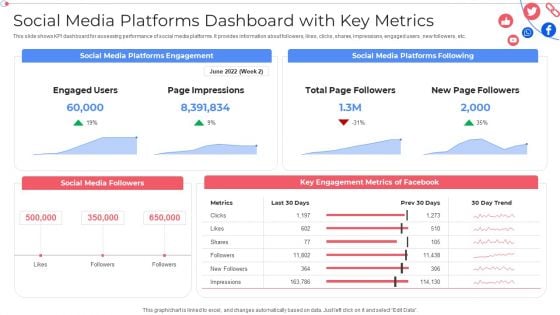
Social Media Platforms Dashboard With Key Metrics Customer Group Engagement Through Social Media Channels Infographics PDF
This slide shows KPI dashboard for assessing performance of social media platforms. It provides information about followers, likes, clicks, shares, impressions, engaged users , new followers, etc. Deliver an awe inspiring pitch with this creative Social Media Platforms Dashboard With Key Metrics Customer Group Engagement Through Social Media Channels Infographics PDF bundle. Topics like Social Media Followers, Key Engagement Metrics can be discussed with this completely editable template. It is available for immediate download depending on the needs and requirements of the user.
KPI Dashboard For Tracking Hospitality And Tourism Management Plan Performance Infographics PDF
This slide shows the KPI dashboard for monitoring the performance of strategy implemented. It covers KPIs such as bookings, location, housekeeping, etc. Pitch your topic with ease and precision using this KPI Dashboard For Tracking Hospitality And Tourism Management Plan Performance Infographics PDF. This layout presents information on Booking Type, Housekeeping, Check In Guest. It is also available for immediate download and adjustment. So, changes can be made in the color, design, graphics or any other component to create a unique layout.
Augmented Intelligence Tools And Applications IT Augmented Intelligence Information Tracking Dashboard Introduction PDF
This slide depicts the information tracking dashboard by augmented intelligence model covering the data analysis. Data analysis includes image analysis, storage size, new users on the cloud platform, etc. Presenting this PowerPoint presentation, titled Augmented Intelligence Tools And Applications IT Augmented Intelligence Information Tracking Dashboard Introduction PDF, with topics curated by our researchers after extensive research. This editable presentation is available for immediate download and provides attractive features when used. Download now and captivate your audience. Presenting this Augmented Intelligence Tools And Applications IT Augmented Intelligence Information Tracking Dashboard Introduction PDF. Our researchers have carefully researched and created these slides with all aspects taken into consideration. This is a completely customizable Augmented Intelligence Tools And Applications IT Augmented Intelligence Information Tracking Dashboard Introduction PDF that is available for immediate downloading. Download now and make an impact on your audience. Highlight the attractive features available with our PPTs.
Augmented Intelligence Information Tracking Dashboard Ppt PowerPoint Presentation File Ideas PDF
This slide depicts the information tracking dashboard by augmented intelligence model covering the data analysis. Data analysis includes image analysis, storage size, new users on the cloud platform, etc. Presenting this PowerPoint presentation, titled Augmented Intelligence Information Tracking Dashboard Ppt PowerPoint Presentation File Ideas PDF, with topics curated by our researchers after extensive research. This editable presentation is available for immediate download and provides attractive features when used. Download now and captivate your audience. Presenting this Augmented Intelligence Information Tracking Dashboard Ppt PowerPoint Presentation File Ideas PDF. Our researchers have carefully researched and created these slides with all aspects taken into consideration. This is a completely customizable Augmented Intelligence Information Tracking Dashboard Ppt PowerPoint Presentation File Ideas PDF that is available for immediate downloading. Download now and make an impact on your audience. Highlight the attractive features available with our PPTs.
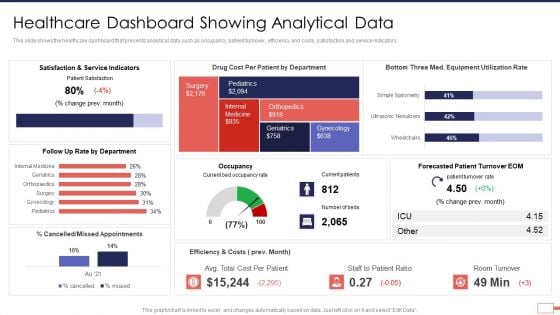
Iot Digital Twin Technology Post Covid Expenditure Management Healthcare Dashboard Showing Analytical Data Brochure PDF
This slide shows the healthcare dashboard that presents analytical data such as occupancy, patient turnover, efficiency and costs, satisfaction and service indicators. Deliver an awe inspiring pitch with this creative iot digital twin technology post covid expenditure management healthcare dashboard showing analytical data brochure pdf bundle. Topics like service, indicators, cost, appointments, turnover can be discussed with this completely editable template. It is available for immediate download depending on the needs and requirements of the user.
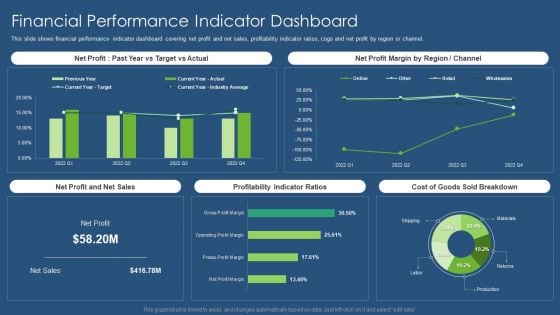
Sustainability Calculation With KPI Financial Performance Indicator Dashboard Infographics PDF Template PDF
This slide shows financial performance indicator dashboard covering net profit and net sales, profitability indicator ratios, cogs and net profit by region or channel. Deliver an awe inspiring pitch with this creative sustainability calculation with kpi financial performance indicator dashboard infographics pdf bundle. Topics like net profit margin, net profit and net sales, profitability indicator ratios, sold breakdown can be discussed with this completely editable template. It is available for immediate download depending on the needs and requirements of the user.
Workplace Risk Key Performance Indicator Dashboard Icon Ppt Inspiration Slides PDF
Persuade your audience using this Workplace Risk Key Performance Indicator Dashboard Icon Ppt Inspiration Slides PDF. This PPT design covers four stages, thus making it a great tool to use. It also caters to a variety of topics including Workplace Risk, Key Performance, Indicator Dashboard, Icon. Download this PPT design now to present a convincing pitch that not only emphasizes the topic but also showcases your presentation skills.
Strategies To Maintain Transportation Shipping And Logistics Tracking Dashboard With Shipments Ppt Infographics Information PDF
This slide covers Key performance indicators to track the automation system of the company. This dashboard includes Logistics Efficiency Status, delivery time accuracy etc. Presenting this PowerPoint presentation, titled Strategies To Maintain Transportation Shipping And Logistics Tracking Dashboard With Shipments Ppt Infographics Information PDF, with topics curated by our researchers after extensive research. This editable presentation is available for immediate download and provides attractive features when used. Download now and captivate your audience. Presenting this Strategies To Maintain Transportation Shipping And Logistics Tracking Dashboard With Shipments Ppt Infographics Information PDF. Our researchers have carefully researched and created these slides with all aspects taken into consideration. This is a completely customizable Strategies To Maintain Transportation Shipping And Logistics Tracking Dashboard With Shipments Ppt Infographics Information PDF that is available for immediate downloading. Download now and make an impact on your audience. Highlight the attractive features available with our PPTs.
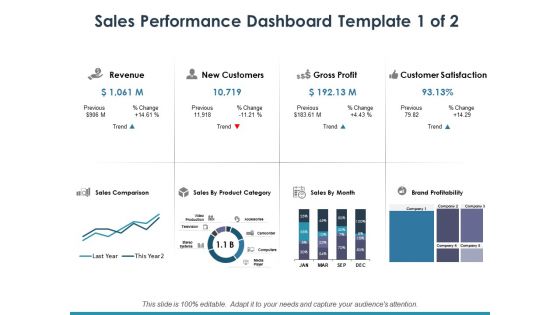
Sales Performance Dashboard Template 1 Ppt PowerPoint Presentation Infographic Template Maker
This is a sales performance dashboard template 1 ppt powerpoint presentation infographic template maker. This is a eight stage process. The stages in this process are dollar, business, finance, marketing.
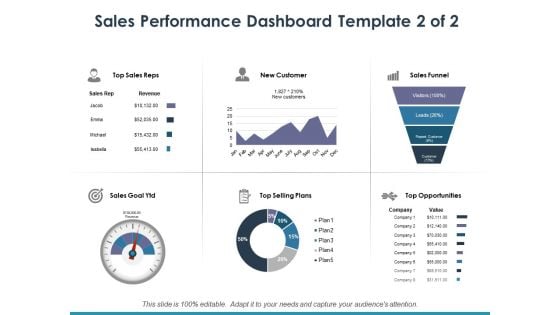
Sales Performance Dashboard Template 2 Ppt PowerPoint Presentation Infographic Template Clipart
This is a sales performance dashboard template 2 ppt powerpoint presentation infographic template clipart. This is a six stage process. The stages in this process are top sales reps, new customer, sales funnel, top selling plans, top opportunities.
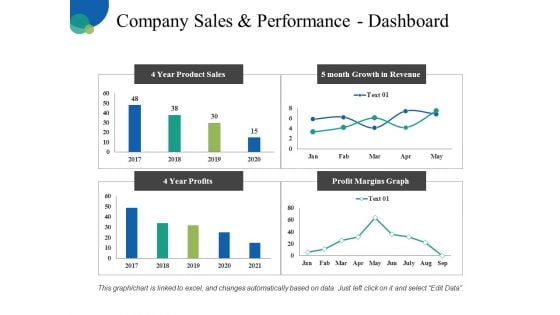
Company Sales And Performance Dashboard Ppt PowerPoint Presentation Pictures Infographic Template
This is a company sales and performance dashboard ppt powerpoint presentation pictures infographic template. This is a four stage process. The stages in this process are business, finance, analysis, management, marketing.
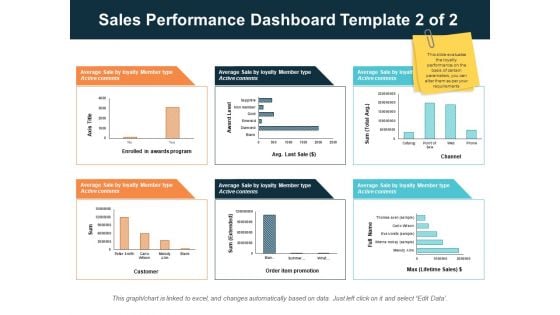
Sales Performance Dashboard Template 2 Of 2 Ppt PowerPoint Presentation Infographics Design Inspiration
This is a sales performance dashboard template 2 of 2 ppt powerpoint presentation infographics design inspiration. This is a three stage process. The stages in this process are finance, management, strategy, analysis, marketing.
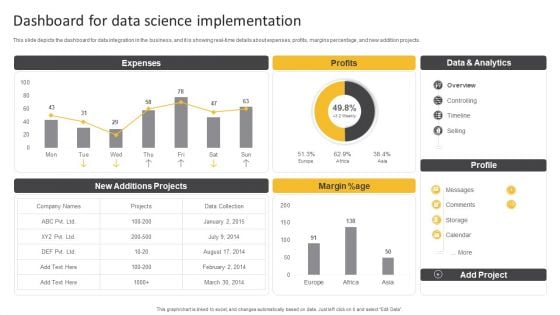
Information Science Dashboard For Data Science Implementation Ppt PowerPoint Presentation Slides Maker PDF
This slide depicts the dashboard for data integration in the business, and it is showing real-time details about expenses, profits, margins percentage, and new addition projects.Deliver and pitch your topic in the best possible manner with this Information Science Dashboard For Data Science Implementation Ppt PowerPoint Presentation Slides Maker PDF. Use them to share invaluable insights on Expenses, Data Analytics, New Projects and impress your audience. This template can be altered and modified as per your expectations. So, grab it now.
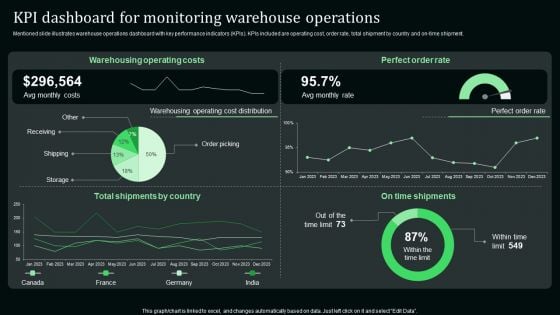
Kpi Dashboard For Monitoring Warehouse Operations Stand Out Digital Supply Chain Tactics Enhancing Information PDF
Mentioned slide illustrates warehouse operations dashboard with key performance indicators KPIs. KPIs included are operating cost, order rate, total shipment by country and on-time shipment.Presenting this PowerPoint presentation, titled Kpi Dashboard For Monitoring Warehouse Operations Stand Out Digital Supply Chain Tactics Enhancing Information PDF, with topics curated by our researchers after extensive research. This editable presentation is available for immediate download and provides attractive features when used. Download now and captivate your audience. Presenting this Kpi Dashboard For Monitoring Warehouse Operations Stand Out Digital Supply Chain Tactics Enhancing Information PDF. Our researchers have carefully researched and created these slides with all aspects taken into consideration. This is a completely customizable Kpi Dashboard For Monitoring Warehouse Operations Stand Out Digital Supply Chain Tactics Enhancing Information PDF that is available for immediate downloading. Download now and make an impact on your audience. Highlight the attractive features available with our PPTs.
Data Management Platform Dashboard Ppt PowerPoint Presentation Icon Graphics Pictures Cpb Pdf
Presenting this set of slides with name data management platform dashboard ppt powerpoint presentation icon graphics pictures cpb pdf. This is an editable Powerpoint four stages graphic that deals with topics like data management platform dashboard to help convey your message better graphically. This product is a premium product available for immediate download and is 100 percent editable in Powerpoint. Download this now and use it in your presentations to impress your audience.
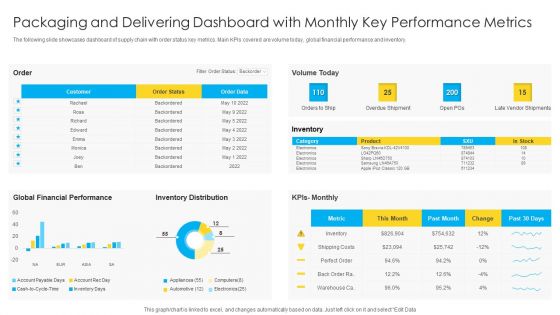
Packaging And Delivering Dashboard With Monthly Key Performance Metrics Microsoft PDF
The following slide showcases dashboard of supply chain with order status key metrics. Main KPIs covered are volume today, global financial performance and inventory. Pitch your topic with ease and precision using this Packaging And Delivering Dashboard With Monthly Key Performance Metrics Microsoft PDF. This layout presents information on Customer, Global Financial Performance, Inventory Distribution. It is also available for immediate download and adjustment. So, changes can be made in the color, design, graphics or any other component to create a unique layout.
Integrating Social Media Tactics Dashboard For Tracking Social Media Kpis Introduction PDF
This slide shows dashboard for tracking social media key performance indicators KPIs. It provides details about average social engagement, reactions, comments, shares, clicks, thumbnail, platform, post message, etc. Deliver an awe inspiring pitch with this creative Integrating Social Media Tactics Dashboard For Tracking Social Media Kpis Introduction PDF bundle. Topics like Month Upper Fence, Social KPIs, Conversion Rate can be discussed with this completely editable template. It is available for immediate download depending on the needs and requirements of the user.
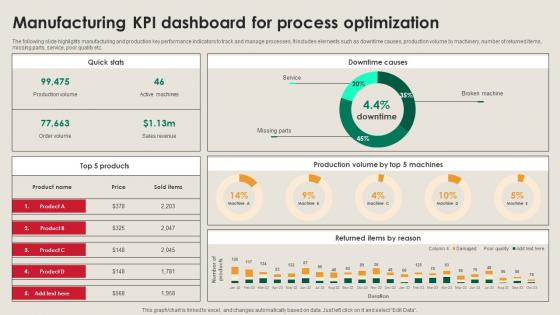
Manufacturing KPI Dashboard For Process Manufacturing Strategy Driving Industry 4 0
The following slide highlights manufacturing and production key performance indicators to track and manage processes. It includes elements such as downtime causes, production volume by machinery, number of returned items, missing parts, service, poor quality etc. Boost your pitch with our creative Manufacturing KPI Dashboard For Process Manufacturing Strategy Driving Industry 4 0. Deliver an awe-inspiring pitch that will mesmerize everyone. Using these presentation templates you will surely catch everyones attention. You can browse the ppts collection on our website. We have researchers who are experts at creating the right content for the templates. So you do not have to invest time in any additional work. Just grab the template now and use them. The following slide highlights manufacturing and production key performance indicators to track and manage processes. It includes elements such as downtime causes, production volume by machinery, number of returned items, missing parts, service, poor quality etc.
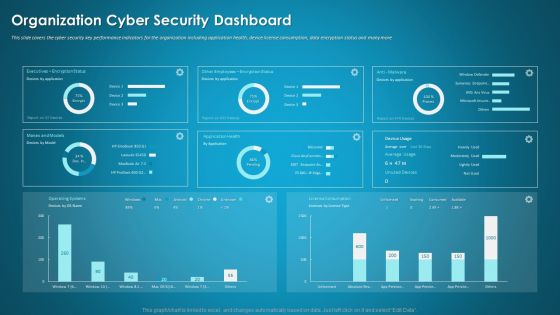
Organizational Network Security Awareness Staff Learning Organization Cyber Security Dashboard Elements PDF
This slide covers the cyber security key performance indicators for the organization including application health, device license consumption, data encryption status and many more. Deliver and pitch your topic in the best possible manner with this organizational network security awareness staff learning organization cyber security dashboard elements pdf. Use them to share invaluable insights on organization cyber security dashboard and impress your audience. This template can be altered and modified as per your expectations. So, grab it now.
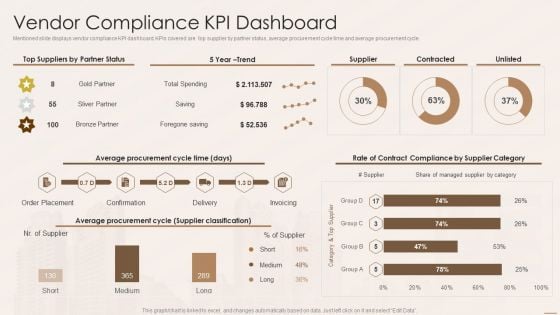
Real Estate Developers Funding Alternatives Vendor Compliance Kpi Dashboard Infographics PDF
Mentioned slide displays vendor compliance KPI dashboard. KPIs covered are top supplier by partner status, average procurement cycle time and average procurement cycle. Deliver and pitch your topic in the best possible manner with this Real Estate Developers Funding Alternatives Vendor Compliance Kpi Dashboard Infographics PDF. Use them to share invaluable insights on Average Procurement Cycle, Supplier Classification and impress your audience. This template can be altered and modified as per your expectations. So, grab it now.
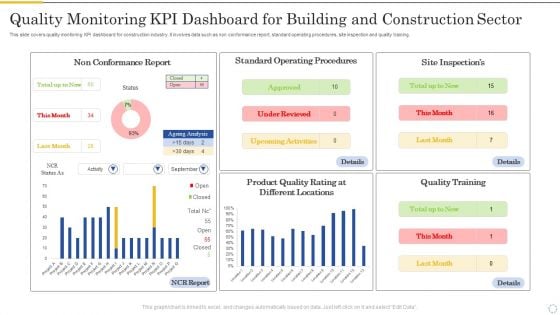
Quality Monitoring Kpi Dashboard For Building And Construction Sector Portrait PDF
This slide covers quality monitoring KPI dashboard for construction industry. It involves data such as non conformance report, standard operating procedures, site inspection and quality training. Showcasing this set of slides titled Quality Monitoring Kpi Dashboard For Building And Construction Sector Portrait PDF. The topics addressed in these templates are Non Conformance Report, Standard Operating, Procedures. All the content presented in this PPT design is completely editable. Download it and make adjustments in color, background, font etc. as per your unique business setting.
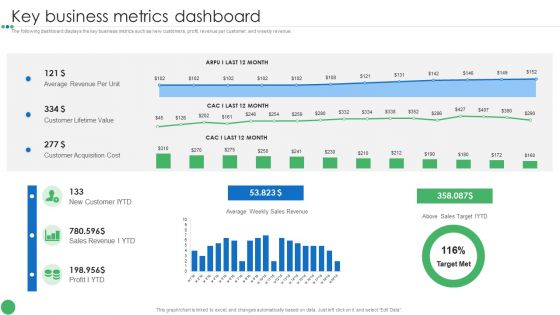
Key Business Metrics Dashboard Guide To Enhance Organic Growth By Advancing Business Procedures Pictures PDF
The following dashboard displays the key business metrics such as new customers, profit, revenue per customer, and weekly revenue.Deliver an awe inspiring pitch with this creative Key Business Metrics Dashboard Guide To Enhance Organic Growth By Advancing Business Procedures Pictures PDF bundle. Topics like Average Revenue, Customer Lifetime, Customer Acquisition can be discussed with this completely editable template. It is available for immediate download depending on the needs and requirements of the user.
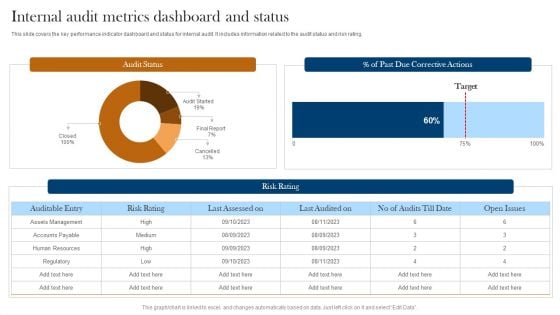
Internal Audit Metrics Dashboard And Status Ppt Layouts Graphic Images PDF
This slide covers the key performance indicator dashboard and status for internal audit. It includes information related to the audit status and risk rating. Pitch your topic with ease and precision using this Internal Audit Metrics Dashboard And Status Ppt Layouts Graphic Images PDF. This layout presents information on Audit Status, Risk Rating, Auditable Entry. It is also available for immediate download and adjustment. So, changes can be made in the color, design, graphics or any other component to create a unique layout.
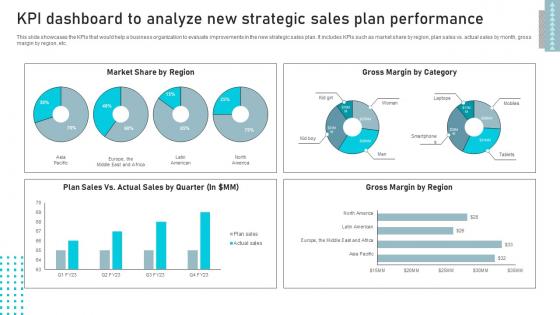
KPI Dashboard To Analyze New Business Sales Enhancement Campaign Portrait Pdf
This slide showcases the KPIs that would help a business organization to evaluate improvements in the new strategic sales plan. It includes KPIs such as market share by region, plan sales vs. actual sales by month, gross margin by region, etc. The best PPT templates are a great way to save time, energy, and resources. Slidegeeks have 100 percent editable powerpoint slides making them incredibly versatile. With these quality presentation templates, you can create a captivating and memorable presentation by combining visually appealing slides and effectively communicating your message. Download KPI Dashboard To Analyze New Business Sales Enhancement Campaign Portrait Pdf from Slidegeeks and deliver a wonderful presentation. This slide showcases the KPIs that would help a business organization to evaluate improvements in the new strategic sales plan. It includes KPIs such as market share by region, plan sales vs. actual sales by month, gross margin by region, etc.
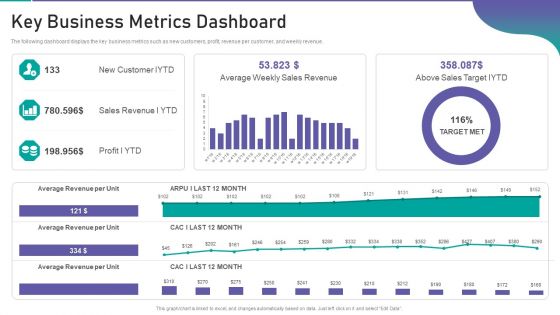
Corporate Organization Playbook Key Business Metrics Dashboard Ppt Show Rules PDF
The following dashboard displays the key business metrics such as new customers, profit, revenue per customer, and weekly revenue. Deliver an awe inspiring pitch with this creative corporate organization playbook key business metrics dashboard ppt show rules pdf bundle. Topics like new customer iytd, sales revenue i ytd, profit i ytd can be discussed with this completely editable template. It is available for immediate download depending on the needs and requirements of the user.
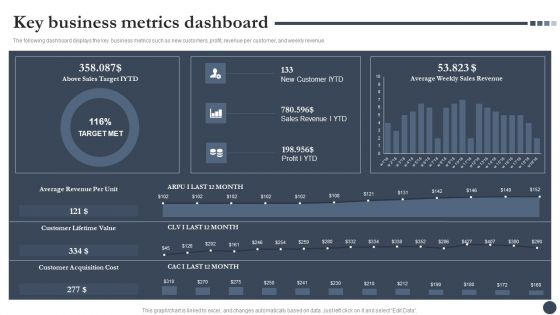
Strategic Playbook For Enterprise Administration Key Business Metrics Dashboard Pictures PDF
The following dashboard displays the key business metrics such as new customers, profit, revenue per customer, and weekly revenue. Deliver and pitch your topic in the best possible manner with this Strategic Playbook For Enterprise Administration Key Business Metrics Dashboard Pictures PDF. Use them to share invaluable insights on Average Revenue Per Unit, Customer Lifetime Value, Customer Acquisition Cost and impress your audience. This template can be altered and modified as per your expectations. So, grab it now.
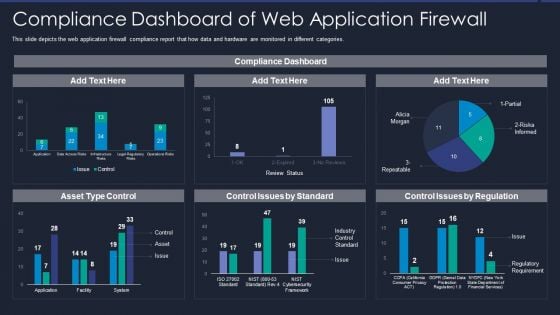
Web App Firewall Services IT Compliance Dashboard Of Web Application Firewall Topics PDF
This slide depicts the web application firewall compliance report that how data and hardware are monitored in different categories. Deliver an awe inspiring pitch with this creative web app firewall services it compliance dashboard of web application firewall topics pdf bundle. Topics like compliance dashboard of web application firewall can be discussed with this completely editable template. It is available for immediate download depending on the needs and requirements of the user.
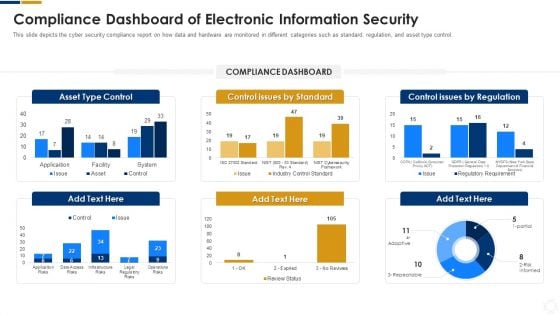
Cybersecurity Compliance Dashboard Of Electronic Information Security Ppt Outline Graphic Tips PDF
This slide depicts the cyber security compliance report on how data and hardware are monitored in different categories such as standard, regulation, and asset type control. Deliver an awe inspiring pitch with this creative cybersecurity compliance dashboard of electronic information security ppt outline graphic tips pdf bundle. Topics like compliance dashboard of electronic information security can be discussed with this completely editable template. It is available for immediate download depending on the needs and requirements of the user.
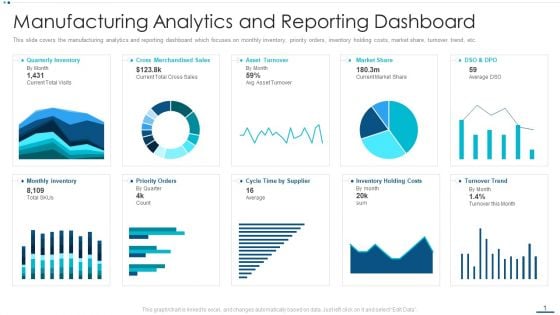
Strategic B2B Marketing Plan Manufacturing Analytics And Reporting Dashboard Rules PDF
This slide covers the manufacturing analytics and reporting dashboard which focuses on monthly inventory, priority orders, inventory holding costs, market share, turnover trend, etc.Deliver and pitch your topic in the best possible manner with this strategic b2b marketing plan manufacturing analytics and reporting dashboard rules pdf Use them to share invaluable insights on quarterly inventory, monthly inventory, cross merchandised sales and impress your audience. This template can be altered and modified as per your expectations. So, grab it now.
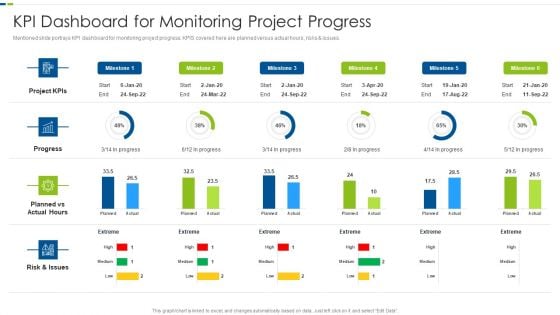
Utilizing Agile Methodology In Data Transformation Project IT KPI Dashboard For Monitoring Template PDF
Mentioned slide portrays KPI dashboard for monitoring project progress. KPIS covered here are planned versus actual hours, risks and issues. Deliver and pitch your topic in the best possible manner with this utilizing agile methodology in data transformation project it kpi dashboard for monitoring template pdf. Use them to share invaluable insights on risk, planned, project and impress your audience. This template can be altered and modified as per your expectations. So, grab it now.

Risk Management Model For Data Security Threat And Vulnerability Management Dashboard Diagrams PDF
Following slide displays threat and vulnerability management dashboard. It covers KPIs such as organization exposure score, system configuration score and severity score. Deliver an awe inspiring pitch with this creative Risk Management Model For Data Security Threat And Vulnerability Management Dashboard Diagrams PDF bundle. Topics like Exposure Score, Configuration Score, Severity Distribution, Top Vulnerable Software, Active Remediation can be discussed with this completely editable template. It is available for immediate download depending on the needs and requirements of the user.


 Continue with Email

 Home
Home


