Data Analysis Icon
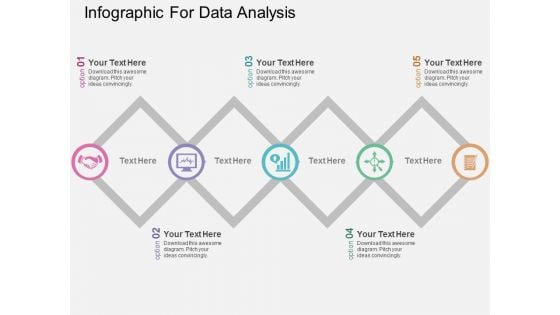
Infographic For Data Analysis Powerpoint Templates
This PowerPoint slide has been designed with process infographic. This PPT diagram may be used to display evaluation of business process. This diagram slide can be used to make impressive presentations.
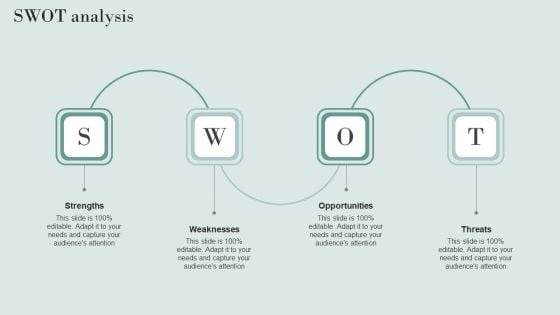
Data Structure IT Swot Analysis Diagrams PDF
Presenting this PowerPoint presentation, titled Data Structure IT Swot Analysis Diagrams PDF, with topics curated by our researchers after extensive research. This editable presentation is available for immediate download and provides attractive features when used. Download now and captivate your audience. Presenting this Data Structure IT Swot Analysis Diagrams PDF. Our researchers have carefully researched and created these slides with all aspects taken into consideration. This is a completely customizable Data Structure IT Swot Analysis Diagrams PDF that is available for immediate downloading. Download now and make an impact on your audience. Highlight the attractive features available with our PPTs.

Quantitative Data Analysis Methods Diagram Powerpoint Slide
This is a quantitative data analysis methods diagram powerpoint slide. This is a three stage process. The stages in this process are organizing data, presenting data, data analysis.
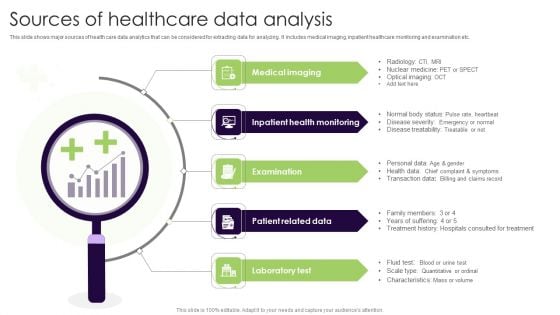
Sources Of Healthcare Data Analysis Rules PDF
This slide shows major sources of health care data analytics that can be considered for extracting data for analyzing. It includes medical imaging, inpatient healthcare monitoring and examination etc. Presenting Sources Of Healthcare Data Analysis Rules PDF to dispense important information. This template comprises five stages. It also presents valuable insights into the topics including Inpatient Health Monitoring, Examination, Patient Related Data. This is a completely customizable PowerPoint theme that can be put to use immediately. So, download it and address the topic impactfully.
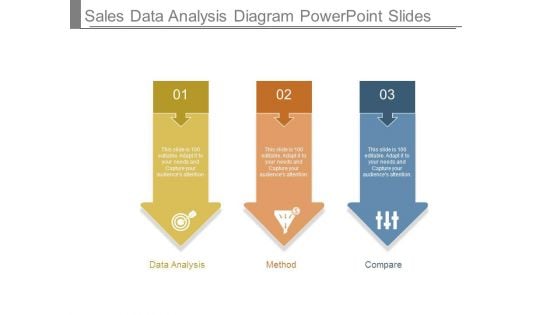
Sales Data Analysis Diagram Powerpoint Slides
This is a sales data analysis diagram powerpoint slides. This is a three stage process. The stages in this process are data analysis, method, compare.
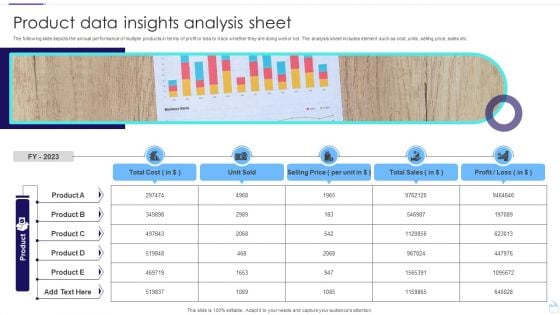
Product Data Insights Analysis Sheet Infographics PDF
The following slide depicts the annual performance of multiple products in terms of profit or loss to track whether they are doing well or not. The analysis sheet includes element such as cost, units, selling price, sales etc. Pitch your topic with ease and precision using this Product Data Insights Analysis Sheet Infographics PDF. This layout presents information on Unit Sold, Selling Price, Total Sales. It is also available for immediate download and adjustment. So, changes can be made in the color, design, graphics or any other component to create a unique layout.

Big Data Cycle For Analysis Diagram Slides
This is a big data cycle for analysis diagram slides. This is a five stage process. The stages in this process are massive data, new management needs, new final result, new hard and software, new analysis possibilities.
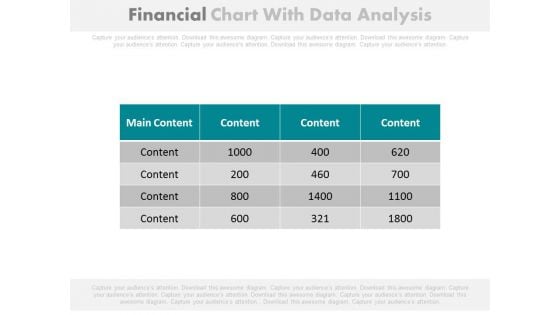
Financial Figures Data Analysis Report Powerpoint Slides
Our above PowerPoint template contains table chart with financial figures. This professional slide may be used to display data analysis report. Enlighten your audience with your breathtaking ideas.
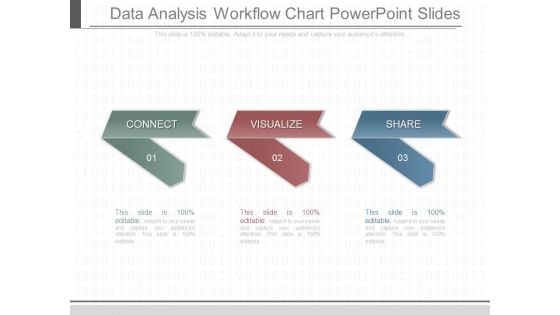
Data Analysis Workflow Chart Powerpoint Slides
This is a data analysis workflow chart powerpoint slides. This is a three stage process. The stages in this process are connect, visualize, share.

Financial Data Analysis Sample Diagram Presentation Slide
This is a financial data analysis sample diagram presentation slide. This is a four stage process. The stages in this process are finance, sales and marketing, operations, credit and risk.
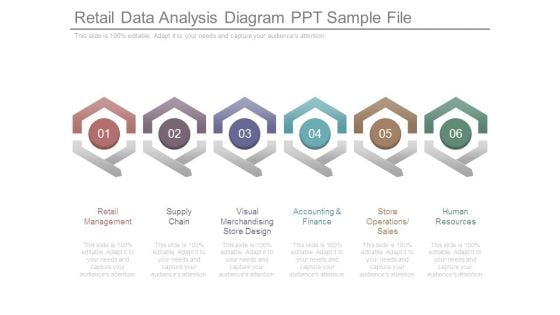
Retail Data Analysis Diagram Ppt Sample File
This is a retail data analysis diagram ppt sample file. This is a six stage process. The stages in this process are retail management, supply chain, visual merchandising store design, accounting and finance, store operations sales, human resources.
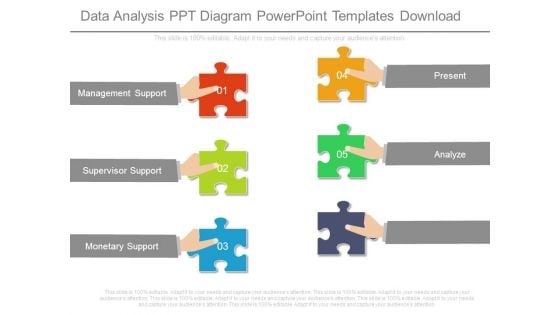
Data Analysis Ppt Diagram Powerpoint Templates Download
This is a data analysis ppt diagram powerpoint templates download. This is a five stage process. The stages in this process are management support, supervisor support, monetary support, present, analyze.
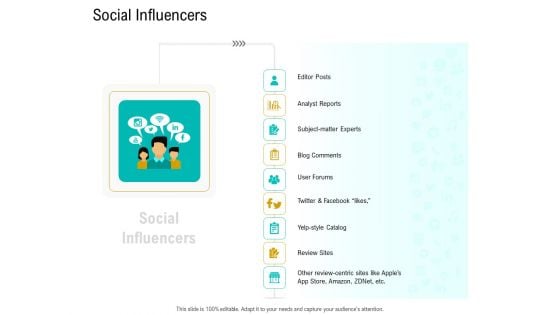
Business Data Analysis Social Influencers Diagrams PDF
Deliver an awe inspiring pitch with this creative business data analysis social influencers diagrams pdf bundle. Topics like analyst reports, subject matter experts, blog comments review sites, user forums can be discussed with this completely editable template. It is available for immediate download depending on the needs and requirements of the user.
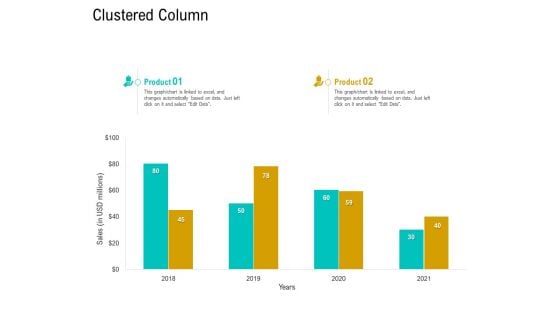
Business Data Analysis Clustered Column Template PDF
Deliver an awe inspiring pitch with this creative business data analysis clustered column template pdf bundle. Topics like clustered column can be discussed with this completely editable template. It is available for immediate download depending on the needs and requirements of the user.
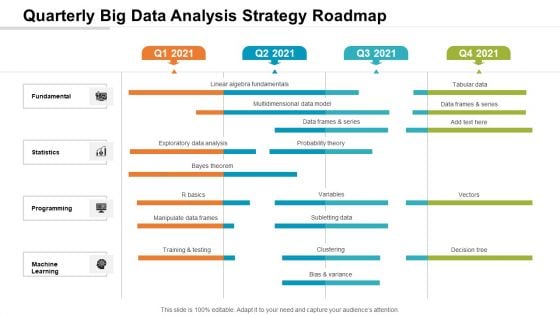
Quarterly Big Data Analysis Strategy Roadmap Infographics
Presenting our jaw-dropping quarterly big data analysis strategy roadmap infographics. You can alternate the color, font size, font type, and shapes of this PPT layout according to your strategic process. This PPT presentation is compatible with Google Slides and is available in both standard screen and widescreen aspect ratios. You can also download this well-researched PowerPoint template design in different formats like PDF, JPG, and PNG. So utilize this visually-appealing design by clicking the download button given below.

Business Data Analysis Media Themes PDF
This is a business data analysis media themes pdf template with various stages. Focus and dispense information on one stage using this creative set, that comes with editable features. It contains large content boxes to add your information on topics like media is the most popular source of big data, as it provides valuable insights on consumer preferences and changing trends, media includes social media and interactive platforms, like google, facebook, twitter, youtube, instagram. You can also showcase facts, figures, and other relevant content using this PPT layout. Grab it now.
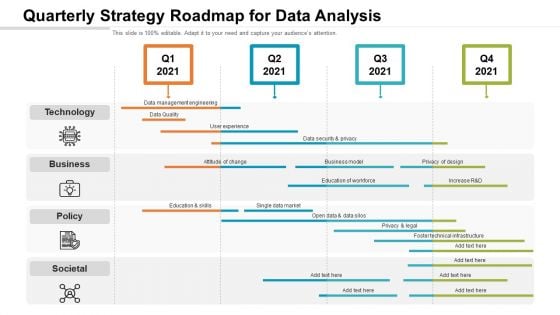
Quarterly Strategy Roadmap For Data Analysis Microsoft
Introducing our quarterly strategy roadmap for data analysis microsoft. This PPT presentation is Google Slides compatible, therefore, you can share it easily with the collaborators for measuring the progress. Also, the presentation is available in both standard screen and widescreen aspect ratios. So edit the template design by modifying the font size, font type, color, and shapes as per your requirements. As this PPT design is fully editable it can be presented in PDF, JPG and PNG formats.
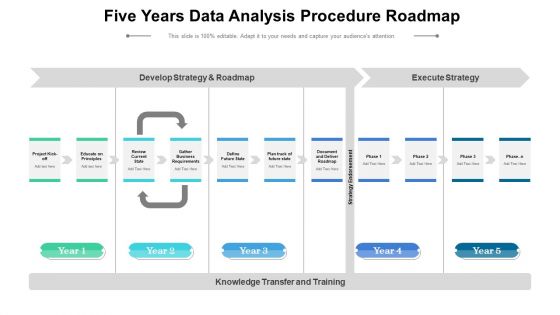
Five Years Data Analysis Procedure Roadmap Infographics
Introducing our five years data analysis procedure roadmap infographics. This PPT presentation is Google Slides compatible, therefore, you can share it easily with the collaborators for measuring the progress. Also, the presentation is available in both standard screen and widescreen aspect ratios. So edit the template design by modifying the font size, font type, color, and shapes as per your requirements. As this PPT design is fully editable it can be presented in PDF, JPG and PNG formats.
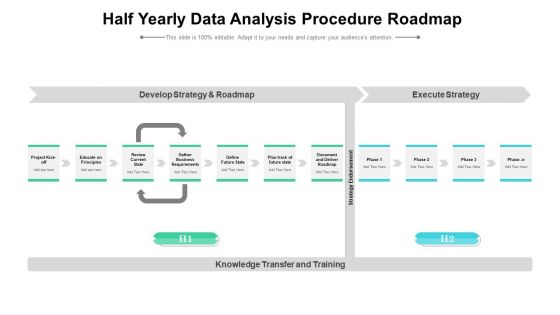
Half Yearly Data Analysis Procedure Roadmap Formats
Presenting our innovatively structured half yearly data analysis procedure roadmap formats Template. Showcase your roadmap process in different formats like PDF, PNG, and JPG by clicking the download button below. This PPT design is available in both Standard Screen and Widescreen aspect ratios. It can also be easily personalized and presented with modified font size, font type, color, and shapes to measure your progress in a clear way.
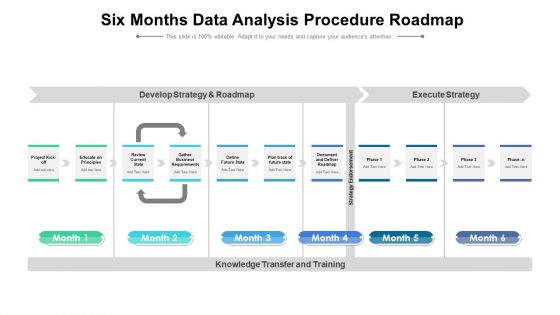
Six Months Data Analysis Procedure Roadmap Topics
Presenting our innovatively structured six months data analysis procedure roadmap topics Template. Showcase your roadmap process in different formats like PDF, PNG, and JPG by clicking the download button below. This PPT design is available in both Standard Screen and Widescreen aspect ratios. It can also be easily personalized and presented with modified font size, font type, color, and shapes to measure your progress in a clear way.
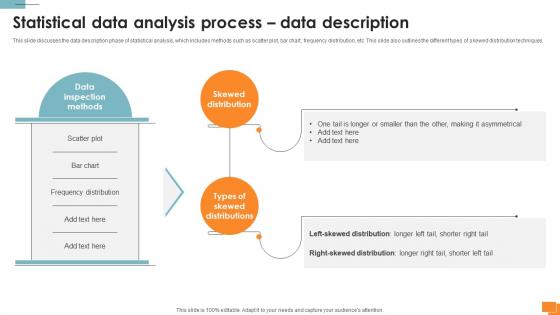
Statistical Tools For Evidence Statistical Data Analysis Process Data Description
This slide discusses the data description phase of statistical analysis, which includes methods such as scatter plot, bar chart, frequency distribution, etc. This slide also outlines the different types of skewed distribution techniques. Do you have to make sure that everyone on your team knows about any specific topic I yes, then you should give Statistical Tools For Evidence Statistical Data Analysis Process Data Description a try. Our experts have put a lot of knowledge and effort into creating this impeccable Statistical Tools For Evidence Statistical Data Analysis Process Data Description. You can use this template for your upcoming presentations, as the slides are perfect to represent even the tiniest detail. You can download these templates from the Slidegeeks website and these are easy to edit. So grab these today This slide discusses the data description phase of statistical analysis, which includes methods such as scatter plot, bar chart, frequency distribution, etc. This slide also outlines the different types of skewed distribution techniques.
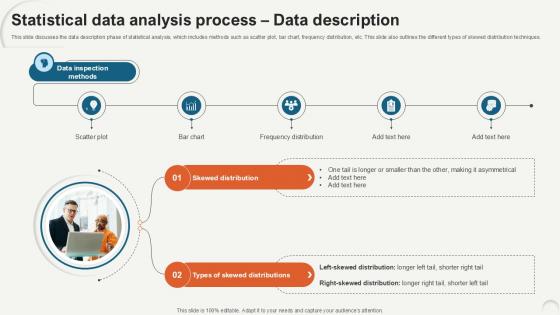
Statistical Data Analysis Process Data Description Ppt Example
This slide discusses the data description phase of statistical analysis, which includes methods such as scatter plot, bar chart, frequency distribution, etc. This slide also outlines the different types of skewed distribution techniques. Create an editable Statistical Data Analysis Process Data Description Ppt Example that communicates your idea and engages your audience. Whether you are presenting a business or an educational presentation, pre-designed presentation templates help save time. Statistical Data Analysis Process Data Description Ppt Example is highly customizable and very easy to edit, covering many different styles from creative to business presentations. Slidegeeks has creative team members who have crafted amazing templates. So, go and get them without any delay. This slide discusses the data description phase of statistical analysis, which includes methods such as scatter plot, bar chart, frequency distribution, etc. This slide also outlines the different types of skewed distribution techniques.
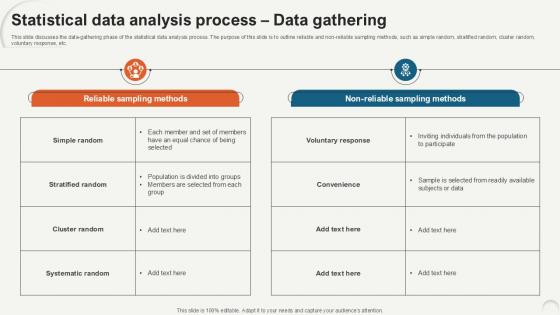
Statistical Data Analysis Process Data Gathering Ppt Example
This slide discusses the data-gathering phase of the statistical data analysis process. The purpose of this slide is to outline reliable and non-reliable sampling methods, such as simple random, stratified random, cluster random, voluntary response, etc. Slidegeeks is one of the best resources for PowerPoint templates. You can download easily and regulate Statistical Data Analysis Process Data Gathering Ppt Example for your personal presentations from our wonderful collection. A few clicks is all it takes to discover and get the most relevant and appropriate templates. Use our Templates to add a unique zing and appeal to your presentation and meetings. All the slides are easy to edit and you can use them even for advertisement purposes. This slide discusses the data-gathering phase of the statistical data analysis process. The purpose of this slide is to outline reliable and non-reliable sampling methods, such as simple random, stratified random, cluster random, voluntary response, etc.

Statistical Data Analysis Chart Of Collected Data Formats PDF
Presenting statistical data analysis chart of collected data formats pdf to dispense important information. This template comprises four stages. It also presents valuable insights into the topics including statistical data analysis chart of collected data. This is a completely customizable PowerPoint theme that can be put to use immediately. So, download it and address the topic impactfully.
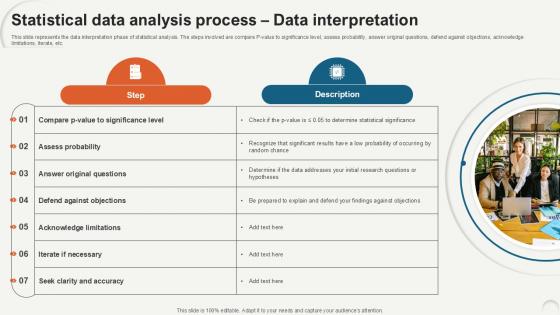
Statistical Data Analysis Process Data Interpretation Ppt Slide
This slide represents the data interpretation phase of statistical analysis. The steps involved are compare P-value to significance level, assess probability, answer original questions, defend against objections, acknowledge limitations, iterate, etc. Want to ace your presentation in front of a live audience Our Statistical Data Analysis Process Data Interpretation Ppt Slide can help you do that by engaging all the users towards you. Slidegeeks experts have put their efforts and expertise into creating these impeccable powerpoint presentations so that you can communicate your ideas clearly. Moreover, all the templates are customizable, and easy-to-edit and downloadable. Use these for both personal and commercial use. This slide represents the data interpretation phase of statistical analysis. The steps involved are compare P-value to significance level, assess probability, answer original questions, defend against objections, acknowledge limitations, iterate, etc.
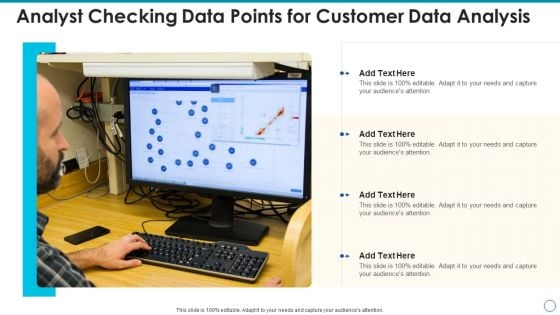
Analyst Checking Data Points For Customer Data Analysis Demonstration PDF
Presenting analyst checking data points for customer data analysis demonstration pdf to dispense important information. This template comprises four stages. It also presents valuable insights into the topics including analyst checking data points for customer data analysis. This is a completely customizable PowerPoint theme that can be put to use immediately. So, download it and address the topic impactfully.
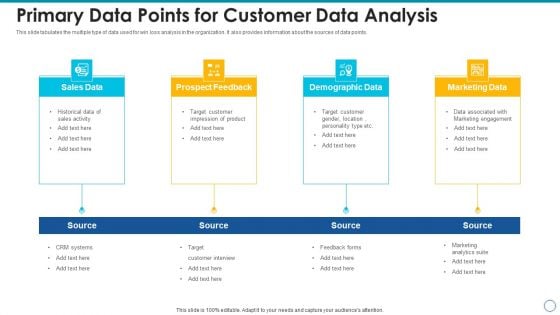
Primary Data Points For Customer Data Analysis Ideas PDF
This slide tabulates the multiple type of data used for win loss analysis in the organization. It also provides information about the sources of data points. Presenting primary data points for customer data analysis ideas pdf to dispense important information. This template comprises four stages. It also presents valuable insights into the topics including sales data, prospect feedback, demographic data, marketing data. This is a completely customizable PowerPoint theme that can be put to use immediately. So, download it and address the topic impactfully.
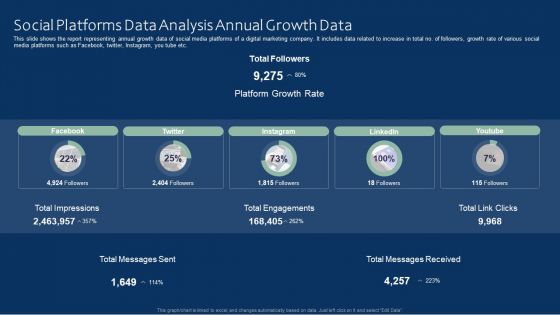
Social Platforms Data Analysis Annual Growth Data Ideas PDF
This slide shows the report representing annual growth data of social media platforms of a digital marketing company. It includes data related to increase in total no. of followers, growth rate of various social media platforms such as Facebook, twitter, Instagram, you tube etc. Pitch your topic with ease and precision using this Social Platforms Data Analysis Annual Growth Data Ideas PDF. This layout presents information on Social Platforms Data Analysis, Annual Growth Data. It is also available for immediate download and adjustment. So, changes can be made in the color, design, graphics or any other component to create a unique layout.
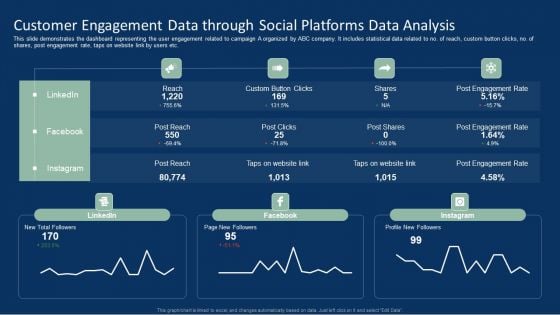
Customer Engagement Data Through Social Platforms Data Analysis Brochure PDF
This slide demonstrates the dashboard representing the user engagement related to campaign A organized by ABC company. It includes statistical data related to no. of reach, custom button clicks, no. of shares, post engagement rate, taps on website link by users etc. Showcasing this set of slides titled Customer Engagement Data Through Social Platforms Data Analysis Brochure PDF. The topics addressed in these templates are Customer Engagement Data, Social Platforms Data Analysis. All the content presented in this PPT design is completely editable. Download it and make adjustments in color, background, font etc. as per your unique business setting.
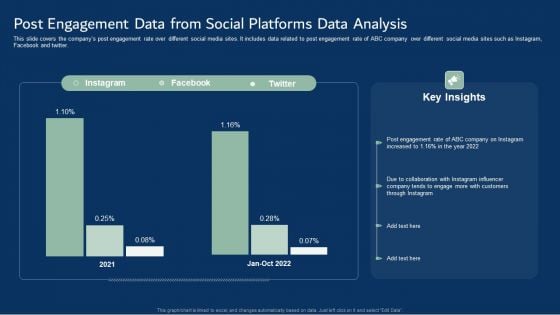
Post Engagement Data From Social Platforms Data Analysis Template PDF
This slide covers the companys post engagement rate over different social media sites. It includes data related to post engagement rate of ABC company over different social media sites such as Instagram, Facebook and twitter. Pitch your topic with ease and precision using this Post Engagement Data From Social Platforms Data Analysis Template PDF. This layout presents information on Post Engagement Data, Social Platforms Data Analysis. It is also available for immediate download and adjustment. So, changes can be made in the color, design, graphics or any other component to create a unique layout.
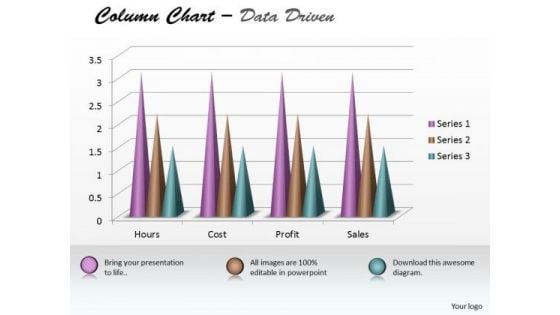
Excel Data Analysis Data Tools Data Methods Statistical Tool Survey Chart PowerPoint Templates
Analyze Ailments On Our excel data analysis data tools data methods statistical tool survey chart Powerpoint Templates . Bring Out The Thinking Doctor In You. Dock Your Thoughts With Our Excel Data Analysis . They Will Launch Them Into Orbit.
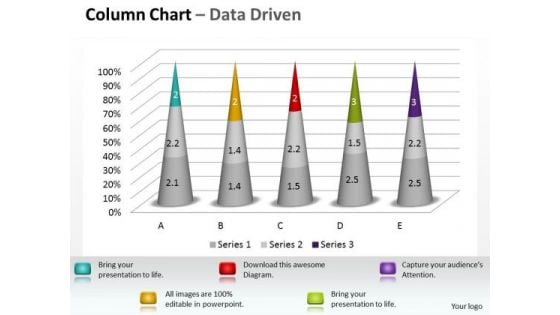
Excel Data Analysis Data Tools Data Methods Statistical Tool Survey 3d Chart PowerPoint Templates
Dumbfound Them With Our excel data analysis data tools data methods statistical tool survey 3d chart Powerpoint Templates . Your Audience Will Be Astounded With Your Ideas.
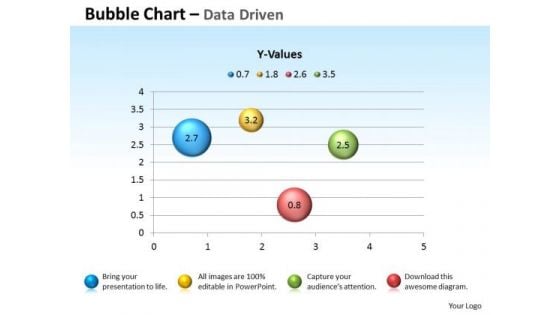
Excel Data Analysis Data Tools Data Methods Statistical Chart For Process PowerPoint Templates
Blend Your Views With Our excel data analysis data tools data methods statistical chart for process Powerpoint Templates . They Are Made For Each Other.
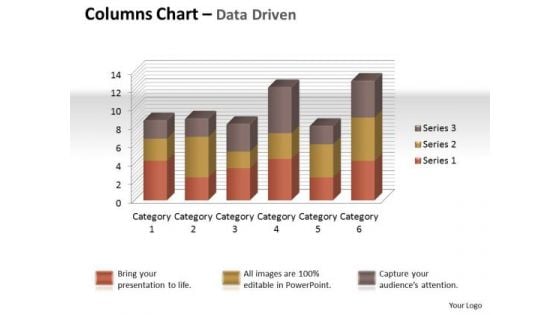
Excel Data Analysis Data Tools Data Methods Statistical Tool Chart PowerPoint Templates
Give Your Thoughts Some Durability. Coat Them With Our excel data analysis data tools data methods statistical tool chart Powerpoint Templates .
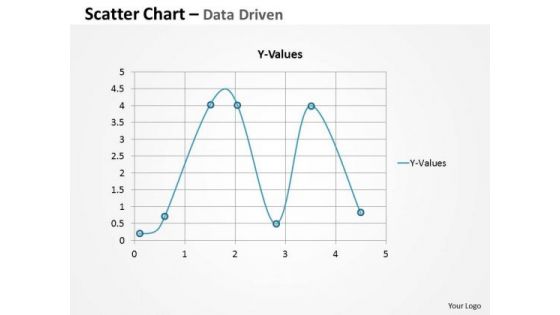
Excel Data Analysis Data Tools Data Methods Statistical Survey Driven PowerPoint Slides Templates
Ask For Assistance From Our excel data analysis data tools data methods statistical survey driven powerpoint slides Templates . You Will Be Duly Satisfied.
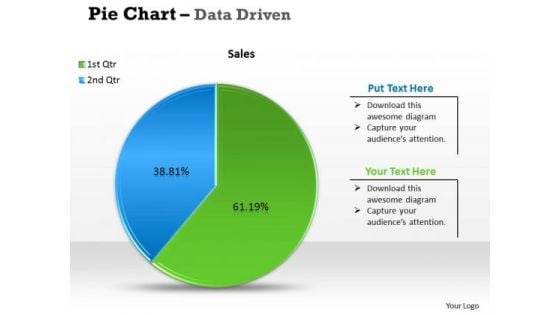
Excel Data Analysis Data Tools Data Methods Statistical Tool Survey PowerPoint Slides Templates
Get Out Of The Dock With Our excel data analysis data tools data methods statistical tool survey powerpoint slides Templates . Your Mind Will Be Set Free.
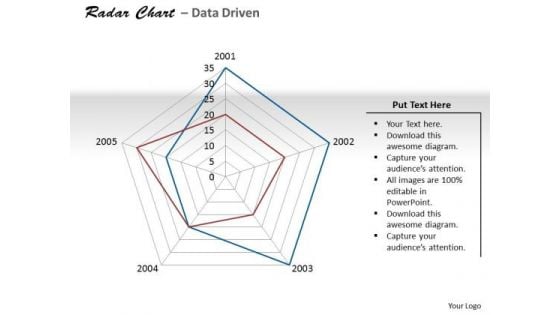
Excel Data Analysis Data Tools Data Methods Statistical Driven PowerPoint Slides Templates
There Is No Subject Too Dull For Our excel data analysis data tools data methods statistical driven powerpoint slides Templates . They Will Always Generate Keenness.
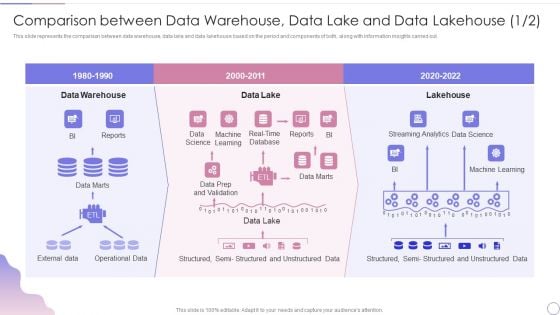
Data Lake Architecture Future Of Data Analysis Comparison Between Data Warehouse Diagrams PDF
This slide represents the comparison between data warehouse, data lake and data lakehouse based on the period and components of both, along with information insights carried out.Deliver and pitch your topic in the best possible manner with this Data Lake Architecture Future Of Data Analysis Comparison Between Data Warehouse Diagrams PDF. Use them to share invaluable insights on Data Warehouse, Unstructured Data, Streaming Analytics and impress your audience. This template can be altered and modified as per your expectations. So, grab it now.
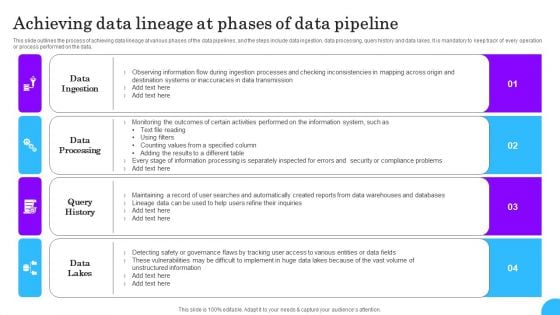
Comprehensive Analysis Of Different Data Lineage Classification Achieving Data Lineage At Phases Data Structure PDF
This slide outlines the process of achieving data lineage at various phases of the data pipelines, and the steps include data ingestion, data processing, query history and data lakes. It is mandatory to keep track of every operation or process performed on the data. Create an editable Comprehensive Analysis Of Different Data Lineage Classification Achieving Data Lineage At Phases Data Structure PDF that communicates your idea and engages your audience. Whether you are presenting a business or an educational presentation, pre designed presentation templates help save time. Comprehensive Analysis Of Different Data Lineage Classification Achieving Data Lineage At Phases Data Structure PDF is highly customizable and very easy to edit, covering many different styles from creative to business presentations. Slidegeeks has creative team members who have crafted amazing templates. So, go and get them without any delay.
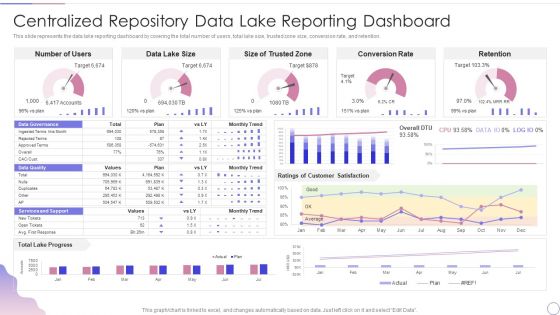
Data Lake Architecture Future Of Data Analysis Centralized Repository Data Lake Reporting Dashboard Elements PDF
This slide represents the data lake reporting dashboard by covering the total number of users, total lake size, trusted zone size, conversion rate, and retention.Deliver an awe inspiring pitch with this creative Data Lake Architecture Future Of Data Analysis Centralized Repository Data Lake Reporting Dashboard Elements PDF bundle. Topics like Data Governance, Conversion Rate, Retention can be discussed with this completely editable template. It is available for immediate download depending on the needs and requirements of the user.
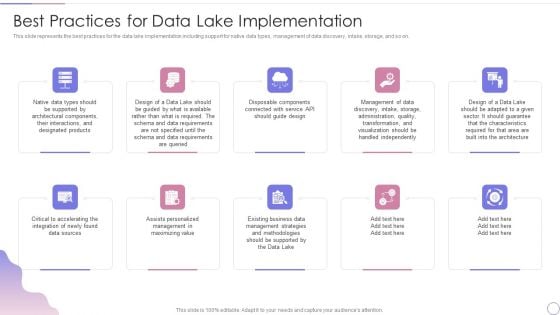
Data Lake Architecture Future Of Data Analysis Best Practices For Data Lake Implementation Diagrams PDF
This slide represents the best practices for the data lake implementation including support for native data types, management of data discovery, intake, storage, and so on.Presenting Data Lake Architecture Future Of Data Analysis Best Practices For Data Lake Implementation Diagrams PDF to provide visual cues and insights. Share and navigate important information on ten stages that need your due attention. This template can be used to pitch topics like Architectural Components, Critical To Accelerating, Management Strategies. In addtion, this PPT design contains high resolution images, graphics, etc, that are easily editable and available for immediate download.
Marketing Environmental Analysis Research Analysis Icon Mockup PDF
Showcasing this set of slides titled Marketing Environmental Analysis Research Analysis Icon Mockup PDF. The topics addressed in these templates are Marketing Environmental, Analysis, Research Analysis. All the content presented in this PPT design is completely editable. Download it and make adjustments in color, background, font etc. as per your unique business setting.
Customer Attrition Analysis And Analysis Icon Template PDF
Presenting Customer Attrition Analysis And Analysis Icon Template PDF to dispense important information. This template comprises three stages. It also presents valuable insights into the topics including Customer Attrition Analysis, Analysis Icon. This is a completely customizable PowerPoint theme that can be put to use immediately. So, download it and address the topic impactfully.
Test Analysis Report Icon Depicting Medical Analysis Background PDF
Persuade your audience using this Test Analysis Report Icon Depicting Medical Analysis Background PDF. This PPT design covers three stages, thus making it a great tool to use. It also caters to a variety of topics including Medical Analysis, Analysis Report Icon. Download this PPT design now to present a convincing pitch that not only emphasizes the topic but also showcases your presentation skills.
Industry Analysis Pestel Analysis Ppt PowerPoint Presentation Icon Smartart
This is a industry analysis pestel analysis ppt powerpoint presentation icon smartart. This is a six stage process. The stages in this process are social, technological, management, marketing, business.
Industry Analysis Pestle Analysis Ppt PowerPoint Presentation Icon Infographic Template
This is a industry analysis pestle analysis ppt powerpoint presentation icon infographic template. This is a six stage process. The stages in this process are business, management, marketing, compare.
Commodity Category Analysis Category Attractiveness Analysis Ppt Icon Ideas PDF
Presenting commodity category analysis category attractiveness analysis ppt icon ideas pdf to provide visual cues and insights. Share and navigate important information on four stages that need your due attention. This template can be used to pitch topics like category attractiveness analysis. In addtion, this PPT design contains high resolution images, graphics, etc, that are easily editable and available for immediate download.
Commodity Category Analysis Financial Analysis Icon Portrait PDF
Deliver an awe inspiring pitch with this creative commodity category analysis financial analysis icon portrait pdf bundle. Topics like financial analysis can be discussed with this completely editable template. It is available for immediate download depending on the needs and requirements of the user.
NPD Analysis Detailed Analysis Ppt Icon Template PDF
Presenting this set of slides with name npd analysis detailed analysis ppt icon template pdf. This is a four stage process. The stages in this process are strengths, weakness, features, benefits. This is a completely editable PowerPoint presentation and is available for immediate download. Download now and impress your audience.
Commodity Category Analysis Competitor Analysis Icon Ppt Inspiration Graphics PDF
Deliver an awe inspiring pitch with this creative commodity category analysis competitor analysis icon ppt inspiration graphics pdf bundle. Topics like performance, additional functions, design can be discussed with this completely editable template. It is available for immediate download depending on the needs and requirements of the user.
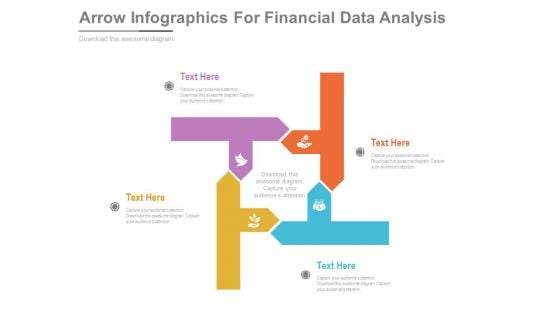
Arrow Infographics For Financial Data Analysis Powerpoint Template
This PowerPoint slide contains diagram of arrows infographic. This professional slide helps to exhibit financial data analysis for business growth. Use this PowerPoint template to make impressive presentations.
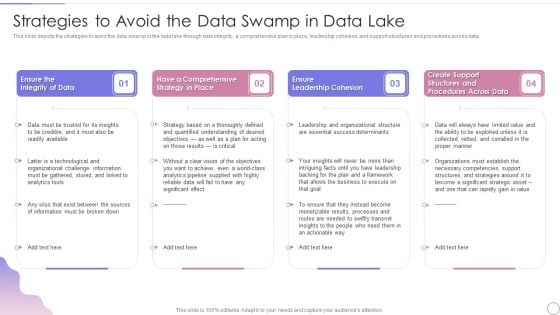
Data Lake Architecture Future Of Data Analysis Strategies To Avoid The Data Swamp In Data Lake Themes PDF
This slide depicts the strategies to avoid the data swamp in the data lake through data integrity, a comprehensive plan in place, leadership cohesion, and support structures and procedures across data.Deliver and pitch your topic in the best possible manner with this Data Lake Architecture Future Of Data Analysis Strategies To Avoid The Data Swamp In Data Lake Themes PDF. Use them to share invaluable insights on Leadership Cohesion, Procedures Across, Success Determinants and impress your audience. This template can be altered and modified as per your expectations. So, grab it now.
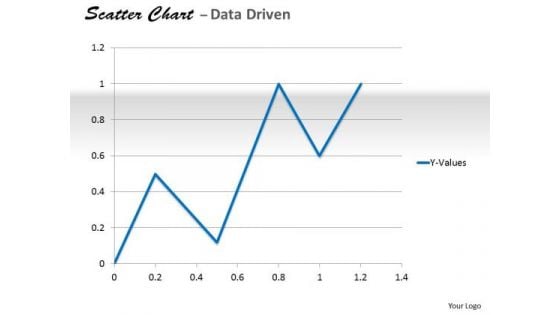
Data Analysis In Excel Analyzing Of Relationship Chart PowerPoint Templates
Delight Them With Our data analysis in excel analyzing of relationship chart Powerpoint Templates .
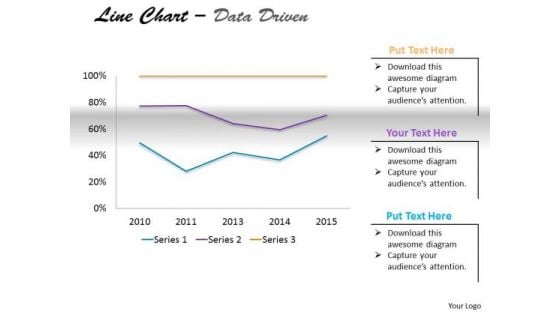
Multivariate Data Analysis Driven Market Line Chart PowerPoint Slides Templates
Delight Them With Our multivariate data analysis driven market line chart powerpoint slides Templates .
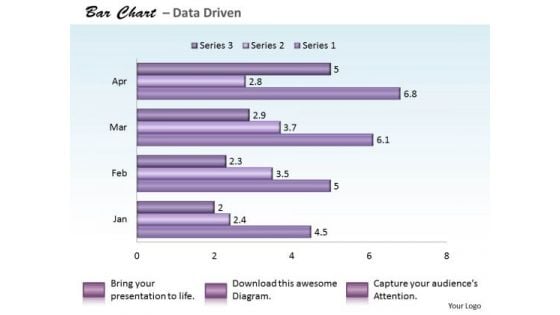
Quantitative Data Analysis Bar Chart For PowerPoint Templates
Reduce The Drag With Our quantitative data analysis bar chart for Powerpoint Templates . Give More Lift To Your Thoughts.

Data Analysis Excel Categorical Statistics Doughnut Chart PowerPoint Templates
Establish Your Dominion With Our data analysis excel categorical statistics doughnut chart Powerpoint Templates. Rule The Stage With Your Thoughts.
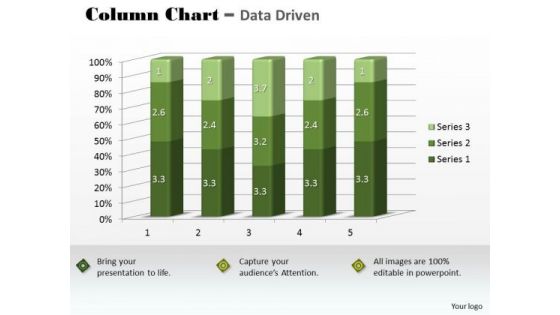
Marketing Data Analysis 3d Statistical Quality Control Chart PowerPoint Templates
Our marketing data analysis 3d statistical quality control chart Powerpoint Templates Abhor Doodling. They Never Let The Interest Flag.
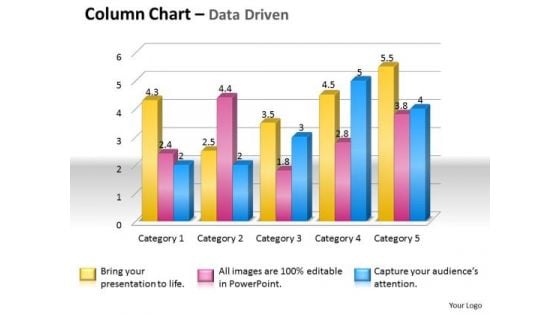
Data Analysis Techniques 3d Grouped Bar Chart PowerPoint Templates
Place The Orders With Your Thoughts. Our data analysis techniques 3d grouped bar chart Powerpoint Templates Know The Drill.

Data Analysis Techniques 3d Effective Display Chart PowerPoint Templates
Dribble Away With Our data analysis techniques 3d effective display chart Powerpoint Templates . Score A Goal With Your Ideas.
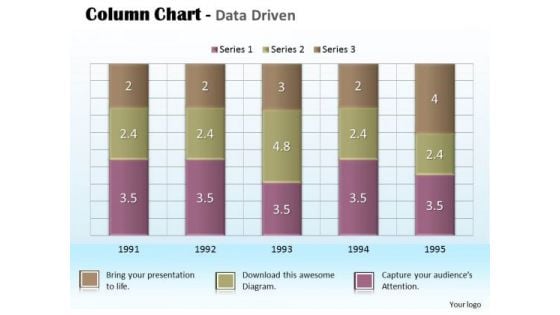
Business Data Analysis Chart For Project PowerPoint Templates
Document Your Views On Our business data analysis chart for project Powerpoint Templates. They Will Create A Strong Impression.


 Continue with Email

 Home
Home


