Data Analysis Icon
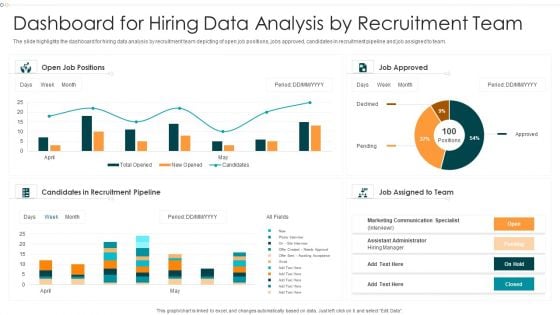
Dashboard For Hiring Data Analysis By Recruitment Team Formats PDF
The slide highlights the dashboard for hiring data analysis by recruitment team depicting of open job positions, jobs approved, candidates in recruitment pipeline and job assigned to team.Pitch your topic with ease and precision using this Dashboard For Hiring Data Analysis By Recruitment Team Formats PDF This layout presents information on Candidates Recruitment, Marketing Communication, Approved It is also available for immediate download and adjustment. So, changes can be made in the color, design, graphics or any other component to create a unique layout.
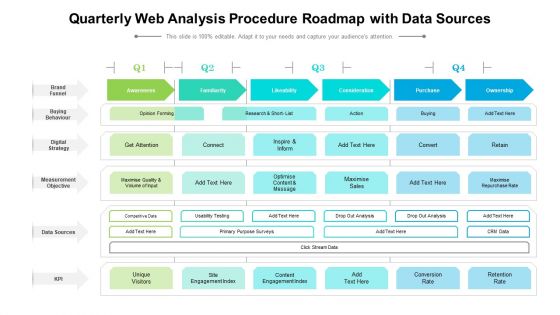
Quarterly Web Analysis Procedure Roadmap With Data Sources Guidelines
We present our quarterly web analysis procedure roadmap with data sources guidelines. This PowerPoint layout is easy to edit so you can change the font size, font type, color, and shape conveniently. In addition to this, the PowerPoint layout is Google Slides compatible, so you can share it with your audience and give them access to edit it. Therefore, download and save this well researched quarterly web analysis procedure roadmap with data sources guidelines in different formats like PDF, PNG, and JPG to smoothly execute your business plan.
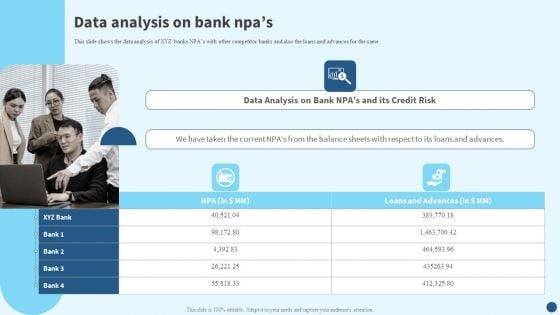
Credit Risk Management Data Analysis On Bank Npas Microsoft PDF
This slide shows the data analysis of XYZ banks NPAs with other competitor banks and also the loans and advances for the same. Whether you have daily or monthly meetings, a brilliant presentation is necessary. Credit Risk Management Data Analysis On Bank Npas Microsoft PDF can be your best option for delivering a presentation. Represent everything in detail using Credit Risk Management Data Analysis On Bank Npas Microsoft PDF and make yourself stand out in meetings. The template is versatile and follows a structure that will cater to your requirements. All the templates prepared by Slidegeeks are easy to download and edit. Our research experts have taken care of the corporate themes as well. So, give it a try and see the results.
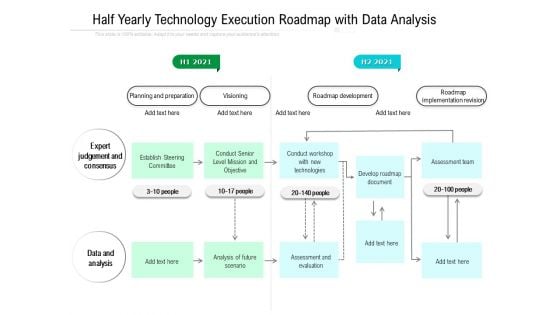
Half Yearly Technology Execution Roadmap With Data Analysis Mockup Elements
We present our half yearly technology execution roadmap with data analysis mockup elements. This PowerPoint layout is easy-to-edit so you can change the font size, font type, color, and shape conveniently. In addition to this, the PowerPoint layout is Google Slides compatible, so you can share it with your audience and give them access to edit it. Therefore, download and save this well-researched half yearly technology execution roadmap with data analysis mockup elements in different formats like PDF, PNG, and JPG to smoothly execute your business plan.
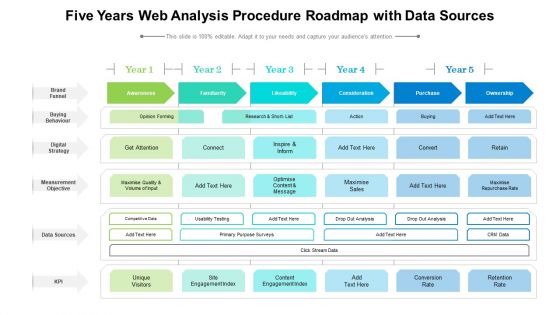
Five Years Web Analysis Procedure Roadmap With Data Designs
We present our five years web analysis procedure roadmap with data designs. This PowerPoint layout is easy to edit so you can change the font size, font type, color, and shape conveniently. In addition to this, the PowerPoint layout is Google Slides compatible, so you can share it with your audience and give them access to edit it. Therefore, download and save this well researched five years web analysis procedure roadmap with data designs in different formats like PDF, PNG, and JPG to smoothly execute your business plan.
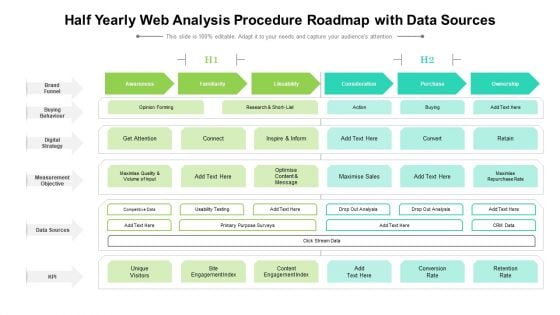
Half Yearly Web Analysis Procedure Roadmap With Data Sources Elements
We present our half yearly web analysis procedure roadmap with data sources elements. This PowerPoint layout is easy to edit so you can change the font size, font type, color, and shape conveniently. In addition to this, the PowerPoint layout is Google Slides compatible, so you can share it with your audience and give them access to edit it. Therefore, download and save this well researched half yearly web analysis procedure roadmap with data sources elements in different formats like PDF, PNG, and JPG to smoothly execute your business plan.
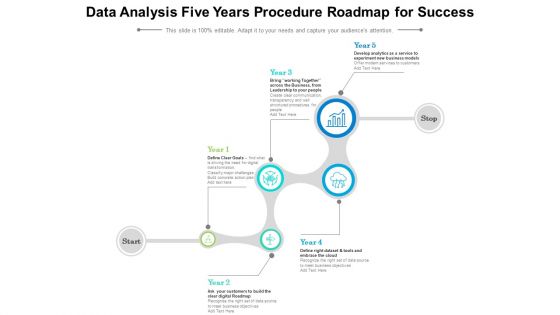
Data Analysis Five Years Procedure Roadmap For Success Slides
We present our data analysis five years procedure roadmap for success slides. This PowerPoint layout is easy to edit so you can change the font size, font type, color, and shape conveniently. In addition to this, the PowerPoint layout is Google Slides compatible, so you can share it with your audience and give them access to edit it. Therefore, download and save this well researched data analysis five years procedure roadmap for success slides in different formats like PDF, PNG, and JPG to smoothly execute your business plan.

Customer Relationship Management Dashboard CRM Data Analysis Sample PDF
Deliver an aweinspiring pitch with this creative customer relationship management dashboard crm data analysis sample pdf bundle. Topics like entities by rep, completed activities l, biz notes this month, activity last 3 months, sales last 3 months can be discussed with this completely editable template. It is available for immediate download depending on the needs and requirements of the user.
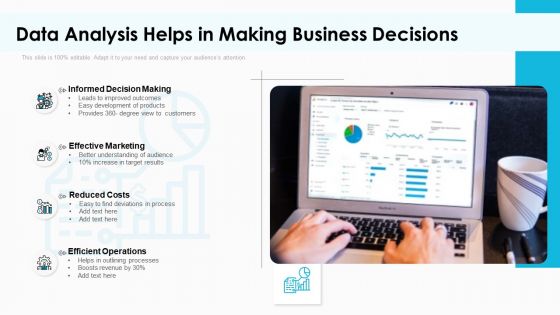
Data Analysis Helps In Making Business Decisions Graphics PDF
Presenting data analysis helps in making business decisions graphics pdf. to dispense important information. This template comprises four stages. It also presents valuable insights into the topics including informed decision making, effective marketing, reduced costs, efficient operations. This is a completely customizable PowerPoint theme that can be put to use immediately. So, download it and address the topic impactfully.
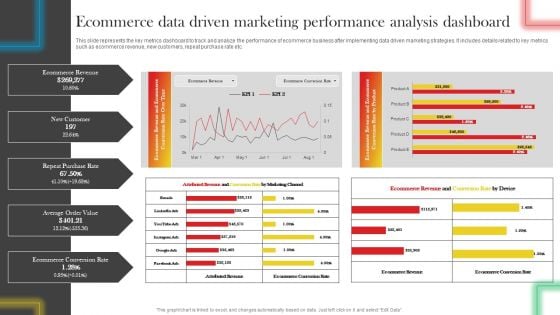
Ecommerce Data Driven Marketing Performance Analysis Dashboard Professional PDF
This slide represents the key metrics dashboard to track and analyze the performance of ecommerce business after implementing data driven marketing strategies. It includes details related to key metrics such as ecommerce revenue, new customers, repeat purchase rate etc. Get a simple yet stunning designed Ecommerce Data Driven Marketing Performance Analysis Dashboard Professional PDF. It is the best one to establish the tone in your meetings. It is an excellent way to make your presentations highly effective. So, download this PPT today from Slidegeeks and see the positive impacts. Our easy-to-edit Ecommerce Data Driven Marketing Performance Analysis Dashboard Professional PDF can be your go-to option for all upcoming conferences and meetings. So, what are you waiting for Grab this template today.
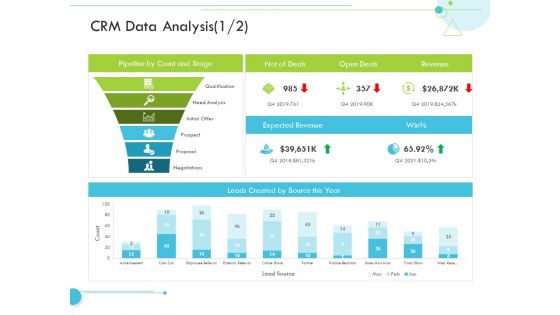
CRM Data Analysis Revenue Customer Relationship Management CRM Infographics PDF
Deliver an awe inspiring pitch with this creative crm data analysis revenue customer relationship management crm infographics pdf bundle. Topics like expected revenue, source can be discussed with this completely editable template. It is available for immediate download depending on the needs and requirements of the user.
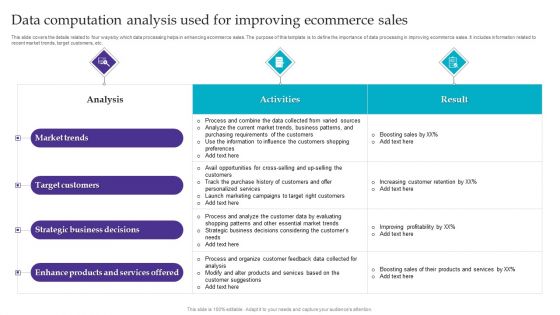
Data Computation Analysis Used For Improving Ecommerce Sales Themes PDF
This slide covers the details related to four ways by which data processing helps in enhancing ecommerce sales. The purpose of this template is to define the importance of data processing in improving ecommerce sales. It includes information related to recent market trends, target customers, etc. Showcasing this set of slides titled Data Computation Analysis Used For Improving Ecommerce Sales Themes PDF. The topics addressed in these templates are Target Customers, Strategic Business Decisions, Market Trends. All the content presented in this PPT design is completely editable. Download it and make adjustments in color, background, font etc. as per your unique business setting.

Managing Customer Experience CRM Data Analysis Sales Pictures PDF
This graph or chart is linked to excel, and changes automatically based on data. Just left click on it and select Edit Data.Deliver and pitch your topic in the best possible manner with this managing customer experience crm data analysis sales pictures pdf. Use them to share invaluable insights on entities by rep, completed activities l, biz notes this month, phone calls last 3 months, activity last 3 months and impress your audience. This template can be altered and modified as per your expectations. So, grab it now.

Quarterly Strategy Roadmap For Data Analysis Integration To Business Themes
Presenting our innovatively-structured quarterly strategy roadmap for data analysis integration to business themes Template. Showcase your roadmap process in different formats like PDF, PNG, and JPG by clicking the download button below. This PPT design is available in both Standard Screen and Widescreen aspect ratios. It can also be easily personalized and presented with modified font size, font type, color, and shapes to measure your progress in a clear way.
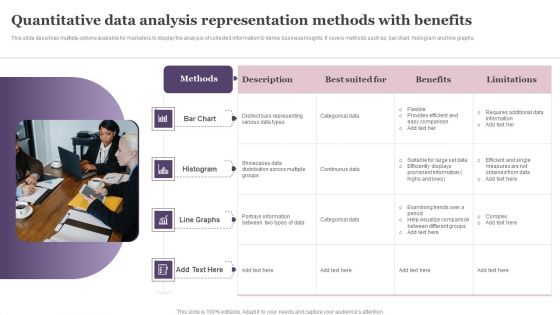
Quantitative Data Analysis Representation Methods With Benefits Template PDF
This slide describes multiple options available for marketers to display the analysis of collected information to derive business insights. It covers methods such as, bar chart, histogram and line graphs. Persuade your audience using this Quantitative Data Analysis Representation Methods With Benefits Template PDF. This PPT design covers four stages, thus making it a great tool to use. It also caters to a variety of topics including Bar Chart, Histogram, Line Graphs. Download this PPT design now to present a convincing pitch that not only emphasizes the topic but also showcases your presentation skills.
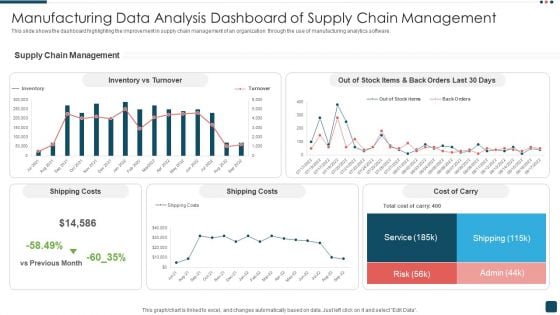
Manufacturing Data Analysis Dashboard Of Supply Chain Management Background PDF
This slide shows the dashboard highlighting the improvement in supply chain management of an organization through the use of manufacturing analytics software. Showcasing this set of slides titled Manufacturing Data Analysis Dashboard Of Supply Chain Management Background PDF. The topics addressed in these templates are Shipping Costs, Service, Risk. All the content presented in this PPT design is completely editable. Download it and make adjustments in color, background, font etc. as per your unique business setting.
Idea Bulb With Pencil For Data Analysis PowerPoint Template
You can download this PowerPoint template for analysis of business data. It contains graphics of bulb with pencil. Draw an innovative business idea using t his diagram.
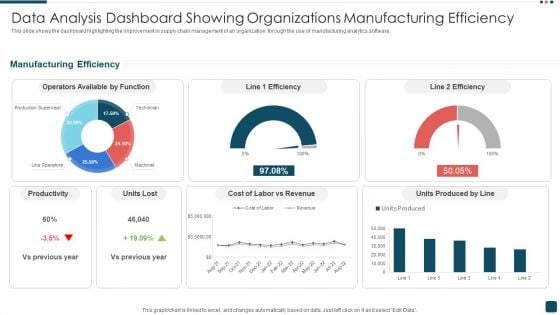
Data Analysis Dashboard Showing Organizations Manufacturing Efficiency Demonstration PDF
This slide shows the dashboard highlighting the improvement in supply chain management of an organization through the use of manufacturing analytics software. Pitch your topic with ease and precision using this Data Analysis Dashboard Showing Organizations Manufacturing Efficiency Demonstration PDF. This layout presents information on Productivity, Revenue, Manufacturing Efficiency. It is also available for immediate download and adjustment. So, changes can be made in the color, design, graphics or any other component to create a unique layout.
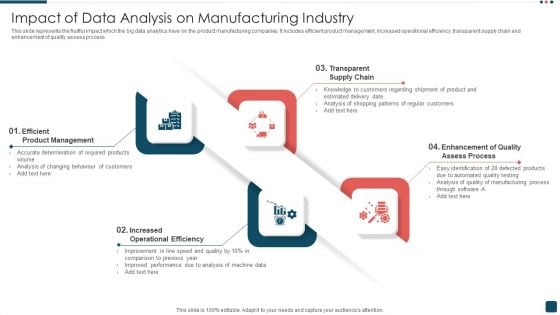
Impact Of Data Analysis On Manufacturing Industry Clipart PDF
This slide represents the fruitful impact which the big data analytics have on the product manufacturing companies. It includes efficient product management, increased operational efficiency, transparent supply chain and enhancement of quality assess process. Presenting Impact Of Data Analysis On Manufacturing Industry Clipart PDF to dispense important information. This template comprises four stages. It also presents valuable insights into the topics including Transparent Supply Chain, Enhancement Of Quality, Increased Operational Efficiency. This is a completely customizable PowerPoint theme that can be put to use immediately. So, download it and address the topic impactfully.
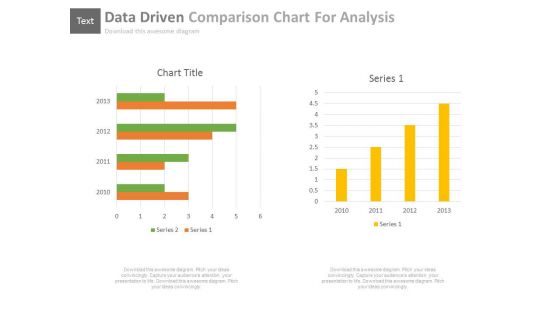
Data Driven Comparison Charts For Analysis Powerpoint Slides
You can download this PowerPoint template to display statistical data and analysis. This PPT slide contains data driven comparison charts. Draw an innovative business idea using this professional diagram.
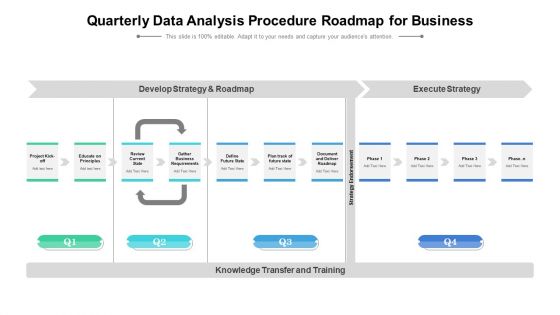
Quarterly Data Analysis Procedure Roadmap For Business Elements
Presenting our innovatively structured quarterly data analysis procedure roadmap for business elements Template. Showcase your roadmap process in different formats like PDF, PNG, and JPG by clicking the download button below. This PPT design is available in both Standard Screen and Widescreen aspect ratios. It can also be easily personalized and presented with modified font size, font type, color, and shapes to measure your progress in a clear way.
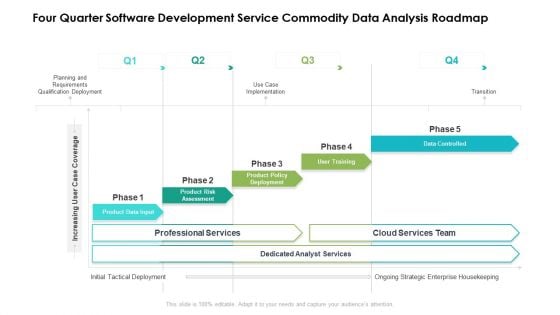
Four Quarter Software Development Service Commodity Data Analysis Roadmap Brochure
Presenting our innovatively structured four quarter software development service commodity data analysis roadmap brochure Template. Showcase your roadmap process in different formats like PDF, PNG, and JPG by clicking the download button below. This PPT design is available in both Standard Screen and Widescreen aspect ratios. It can also be easily personalized and presented with modified font size, font type, color, and shapes to measure your progress in a clear way.
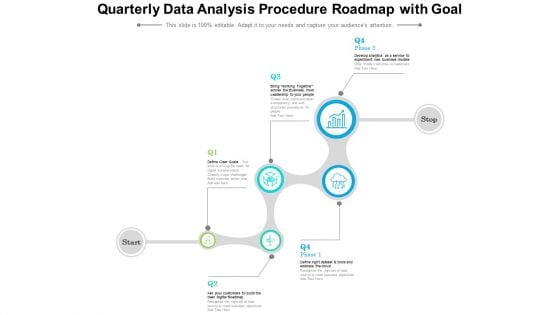
Quarterly Data Analysis Procedure Roadmap With Goal Summary
Introducing our quarterly data analysis procedure roadmap with goal summary. This PPT presentation is Google Slides compatible, therefore, you can share it easily with the collaborators for measuring the progress. Also, the presentation is available in both standard screen and widescreen aspect ratios. So edit the template design by modifying the font size, font type, color, and shapes as per your requirements. As this PPT design is fully editable it can be presented in PDF, JPG and PNG formats.
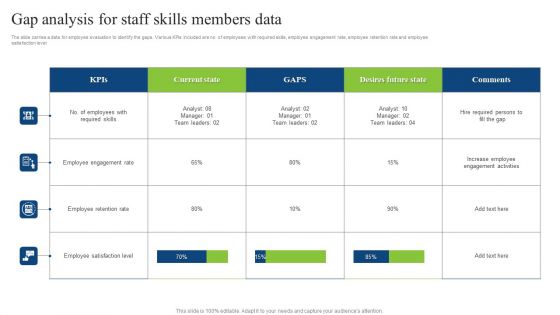
Gap Analysis For Staff Skills Members Data Guidelines PDF
The slide carries a data for employee evaluation to identify the gaps. Various KPIs included are no. of employees with required skills, employee engagement rate, employee retention rate and employee satisfaction level. Showcasing this set of slides titled Gap Analysis For Staff Skills Members Data Guidelines PDF. The topics addressed in these templates are Employee Engagement Rate, Employee Retention Rate. All the content presented in this PPT design is completely editable. Download it and make adjustments in color, background, font etc. as per your unique business setting.
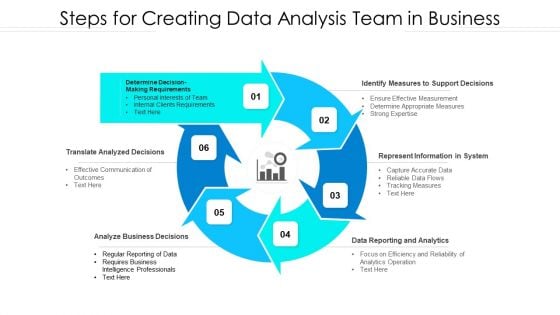
Steps For Creating Data Analysis Team In Business Information PDF
Presenting steps for creating data analysis team in business information pdf. to dispense important information. This template comprises six stages. It also presents valuable insights into the topics including translate analyzed decisions analyze, business decisions, identify measures to support decisions, represent information in system. This is a completely customizable PowerPoint theme that can be put to use immediately. So, download it and address the topic impactfully.
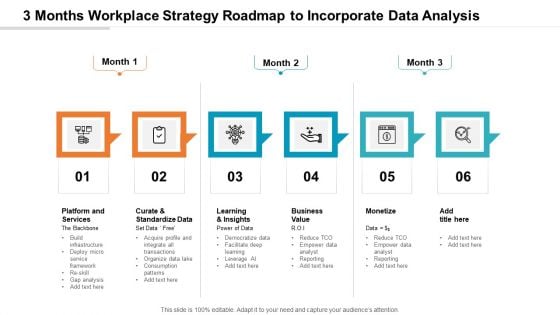
3 Months Workplace Strategy Roadmap To Incorporate Data Analysis Slides
Presenting our jaw-dropping 3 months workplace strategy roadmap to incorporate data analysis slides. You can alternate the color, font size, font type, and shapes of this PPT layout according to your strategic process. This PPT presentation is compatible with Google Slides and is available in both standard screen and widescreen aspect ratios. You can also download this well-researched PowerPoint template design in different formats like PDF, JPG, and PNG. So utilize this visually-appealing design by clicking the download button given below.
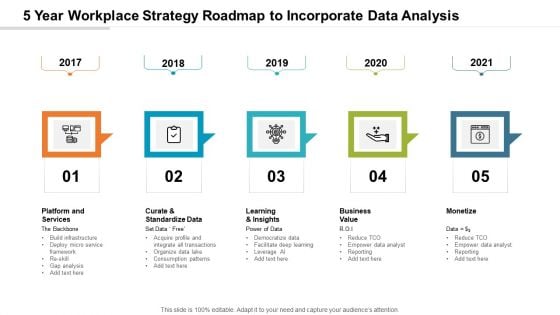
5 Year Workplace Strategy Roadmap To Incorporate Data Analysis Slides
Presenting our jaw-dropping 5 year workplace strategy roadmap to incorporate data analysis slides. You can alternate the color, font size, font type, and shapes of this PPT layout according to your strategic process. This PPT presentation is compatible with Google Slides and is available in both standard screen and widescreen aspect ratios. You can also download this well-researched PowerPoint template design in different formats like PDF, JPG, and PNG. So utilize this visually-appealing design by clicking the download button given below.
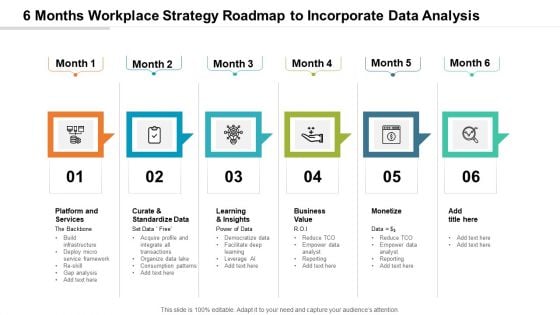
6 Months Workplace Strategy Roadmap To Incorporate Data Analysis Structure
Presenting our jaw-dropping 6 months workplace strategy roadmap to incorporate data analysis structure. You can alternate the color, font size, font type, and shapes of this PPT layout according to your strategic process. This PPT presentation is compatible with Google Slides and is available in both standard screen and widescreen aspect ratios. You can also download this well-researched PowerPoint template design in different formats like PDF, JPG, and PNG. So utilize this visually-appealing design by clicking the download button given below.
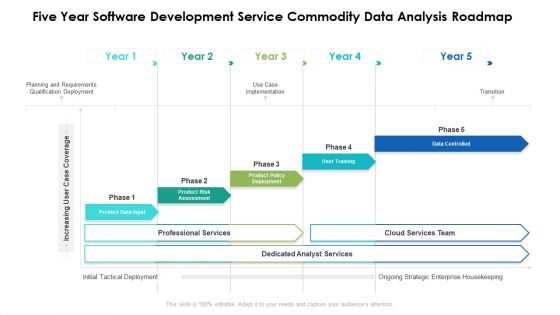
Five Year Software Development Service Commodity Data Analysis Roadmap Clipart
Presenting our innovatively structured five year software development service commodity data analysis roadmap clipart Template. Showcase your roadmap process in different formats like PDF, PNG, and JPG by clicking the download button below. This PPT design is available in both Standard Screen and Widescreen aspect ratios. It can also be easily personalized and presented with modified font size, font type, color, and shapes to measure your progress in a clear way.
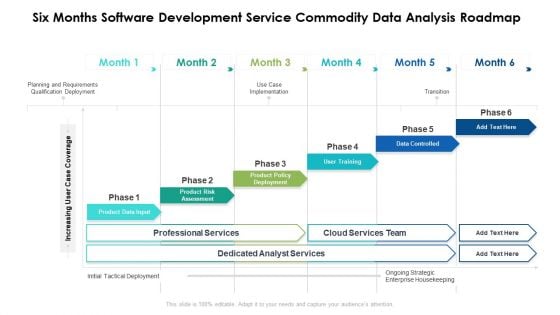
Six Months Software Development Service Commodity Data Analysis Roadmap Introduction
Presenting our innovatively structured six months software development service commodity data analysis roadmap introduction Template. Showcase your roadmap process in different formats like PDF, PNG, and JPG by clicking the download button below. This PPT design is available in both Standard Screen and Widescreen aspect ratios. It can also be easily personalized and presented with modified font size, font type, color, and shapes to measure your progress in a clear way.
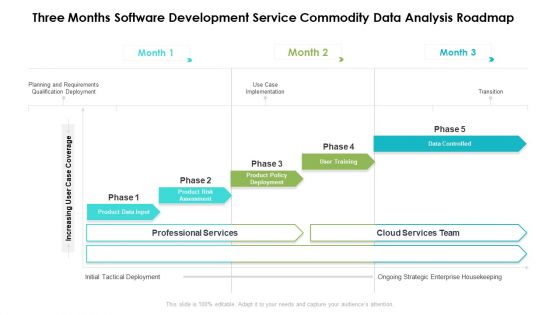
Three Months Software Development Service Commodity Data Analysis Roadmap Clipart
Presenting our innovatively structured three months software development service commodity data analysis roadmap clipart Template. Showcase your roadmap process in different formats like PDF, PNG, and JPG by clicking the download button below. This PPT design is available in both Standard Screen and Widescreen aspect ratios. It can also be easily personalized and presented with modified font size, font type, color, and shapes to measure your progress in a clear way.
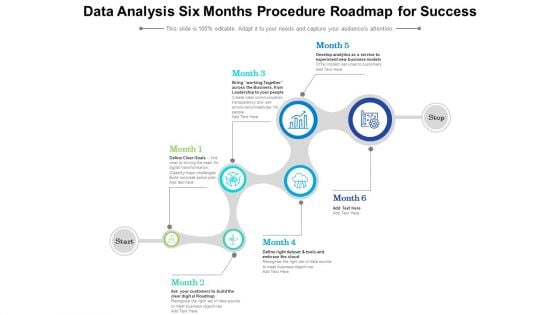
Data Analysis Six Months Procedure Roadmap For Success Ideas
Presenting our innovatively structured data analysis six months procedure roadmap for success ideas Template. Showcase your roadmap process in different formats like PDF, PNG, and JPG by clicking the download button below. This PPT design is available in both Standard Screen and Widescreen aspect ratios. It can also be easily personalized and presented with modified font size, font type, color, and shapes to measure your progress in a clear way.
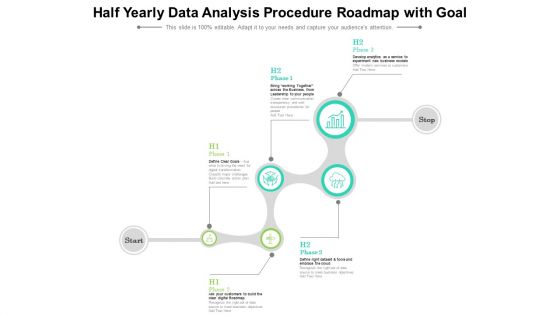
Half Yearly Data Analysis Procedure Roadmap With Goal Summary
Introducing our half yearly data analysis procedure roadmap with goal summary. This PPT presentation is Google Slides compatible, therefore, you can share it easily with the collaborators for measuring the progress. Also, the presentation is available in both standard screen and widescreen aspect ratios. So edit the template design by modifying the font size, font type, color, and shapes as per your requirements. As this PPT design is fully editable it can be presented in PDF, JPG and PNG formats.
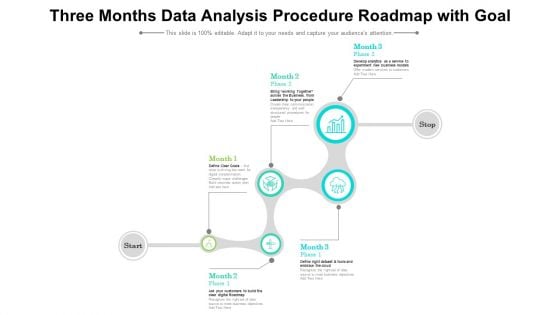
Three Months Data Analysis Procedure Roadmap With Goal Formats
Presenting our innovatively structured three months data analysis procedure roadmap with goal formats Template. Showcase your roadmap process in different formats like PDF, PNG, and JPG by clicking the download button below. This PPT design is available in both Standard Screen and Widescreen aspect ratios. It can also be easily personalized and presented with modified font size, font type, color, and shapes to measure your progress in a clear way.
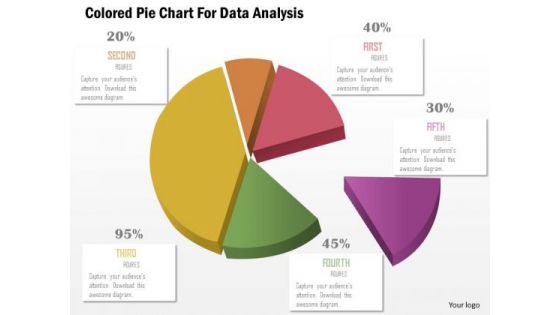
Business Diagram Colored Pie Chart For Data Analysis Presentation Template
This business slide displays pie chart. This diagram is a data visualization tool that gives you a simple way to present statistical information. This slide helps your audience examine and interpret the data you present.
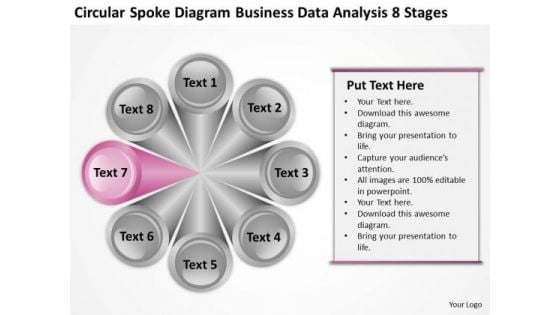
Spoke Diagram Business Data Analysis 8 Stages Plan PowerPoint Templates
We present our spoke diagram business data analysis 8 stages plan PowerPoint templates.Present our Finance PowerPoint Templates because You can Double your output with our PowerPoint Templates and Slides. They make beating deadlines a piece of cake. Download our Leadership PowerPoint Templates because Our PowerPoint Templates and Slides are aesthetically designed to attract attention. We gaurantee that they will grab all the eyeballs you need. Download our Circle Charts PowerPoint Templates because Our PowerPoint Templates and Slides will let your words and thoughts hit bullseye everytime. Use our Business PowerPoint Templates because It will mark the footprints of your journey. Illustrate how they will lead you to your desired destination. Use our Process and Flows PowerPoint Templates because Our PowerPoint Templates and Slides offer you the widest possible range of options.Use these PowerPoint slides for presentations relating to Chart, segmented, pie, hub, wheel, isolated, divided, business, communication, diagram, circle, graphic, process, element, tire, graph, marketing, illustration, icon, circular, round, clipart, design, success, set, spoke, button. The prominent colors used in the PowerPoint template are Purple, White, Gray. Ideas flow from our Spoke Diagram Business Data Analysis 8 Stages Plan PowerPoint Templates. They have the ability to be creative.
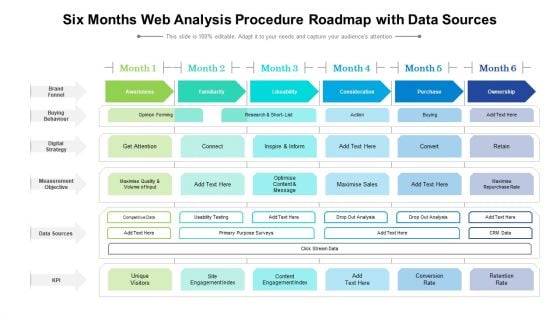
Six Months Web Analysis Procedure Roadmap With Data Sources Diagrams
Presenting our jaw dropping six months web analysis procedure roadmap with data sources diagrams. You can alternate the color, font size, font type, and shapes of this PPT layout according to your strategic process. This PPT presentation is compatible with Google Slides and is available in both standard screen and widescreen aspect ratios. You can also download this well researched PowerPoint template design in different formats like PDF, JPG, and PNG. So utilize this visually appealing design by clicking the download button given below.
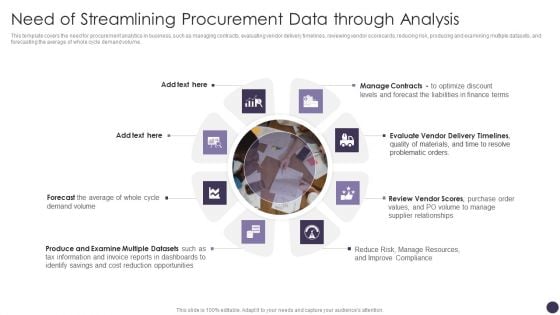
Need Of Streamlining Procurement Data Through Analysis Themes PDF
This template covers the need for procurement analytics in business, such as managing contracts, evaluating vendor delivery timelines, reviewing vendor scorecards, reducing risk, producing and examining multiple datasets, and forecasting the average of whole cycle demand volume. This is a Need Of Streamlining Procurement Data Through Analysis Themes PDF template with various stages. Focus and dispense information on eight stages using this creative set, that comes with editable features. It contains large content boxes to add your information on topics like Manage Contracts, Forecast The Liabilities, Problematic Orders. You can also showcase facts, figures, and other relevant content using this PPT layout. Grab it now.
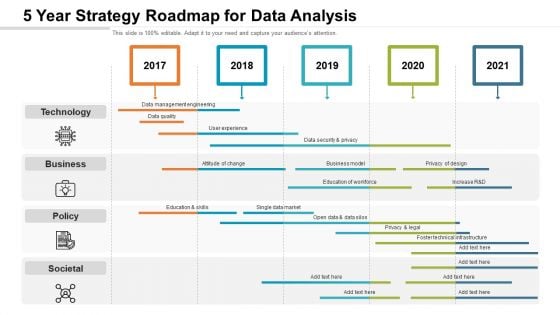
5 Year Strategy Roadmap For Data Analysis Diagrams
Presenting the 5 year strategy roadmap for data analysis diagrams. The template includes a roadmap that can be used to initiate a strategic plan. Not only this, the PowerPoint slideshow is completely editable and you can effortlessly modify the font size, font type, and shapes according to your needs. This PPT slide can be easily reached in standard screen and widescreen aspect ratios. The set is also available in various formats like PDF, PNG, and JPG. So download and use it multiple times as per your knowledge.
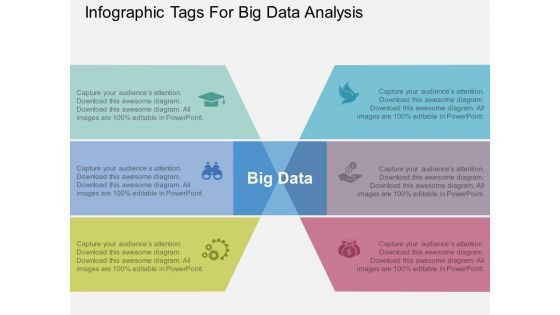
Infographic Tags For Big Data Analysis Powerpoint Template
Infographic tags have been displayed in this business slide. This PowerPoint template helps to exhibit big data analysis. Use this diagram to build an exclusive presentation.
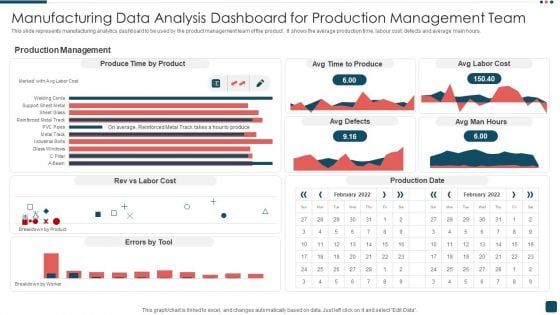
Manufacturing Data Analysis Dashboard For Production Management Team Summary PDF
This slide represents manufacturing analytics dashboard to be used by the product management team of the product . It shows the average production time, labour cost, defects and average main hours. Pitch your topic with ease and precision using this Manufacturing Data Analysis Dashboard For Production Management Team Summary PDF. This layout presents information on Production Management, Product, Cost. It is also available for immediate download and adjustment. So, changes can be made in the color, design, graphics or any other component to create a unique layout.
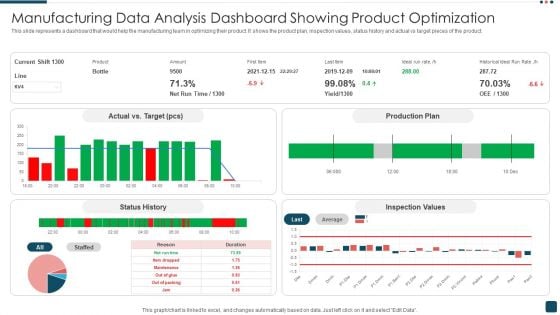
Manufacturing Data Analysis Dashboard Showing Product Optimization Structure PDF
This slide represents a dashboard that would help the manufacturing team in optimizing their product. It shows the product plan, inspection values, status history and actual vs target pieces of the product. Pitch your topic with ease and precision using this Manufacturing Data Analysis Dashboard Showing Product Optimization Structure PDF. This layout presents information on Target, Production Plan, Inspection Values. It is also available for immediate download and adjustment. So, changes can be made in the color, design, graphics or any other component to create a unique layout.
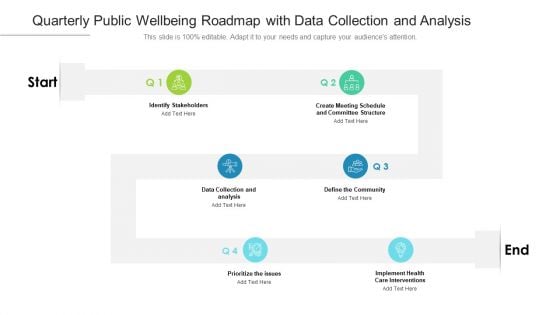
Quarterly Public Wellbeing Roadmap With Data Collection And Analysis Clipart
Presenting the quarterly public wellbeing roadmap with data collection and analysis clipart. The template includes a roadmap that can be used to initiate a strategic plan. Not only this, the PowerPoint slideshow is completely editable and you can effortlessly modify the font size, font type, and shapes according to your needs. This PPT slide can be easily reached in standard screen and widescreen aspect ratios. The set is also available in various formats like PDF, PNG, and JPG. So download and use it multiple times as per your knowledge.
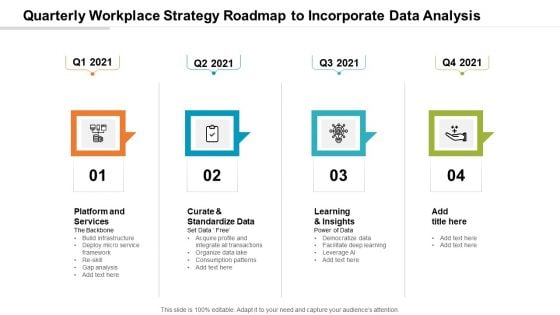
Quarterly Workplace Strategy Roadmap To Incorporate Data Analysis Download
Presenting the quarterly workplace strategy roadmap to incorporate data analysis download. The template includes a roadmap that can be used to initiate a strategic plan. Not only this, the PowerPoint slideshow is completely editable and you can effortlessly modify the font size, font type, and shapes according to your needs. This PPT slide can be easily reached in standard screen and widescreen aspect ratios. The set is also available in various formats like PDF, PNG, and JPG. So download and use it multiple times as per your knowledge.
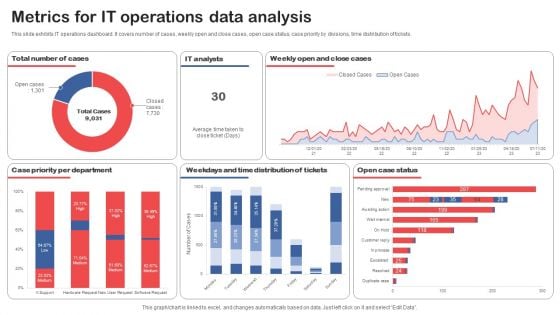
Metrics For IT Operations Data Analysis Topics PDF
This slide exhibits IT operations dashboard. It covers number of cases, weekly open and close cases, open case status, case priority by divisions, time distribution of tickets. Pitch your topic with ease and precision using this Metrics For IT Operations Data Analysis Topics PDF. This layout presents information on Case Priority Per Department, Distribution Of Tickets, Open Case Status. It is also available for immediate download and adjustment. So, changes can be made in the color, design, graphics or any other component to create a unique layout.
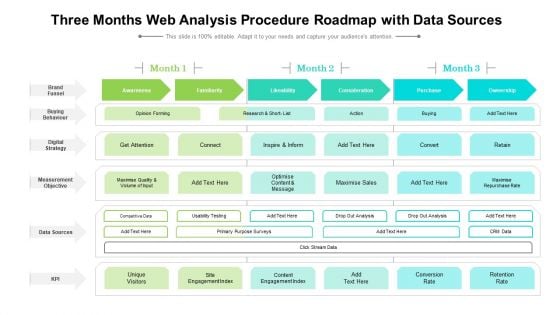
Three Months Web Analysis Procedure Roadmap With Data Sources Guidelines
Presenting our jaw dropping three months web analysis procedure roadmap with data sources guidelines. You can alternate the color, font size, font type, and shapes of this PPT layout according to your strategic process. This PPT presentation is compatible with Google Slides and is available in both standard screen and widescreen aspect ratios. You can also download this well researched PowerPoint template design in different formats like PDF, JPG, and PNG. So utilize this visually appealing design by clicking the download button given below.
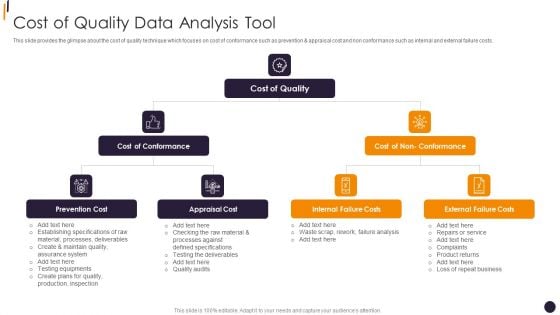
PMP Tools Cost Of Quality Data Analysis Tool Infographics PDF
This slide provides the glimpse about the cost of quality technique which focuses on cost of conformance such as prevention and appraisal cost and non conformance such as internal and external failure costs.Presenting PMP Tools Cost Of Quality Data Analysis Tool Infographics PDF to provide visual cues and insights. Share and navigate important information on six stages that need your due attention. This template can be used to pitch topics like Cost Of Conformance, Appraisal Cost, Prevention Cost In addtion, this PPT design contains high resolution images, graphics, etc, that are easily editable and available for immediate download.
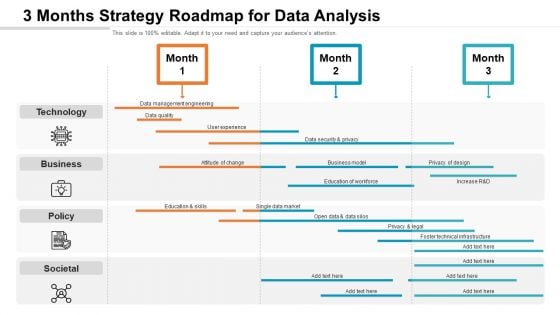
3 Months Strategy Roadmap For Data Analysis Pictures
Presenting the 3 months strategy roadmap for data analysis pictures. The template includes a roadmap that can be used to initiate a strategic plan. Not only this, the PowerPoint slideshow is completely editable and you can effortlessly modify the font size, font type, and shapes according to your needs. This PPT slide can be easily reached in standard screen and widescreen aspect ratios. The set is also available in various formats like PDF, PNG, and JPG. So download and use it multiple times as per your knowledge.
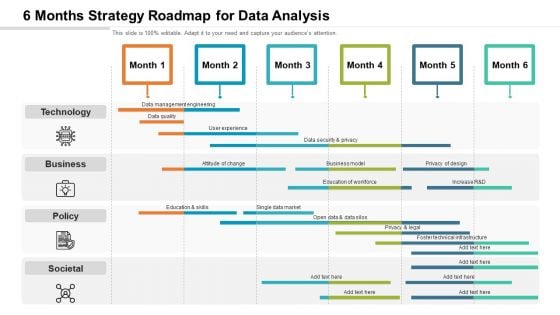
6 Months Strategy Roadmap For Data Analysis Demonstration
Presenting the 6 months strategy roadmap for data analysis demonstration. The template includes a roadmap that can be used to initiate a strategic plan. Not only this, the PowerPoint slideshow is completely editable and you can effortlessly modify the font size, font type, and shapes according to your needs. This PPT slide can be easily reached in standard screen and widescreen aspect ratios. The set is also available in various formats like PDF, PNG, and JPG. So download and use it multiple times as per your knowledge.
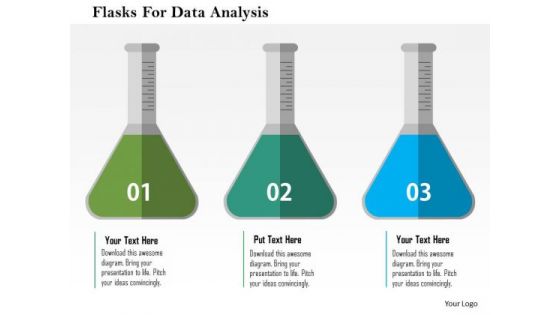
Business Diagram Flasks For Data Analysis Presentation Template
This business diagram displays three flasks. You may use this slide for data analysis. Make your mark with this unique slide. Create an impression that will endure.
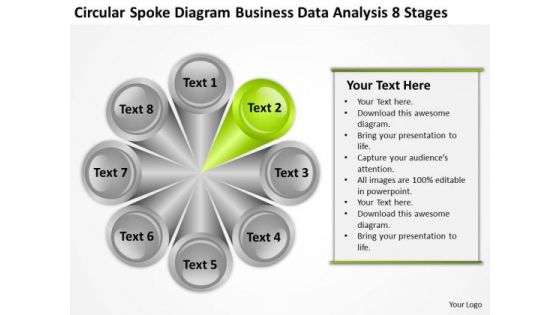
Business Data Analysis 8 Stages Ppt Plan Example PowerPoint Templates
We present our business data analysis 8 stages ppt plan example PowerPoint templates.Download and present our Process and Flows PowerPoint Templates because Our PowerPoint Templates and Slides will bullet point your ideas. See them fall into place one by one. Download our Circle Charts PowerPoint Templates because These PowerPoint Templates and Slides will give the updraft to your ideas. See them soar to great heights with ease. Present our Shapes PowerPoint Templates because Our PowerPoint Templates and Slides help you meet the demand of the Market. Just browse and pick the slides that appeal to your intuitive senses. Download our Flow Charts PowerPoint Templates because Our PowerPoint Templates and Slides are created by a hardworking bunch of busybees. Always flitting around with solutions gauranteed to please. Use our Business PowerPoint Templates because Our PowerPoint Templates and Slides will bullet point your ideas. See them fall into place one by one.Use these PowerPoint slides for presentations relating to Abstract, business, catalog, chart, circle, colors, cross, demonstration, description, design, diagram, futuristic, glossy, goals,illustration, information, interface, internet, isolated, level, list, marketing, model, multiple, navigation, network, pattern, presentation, registry, report, space, sphere, statement, statistics, steps, structure, wheel. The prominent colors used in the PowerPoint template are Gray, Green, White. Our Business Data Analysis 8 Stages Ppt Plan Example PowerPoint Templates offer easy availability and access. You will find them always around.
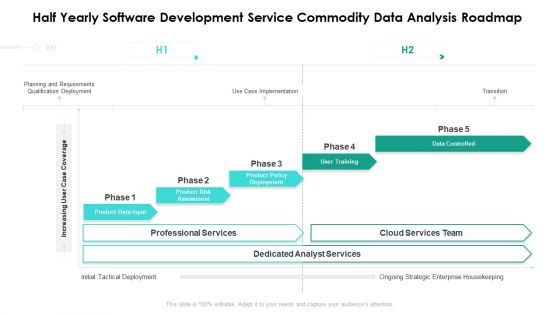
Half Yearly Software Development Service Commodity Data Analysis Roadmap Rules
Presenting the half yearly software development service commodity data analysis roadmap rules. The template includes a roadmap that can be used to initiate a strategic plan. Not only this, the PowerPoint slideshow is completely editable and you can effortlessly modify the font size, font type, and shapes according to your needs. This PPT slide can be easily reached in standard screen and widescreen aspect ratios. The set is also available in various formats like PDF, PNG, and JPG. So download and use it multiple times as per your knowledge.
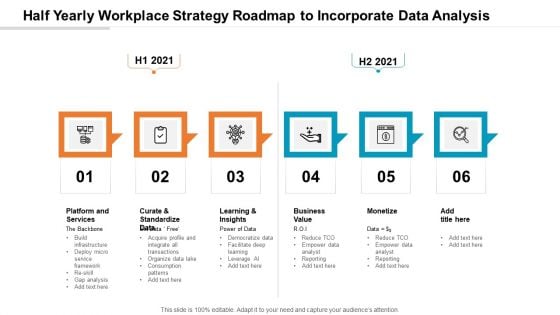
Half Yearly Workplace Strategy Roadmap To Incorporate Data Analysis Demonstration
Presenting the half yearly workplace strategy roadmap to incorporate data analysis demonstration. The template includes a roadmap that can be used to initiate a strategic plan. Not only this, the PowerPoint slideshow is completely editable and you can effortlessly modify the font size, font type, and shapes according to your needs. This PPT slide can be easily reached in standard screen and widescreen aspect ratios. The set is also available in various formats like PDF, PNG, and JPG. So download and use it multiple times as per your knowledge.
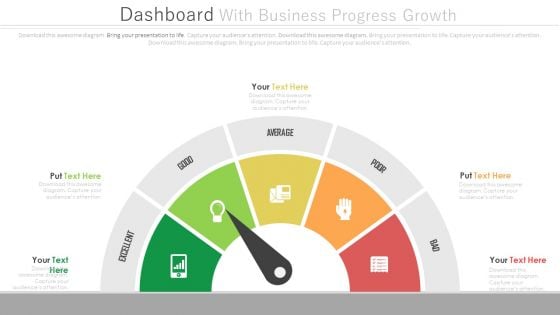
Dashboard To Simplify Business Data Analysis Powerpoint Slides
This PowerPoint template graphics of meter chart. Download this PPT chart to simplify business data analysis. This PowerPoint slide is of great help in the business sector to make realistic presentations and provides effective way of presenting your newer thoughts.
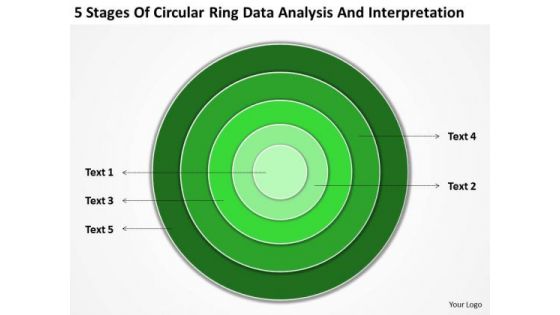
Ring Data Analysis And Interpretation Business Plan Template PowerPoint Templates
We present our ring data analysis and interpretation business plan template PowerPoint templates.Present our Circle Charts PowerPoint Templates because Our PowerPoint Templates and Slides are a sure bet. Gauranteed to win against all odds. Download and present our Business PowerPoint Templates because you should once Tap the ingenuity of our PowerPoint Templates and Slides. They are programmed to succeed. Download our Shapes PowerPoint Templates because Our PowerPoint Templates and Slides are truly out of this world. Even the MIB duo has been keeping tabs on our team. Present our Signs PowerPoint Templates because They will Put your wonderful verbal artistry on display. Our PowerPoint Templates and Slides will provide you the necessary glam and glitter. Download our Metaphors-Visual Concepts PowerPoint Templates because Our PowerPoint Templates and Slides are Clear and concise. Use them and dispel any doubts your team may have.Use these PowerPoint slides for presentations relating to metal, wallpaper, decoration, chrome, vivid, blank, glossy, bright, template, curvy, copyspace, circle, light, decor, element, digital, card, simple, wavy, shape, abstract, wave, modern, creative, circular, round, shiny, backdrop, reflection, design, abstraction, gold, cover, color, colorful, empty, picture, banner, twirl, art, golden, background, border, vortex. The prominent colors used in the PowerPoint template are Green dark , Green, Green lime . Carry your team with our Ring Data Analysis And Interpretation Business Plan Template PowerPoint Templates. You will come out on top.
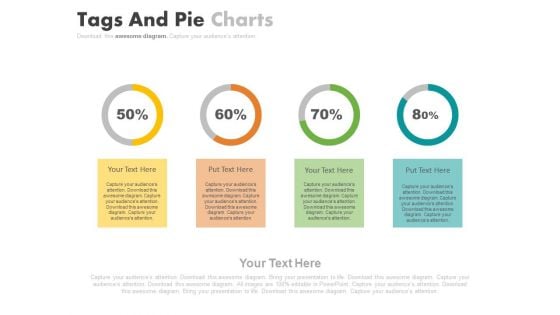
Four Steps For Financial Data Analysis Powerpoint Slides
This PowerPoint contains four circles with percentage values. Download this diagram slide to display financial data analysis. This template is editable, You can edit text, color, shade and style of this diagram as per you need.
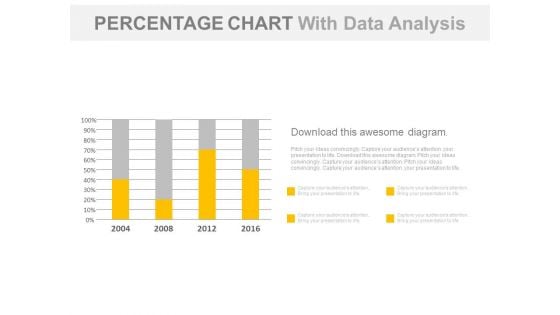
Year Based Chart With Percentage Data Analysis Powerpoint Slides
Our above business slide contains year based statistical chart. This PowerPoint template can be used to display percentage data analysis. Capture the attention of your audience with this slide.

Business Man Draws Financial Data For Analysis PowerPoint Templates
This PowerPoint slide has a theme for financial data analysis. This image has been designed to display concept of financial planning and analysis. Deliver amazing presentations to mesmerize your audience using this image
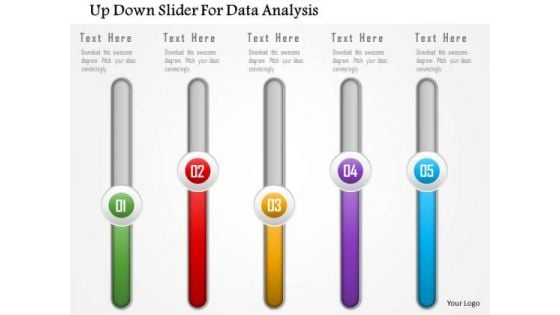
Business Diagram Up Down Slider For Data Analysis Presentation Template
This business diagram has been designed with graphics of slider. You may download this professional slide to display data trends. Transmit your thoughts via this slide.
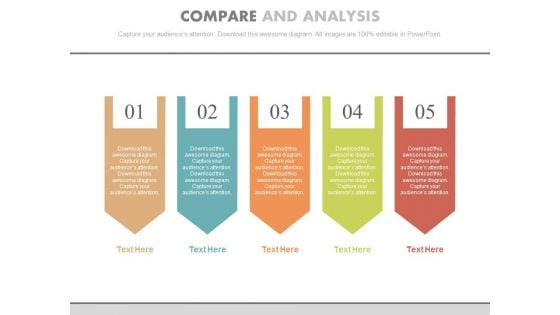
Five Steps For Data Compare And Analysis Powerpoint Template
Our above slide contains graphics of five steps chart. This PowerPoint template is useful for data compare and analysis. Use this diagram to impart more clarity to subject and to create more sound impact on viewers.


 Continue with Email

 Home
Home


