Data Analysis Icon
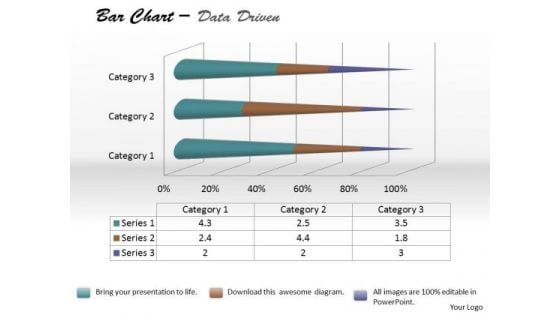
Data Analysis Bar Chart For Foreign Trade PowerPoint Templates
Be The Doer With Our data analysis bar chart for foreign trade Powerpoint Templates. Put Your Thoughts Into Practice.
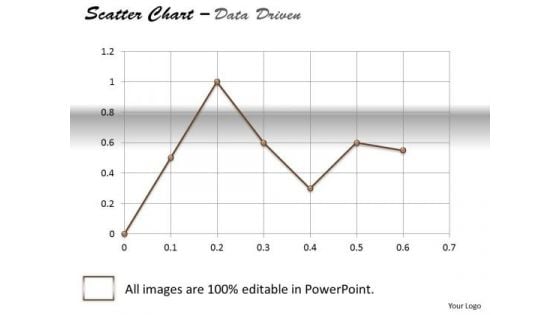
Data Analysis Excel Business Tool Scatter Chart PowerPoint Templates
Dominate Proceedings With Your Ideas. Our data analysis excel business tool scatter chart Powerpoint Templates Will Empower Your Thoughts.
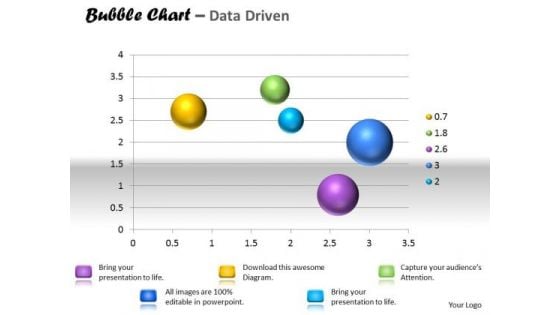
Data Analysis Template Interactive Bubble Chart PowerPoint Templates
Our data analysis template interactive bubble chart Powerpoint Templates Are A Wonder Drug. They Help Cure Almost Any Malaise.
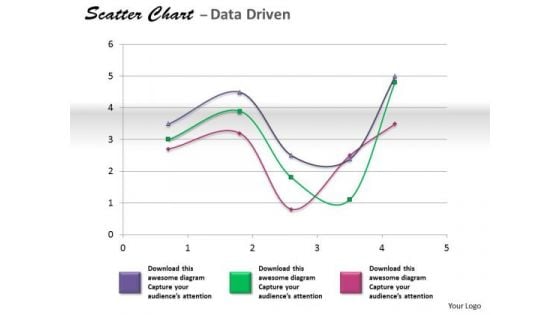
Financial Data Analysis Coordinate With Scatter Chart PowerPoint Templates
Get The Doers Into Action. Activate Them With Our financial data analysis coordinate with scatter chart Powerpoint Templates .
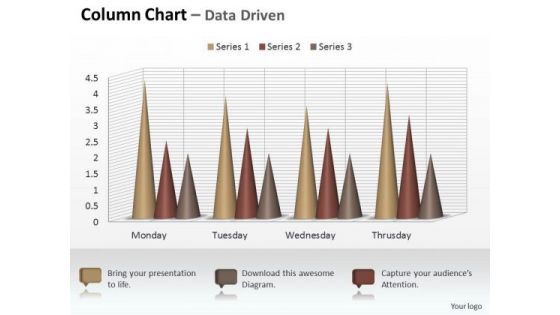
Marketing Data Analysis 3d Sets Of Column Chart PowerPoint Templates
Your Listeners Will Never Doodle. Our marketing data analysis 3d sets of column chart Powerpoint Templates Will Hold Their Concentration.
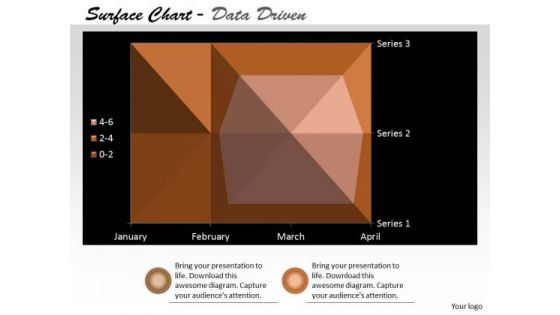
Multivariate Data Analysis Surface Chart Plots Trends PowerPoint Templates
Our multivariate data analysis surface chart plots trends Powerpoint Templates Heighten Concentration. Your Audience Will Be On The Edge.
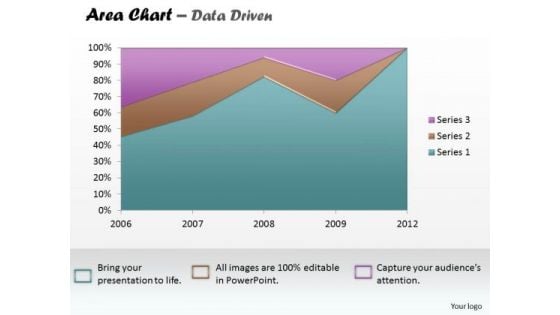
Data Analysis Excel Business Reporting Area Chart PowerPoint Templates
Establish The Dominance Of Your Ideas. Our data analysis excel business reporting area chart Powerpoint Templates Will Put Them On Top.
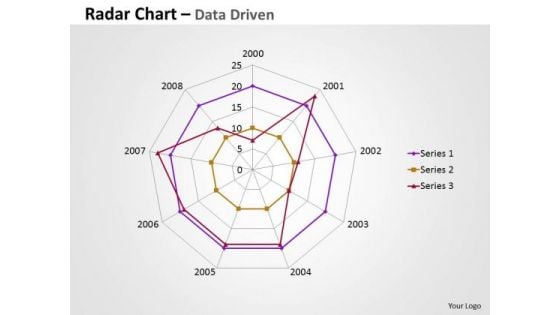
Business Data Analysis Chart Comparing Multiple Entities PowerPoint Templates
Analyze Ailments On Our business data analysis chart comparing multiple entities Powerpoint Templates. Bring Out The Thinking Doctor In You. Dock Your Thoughts With Our Financial Analysis . They Will Launch Them Into Orbit.
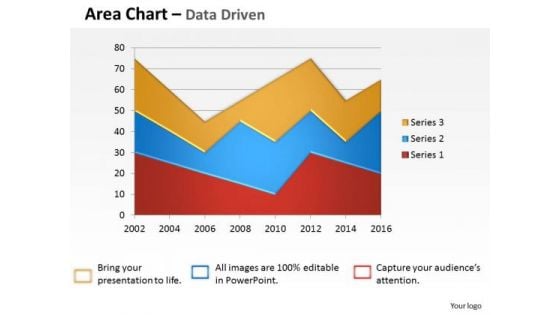
Data Analysis Template Driven Visualization Area Chart PowerPoint Slides Templates
Draw On The Energy Of Our data analysis template driven visualization area chart powerpoint slides Templates . Your Thoughts Will Perk Up.
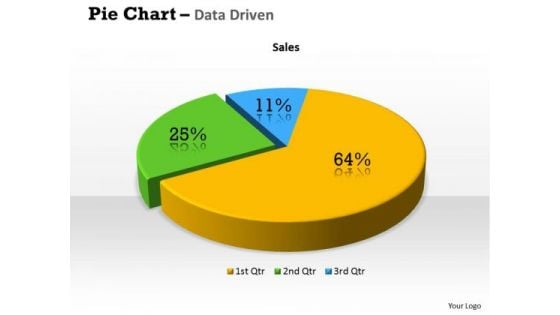
Quantitative Data Analysis 3d Percentage Ratio Pie Chart PowerPoint Templates
Plan Your Storyboard With Our quantitative data analysis 3d percentage ratio pie chart Powerpoint Templates . Give An Outline To The Solutions You Have.
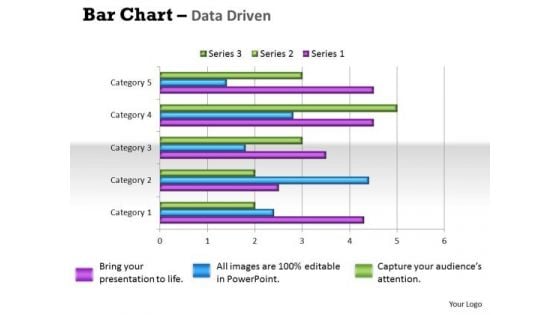
Quantitative Data Analysis Bar Chart For Different Categories PowerPoint Templates
Make Some Dough With Our quantitative data analysis bar chart for different categories Powerpoint Templates . Your Assets Will Rise Significantly.
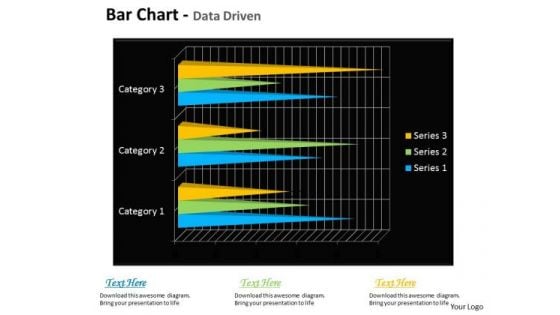
Quantitative Data Analysis Bar Chart For Financial Markets PowerPoint Templates
Draft It Out On Our quantitative data analysis bar chart for financial markets Powerpoint Templates . Give The Final Touches With Your Ideas.
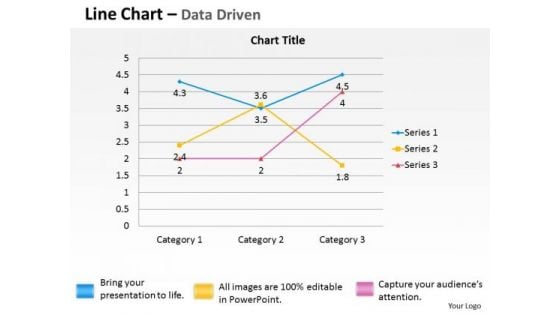
Quantitative Data Analysis Driven Economic Line Chart PowerPoint Slides Templates
Break The Deadlock With Our quantitative data analysis driven economic line chart powerpoint slides Templates . Let The Words Start To Flow.
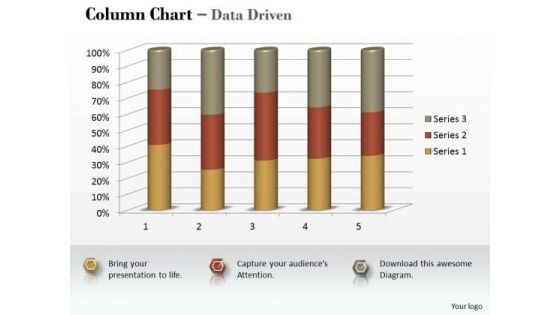
Marketing Data Analysis 3d Statistical Process Column Chart PowerPoint Templates
Be A Donor Of Great Ideas. Display Your Charity On Our marketing data analysis 3d statistical process column chart Powerpoint Templates .
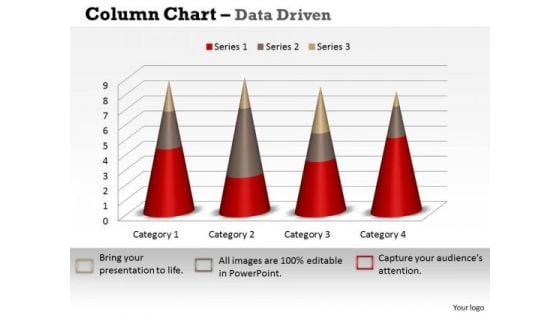
Marketing Data Analysis 3d Statistical Process Control Chart PowerPoint Templates
Open Up Doors That Lead To Success. Our marketing data analysis 3d statistical process control chart Powerpoint Templates Provide The Handles.
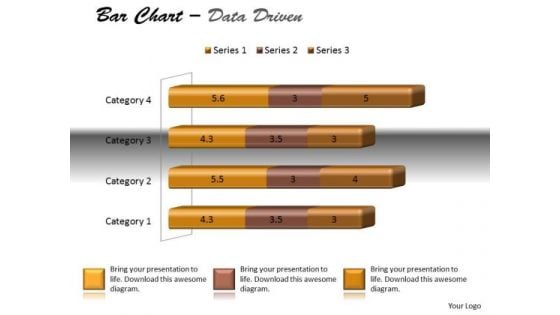
Data Analysis Techniques 3d Bar Chart For Modification PowerPoint Templates
Dreams Generate Thoughts, Thoughts Generate Ideas. Give Them Life With Our data analysis techniques 3d bar chart for modification Powerpoint Templates .
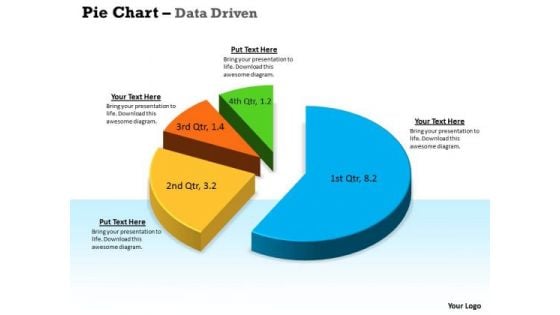
Data Analysis Techniques 3d In Segments Pie Chart PowerPoint Templates
Drink To The Success Of Your Campaign. Our data analysis techniques 3d in segments pie chart Powerpoint Templates Will Raise A Toast.

Business Data Analysis Chart For Case Studies PowerPoint Templates
Get Out Of The Dock With Our business data analysis chart for case studies Powerpoint Templates. Your Mind Will Be Set Free.
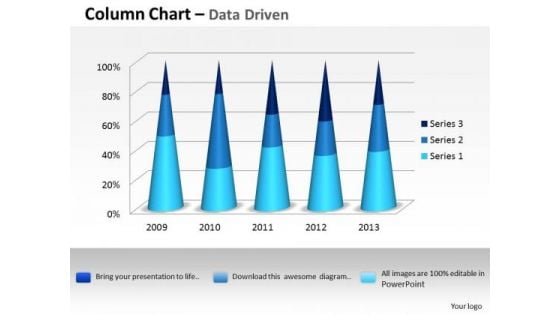
Data Analysis Excel 3d Process Variation Column Chart PowerPoint Templates
Put In A Dollop Of Our data analysis excel 3d process variation column chart Powerpoint Templates. Give Your Thoughts A Distinctive Flavor.
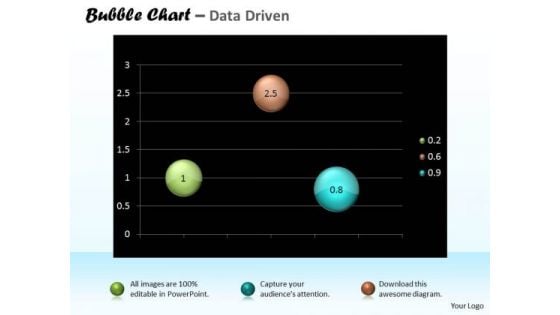
Data Analysis Excel Bubble Chart For Business Tasks PowerPoint Templates
Doll Up Your Thoughts With Our data analysis excel bubble chart for business tasks Powerpoint Templates. They Will Make A Pretty Picture.
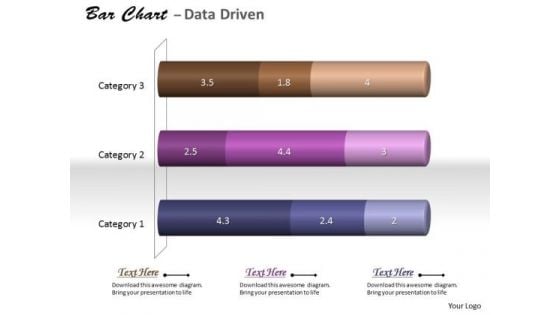
Data Analysis In Excel 3d Classification Of Chart PowerPoint Templates
With Our data analysis in excel 3d classification of chart Powerpoint Templates You Will Be Doubly Sure. They Possess That Stamp Of Authority.
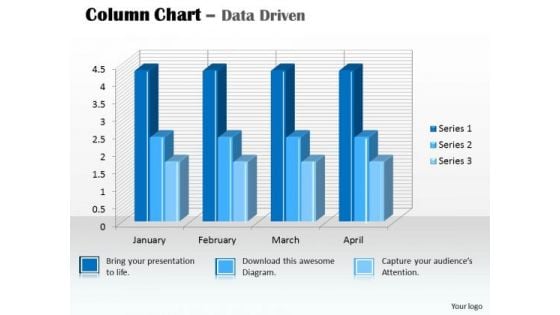
Data Analysis In Excel 3d Column Chart For PowerPoint Templates
Our data analysis in excel 3d column chart for Powerpoint Templates And Your Ideas Make A Great Doubles Pair. Play The Net With Assured Hands.
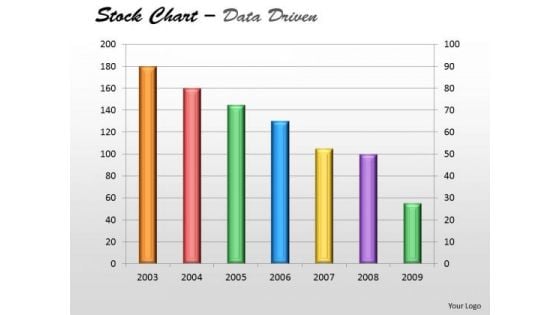
Data Analysis In Excel Of Stock Chart PowerPoint Templates
Plan Your Storyboard With Our data analysis in excel of stock chart Powerpoint Templates . Give An Outline To The Solutions You Have.
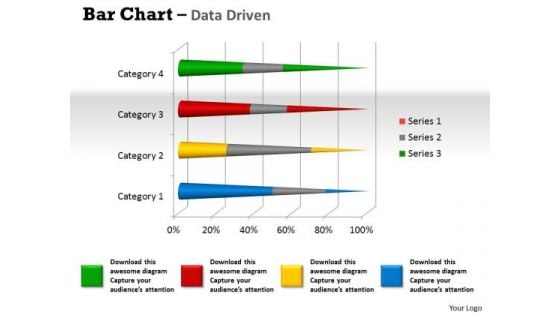
Data Analysis Programs 3d Bar Chart To Dispaly PowerPoint Templates
Lower The Drawbridge With Our data analysis programs 3d bar chart to dispaly Powerpoint Templates . Capture The Minds Of Your Audience.
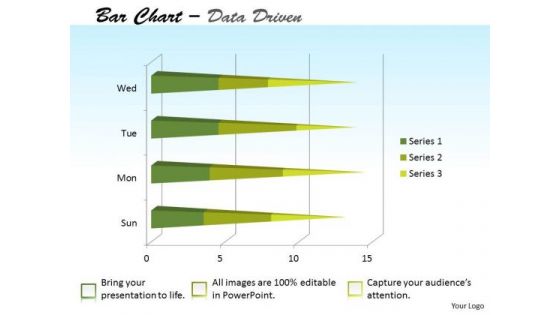
Data Analysis Template Forex Market Bar Chart PowerPoint Templates
Attract A Crowd With Our data analysis template forex market bar chart Powerpoint Templates . They Will Drop It All And Come To Hear You.
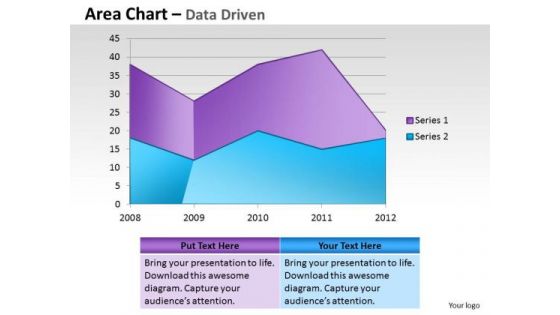
Financial Data Analysis Area Chart For Showing Trends PowerPoint Templates
Document Your Views On Our financial data analysis area chart for showing trends Powerpoint Templates . They Will Create A Strong Impression.
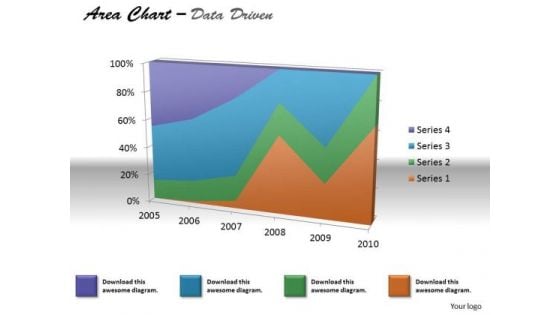
Financial Data Analysis Area Chart For Various Values PowerPoint Templates
Document The Process On Our financial data analysis area chart for various values Powerpoint Templates . Make A Record Of Every Detail.
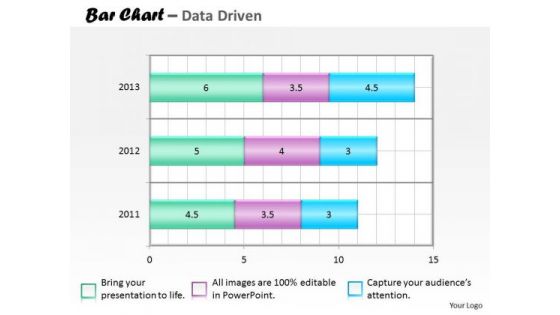
Financial Data Analysis Bar Chart For Collection Of PowerPoint Templates
Our financial data analysis bar chart for collection of Powerpoint Templates Team Are A Dogged Lot. They Keep At It Till They Get It Right.
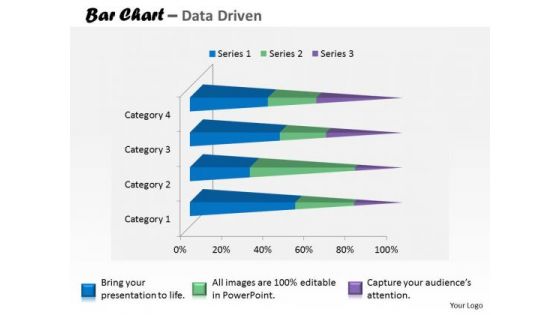
Financial Data Analysis Currency Trading Bar Chart PowerPoint Templates
Put In A Dollop Of Our financial data analysis currency trading bar chart Powerpoint Templates . Give Your Thoughts A Distinctive Flavor.

Microsoft Excel Data Analysis Bar Chart To Handle PowerPoint Templates
Our microsoft excel data analysis bar chart to handle Powerpoint Templates And Your Ideas Make A Great Doubles Pair. Play The Net With Assured Hands.
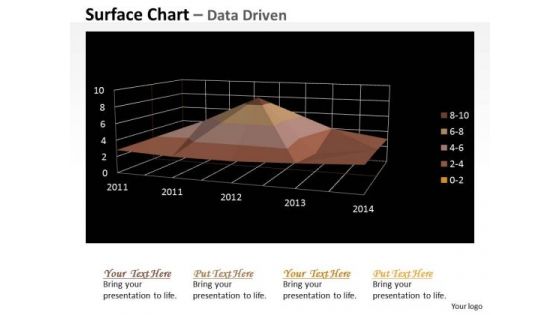
Multivariate Data Analysis Numeric Values Surface Chart PowerPoint Templates
Your Grasp Of Economics Is Well Known. Help Your Audience Comprehend Issues With Our multivariate data analysis numeric values surface chart Powerpoint Templates .
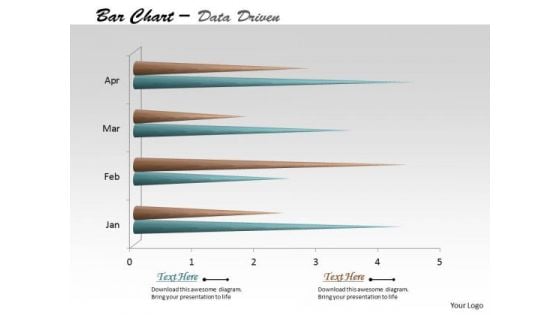
Multivariate Data Analysis Time Based Bar Chart PowerPoint Templates
Edit Your Work With Our multivariate data analysis time based bar chart Powerpoint Templates . They Will Help You Give The Final Form.
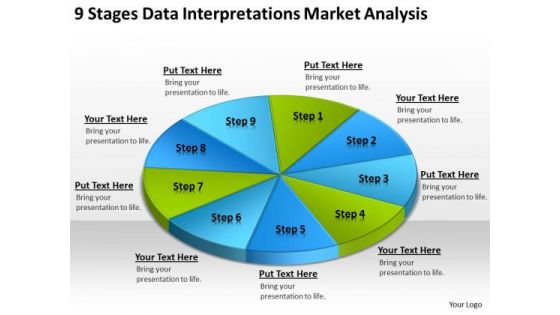
Data Interpretations Market Analysis Templates For Business Plan PowerPoint
We present our data interpretations market analysis templates for business plan PowerPoint.Present our Circle Charts PowerPoint Templates because Our PowerPoint Templates and Slides come in all colours, shades and hues. They help highlight every nuance of your views. Use our Business PowerPoint Templates because Our PowerPoint Templates and Slides will let you Hit the right notes. Watch your audience start singing to your tune. Download our Shapes PowerPoint Templates because Our PowerPoint Templates and Slides will fulfill your every need. Use them and effectively satisfy the desires of your audience. Present our Signs PowerPoint Templates because Our PowerPoint Templates and Slides will provide you a launch platform. Give a lift off to your ideas and send them into orbit. Use our Metaphors-Visual Concepts PowerPoint Templates because You have a driving passion to excel in your field. Our PowerPoint Templates and Slides will prove ideal vehicles for your ideas.Use these PowerPoint slides for presentations relating to business, chart, circle, circular, diagram, economy, finance, framework, graph, isolated, percentage, pie chart, results, scheme, statistics, stats, strategy, success. The prominent colors used in the PowerPoint template are Blue, Green, Blue light. Affiliate our Data Interpretations Market Analysis Templates For Business Plan PowerPoint to your thoughts. They will develop an affinity for them.
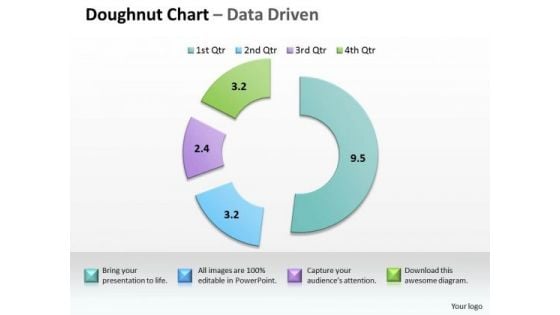
Data Analysis In Excel Completion Project Management PowerPoint Templates
Touch Base With Our data analysis in excel completion project management Powerpoint Templates . Review Your Growth With Your Audience.
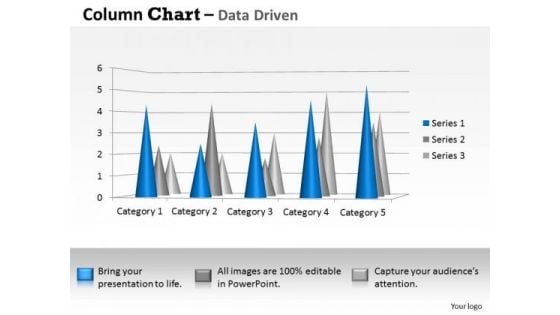
Data Analysis Techniques 3d Distribution Of In Sets PowerPoint Templates
Your Thoughts Will Be The Main Course. Provide The Dressing With Our data analysis techniques 3d distribution of in sets Powerpoint Templates .
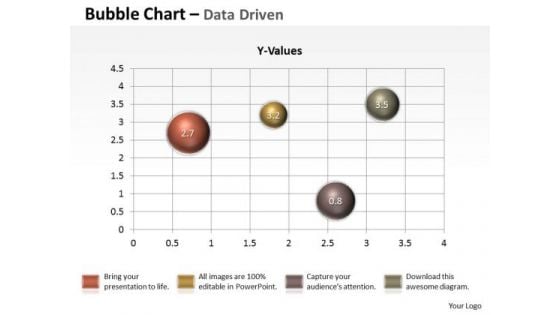
Data Analysis Techniques 3d Graphical Presentation Of PowerPoint Templates
Our data analysis techniques 3d graphical presentation of Powerpoint Templates Will Follow The Drill. They Accomplish The Task Assigned To Them.

Data Analysis Excel Bar Graph To Compare PowerPoint Templates
Get The Domestics Right With Our data analysis excel bar graph to compare Powerpoint Templates. Create The Base For Thoughts To Grow.
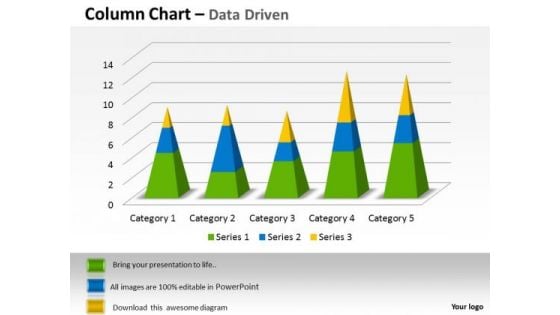
Examples Of Data Analysis Market 3d Categories Sets PowerPoint Templates
Our examples of data analysis market 3d categories sets Powerpoint Templates Give Your Thoughts Their Due. They Project Them With Full Intensity.
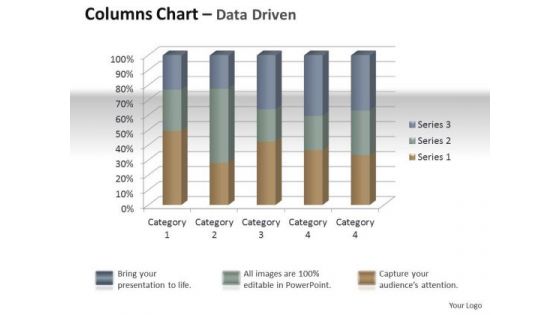
Marketing Data Analysis 3d Quality Control Of Units PowerPoint Templates
Establish Your Dominion With Our marketing data analysis 3d quality control of units Powerpoint Templates . Rule The Stage With Your Thoughts.
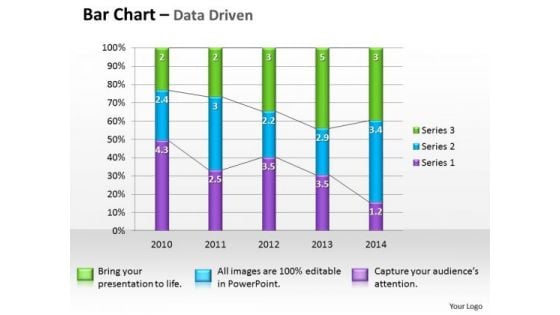
Microsoft Excel Data Analysis Bar Graph PowerPoint Templates
Double The Impact With Our microsoft excel data analysis bar graph Powerpoint Templates . Your Thoughts Will Have An Imposing Effect.

Business Diagram Business Bar Graph For Data Analysis Presentation Template
This business slide displays pie charts with percentage ratios. This diagram is a data visualization tool that gives you a simple way to present statistical information. This slide helps your audience examines and interprets the data you present.
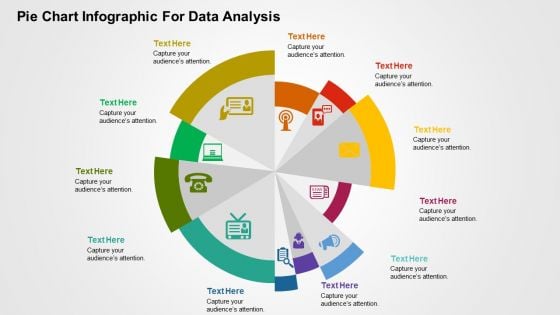
Pie Chart Infographic For Data Analysis PowerPoint Templates
This is one of the most downloaded PowerPoint template. This slide can be used for various purposes and to explain a number of processes. This can be included in your presentation to explain each step of a process and even include its relevance and importance in a single diagram. Using the uneven circular structure of the pie chart, the presenter can also explain random steps or highlight particular steps of process or parts of an organization or business that need special attention of any kind to the audience. Additionally, you can use this slide to show a transformation process or highlight key features of a product.
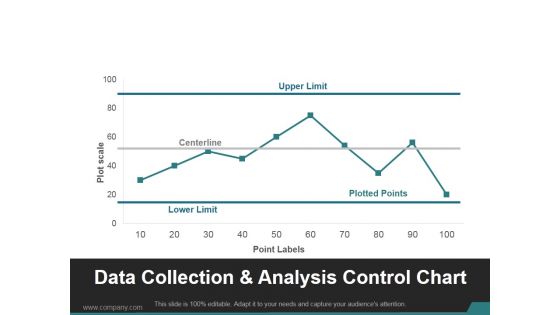
Data Collection And Analysis Control Chart Ppt PowerPoint Presentation Visuals
This is a data collection and analysis control chart ppt powerpoint presentation visuals. This is a ten stage process. The stages in this process are upper limit, centerline, lower limit, plotted points.
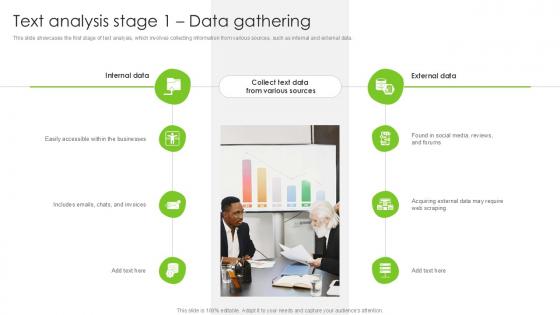
Text Analysis Stage 1 Data Gathering PPT Slide SS
This slide showcases the first stage of text analysis, which involves collecting information from various sources, such as internal and external data. Are you searching for a Text Analysis Stage 1 Data Gathering PPT Slide SS that is uncluttered, straightforward, and original Its easy to edit, and you can change the colors to suit your personal or business branding. For a presentation that expresses how much effort you have put in, this template is ideal With all of its features, including tables, diagrams, statistics, and lists, its perfect for a business plan presentation. Make your ideas more appealing with these professional slides. Download Text Analysis Stage 1 Data Gathering PPT Slide SS from Slidegeeks today. This slide showcases the first stage of text analysis, which involves collecting information from various sources, such as internal and external data.
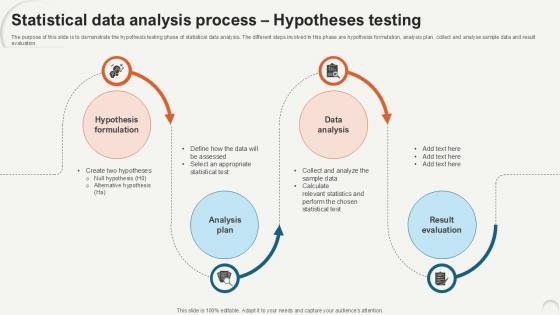
Statistical Data Analysis Process Hypotheses Testing Ppt Slide
The purpose of this slide is to demonstrate the hypothesis testing phase of statistical data analysis. The different steps involved in this phase are hypothesis formulation, analysis plan, collect and analyse sample data and result evaluation. There are so many reasons you need a Statistical Data Analysis Process Hypotheses Testing Ppt Slide. The first reason is you can not spend time making everything from scratch, Thus, Slidegeeks has made presentation templates for you too. You can easily download these templates from our website easily. The purpose of this slide is to demonstrate the hypothesis testing phase of statistical data analysis. The different steps involved in this phase are hypothesis formulation, analysis plan, collect and analyse sample data and result evaluation.
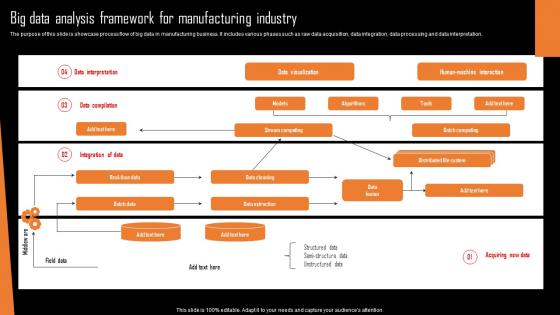
Big Data Analysis Framework For Manufacturing Industry Background Pdf
The purpose of this slide is showcase process flow of big data in manufacturing business. It includes various phases such as raw data acquisition, data integration, data processing and data interpretation.Showcasing this set of slides titled Big Data Analysis Framework For Manufacturing Industry Background Pdf The topics addressed in these templates are Data Visualization, Data Extraction, Data Cleaning All the content presented in this PPT design is completely editable. Download it and make adjustments in color, background, font etc. as per your unique business setting. The purpose of this slide is showcase process flow of big data in manufacturing business. It includes various phases such as raw data acquisition, data integration, data processing and data interpretation.
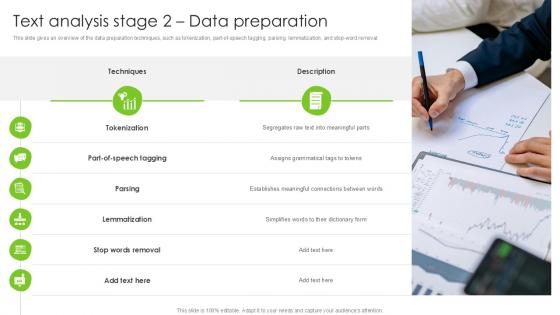
Text Analysis Stage 2 Data Preparation PPT Sample SS
This slide gives an overview of the data preparation techniques, such as tokenization, part-of-speech tagging, parsing, lemmatization, and stop-word removal. Retrieve professionally designed Text Analysis Stage 2 Data Preparation PPT Sample SS to effectively convey your message and captivate your listeners. Save time by selecting pre-made slideshows that are appropriate for various topics, from business to educational purposes. These themes come in many different styles, from creative to corporate, and all of them are easily adjustable and can be edited quickly. Access them as PowerPoint templates or as Google Slides themes. You do not have to go on a hunt for the perfect presentation because Slidegeeks got you covered from everywhere. This slide gives an overview of the data preparation techniques, such as tokenization, part-of-speech tagging, parsing, lemmatization, and stop-word removal.
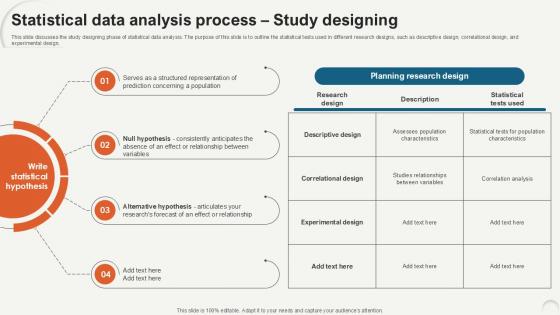
Statistical Data Analysis Process Study Designing Ppt Presentation
This slide discusses the study designing phase of statistical data analysis. The purpose of this slide is to outline the statistical tests used in different research designs, such as descriptive design, correlational design, and experimental design. Do you have to make sure that everyone on your team knows about any specific topic I yes, then you should give Statistical Data Analysis Process Study Designing Ppt Presentation a try. Our experts have put a lot of knowledge and effort into creating this impeccable Statistical Data Analysis Process Study Designing Ppt Presentation. You can use this template for your upcoming presentations, as the slides are perfect to represent even the tiniest detail. You can download these templates from the Slidegeeks website and these are easy to edit. So grab these today This slide discusses the study designing phase of statistical data analysis. The purpose of this slide is to outline the statistical tests used in different research designs, such as descriptive design, correlational design, and experimental design.
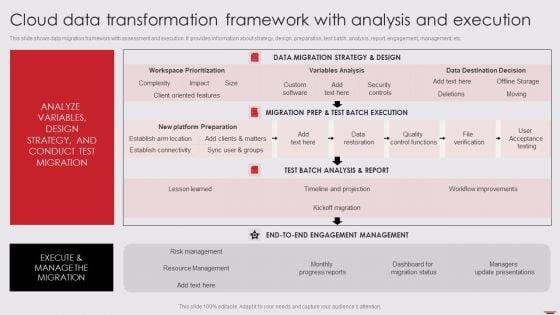
Cloud Data Transformation Framework With Analysis And Execution Diagrams PDF
This slide shows data migration framework with assessment and execution. It provides information about strategy, design, preparation, test batch, analysis, report, engagement, management, etc. Pitch your topic with ease and precision using this Cloud Data Transformation Framework With Analysis And Execution Diagrams PDF. This layout presents information on Data Migration Strategy, Migration Prep Test, Test Batch Analysis. It is also available for immediate download and adjustment. So, changes can be made in the color, design, graphics or any other component to create a unique layout.
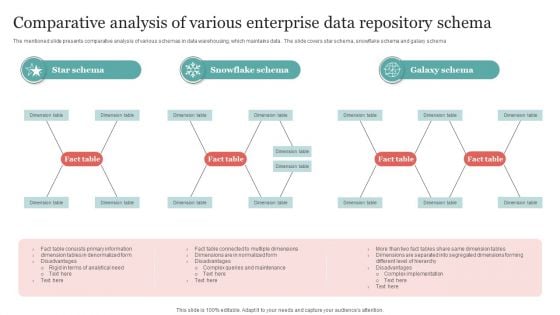
Comparative Analysis Of Various Enterprise Data Repository Schema Microsoft PDF
The mentioned slide presents comparative analysis of various schemas in data warehousing, which maintains data . The slide covers star schema, snowflake schema and galaxy schema Pitch your topic with ease and precision using this Comparative Analysis Of Various Enterprise Data Repository Schema Microsoft PDF. This layout presents information on Galaxy Schema, Snowflake Schema, Star Schema. It is also available for immediate download and adjustment. So, changes can be made in the color, design, graphics or any other component to create a unique layout.
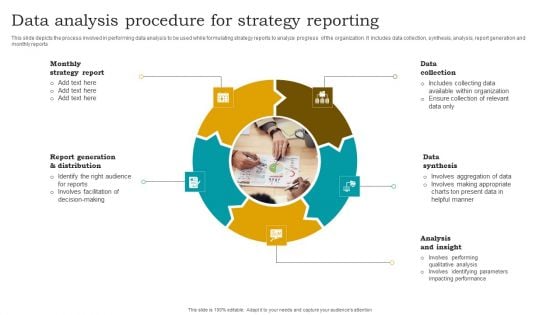
Data Analysis Procedure For Strategy Reporting Designs PDF
This slide depicts the process involved in performing data analysis to be used while formulating strategy reports to analyze progress of the organization. It includes data collection, synthesis, analysis, report generation and monthly reports. Presenting Data Analysis Procedure For Strategy Reporting Designs PDF to dispense important information. This template comprises five stages. It also presents valuable insights into the topics including Data Collection, Data Synthesis, Analysis And Insight. This is a completely customizable PowerPoint theme that can be put to use immediately. So, download it and address the topic impactfully.
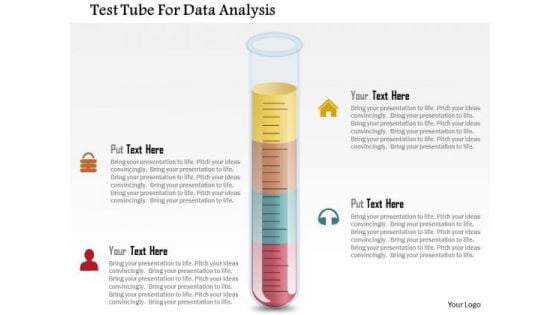
Business Diagram Test Tube For Data Analysis Presentation Template
Graphic of test tube with lock and headphone icons have been used to design this Power Point template. You may use this diagram for data analysis and research. Present your views using our innovative slide and be assured of leaving a lasting impression.
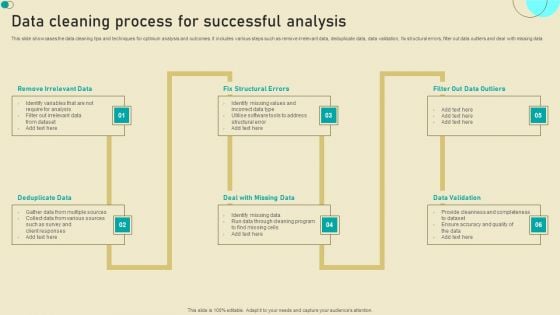
Data Cleaning Process For Successful Analysis Diagrams PDF
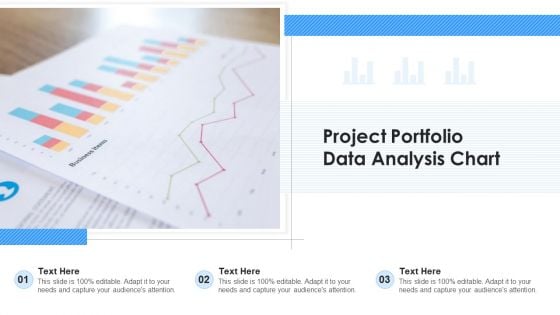
Project Portfolio Data Analysis Chart Ppt Ideas Gallery PDF
Presenting project portfolio data analysis chart ppt ideas gallery pdf to dispense important information. This template comprises three stages. It also presents valuable insights into the topics including project portfolio data analysis chart. This is a completely customizable PowerPoint theme that can be put to use immediately. So, download it and address the topic impactfully.
Digital Model Of Healthcare Data Analysis Demonstration PDF
Presenting Digital Model Of Healthcare Data Analysis Demonstration PDF to dispense important information. This template comprises three stages. It also presents valuable insights into the topics including Digital Model, Healthcare Data Analysis. This is a completely customizable PowerPoint theme that can be put to use immediately. So, download it and address the topic impactfully.
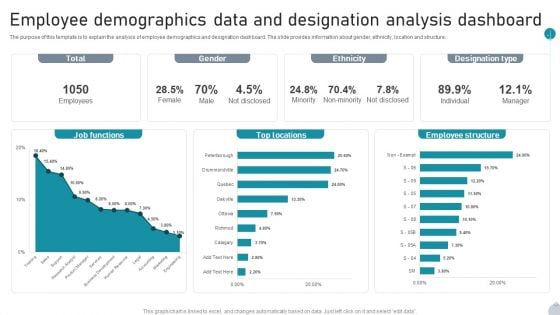
Employee Demographics Data And Designation Analysis Dashboard Introduction PDF
The purpose of this template is to explain the analysis of employee demographics and designation dashboard. The slide provides information about gender, ethnicity, location and structure. Pitch your topic with ease and precision using this Employee Demographics Data And Designation Analysis Dashboard Introduction PDF. This layout presents information on Job Functions, Top Locations, Employee Structure It is also available for immediate download and adjustment. So, changes can be made in the color, design, graphics or any other component to create a unique layout.
Data Analysis Marketing Ppt PowerPoint Presentation Ideas Examples Cpb
This is a data analysis marketing ppt powerpoint presentation ideas examples cpb. This is a two stage process. The stages in this process are data analysis marketing.
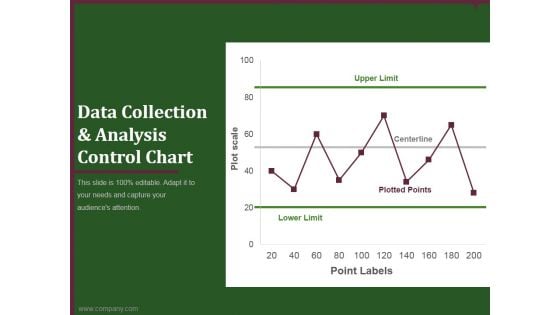
data collection and analysis control chart ppt powerpoint presentation styles
This is a data collection and analysis control chart ppt powerpoint presentation styles. This is a one stage process. The stages in this process are upper limit, centerline, plotted points, lower limit, point labels.
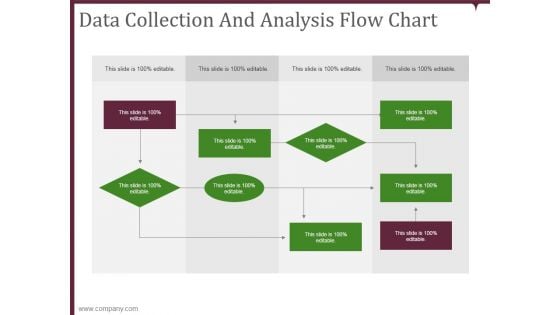
data collection and analysis flow chart ppt powerpoint presentation microsoft
This is a data collection and analysis flow chart ppt powerpoint presentation microsoft. This is a nine stage process. The stages in this process are business, planning, marketing, strategy, management.
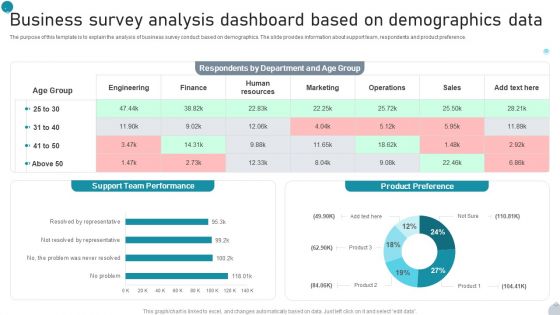
Business Survey Analysis Dashboard Based On Demographics Data Microsoft PDF
The purpose of this template is to explain the analysis of business survey conduct based on demographics. The slide provides information about support team, respondents and product preference. Pitch your topic with ease and precision using this Business Survey Analysis Dashboard Based On Demographics Data Microsoft PDF. This layout presents information on Support, Team Performance, Product Preference It is also available for immediate download and adjustment. So, changes can be made in the color, design, graphics or any other component to create a unique layout.
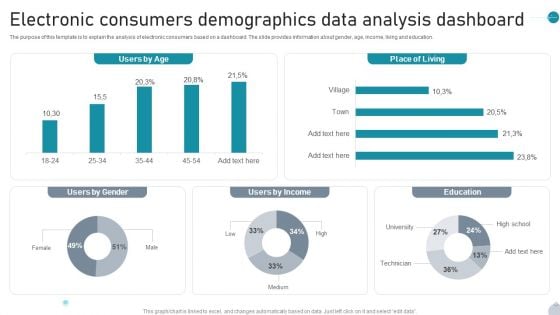
Electronic Consumers Demographics Data Analysis Dashboard Topics PDF
The purpose of this template is to explain the analysis of electronic consumers based on a dashboard. The slide provides information about gender, age, income, living and education. Showcasing this set of slides titled Electronic Consumers Demographics Data Analysis Dashboard Topics PDF. The topics addressed in these templates are Users By Age, Place Of Living, Users By Income All the content presented in this PPT design is completely editable. Download it and make adjustments in color, background, font etc. as per your unique business setting.
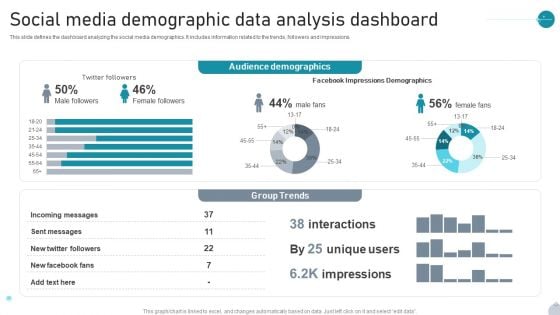
Social Media Demographic Data Analysis Dashboard Infographics PDF
This slide defines the dashboard analyzing the social media demographics. It includes information related to the trends, followers and impressions. Pitch your topic with ease and precision using this Social Media Demographic Data Analysis Dashboard Infographics PDF. This layout presents information on Audience Demographics, Group Trends, Impressions Demographics It is also available for immediate download and adjustment. So, changes can be made in the color, design, graphics or any other component to create a unique layout.
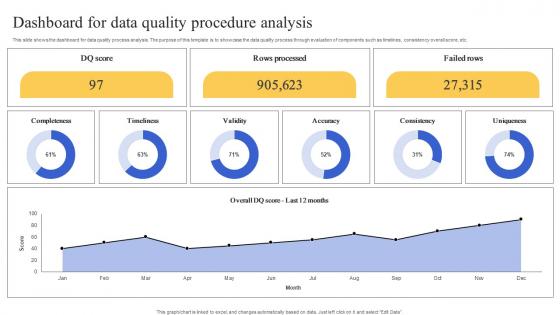
Dashboard For Data Quality Procedure Analysis Demonstration Pdf
This slide shows the dashboard for data quality process analysis. The purpose of this template is to showcase the data quality process through evaluation of components such as timelines, consistency overall score, etc. Showcasing this set of slides titled Dashboard For Data Quality Procedure Analysis Demonstration Pdf. The topics addressed in these templates are Dashboard For Data Quality, Procedure Analysis, Timelines. All the content presented in this PPT design is completely editable. Download it and make adjustments in color, background, font etc. as per your unique business setting. This slide shows the dashboard for data quality process analysis. The purpose of this template is to showcase the data quality process through evaluation of components such as timelines, consistency overall score, etc.

Data Collection Storage And Analysis Strategies DT SS V
This slide present various digital strategies for effective data collection, storage, and analysis to improve data-based decision making. It includes customer feedback and surveys, cloud-based solutions, data visualization tools , etc. Coming up with a presentation necessitates that the majority of the effort goes into the content and the message you intend to convey. The visuals of a PowerPoint presentation can only be effective if it supplements and supports the story that is being told. Keeping this in mind our experts created Data Collection Storage And Analysis Strategies DT SS V to reduce the time that goes into designing the presentation. This way, you can concentrate on the message while our designers take care of providing you with the right template for the situation. This slide present various digital strategies for effective data collection, storage, and analysis to improve data-based decision making. It includes customer feedback and surveys, cloud-based solutions, data visualization tools , etc.
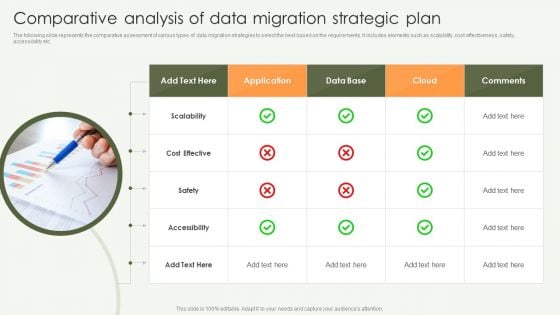
Comparative Analysis Of Data Migration Strategic Plan Diagrams PDF
The following slide represents the comparative assessment of various types of data migration strategies to select the best based on the requirements. It includes elements such as scalability, cost effectiveness, safety, accessibility etc. Presenting Comparative Analysis Of Data Migration Strategic Plan Diagrams PDF to dispense important information. This template comprises one stages. It also presents valuable insights into the topics including Cost Effective, Application, Cloud. This is a completely customizable PowerPoint theme that can be put to use immediately. So, download it and address the topic impactfully.
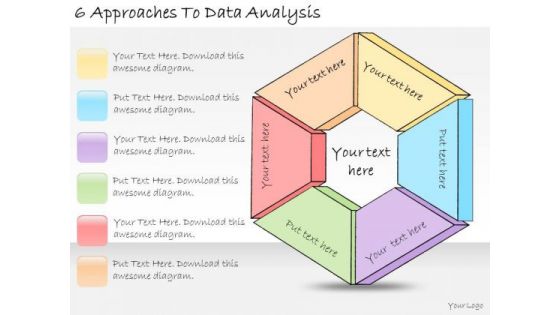
Ppt Slide 6 Approaches To Data Analysis Sales Plan
Get The Doers Into Action. Activate Them With Our PPT Slide 6 Approaches To Data Analysis Sales Plan Powerpoint Templates.

Big Data Sources Analysis Concept Diagram Template Powerpoint Slides
This is a big data sources analysis concept diagram template powerpoint slides. This is a eight stage process. The stages in this process are public web, data storage, social media, business app, machine data, sensor, archives.
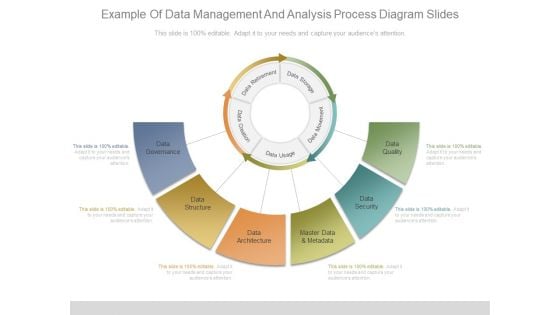
Example Of Data Management And Analysis Process Diagram Slides
Presenting this set of slides with name example of data management and analysis process diagram slides. This is a six stage process. The stages in this process are data governance, data structure, data architecture, master data and metadata, data security, data quality. This is a completely editable PowerPoint presentation and is available for immediate download. Download now and impress your audience.
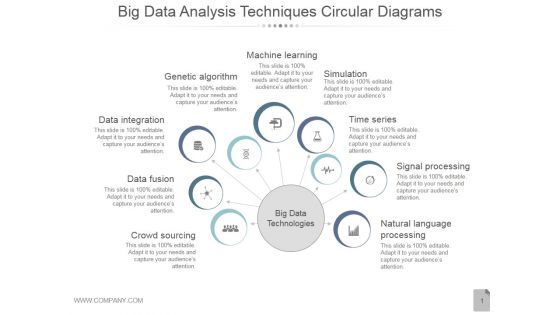
Big Data Analysis Techniques Circular Diagrams Ppt PowerPoint Presentation Shapes
This is a big data analysis techniques circular diagrams ppt powerpoint presentation shapes. This is a nine stage process. The stages in this process are data fusion, data integration, genetic algorithm, machine learning, simulation.
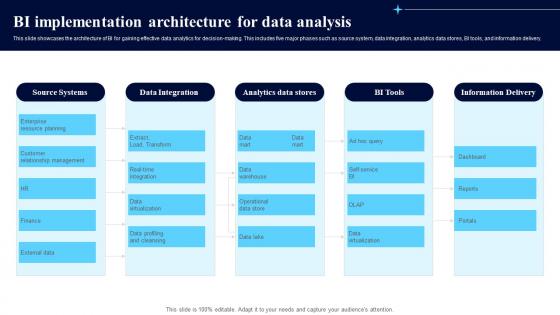
BI Implementation Architecture For Data Analysis Slides Pdf
This slide showcases the architecture of BI for gaining effective data analytics for decision-making. This includes five major phases such as source system, data integration, analytics data stores, BI tools, and information delivery. Showcasing this set of slides titled BI Implementation Architecture For Data Analysis Slides Pdf. The topics addressed in these templates are Source Systems, Data Integration, Analytics Data Stores. All the content presented in this PPT design is completely editable. Download it and make adjustments in color, background, font etc. as per your unique business setting. This slide showcases the architecture of BI for gaining effective data analytics for decision-making. This includes five major phases such as source system, data integration, analytics data stores, BI tools, and information delivery.
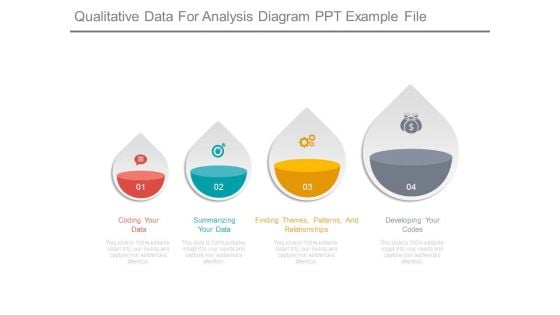
Qualitative Data For Analysis Diagram Ppt Example File
This is a qualitative data for analysis diagram ppt example file. This is a four stage process. The stages in this process are coding your data, summarizing your data, finding themes, patterns, and relationships, developing your codes.
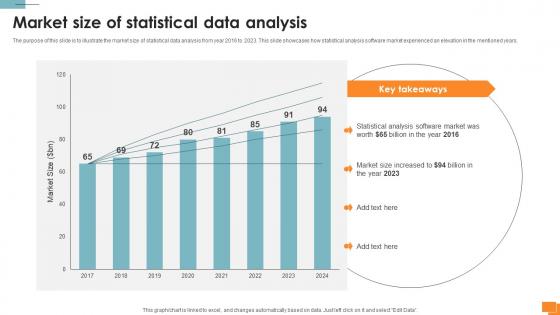
Statistical Tools For Evidence Market Size Of Statistical Data Analysis
The purpose of this slide is to illustrate the market size of statistical data analysis from year 2016 to 2023. This slide showcases how statistical analysis software market experienced an elevation in the mentioned years. Retrieve professionally designed Statistical Tools For Evidence Market Size Of Statistical Data Analysis to effectively convey your message and captivate your listeners. Save time by selecting pre-made slideshows that are appropriate for various topics, from business to educational purposes. These themes come in many different styles, from creative to corporate, and all of them are easily adjustable and can be edited quickly. Access them as PowerPoint templates or as Google Slides themes. You do not have to go on a hunt for the perfect presentation because Slidegeeks got you covered from everywhere. The purpose of this slide is to illustrate the market size of statistical data analysis from year 2016 to 2023. This slide showcases how statistical analysis software market experienced an elevation in the mentioned years.
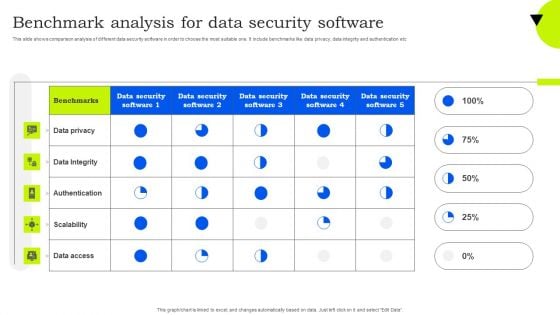
Benchmark Analysis For Data Security Software Mockup PDF
This slide shows comparison analysis of different data security software in order to choose the most suitable one. It include benchmarks like data privacy, data integrity and authentication etc. Showcasing this set of slides titled Benchmark Analysis For Data Security Software Mockup PDF. The topics addressed in these templates are Data Privacy, Data Integrity, Authentication. All the content presented in this PPT design is completely editable. Download it and make adjustments in color, background, font etc. as per your unique business setting.
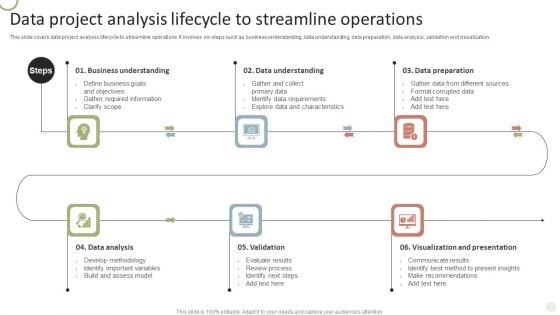
Data Project Analysis Lifecycle To Streamline Operations Diagrams PDF
This slide covers data project analysis lifecycle to streamline operations. It involves six steps such as business understanding, data understanding, data preparation, data analysis, validation and visualization.Persuade your audience using this Data Project Analysis Lifecycle To Streamline Operations Diagrams PDF. This PPT design covers six stages, thus making it a great tool to use. It also caters to a variety of topics including Business Understanding, Data Understanding, Data Preparation. Download this PPT design now to present a convincing pitch that not only emphasizes the topic but also showcases your presentation skills.
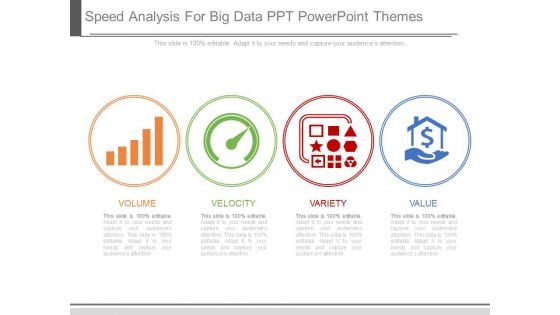
Speed Analysis For Big Data Ppt Powerpoint Themes
This is a speed analysis for big data ppt powerpoint themes. This is a four stage process. The stages in this process are volume, velocity, variety, value.
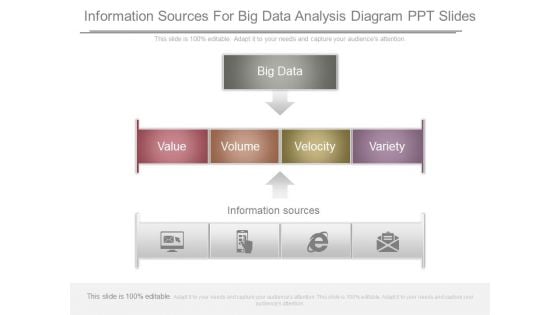
Information Sources For Big Data Analysis Diagram Ppt Slides
This is a information sources for big data analysis diagram ppt slides. This is a three stage process. The stages in this process are big data, value, volume, velocity, variety, information sources.
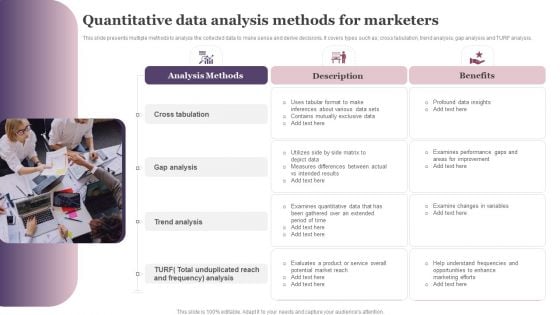
Quantitative Data Analysis Methods For Marketers Ppt Pictures Aids PDF
This slide presents multiple methods to analyze the collected data to make sense and derive decisions. It covers types such as, cross tabulation, trend analysis, gap analysis and TURF analysis. Presenting Quantitative Data Analysis Methods For Marketers Ppt Pictures Aids PDF to dispense important information. This template comprises three stages. It also presents valuable insights into the topics including Cross Tabulation, Gap Analysis, Trend Analysis. This is a completely customizable PowerPoint theme that can be put to use immediately. So, download it and address the topic impactfully.
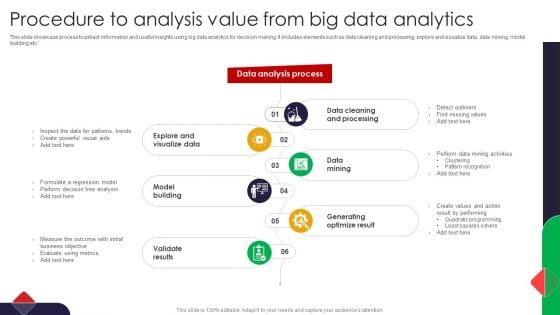
Procedure To Analysis Value From Big Data Analytics Microsoft PDF
This slide showcase process to extract information and useful insights using big data analytics for decision making. It includes elements such as data cleaning and processing, explore and visualize data, data mining, model building etc. Presenting Procedure To Analysis Value From Big Data Analytics Microsoft PDF to dispense important information. This template comprises five stages. It also presents valuable insights into the topics including Data Analysis Process, Processing, Data Mining, Optimize Result. This is a completely customizable PowerPoint theme that can be put to use immediately. So, download it and address the topic impactfully.

Comparative Analysis Of Enterprise Repository And Data Mart Diagrams PDF
The slide analyses a comparative matrix of data warehouse and data mart. The slide includes definition, usage, objective , data type , data value, size, design and approach. Showcasing this set of slides titled Comparative Analysis Of Enterprise Repository And Data Mart Diagrams PDF. The topics addressed in these templates are Parameters, Data Warehouse, Data Mart. All the content presented in this PPT design is completely editable. Download it and make adjustments in color, background, font etc. as per your unique business setting.
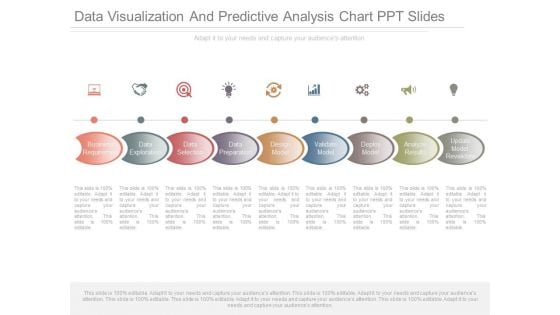
Data Visualization And Predictive Analysis Chart Ppt Slides
This is a data visualization and predictive analysis chart ppt slides. This is a nine stage process. The stages in this process are business requirement, data exploration, data selection, data preparation, design model, validate model, deploy model, analyze results, update model, revalidate.
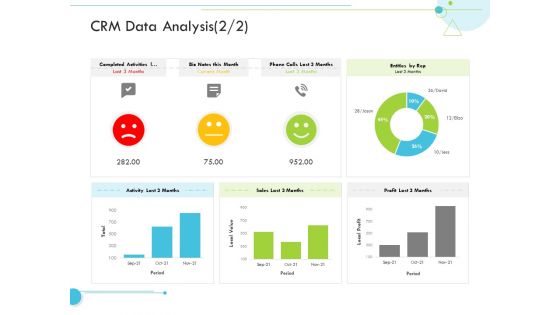
CRM Data Analysis Sales Customer Relationship Management CRM Diagrams PDF
Deliver and pitch your topic in the best possible manner with this crm data analysis sales customer relationship management crm diagrams pdf. Use them to share invaluable insights on crm data analysis and impress your audience. This template can be altered and modified as per your expectations. So, grab it now.
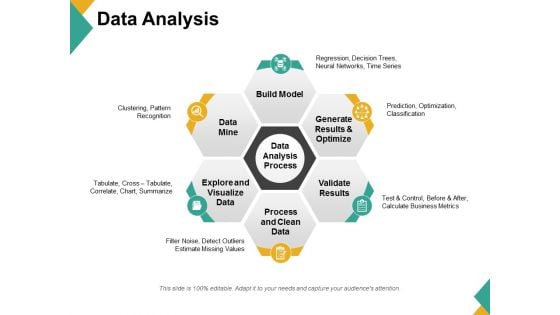
Data Analysis Ppt PowerPoint Presentation Visual Aids Diagrams
This is a data analysis ppt powerpoint presentation visual aids diagrams. This is a six stage process. The stages in this process are build model, generate results and optimize, validate results, process and clean data, explore and visualize data, data mine.
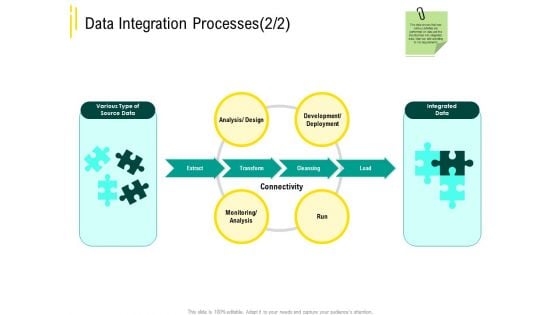
Expert Systems Data Integration Processe Analysis Themes PDF
Presenting expert systems data integration processe analysis themes pdf to provide visual cues and insights. Share and navigate important information on four stages that need your due attention. This template can be used to pitch topics like analysis design, data integration processes. In addtion, this PPT design contains high-resolution images, graphics, etc, that are easily editable and available for immediate download.
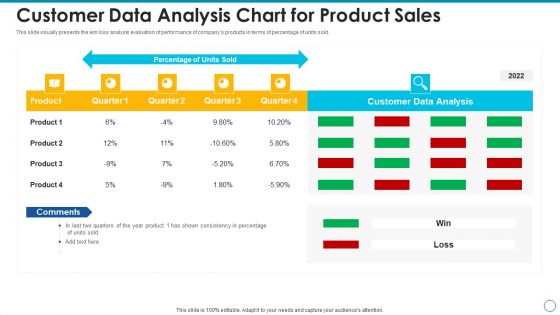
Customer Data Analysis Chart For Product Sales Inspiration PDF
Showcasing this set of slides titled customer data analysis chart for product sales inspiration pdf. The topics addressed in these templates are customer data analysis chart for product sales. All the content presented in this PPT design is completely editable. Download it and make adjustments in color, background, font etc. as per your unique business setting.
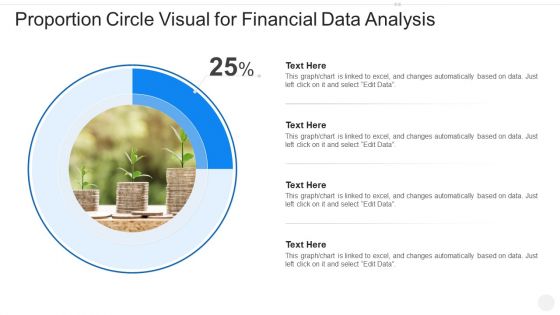
Proportion Circle Visual For Financial Data Analysis Guidelines PDF
Showcasing this set of slides titled proportion circle visual for financial data analysis guidelines pdf. The topics addressed in these templates are proportion circle visual for financial data analysis. All the content presented in this PPT design is completely editable. Download it and make adjustments in color, background, font etc. as per your unique business setting.
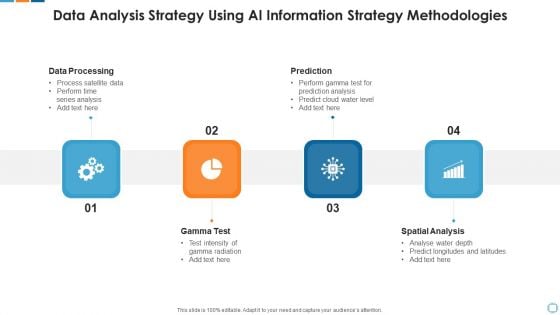
Data Analysis Strategy Using Ai Information Strategy Methodologies Topics PDF
Presenting data analysis strategy using ai information strategy methodologies topics pdf to dispense important information. This template comprises four stages. It also presents valuable insights into the topics including data processing, prediction, gamma test, spatial analysis. This is a completely customizable PowerPoint theme that can be put to use immediately. So, download it and address the topic impactfully.
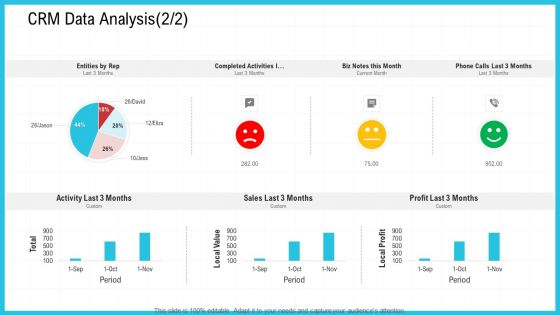
CRM Data Analysis Value Ppt Ideas Visual Aids PDF
Deliver an awe inspiring pitch with this creative crm data analysis value ppt ideas visual aids pdf bundle. Topics like crm data analysis can be discussed with this completely editable template. It is available for immediate download depending on the needs and requirements of the user.
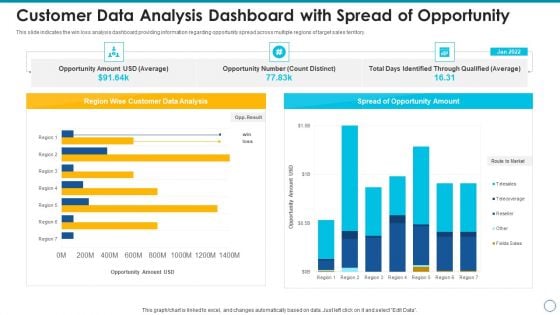
Customer Data Analysis Dashboard With Spread Of Opportunity Professional PDF
This slide indicates the win loss analysis dashboard providing information regarding opportunity spread across multiple regions of target sales territory. Showcasing this set of slides titled customer data analysis dashboard with spread of opportunity professional pdf. The topics addressed in these templates are customer data analysis dashboard with spread of opportunity. All the content presented in this PPT design is completely editable. Download it and make adjustments in color, background, font etc. as per your unique business setting.
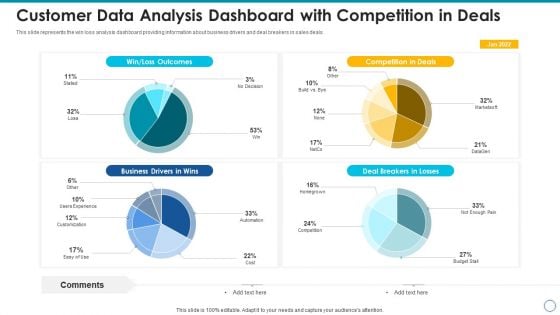
Customer Data Analysis Dashboard With Competition In Deals Infographics PDF
This slide represents the win loss analysis dashboard providing information about business drivers and deal breakers in sales deals. Pitch your topic with ease and precision using this customer data analysis dashboard with competition in deals infographics pdf. This layout presents information on customer data analysis dashboard with competition in deals. It is also available for immediate download and adjustment. So, changes can be made in the color, design, graphics or any other component to create a unique layout.
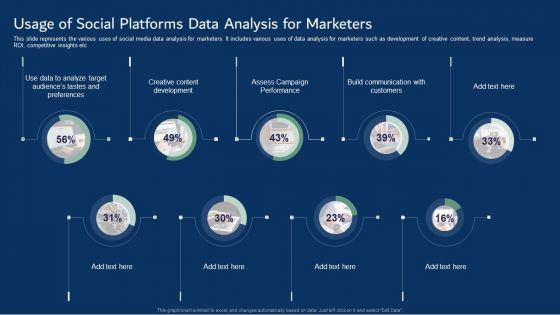
Usage Of Social Platforms Data Analysis For Marketers Information PDF
This slide represents the various uses of social media data analysis for marketers. It includes various uses of data analysis for marketers such as development of creative content, trend analysis, measure ROI, competitive insights etc. Showcasing this set of slides titled Usage Of Social Platforms Data Analysis For Marketers Information PDF. The topics addressed in these templates are Creative Content Development, Assess Campaign Performance, Build Communication. All the content presented in this PPT design is completely editable. Download it and make adjustments in color, background, font etc. as per your unique business setting.
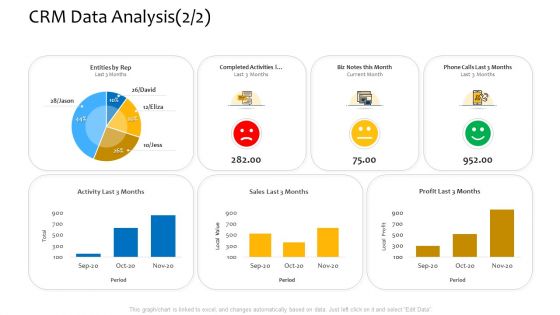
Customer Relationship Management Procedure CRM Data Analysis Activities Rules PDF
Deliver an awe inspiring pitch with this creative customer relationship management procedure CRM data analysis activities rules pdf bundle. Topics like CRM data analysis, completed activities, local profit can be discussed with this completely editable template. It is available for immediate download depending on the needs and requirements of the user.
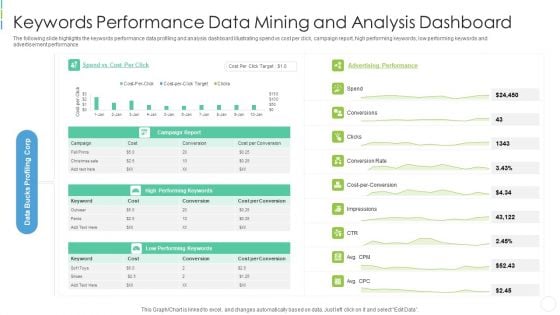
Keywords Performance Data Mining And Analysis Dashboard Microsoft PDF
The following slide highlights the keywords performance data profiling and analysis dashboard illustrating spend vs cost per click, campaign report, high performing keywords, low performing keywords and advertisement performance Showcasing this set of slides titled keywords performance data mining and analysis dashboard microsoft pdf . The topics addressed in these templates are keywords performance data mining and analysis dashboard . All the content presented in this PPT design is completely editable. Download it and make adjustments in color, background, font etc. as per your unique business setting.
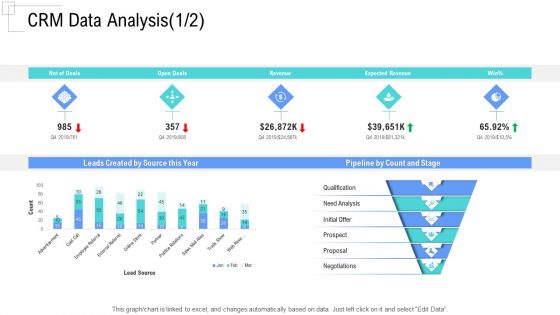
Managing Customer Experience CRM Data Analysis Revenue Designs PDF
This graph or chart is linked to excel, and changes automatically based on data. Just left click on it and select Edit Data.Deliver an awe-inspiring pitch with this creative managing customer experience crm data analysis revenue designs pdf bundle. Topics like leads created by source this year, pipeline by count and stage, qualification, need analysis, initial offer can be discussed with this completely editable template. It is available for immediate download depending on the needs and requirements of the user.
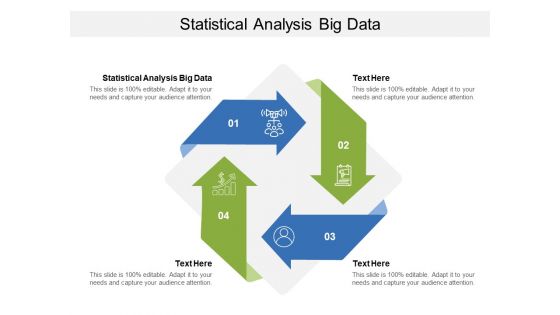
Statistical Analysis Big Data Ppt PowerPoint Presentation Ideas Diagrams Cpb
Presenting this set of slides with name statistical analysis big data ppt powerpoint presentation ideas diagrams cpb. This is an editable Powerpoint four stages graphic that deals with topics like statistical analysis big data to help convey your message better graphically. This product is a premium product available for immediate download and is 100 percent editable in Powerpoint. Download this now and use it in your presentations to impress your audience.
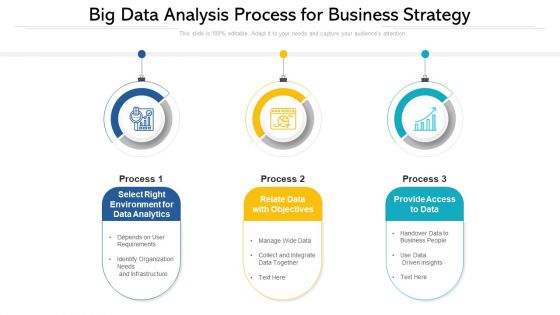
Big Data Analysis Process For Business Strategy Diagrams PDF
Persuade your audience using this big data analysis process for business strategy diagrams pdf.This PPT design covers three stages, thus making it a great tool to use. It also caters to a variety of topics including select right environment for data analytics, relate data with objectives, provide access to data. Download this PPT design now to present a convincing pitch that not only emphasizes the topic but also showcases your presentation skills.
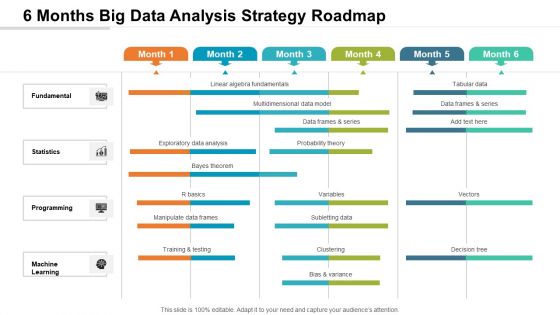
6 Months Big Data Analysis Strategy Roadmap Diagrams
We present our 6 months big data analysis strategy roadmap diagrams. This PowerPoint layout is easy-to-edit so you can change the font size, font type, color, and shape conveniently. In addition to this, the PowerPoint layout is Google Slides compatible, so you can share it with your audience and give them access to edit it. Therefore, download and save this well-researched 6 months big data analysis strategy roadmap diagrams in different formats like PDF, PNG, and JPG to smoothly execute your business plan.
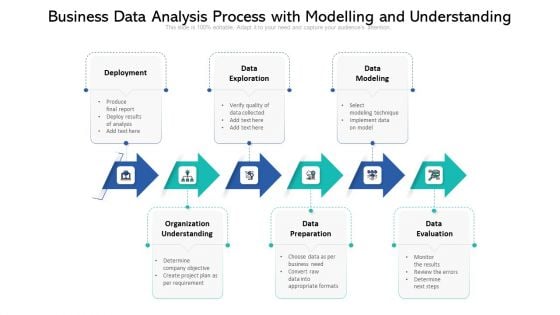
Business Data Analysis Process With Modelling And Understanding Formats PDF
Presenting business data analysis process with modelling and understanding formats pdf. to dispense important information. This template comprises three stages. It also presents valuable insights into the topics including deployment, data exploration, data modeling, organization understanding. This is a completely customizable PowerPoint theme that can be put to use immediately. So, download it and address the topic impactfully.
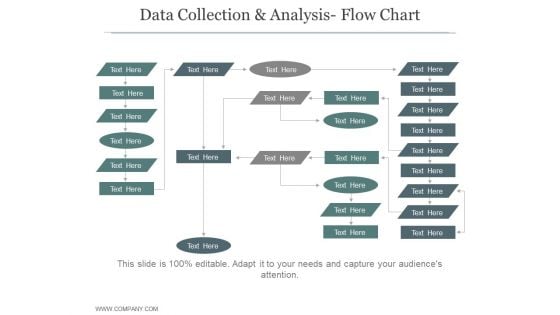
Data Collection And Analysis Flow Chart Ppt PowerPoint Presentation Sample
This is a data collection and analysis flow chart ppt powerpoint presentation sample. This is a five stage process. The stages in this process are business, strategy, marketing, process, growth strategy, finance.
Magnifying Glass Big Data Analysis Ppt PowerPoint Presentation Diagram Templates
Presenting this set of slides with name magnifying glass big data analysis ppt powerpoint presentation diagram templates. This is a four stage process. The stages in this process are technology, marketing, planning, business, management. This is a completely editable PowerPoint presentation and is available for immediate download. Download now and impress your audience.
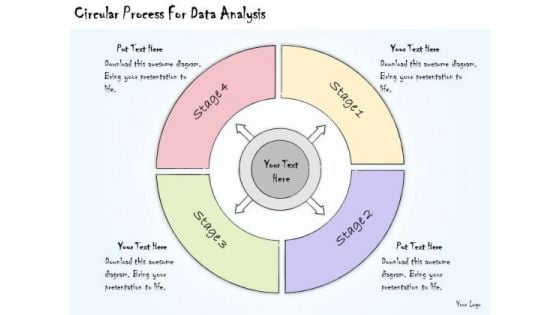
Ppt Slide Circular Process For Data Analysis Marketing Plan
Our PPT Slide circular process for data analysis marketing plan Powerpoint Templates Deliver At Your Doorstep. Let Them In For A Wonderful Experience. Dig Out The Dope With Our Business Plan Powerpoint Templates. Your Thoughts Will Expose The Truth.
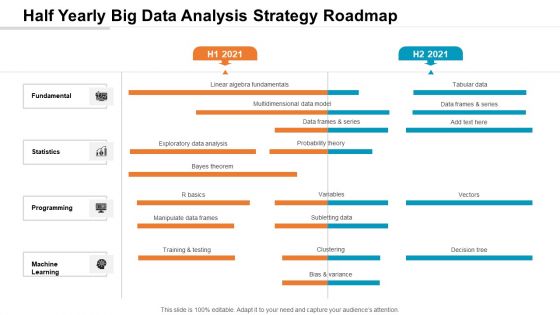
Half Yearly Big Data Analysis Strategy Roadmap Infographics
We present our half yearly big data analysis strategy roadmap infographics. This PowerPoint layout is easy-to-edit so you can change the font size, font type, color, and shape conveniently. In addition to this, the PowerPoint layout is Google Slides compatible, so you can share it with your audience and give them access to edit it. Therefore, download and save this well-researched half yearly big data analysis strategy roadmap infographics in different formats like PDF, PNG, and JPG to smoothly execute your business plan.
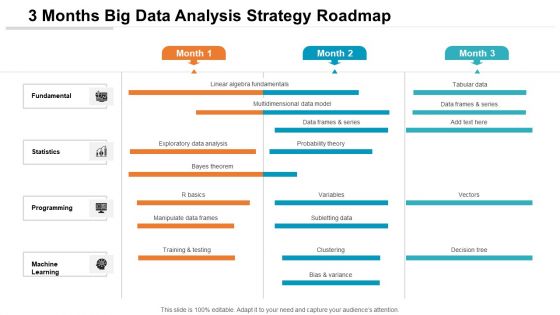
3 Months Big Data Analysis Strategy Roadmap Sample
We present our 3 months big data analysis strategy roadmap sample. This PowerPoint layout is easy-to-edit so you can change the font size, font type, color, and shape conveniently. In addition to this, the PowerPoint layout is Google Slides compatible, so you can share it with your audience and give them access to edit it. Therefore, download and save this well-researched 3 months big data analysis strategy roadmap sample in different formats like PDF, PNG, and JPG to smoothly execute your business plan.
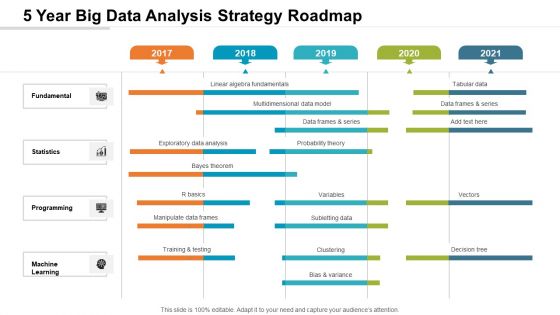
5 Year Big Data Analysis Strategy Roadmap Brochure
We present our 5 year big data analysis strategy roadmap brochure. This PowerPoint layout is easy-to-edit so you can change the font size, font type, color, and shape conveniently. In addition to this, the PowerPoint layout is Google Slides compatible, so you can share it with your audience and give them access to edit it. Therefore, download and save this well-researched 5 year big data analysis strategy roadmap brochure in different formats like PDF, PNG, and JPG to smoothly execute your business plan.
Benchmarking Data Analysis Ppt PowerPoint Presentation Summary Themes Cpb Pdf
Presenting this set of slides with name benchmarking data analysis ppt powerpoint presentation summary themes cpb pdf. This is an editable Powerpoint two stages graphic that deals with topics like benchmarking data analysis to help convey your message better graphically. This product is a premium product available for immediate download and is 100 percent editable in Powerpoint. Download this now and use it in your presentations to impress your audience.
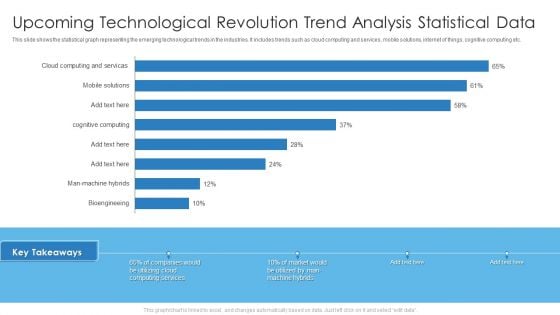
Upcoming Technological Revolution Trend Analysis Statistical Data Professional PDF
This slide shows the statistical graph representing the emerging technological trends in the industries. It includes trends such as cloud computing and services, mobile solutions, internet of things, cognitive computing etc. Deliver an awe inspiring pitch with this creative Upcoming Technological Revolution Trend Analysis Statistical Data Professional PDF bundle. Topics like Upcoming Technological Revolution, Trend Analysis Statistical Data can be discussed with this completely editable template. It is available for immediate download depending on the needs and requirements of the user.

Information Transformation Process Toolkit Data Analysis Project Plan Diagrams PDF
The slide outline the key steps for data analytics methodology. It initiates with defining business objectives to data understanding, modelling and ends at data visualization and presentation. Presenting Information Transformation Process Toolkit Data Analysis Project Plan Diagrams PDF to provide visual cues and insights. Share and navigate important information on six stages that need your due attention. This template can be used to pitch topics like Business Issue Understanding, Data Understanding, Data Preparation. In addtion, this PPT design contains high resolution images, graphics, etc, that are easily editable and available for immediate download.
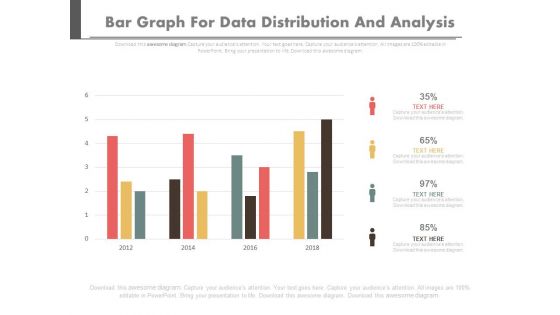
Bar Graph For Data Distribution And Analysis Powerpoint Slides
This PowerPoint template has been designed with bar graph. This PowerPoint diagram is useful for data distribution and analysis This diagram slide can be used to make impressive presentations.
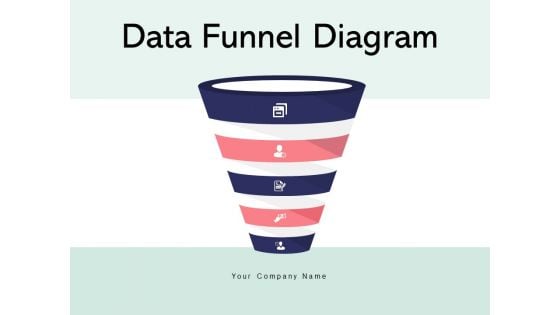
Data Funnel Diagram Interest Analysis Ppt PowerPoint Presentation Complete Deck
Presenting this set of slides with name data funnel diagram interest analysis ppt powerpoint presentation complete deck. The topics discussed in these slides are interest, analysis, arrow, marketing, funnel. This is a completely editable PowerPoint presentation and is available for immediate download. Download now and impress your audience.
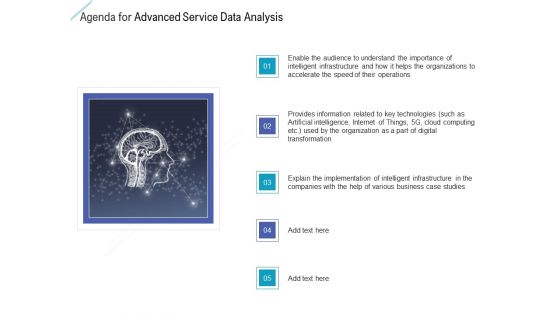
Agenda For Advanced Service Data Analysis Introduction PDF
This is a agenda for advanced service data analysis introduction pdf template with various stages. Focus and dispense information on five stages using this creative set, that comes with editable features. It contains large content boxes to add your information on topics like agenda for advanced service data analysis. You can also showcase facts, figures, and other relevant content using this PPT layout. Grab it now.
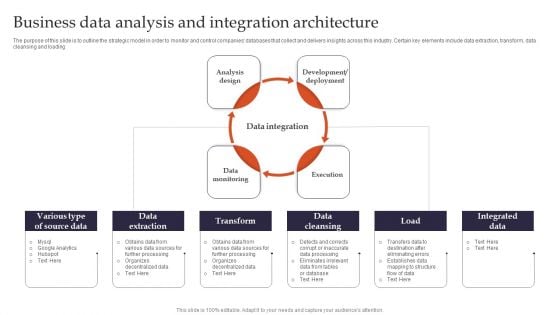
Business Data Analysis And Integration Architecture Brochure PDF
The purpose of this slide is to outline the strategic model in order to monitor and control companies databases that collect and delivers insights across this industry. Certain key elements include data extraction, transform, data cleansing and loading. Presenting Business Data Analysis And Integration Architecture Brochure PDF to dispense important information. This template comprises four stages. It also presents valuable insights into the topics including Analysis Design, Development Or Deployment, Data Monitoring. This is a completely customizable PowerPoint theme that can be put to use immediately. So, download it and address the topic impactfully.

Data Analysis Steps For Online Marketing Professional PDF
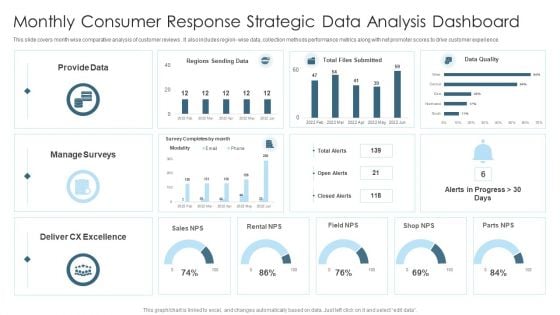
Monthly Consumer Response Strategic Data Analysis Dashboard Graphics PDF
This slide covers month wise comparative analysis of customer reviews . It also includes region wise data, collection methods performance metrics along with net promoter scores to drive customer experience. Showcasing this set of slides titled Monthly Consumer Response Strategic Data Analysis Dashboard Graphics PDF. The topics addressed in these templates are Provide Data, Sales, Manage Surveys. All the content presented in this PPT design is completely editable. Download it and make adjustments in color, background, font etc. as per your unique business setting.
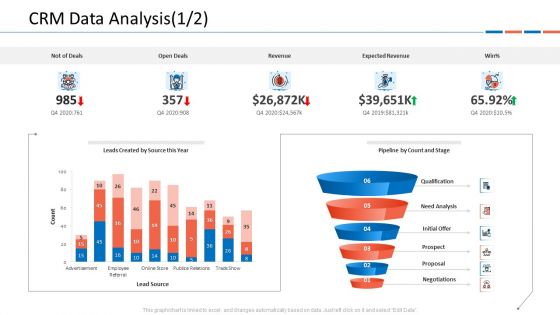
Customer Relationship Management Dashboard CRM Data Analysis Deals Ideas PDF
This graph or chart is linked to excel, and changes automatically based on data. Just left click on it and select Edit Data.Deliver and pitch your topic in the best possible manner with this customer relationship management dashboard crm data analysis deals ideas pdf. Use them to share invaluable insights on v and impress your audience. This template can be altered and modified as per your expectations. So, grab it now.
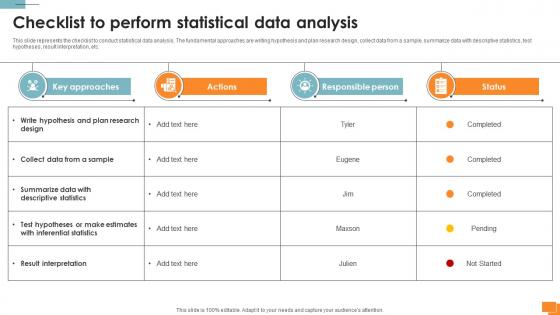
Statistical Tools For Evidence Checklist To Perform Statistical Data Analysis
This slide represents the checklist to conduct statistical data analysis. The fundamental approaches are writing hypothesis and plan research design, collect data from a sample, summarize data with descriptive statistics, test hypotheses, result interpretation, etc. Whether you have daily or monthly meetings, a brilliant presentation is necessary. Statistical Tools For Evidence Checklist To Perform Statistical Data Analysis can be your best option for delivering a presentation. Represent everything in detail using Statistical Tools For Evidence Checklist To Perform Statistical Data Analysis and make yourself stand out in meetings. The template is versatile and follows a structure that will cater to your requirements. All the templates prepared by Slidegeeks are easy to download and edit. Our research experts have taken care of the corporate themes as well. So, give it a try and see the results. This slide represents the checklist to conduct statistical data analysis. The fundamental approaches are writing hypothesis and plan research design, collect data from a sample, summarize data with descriptive statistics, test hypotheses, result interpretation, etc.
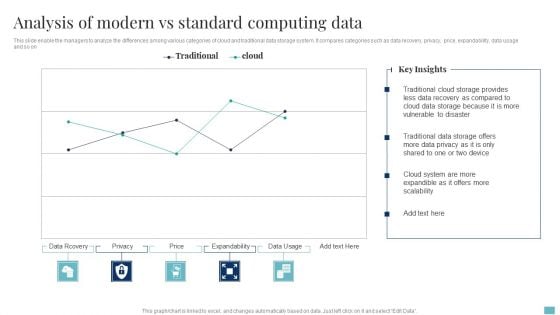
Analysis Of Modern Vs Standard Computing Data Formats PDF
Showcasing this set of slides titled Analysis Of Modern Vs Standard Computing Data Formats PDF. The topics addressed in these templates are Data Recovery, Cloud System, Device. All the content presented in this PPT design is completely editable. Download it and make adjustments in color, background, font etc. as per your unique business setting.
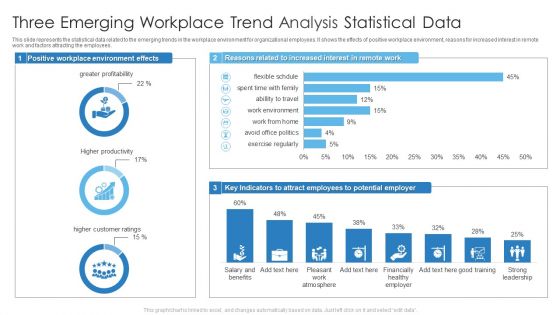
Three Emerging Workplace Trend Analysis Statistical Data Guidelines PDF
This slide represents the statistical data related to the emerging trends in the workplace environment for organizational employees. It shows the effects of positive workplace environment, reasons for increased interest in remote work and factors attracting the employees. Deliver an awe inspiring pitch with this creative Three Emerging Workplace Trend Analysis Statistical Data Guidelines PDF bundle. Topics like Three Emerging Workplace, Trend Analysis Statistical Data can be discussed with this completely editable template. It is available for immediate download depending on the needs and requirements of the user.
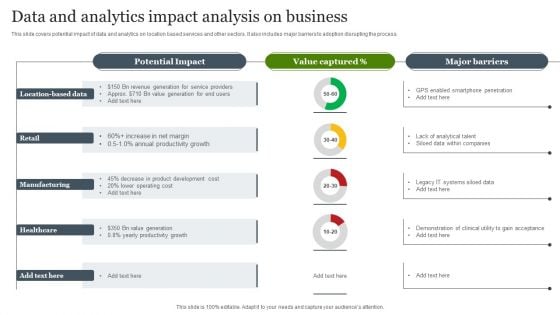
Data And Analytics Impact Analysis On Business Slides PDF
This slide covers potential impact of data and analytics on location based services and other sectors. It also includes major barriers to adoption disrupting the process. Pitch your topic with ease and precision using this Data And Analytics Impact Analysis On Business Slides PDF. This layout presents information on Retail, Manufacturing, Location Based Data. It is also available for immediate download and adjustment. So, changes can be made in the color, design, graphics or any other component to create a unique layout.
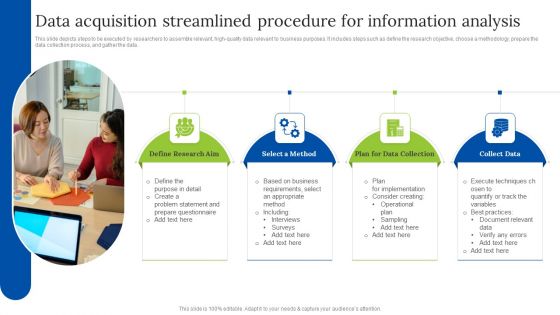
Data Acquisition Streamlined Procedure For Information Analysis Clipart PDF
This slide depicts steps to be executed by researchers to assemble relevant, high-quality data relevant to business purposes. It includes steps such as define the research objective, choose a methodology, prepare the data collection process, and gather the data.Presenting Data Acquisition Streamlined Procedure For Information Analysis Clipart PDF to dispense important information. This template comprises four stages. It also presents valuable insights into the topics including Define Research, Data Collection, Execute Techniques . This is a completely customizable PowerPoint theme that can be put to use immediately. So, download it and address the topic impactfully.
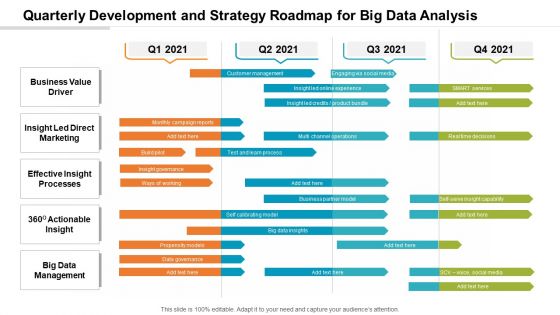
Quarterly Development And Strategy Roadmap For Big Data Analysis Designs
We present our quarterly development and strategy roadmap for big data analysis designs. This PowerPoint layout is easy-to-edit so you can change the font size, font type, color, and shape conveniently. In addition to this, the PowerPoint layout is Google Slides compatible, so you can share it with your audience and give them access to edit it. Therefore, download and save this well-researched quarterly development and strategy roadmap for big data analysis designs in different formats like PDF, PNG, and JPG to smoothly execute your business plan.
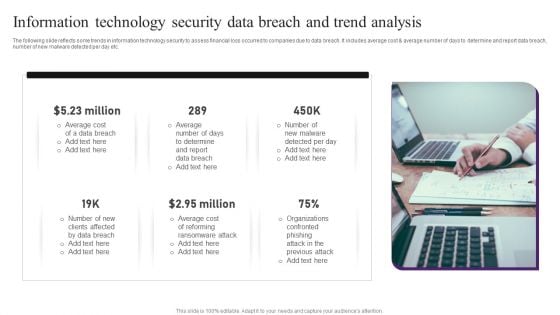
Information Technology Security Data Breach And Trend Analysis Professional PDF
The following slide reflects some trends in information technology security to assess financial loss occurred to companies due to data breach. It includes average cost and average number of days to determine and report data breach, number of new malware detected per day etc. Presenting Information Technology Security Data Breach And Trend Analysis Professional PDF to dispense important information. This template comprises six stages. It also presents valuable insights into the topics including Data Breach, Average Cost, Determine. This is a completely customizable PowerPoint theme that can be put to use immediately. So, download it and address the topic impactfully.
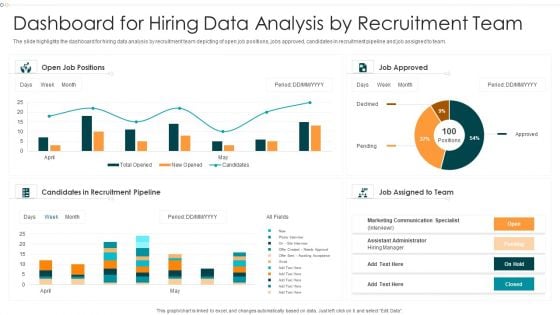
Dashboard For Hiring Data Analysis By Recruitment Team Formats PDF
The slide highlights the dashboard for hiring data analysis by recruitment team depicting of open job positions, jobs approved, candidates in recruitment pipeline and job assigned to team.Pitch your topic with ease and precision using this Dashboard For Hiring Data Analysis By Recruitment Team Formats PDF This layout presents information on Candidates Recruitment, Marketing Communication, Approved It is also available for immediate download and adjustment. So, changes can be made in the color, design, graphics or any other component to create a unique layout.
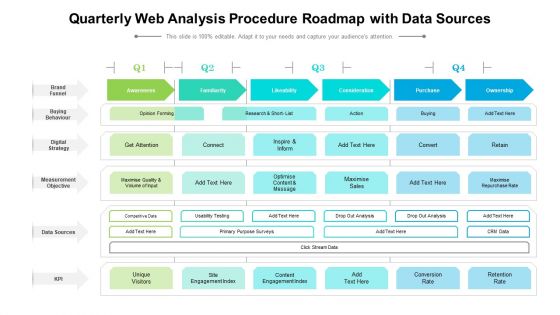
Quarterly Web Analysis Procedure Roadmap With Data Sources Guidelines
We present our quarterly web analysis procedure roadmap with data sources guidelines. This PowerPoint layout is easy to edit so you can change the font size, font type, color, and shape conveniently. In addition to this, the PowerPoint layout is Google Slides compatible, so you can share it with your audience and give them access to edit it. Therefore, download and save this well researched quarterly web analysis procedure roadmap with data sources guidelines in different formats like PDF, PNG, and JPG to smoothly execute your business plan.
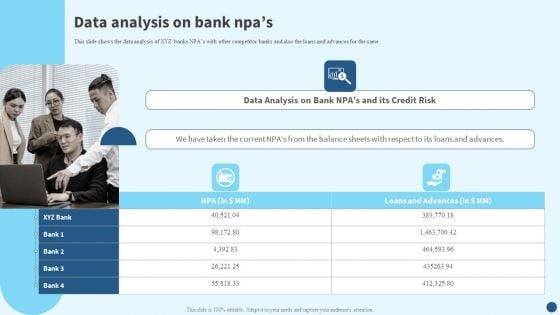
Credit Risk Management Data Analysis On Bank Npas Microsoft PDF
This slide shows the data analysis of XYZ banks NPAs with other competitor banks and also the loans and advances for the same. Whether you have daily or monthly meetings, a brilliant presentation is necessary. Credit Risk Management Data Analysis On Bank Npas Microsoft PDF can be your best option for delivering a presentation. Represent everything in detail using Credit Risk Management Data Analysis On Bank Npas Microsoft PDF and make yourself stand out in meetings. The template is versatile and follows a structure that will cater to your requirements. All the templates prepared by Slidegeeks are easy to download and edit. Our research experts have taken care of the corporate themes as well. So, give it a try and see the results.
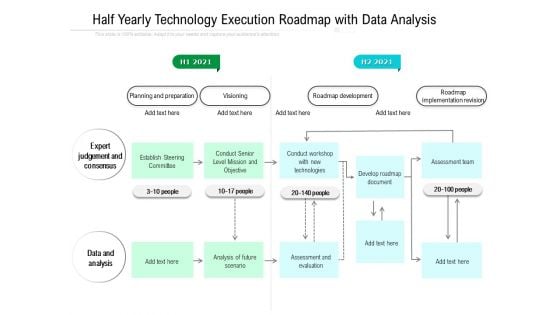
Half Yearly Technology Execution Roadmap With Data Analysis Mockup Elements
We present our half yearly technology execution roadmap with data analysis mockup elements. This PowerPoint layout is easy-to-edit so you can change the font size, font type, color, and shape conveniently. In addition to this, the PowerPoint layout is Google Slides compatible, so you can share it with your audience and give them access to edit it. Therefore, download and save this well-researched half yearly technology execution roadmap with data analysis mockup elements in different formats like PDF, PNG, and JPG to smoothly execute your business plan.
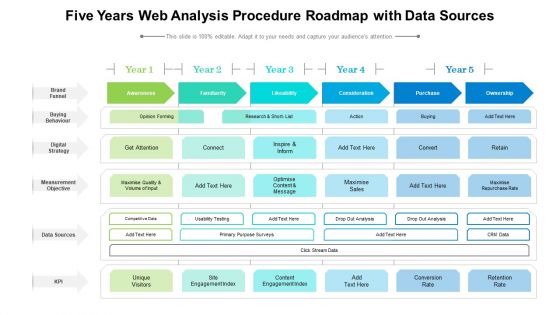
Five Years Web Analysis Procedure Roadmap With Data Designs
We present our five years web analysis procedure roadmap with data designs. This PowerPoint layout is easy to edit so you can change the font size, font type, color, and shape conveniently. In addition to this, the PowerPoint layout is Google Slides compatible, so you can share it with your audience and give them access to edit it. Therefore, download and save this well researched five years web analysis procedure roadmap with data designs in different formats like PDF, PNG, and JPG to smoothly execute your business plan.
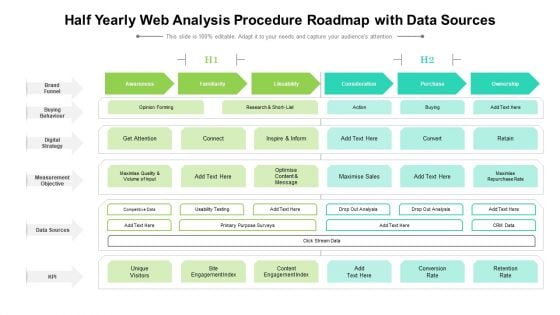
Half Yearly Web Analysis Procedure Roadmap With Data Sources Elements
We present our half yearly web analysis procedure roadmap with data sources elements. This PowerPoint layout is easy to edit so you can change the font size, font type, color, and shape conveniently. In addition to this, the PowerPoint layout is Google Slides compatible, so you can share it with your audience and give them access to edit it. Therefore, download and save this well researched half yearly web analysis procedure roadmap with data sources elements in different formats like PDF, PNG, and JPG to smoothly execute your business plan.
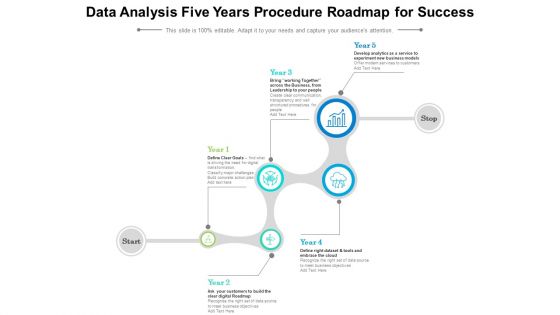
Data Analysis Five Years Procedure Roadmap For Success Slides
We present our data analysis five years procedure roadmap for success slides. This PowerPoint layout is easy to edit so you can change the font size, font type, color, and shape conveniently. In addition to this, the PowerPoint layout is Google Slides compatible, so you can share it with your audience and give them access to edit it. Therefore, download and save this well researched data analysis five years procedure roadmap for success slides in different formats like PDF, PNG, and JPG to smoothly execute your business plan.

Customer Relationship Management Dashboard CRM Data Analysis Sample PDF
Deliver an aweinspiring pitch with this creative customer relationship management dashboard crm data analysis sample pdf bundle. Topics like entities by rep, completed activities l, biz notes this month, activity last 3 months, sales last 3 months can be discussed with this completely editable template. It is available for immediate download depending on the needs and requirements of the user.
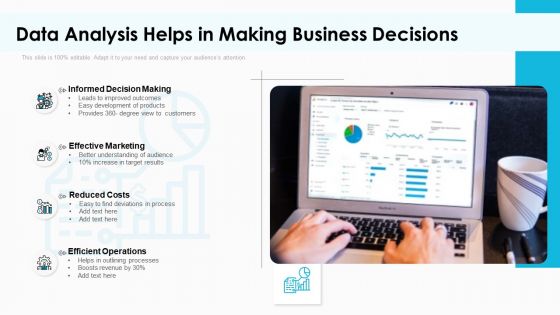
Data Analysis Helps In Making Business Decisions Graphics PDF
Presenting data analysis helps in making business decisions graphics pdf. to dispense important information. This template comprises four stages. It also presents valuable insights into the topics including informed decision making, effective marketing, reduced costs, efficient operations. This is a completely customizable PowerPoint theme that can be put to use immediately. So, download it and address the topic impactfully.
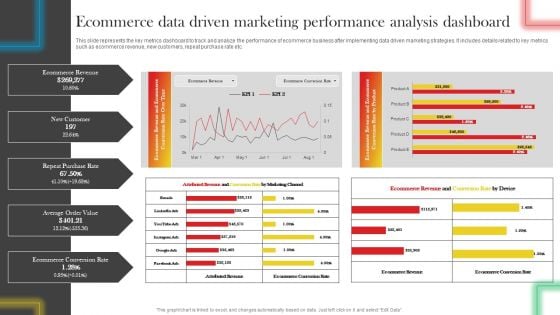
Ecommerce Data Driven Marketing Performance Analysis Dashboard Professional PDF
This slide represents the key metrics dashboard to track and analyze the performance of ecommerce business after implementing data driven marketing strategies. It includes details related to key metrics such as ecommerce revenue, new customers, repeat purchase rate etc. Get a simple yet stunning designed Ecommerce Data Driven Marketing Performance Analysis Dashboard Professional PDF. It is the best one to establish the tone in your meetings. It is an excellent way to make your presentations highly effective. So, download this PPT today from Slidegeeks and see the positive impacts. Our easy-to-edit Ecommerce Data Driven Marketing Performance Analysis Dashboard Professional PDF can be your go-to option for all upcoming conferences and meetings. So, what are you waiting for Grab this template today.
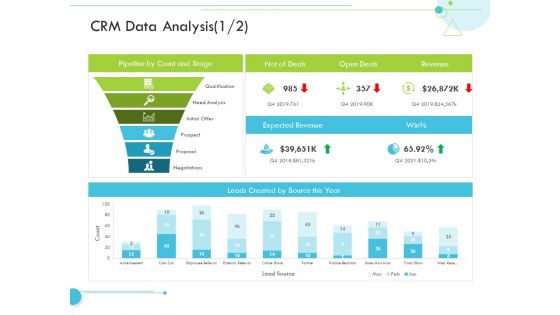
CRM Data Analysis Revenue Customer Relationship Management CRM Infographics PDF
Deliver an awe inspiring pitch with this creative crm data analysis revenue customer relationship management crm infographics pdf bundle. Topics like expected revenue, source can be discussed with this completely editable template. It is available for immediate download depending on the needs and requirements of the user.
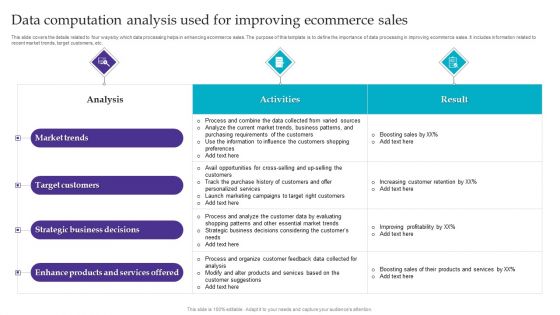
Data Computation Analysis Used For Improving Ecommerce Sales Themes PDF
This slide covers the details related to four ways by which data processing helps in enhancing ecommerce sales. The purpose of this template is to define the importance of data processing in improving ecommerce sales. It includes information related to recent market trends, target customers, etc. Showcasing this set of slides titled Data Computation Analysis Used For Improving Ecommerce Sales Themes PDF. The topics addressed in these templates are Target Customers, Strategic Business Decisions, Market Trends. All the content presented in this PPT design is completely editable. Download it and make adjustments in color, background, font etc. as per your unique business setting.

Managing Customer Experience CRM Data Analysis Sales Pictures PDF
This graph or chart is linked to excel, and changes automatically based on data. Just left click on it and select Edit Data.Deliver and pitch your topic in the best possible manner with this managing customer experience crm data analysis sales pictures pdf. Use them to share invaluable insights on entities by rep, completed activities l, biz notes this month, phone calls last 3 months, activity last 3 months and impress your audience. This template can be altered and modified as per your expectations. So, grab it now.

Quarterly Strategy Roadmap For Data Analysis Integration To Business Themes
Presenting our innovatively-structured quarterly strategy roadmap for data analysis integration to business themes Template. Showcase your roadmap process in different formats like PDF, PNG, and JPG by clicking the download button below. This PPT design is available in both Standard Screen and Widescreen aspect ratios. It can also be easily personalized and presented with modified font size, font type, color, and shapes to measure your progress in a clear way.
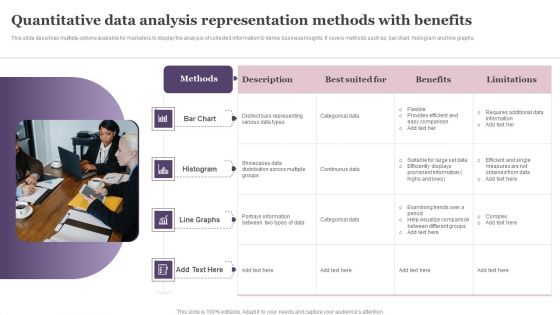
Quantitative Data Analysis Representation Methods With Benefits Template PDF
This slide describes multiple options available for marketers to display the analysis of collected information to derive business insights. It covers methods such as, bar chart, histogram and line graphs. Persuade your audience using this Quantitative Data Analysis Representation Methods With Benefits Template PDF. This PPT design covers four stages, thus making it a great tool to use. It also caters to a variety of topics including Bar Chart, Histogram, Line Graphs. Download this PPT design now to present a convincing pitch that not only emphasizes the topic but also showcases your presentation skills.
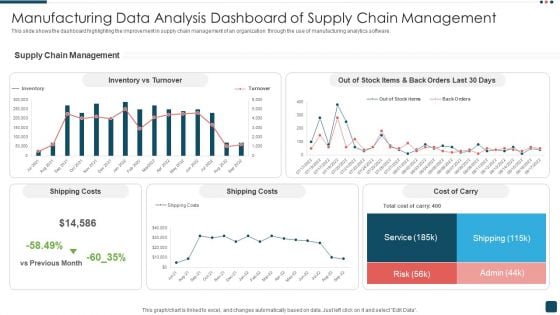
Manufacturing Data Analysis Dashboard Of Supply Chain Management Background PDF
This slide shows the dashboard highlighting the improvement in supply chain management of an organization through the use of manufacturing analytics software. Showcasing this set of slides titled Manufacturing Data Analysis Dashboard Of Supply Chain Management Background PDF. The topics addressed in these templates are Shipping Costs, Service, Risk. All the content presented in this PPT design is completely editable. Download it and make adjustments in color, background, font etc. as per your unique business setting.
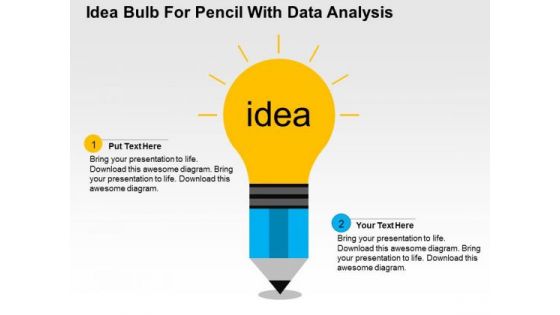
Idea Bulb With Pencil For Data Analysis PowerPoint Template
You can download this PowerPoint template for analysis of business data. It contains graphics of bulb with pencil. Draw an innovative business idea using t his diagram.
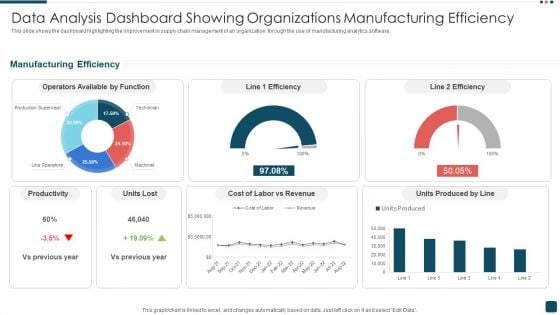
Data Analysis Dashboard Showing Organizations Manufacturing Efficiency Demonstration PDF
This slide shows the dashboard highlighting the improvement in supply chain management of an organization through the use of manufacturing analytics software. Pitch your topic with ease and precision using this Data Analysis Dashboard Showing Organizations Manufacturing Efficiency Demonstration PDF. This layout presents information on Productivity, Revenue, Manufacturing Efficiency. It is also available for immediate download and adjustment. So, changes can be made in the color, design, graphics or any other component to create a unique layout.
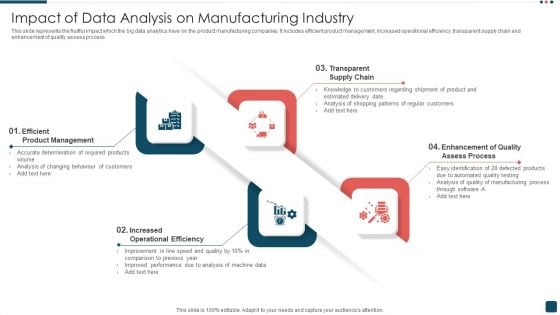
Impact Of Data Analysis On Manufacturing Industry Clipart PDF
This slide represents the fruitful impact which the big data analytics have on the product manufacturing companies. It includes efficient product management, increased operational efficiency, transparent supply chain and enhancement of quality assess process. Presenting Impact Of Data Analysis On Manufacturing Industry Clipart PDF to dispense important information. This template comprises four stages. It also presents valuable insights into the topics including Transparent Supply Chain, Enhancement Of Quality, Increased Operational Efficiency. This is a completely customizable PowerPoint theme that can be put to use immediately. So, download it and address the topic impactfully.
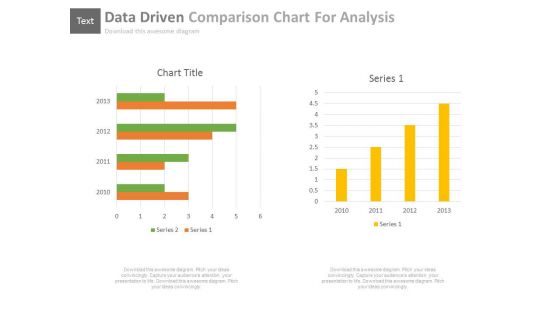
Data Driven Comparison Charts For Analysis Powerpoint Slides
You can download this PowerPoint template to display statistical data and analysis. This PPT slide contains data driven comparison charts. Draw an innovative business idea using this professional diagram.
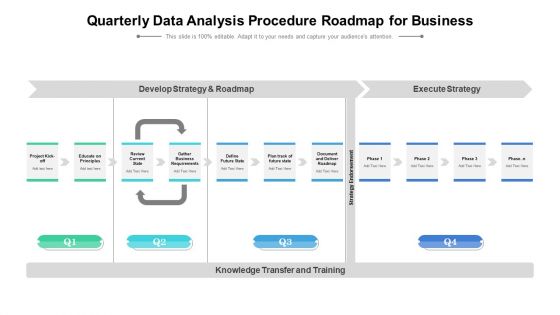
Quarterly Data Analysis Procedure Roadmap For Business Elements
Presenting our innovatively structured quarterly data analysis procedure roadmap for business elements Template. Showcase your roadmap process in different formats like PDF, PNG, and JPG by clicking the download button below. This PPT design is available in both Standard Screen and Widescreen aspect ratios. It can also be easily personalized and presented with modified font size, font type, color, and shapes to measure your progress in a clear way.
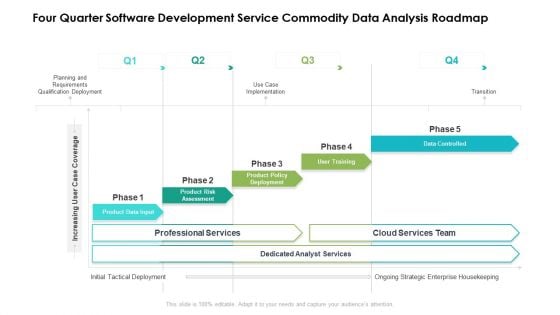
Four Quarter Software Development Service Commodity Data Analysis Roadmap Brochure
Presenting our innovatively structured four quarter software development service commodity data analysis roadmap brochure Template. Showcase your roadmap process in different formats like PDF, PNG, and JPG by clicking the download button below. This PPT design is available in both Standard Screen and Widescreen aspect ratios. It can also be easily personalized and presented with modified font size, font type, color, and shapes to measure your progress in a clear way.
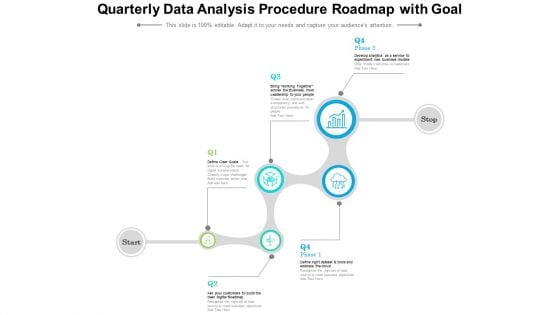
Quarterly Data Analysis Procedure Roadmap With Goal Summary
Introducing our quarterly data analysis procedure roadmap with goal summary. This PPT presentation is Google Slides compatible, therefore, you can share it easily with the collaborators for measuring the progress. Also, the presentation is available in both standard screen and widescreen aspect ratios. So edit the template design by modifying the font size, font type, color, and shapes as per your requirements. As this PPT design is fully editable it can be presented in PDF, JPG and PNG formats.
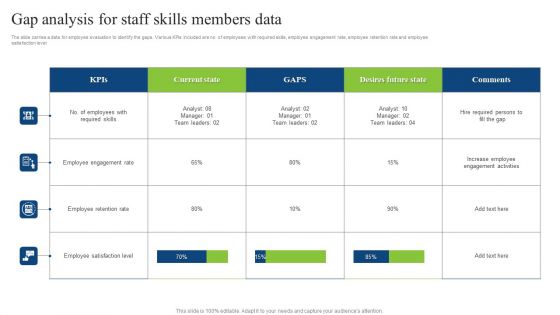
Gap Analysis For Staff Skills Members Data Guidelines PDF
The slide carries a data for employee evaluation to identify the gaps. Various KPIs included are no. of employees with required skills, employee engagement rate, employee retention rate and employee satisfaction level. Showcasing this set of slides titled Gap Analysis For Staff Skills Members Data Guidelines PDF. The topics addressed in these templates are Employee Engagement Rate, Employee Retention Rate. All the content presented in this PPT design is completely editable. Download it and make adjustments in color, background, font etc. as per your unique business setting.
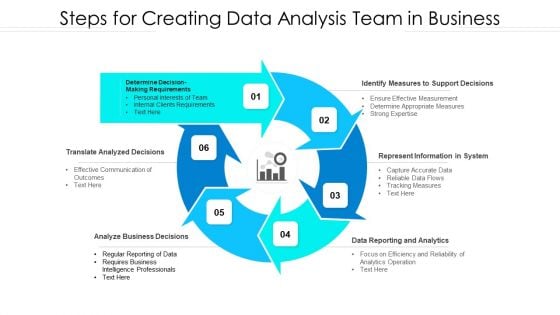
Steps For Creating Data Analysis Team In Business Information PDF
Presenting steps for creating data analysis team in business information pdf. to dispense important information. This template comprises six stages. It also presents valuable insights into the topics including translate analyzed decisions analyze, business decisions, identify measures to support decisions, represent information in system. This is a completely customizable PowerPoint theme that can be put to use immediately. So, download it and address the topic impactfully.
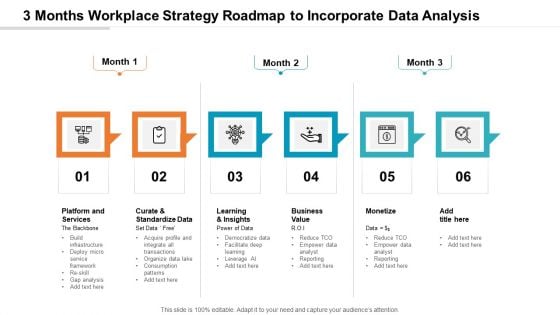
3 Months Workplace Strategy Roadmap To Incorporate Data Analysis Slides
Presenting our jaw-dropping 3 months workplace strategy roadmap to incorporate data analysis slides. You can alternate the color, font size, font type, and shapes of this PPT layout according to your strategic process. This PPT presentation is compatible with Google Slides and is available in both standard screen and widescreen aspect ratios. You can also download this well-researched PowerPoint template design in different formats like PDF, JPG, and PNG. So utilize this visually-appealing design by clicking the download button given below.
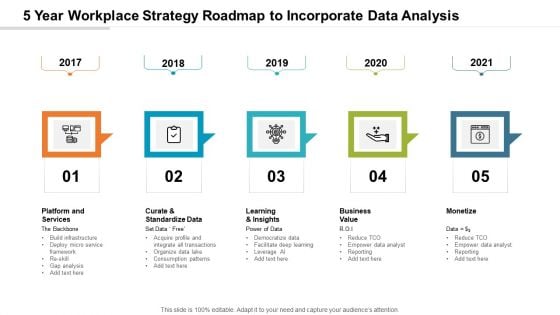
5 Year Workplace Strategy Roadmap To Incorporate Data Analysis Slides
Presenting our jaw-dropping 5 year workplace strategy roadmap to incorporate data analysis slides. You can alternate the color, font size, font type, and shapes of this PPT layout according to your strategic process. This PPT presentation is compatible with Google Slides and is available in both standard screen and widescreen aspect ratios. You can also download this well-researched PowerPoint template design in different formats like PDF, JPG, and PNG. So utilize this visually-appealing design by clicking the download button given below.
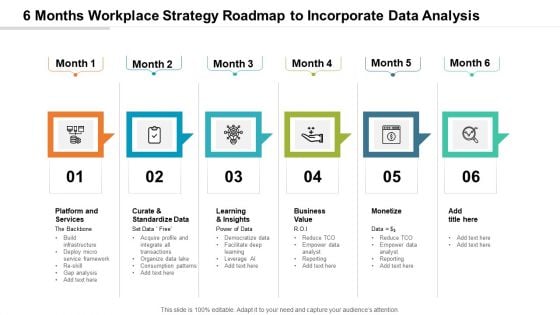
6 Months Workplace Strategy Roadmap To Incorporate Data Analysis Structure
Presenting our jaw-dropping 6 months workplace strategy roadmap to incorporate data analysis structure. You can alternate the color, font size, font type, and shapes of this PPT layout according to your strategic process. This PPT presentation is compatible with Google Slides and is available in both standard screen and widescreen aspect ratios. You can also download this well-researched PowerPoint template design in different formats like PDF, JPG, and PNG. So utilize this visually-appealing design by clicking the download button given below.
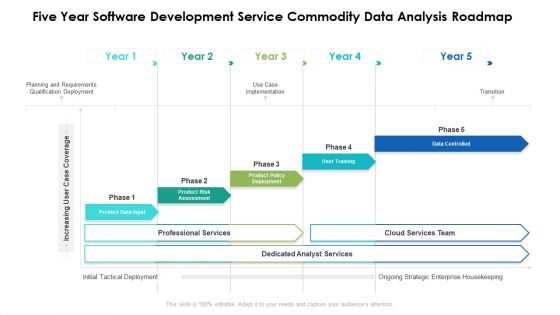
Five Year Software Development Service Commodity Data Analysis Roadmap Clipart
Presenting our innovatively structured five year software development service commodity data analysis roadmap clipart Template. Showcase your roadmap process in different formats like PDF, PNG, and JPG by clicking the download button below. This PPT design is available in both Standard Screen and Widescreen aspect ratios. It can also be easily personalized and presented with modified font size, font type, color, and shapes to measure your progress in a clear way.
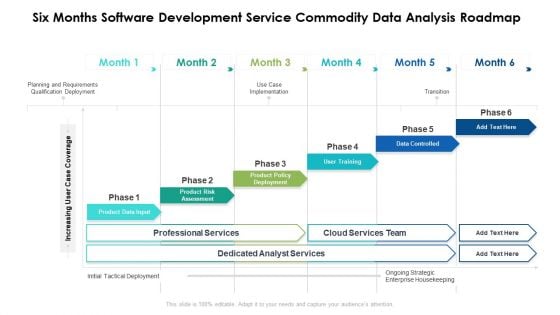
Six Months Software Development Service Commodity Data Analysis Roadmap Introduction
Presenting our innovatively structured six months software development service commodity data analysis roadmap introduction Template. Showcase your roadmap process in different formats like PDF, PNG, and JPG by clicking the download button below. This PPT design is available in both Standard Screen and Widescreen aspect ratios. It can also be easily personalized and presented with modified font size, font type, color, and shapes to measure your progress in a clear way.
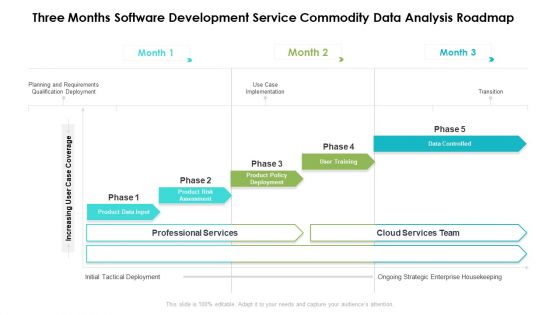
Three Months Software Development Service Commodity Data Analysis Roadmap Clipart
Presenting our innovatively structured three months software development service commodity data analysis roadmap clipart Template. Showcase your roadmap process in different formats like PDF, PNG, and JPG by clicking the download button below. This PPT design is available in both Standard Screen and Widescreen aspect ratios. It can also be easily personalized and presented with modified font size, font type, color, and shapes to measure your progress in a clear way.
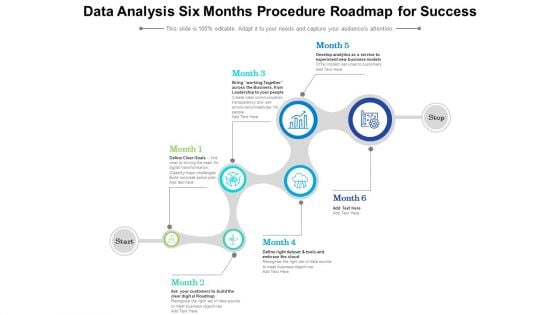
Data Analysis Six Months Procedure Roadmap For Success Ideas
Presenting our innovatively structured data analysis six months procedure roadmap for success ideas Template. Showcase your roadmap process in different formats like PDF, PNG, and JPG by clicking the download button below. This PPT design is available in both Standard Screen and Widescreen aspect ratios. It can also be easily personalized and presented with modified font size, font type, color, and shapes to measure your progress in a clear way.
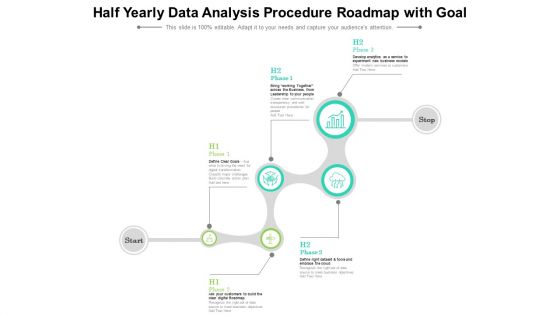
Half Yearly Data Analysis Procedure Roadmap With Goal Summary
Introducing our half yearly data analysis procedure roadmap with goal summary. This PPT presentation is Google Slides compatible, therefore, you can share it easily with the collaborators for measuring the progress. Also, the presentation is available in both standard screen and widescreen aspect ratios. So edit the template design by modifying the font size, font type, color, and shapes as per your requirements. As this PPT design is fully editable it can be presented in PDF, JPG and PNG formats.
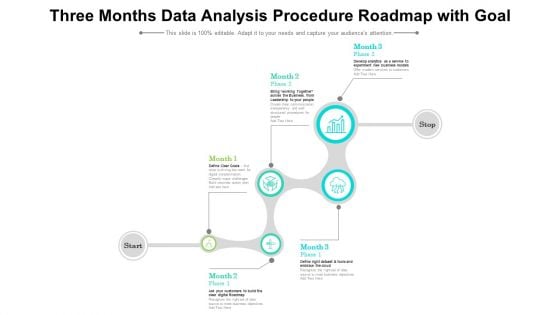
Three Months Data Analysis Procedure Roadmap With Goal Formats
Presenting our innovatively structured three months data analysis procedure roadmap with goal formats Template. Showcase your roadmap process in different formats like PDF, PNG, and JPG by clicking the download button below. This PPT design is available in both Standard Screen and Widescreen aspect ratios. It can also be easily personalized and presented with modified font size, font type, color, and shapes to measure your progress in a clear way.
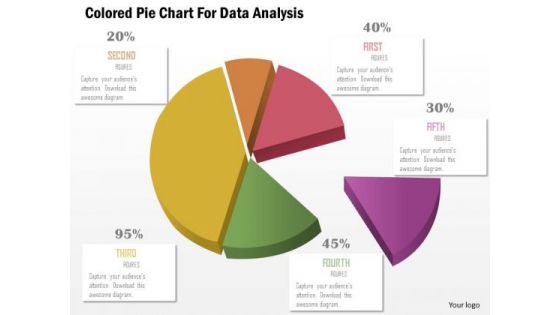
Business Diagram Colored Pie Chart For Data Analysis Presentation Template
This business slide displays pie chart. This diagram is a data visualization tool that gives you a simple way to present statistical information. This slide helps your audience examine and interpret the data you present.
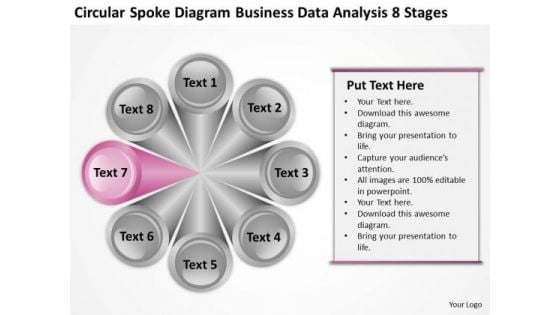
Spoke Diagram Business Data Analysis 8 Stages Plan PowerPoint Templates
We present our spoke diagram business data analysis 8 stages plan PowerPoint templates.Present our Finance PowerPoint Templates because You can Double your output with our PowerPoint Templates and Slides. They make beating deadlines a piece of cake. Download our Leadership PowerPoint Templates because Our PowerPoint Templates and Slides are aesthetically designed to attract attention. We gaurantee that they will grab all the eyeballs you need. Download our Circle Charts PowerPoint Templates because Our PowerPoint Templates and Slides will let your words and thoughts hit bullseye everytime. Use our Business PowerPoint Templates because It will mark the footprints of your journey. Illustrate how they will lead you to your desired destination. Use our Process and Flows PowerPoint Templates because Our PowerPoint Templates and Slides offer you the widest possible range of options.Use these PowerPoint slides for presentations relating to Chart, segmented, pie, hub, wheel, isolated, divided, business, communication, diagram, circle, graphic, process, element, tire, graph, marketing, illustration, icon, circular, round, clipart, design, success, set, spoke, button. The prominent colors used in the PowerPoint template are Purple, White, Gray. Ideas flow from our Spoke Diagram Business Data Analysis 8 Stages Plan PowerPoint Templates. They have the ability to be creative.
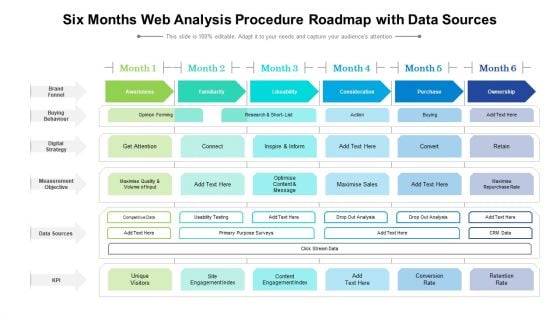
Six Months Web Analysis Procedure Roadmap With Data Sources Diagrams
Presenting our jaw dropping six months web analysis procedure roadmap with data sources diagrams. You can alternate the color, font size, font type, and shapes of this PPT layout according to your strategic process. This PPT presentation is compatible with Google Slides and is available in both standard screen and widescreen aspect ratios. You can also download this well researched PowerPoint template design in different formats like PDF, JPG, and PNG. So utilize this visually appealing design by clicking the download button given below.
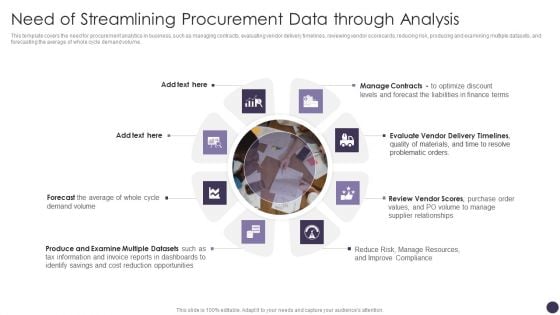
Need Of Streamlining Procurement Data Through Analysis Themes PDF
This template covers the need for procurement analytics in business, such as managing contracts, evaluating vendor delivery timelines, reviewing vendor scorecards, reducing risk, producing and examining multiple datasets, and forecasting the average of whole cycle demand volume. This is a Need Of Streamlining Procurement Data Through Analysis Themes PDF template with various stages. Focus and dispense information on eight stages using this creative set, that comes with editable features. It contains large content boxes to add your information on topics like Manage Contracts, Forecast The Liabilities, Problematic Orders. You can also showcase facts, figures, and other relevant content using this PPT layout. Grab it now.
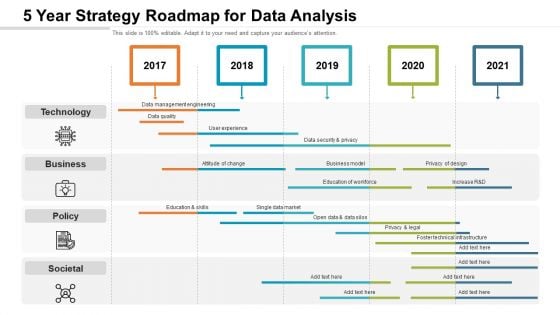
5 Year Strategy Roadmap For Data Analysis Diagrams
Presenting the 5 year strategy roadmap for data analysis diagrams. The template includes a roadmap that can be used to initiate a strategic plan. Not only this, the PowerPoint slideshow is completely editable and you can effortlessly modify the font size, font type, and shapes according to your needs. This PPT slide can be easily reached in standard screen and widescreen aspect ratios. The set is also available in various formats like PDF, PNG, and JPG. So download and use it multiple times as per your knowledge.
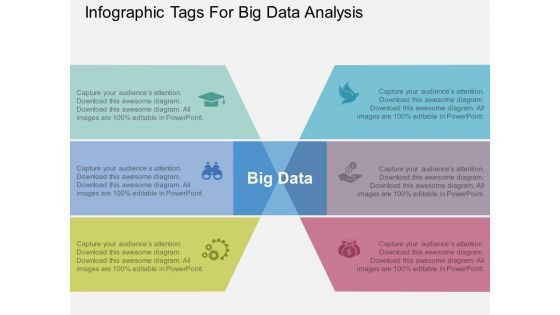
Infographic Tags For Big Data Analysis Powerpoint Template
Infographic tags have been displayed in this business slide. This PowerPoint template helps to exhibit big data analysis. Use this diagram to build an exclusive presentation.
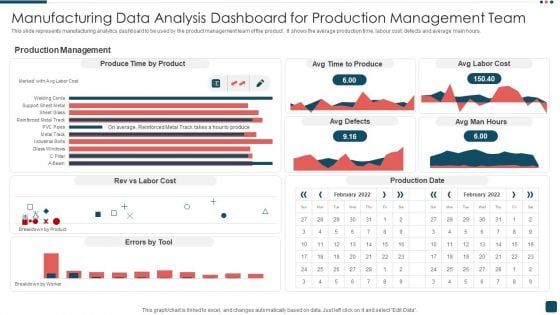
Manufacturing Data Analysis Dashboard For Production Management Team Summary PDF
This slide represents manufacturing analytics dashboard to be used by the product management team of the product . It shows the average production time, labour cost, defects and average main hours. Pitch your topic with ease and precision using this Manufacturing Data Analysis Dashboard For Production Management Team Summary PDF. This layout presents information on Production Management, Product, Cost. It is also available for immediate download and adjustment. So, changes can be made in the color, design, graphics or any other component to create a unique layout.
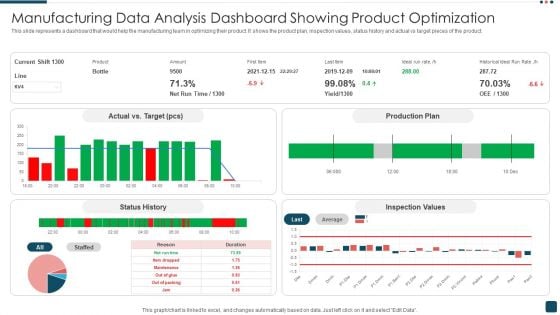
Manufacturing Data Analysis Dashboard Showing Product Optimization Structure PDF
This slide represents a dashboard that would help the manufacturing team in optimizing their product. It shows the product plan, inspection values, status history and actual vs target pieces of the product. Pitch your topic with ease and precision using this Manufacturing Data Analysis Dashboard Showing Product Optimization Structure PDF. This layout presents information on Target, Production Plan, Inspection Values. It is also available for immediate download and adjustment. So, changes can be made in the color, design, graphics or any other component to create a unique layout.
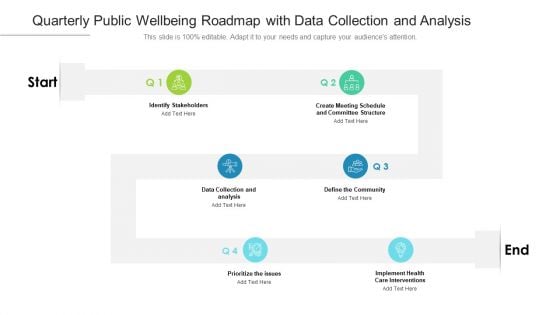
Quarterly Public Wellbeing Roadmap With Data Collection And Analysis Clipart
Presenting the quarterly public wellbeing roadmap with data collection and analysis clipart. The template includes a roadmap that can be used to initiate a strategic plan. Not only this, the PowerPoint slideshow is completely editable and you can effortlessly modify the font size, font type, and shapes according to your needs. This PPT slide can be easily reached in standard screen and widescreen aspect ratios. The set is also available in various formats like PDF, PNG, and JPG. So download and use it multiple times as per your knowledge.
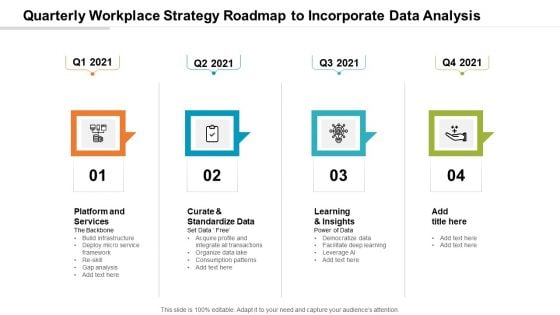
Quarterly Workplace Strategy Roadmap To Incorporate Data Analysis Download
Presenting the quarterly workplace strategy roadmap to incorporate data analysis download. The template includes a roadmap that can be used to initiate a strategic plan. Not only this, the PowerPoint slideshow is completely editable and you can effortlessly modify the font size, font type, and shapes according to your needs. This PPT slide can be easily reached in standard screen and widescreen aspect ratios. The set is also available in various formats like PDF, PNG, and JPG. So download and use it multiple times as per your knowledge.
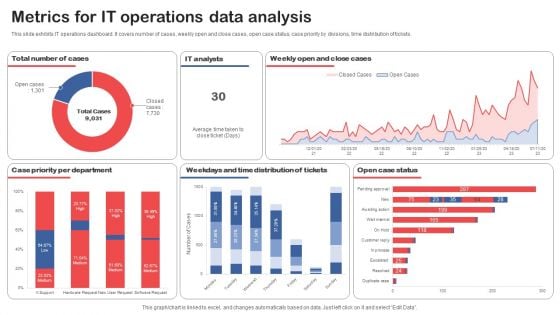
Metrics For IT Operations Data Analysis Topics PDF
This slide exhibits IT operations dashboard. It covers number of cases, weekly open and close cases, open case status, case priority by divisions, time distribution of tickets. Pitch your topic with ease and precision using this Metrics For IT Operations Data Analysis Topics PDF. This layout presents information on Case Priority Per Department, Distribution Of Tickets, Open Case Status. It is also available for immediate download and adjustment. So, changes can be made in the color, design, graphics or any other component to create a unique layout.
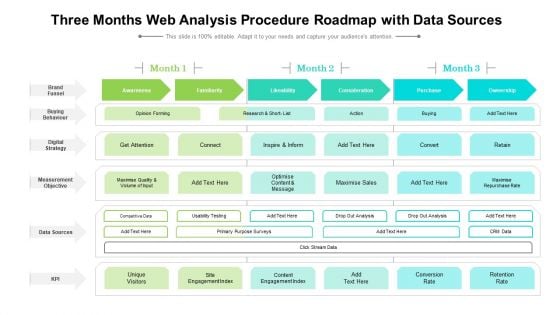
Three Months Web Analysis Procedure Roadmap With Data Sources Guidelines
Presenting our jaw dropping three months web analysis procedure roadmap with data sources guidelines. You can alternate the color, font size, font type, and shapes of this PPT layout according to your strategic process. This PPT presentation is compatible with Google Slides and is available in both standard screen and widescreen aspect ratios. You can also download this well researched PowerPoint template design in different formats like PDF, JPG, and PNG. So utilize this visually appealing design by clicking the download button given below.
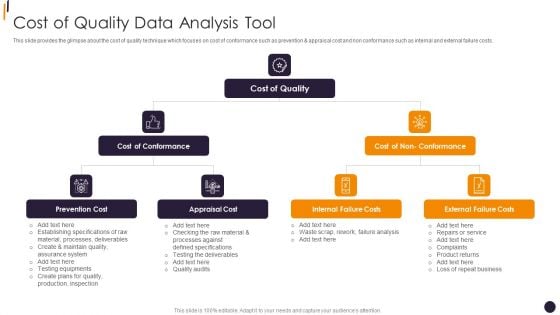
PMP Tools Cost Of Quality Data Analysis Tool Infographics PDF
This slide provides the glimpse about the cost of quality technique which focuses on cost of conformance such as prevention and appraisal cost and non conformance such as internal and external failure costs.Presenting PMP Tools Cost Of Quality Data Analysis Tool Infographics PDF to provide visual cues and insights. Share and navigate important information on six stages that need your due attention. This template can be used to pitch topics like Cost Of Conformance, Appraisal Cost, Prevention Cost In addtion, this PPT design contains high resolution images, graphics, etc, that are easily editable and available for immediate download.
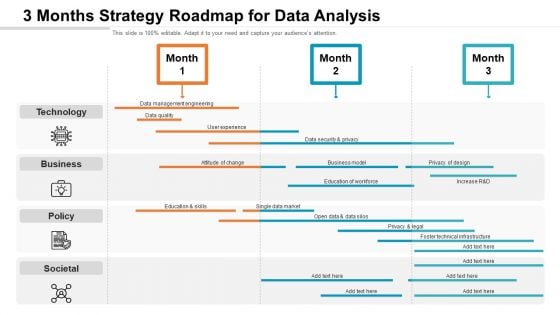
3 Months Strategy Roadmap For Data Analysis Pictures
Presenting the 3 months strategy roadmap for data analysis pictures. The template includes a roadmap that can be used to initiate a strategic plan. Not only this, the PowerPoint slideshow is completely editable and you can effortlessly modify the font size, font type, and shapes according to your needs. This PPT slide can be easily reached in standard screen and widescreen aspect ratios. The set is also available in various formats like PDF, PNG, and JPG. So download and use it multiple times as per your knowledge.
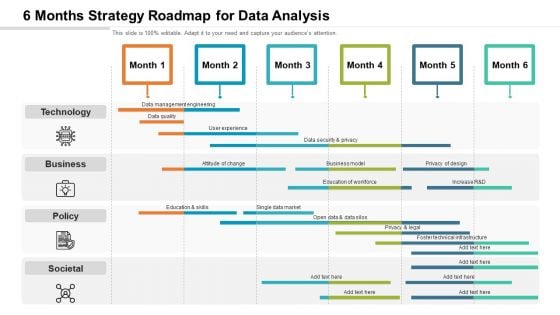
6 Months Strategy Roadmap For Data Analysis Demonstration
Presenting the 6 months strategy roadmap for data analysis demonstration. The template includes a roadmap that can be used to initiate a strategic plan. Not only this, the PowerPoint slideshow is completely editable and you can effortlessly modify the font size, font type, and shapes according to your needs. This PPT slide can be easily reached in standard screen and widescreen aspect ratios. The set is also available in various formats like PDF, PNG, and JPG. So download and use it multiple times as per your knowledge.
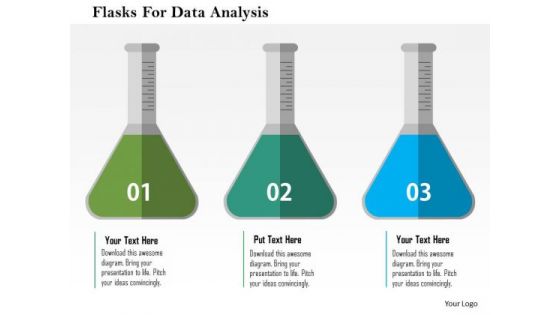
Business Diagram Flasks For Data Analysis Presentation Template
This business diagram displays three flasks. You may use this slide for data analysis. Make your mark with this unique slide. Create an impression that will endure.
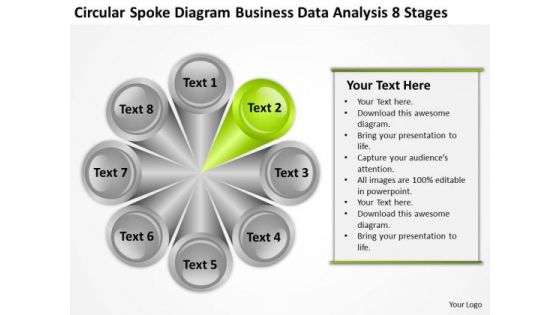
Business Data Analysis 8 Stages Ppt Plan Example PowerPoint Templates
We present our business data analysis 8 stages ppt plan example PowerPoint templates.Download and present our Process and Flows PowerPoint Templates because Our PowerPoint Templates and Slides will bullet point your ideas. See them fall into place one by one. Download our Circle Charts PowerPoint Templates because These PowerPoint Templates and Slides will give the updraft to your ideas. See them soar to great heights with ease. Present our Shapes PowerPoint Templates because Our PowerPoint Templates and Slides help you meet the demand of the Market. Just browse and pick the slides that appeal to your intuitive senses. Download our Flow Charts PowerPoint Templates because Our PowerPoint Templates and Slides are created by a hardworking bunch of busybees. Always flitting around with solutions gauranteed to please. Use our Business PowerPoint Templates because Our PowerPoint Templates and Slides will bullet point your ideas. See them fall into place one by one.Use these PowerPoint slides for presentations relating to Abstract, business, catalog, chart, circle, colors, cross, demonstration, description, design, diagram, futuristic, glossy, goals,illustration, information, interface, internet, isolated, level, list, marketing, model, multiple, navigation, network, pattern, presentation, registry, report, space, sphere, statement, statistics, steps, structure, wheel. The prominent colors used in the PowerPoint template are Gray, Green, White. Our Business Data Analysis 8 Stages Ppt Plan Example PowerPoint Templates offer easy availability and access. You will find them always around.
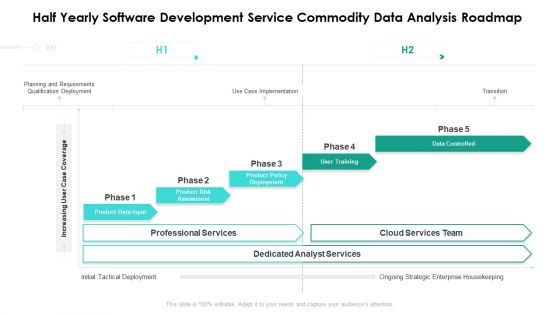
Half Yearly Software Development Service Commodity Data Analysis Roadmap Rules
Presenting the half yearly software development service commodity data analysis roadmap rules. The template includes a roadmap that can be used to initiate a strategic plan. Not only this, the PowerPoint slideshow is completely editable and you can effortlessly modify the font size, font type, and shapes according to your needs. This PPT slide can be easily reached in standard screen and widescreen aspect ratios. The set is also available in various formats like PDF, PNG, and JPG. So download and use it multiple times as per your knowledge.
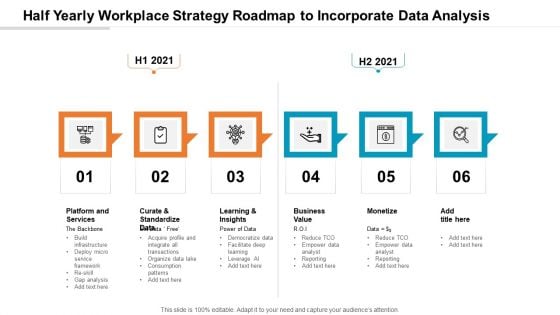
Half Yearly Workplace Strategy Roadmap To Incorporate Data Analysis Demonstration
Presenting the half yearly workplace strategy roadmap to incorporate data analysis demonstration. The template includes a roadmap that can be used to initiate a strategic plan. Not only this, the PowerPoint slideshow is completely editable and you can effortlessly modify the font size, font type, and shapes according to your needs. This PPT slide can be easily reached in standard screen and widescreen aspect ratios. The set is also available in various formats like PDF, PNG, and JPG. So download and use it multiple times as per your knowledge.
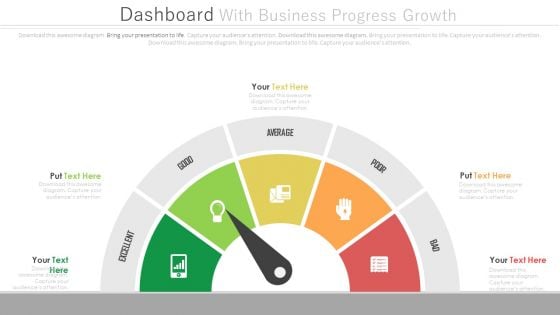
Dashboard To Simplify Business Data Analysis Powerpoint Slides
This PowerPoint template graphics of meter chart. Download this PPT chart to simplify business data analysis. This PowerPoint slide is of great help in the business sector to make realistic presentations and provides effective way of presenting your newer thoughts.
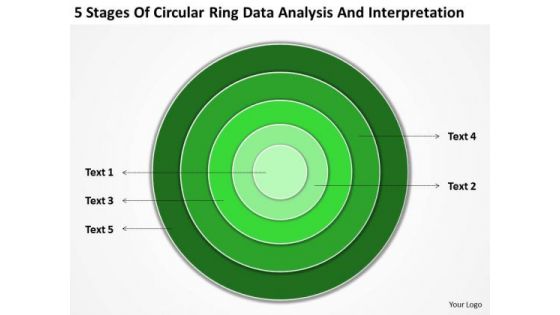
Ring Data Analysis And Interpretation Business Plan Template PowerPoint Templates
We present our ring data analysis and interpretation business plan template PowerPoint templates.Present our Circle Charts PowerPoint Templates because Our PowerPoint Templates and Slides are a sure bet. Gauranteed to win against all odds. Download and present our Business PowerPoint Templates because you should once Tap the ingenuity of our PowerPoint Templates and Slides. They are programmed to succeed. Download our Shapes PowerPoint Templates because Our PowerPoint Templates and Slides are truly out of this world. Even the MIB duo has been keeping tabs on our team. Present our Signs PowerPoint Templates because They will Put your wonderful verbal artistry on display. Our PowerPoint Templates and Slides will provide you the necessary glam and glitter. Download our Metaphors-Visual Concepts PowerPoint Templates because Our PowerPoint Templates and Slides are Clear and concise. Use them and dispel any doubts your team may have.Use these PowerPoint slides for presentations relating to metal, wallpaper, decoration, chrome, vivid, blank, glossy, bright, template, curvy, copyspace, circle, light, decor, element, digital, card, simple, wavy, shape, abstract, wave, modern, creative, circular, round, shiny, backdrop, reflection, design, abstraction, gold, cover, color, colorful, empty, picture, banner, twirl, art, golden, background, border, vortex. The prominent colors used in the PowerPoint template are Green dark , Green, Green lime . Carry your team with our Ring Data Analysis And Interpretation Business Plan Template PowerPoint Templates. You will come out on top.
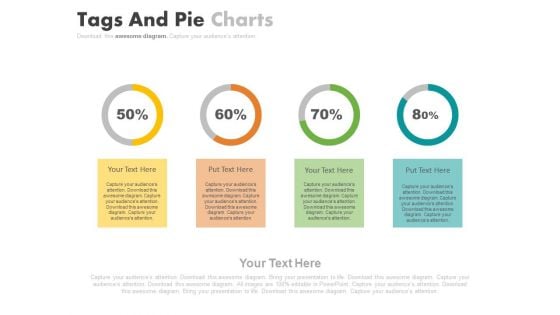
Four Steps For Financial Data Analysis Powerpoint Slides
This PowerPoint contains four circles with percentage values. Download this diagram slide to display financial data analysis. This template is editable, You can edit text, color, shade and style of this diagram as per you need.
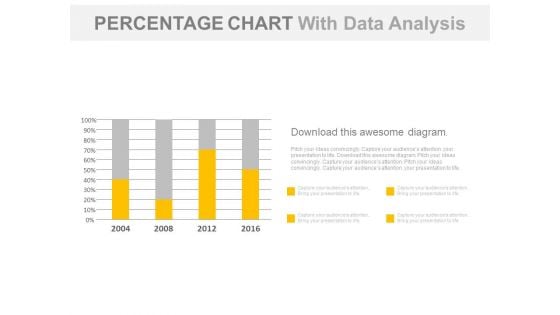
Year Based Chart With Percentage Data Analysis Powerpoint Slides
Our above business slide contains year based statistical chart. This PowerPoint template can be used to display percentage data analysis. Capture the attention of your audience with this slide.
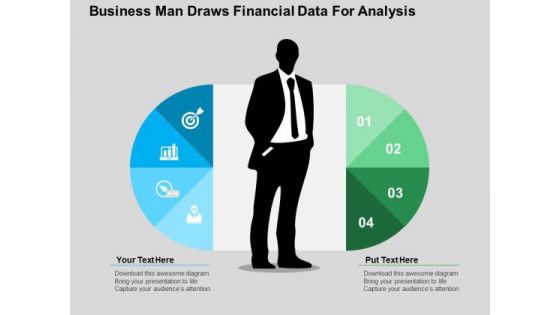
Business Man Draws Financial Data For Analysis PowerPoint Templates
This PowerPoint slide has a theme for financial data analysis. This image has been designed to display concept of financial planning and analysis. Deliver amazing presentations to mesmerize your audience using this image
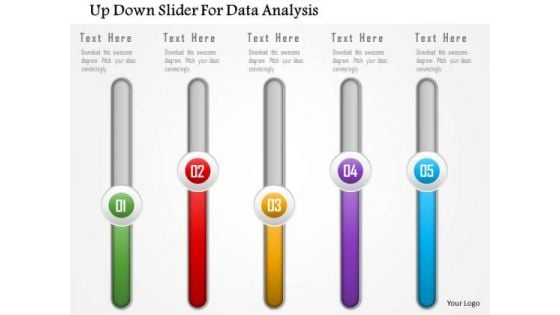
Business Diagram Up Down Slider For Data Analysis Presentation Template
This business diagram has been designed with graphics of slider. You may download this professional slide to display data trends. Transmit your thoughts via this slide.
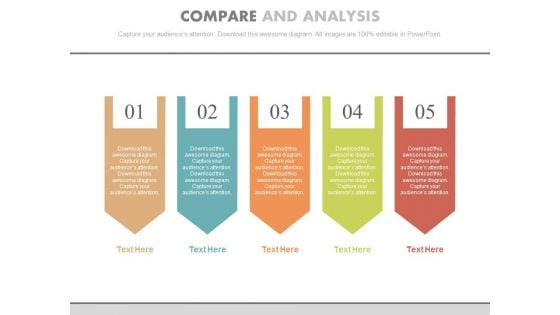
Five Steps For Data Compare And Analysis Powerpoint Template
Our above slide contains graphics of five steps chart. This PowerPoint template is useful for data compare and analysis. Use this diagram to impart more clarity to subject and to create more sound impact on viewers.

 Home
Home