Data Analysis Icon
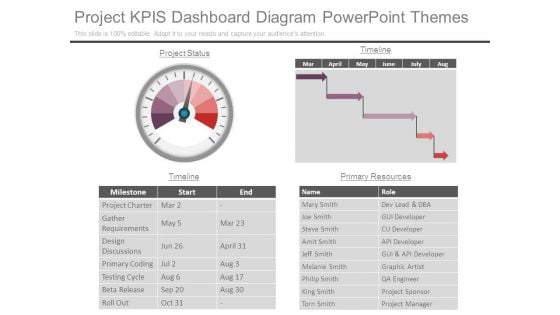
Project Kpis Dashboard Diagram Powerpoint Themes
This is a project kpis dashboard diagram powerpoint themes. This is a one stage process. The stages in this process are project status, timeline, name, role, milestone, start, end, primary resources, project charter, gather requirements, design discussions, primary coding, testing cycle, beta release, roll out, mary smith, joe smith, steve smith, amit smith, jeff smith, melanie smith, philip smith, king smith, torn smith, dev lead and dba, gui developer, cu developer, api developer, gui and api developer, graphic artist, qa engineer, project sponsor, project manager.
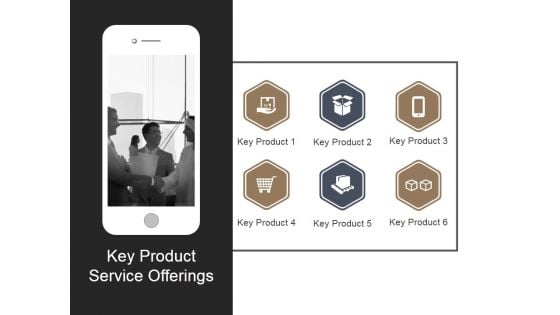
Key Product Service Offerings Template 1 Ppt PowerPoint Presentation Shapes
This is a key product service offerings template 1 ppt powerpoint presentation shapes. This is a six stage process. The stages in this process are key product, icons, strategy, mobile, technology.
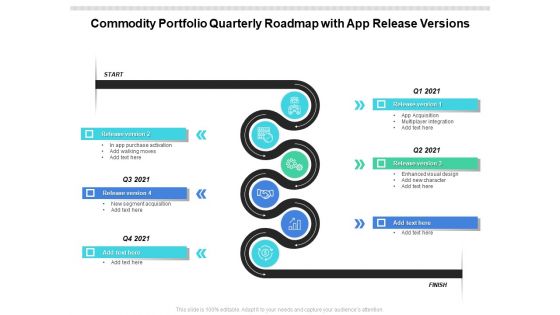
Commodity Portfolio Quarterly Roadmap With App Release Versions Introduction
Presenting the commodity portfolio quarterly roadmap with app release versions introduction. The template includes a roadmap that can be used to initiate a strategic plan. Not only this, the PowerPoint slideshow is completely editable and you can effortlessly modify the font size, font type, and shapes according to your needs. This PPT slide can be easily reached in standard screen and widescreen aspect ratios. The set is also available in various formats like PDF, PNG, and JPG. So download and use it multiple times as per your knowledge.
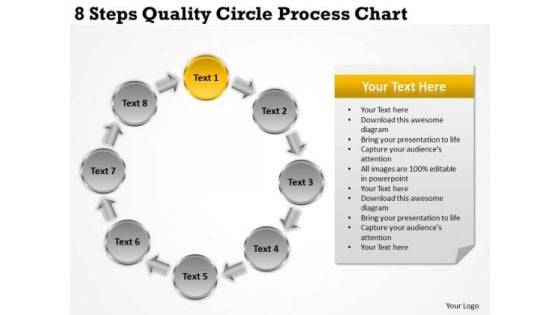
Internet Business Strategy 8 Steps Quality Circle Process Chart Model
We present our internet business strategy 8 steps quality circle process chart model.Present our Advertising PowerPoint Templates because Our PowerPoint Templates and Slides are Clear and concise. Use them and dispel any doubts your team may have. Download our Business PowerPoint Templates because Our PowerPoint Templates and Slides offer you the needful to organise your thoughts. Use them to list out your views in a logical sequence. Download and present our Arrows PowerPoint Templates because Our PowerPoint Templates and Slides will give you great value for your money. Be assured of finding the best projection to highlight your words. Download our Circle Charts PowerPoint Templates because Our PowerPoint Templates and Slides are Clear and concise. Use them and dispel any doubts your team may have. Download our Marketing PowerPoint Templates because You can Hit a home run with our PowerPoint Templates and Slides. See your ideas sail into the minds of your audience.Use these PowerPoint slides for presentations relating to Arrow, Diagram, Website, Search, Content, Green, Back Link, Red, Yellow, Vector, Code, Template, Circle, Orange, Process, Analysis, Violet, Engine, Tracking, Keyword, Illustration, Optimization, Purple, Visitor, Colorful, Blue, Background. The prominent colors used in the PowerPoint template are Yellow, Gray, Black. Facilitate your discourse with our Internet Business Strategy 8 Steps Quality Circle Process Chart Model. Add to the amenities at your command.
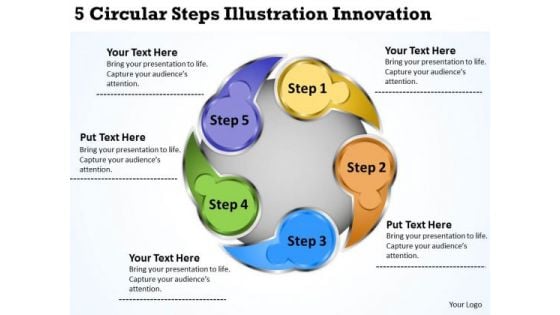
Business Logic Diagram 5 Circular Steps Illustration Innovation PowerPoint Slides
We present our business logic diagram 5 circular steps illustration innovation PowerPoint Slides.Download our Advertising PowerPoint Templates because You can Be the puppeteer with our PowerPoint Templates and Slides as your strings. Lead your team through the steps of your script. Use our Circle Charts PowerPoint Templates because It will Raise the bar of your Thoughts. They are programmed to take you to the next level. Present our Business PowerPoint Templates because Our PowerPoint Templates and Slides will provide weight to your words. They will bring out the depth of your thought process. Download our Shapes PowerPoint Templates because It will Give impetus to the hopes of your colleagues. Our PowerPoint Templates and Slides will aid you in winning their trust. Download our Arrows PowerPoint Templates because Our PowerPoint Templates and Slides are focused like a searchlight beam. They highlight your ideas for your target audience.Use these PowerPoint slides for presentations relating to Analysis, Arrow, Blue, Business, Chart, Circle, Circular, Cycle, Diagram, Five, Flow, Flow-Chart, Flowchart, Graphic, Green, Implementation, Infographic, Lifecycle, Model, Phase, Process, Red, Step, Work, Work-Flow, Workflow, Yellow. The prominent colors used in the PowerPoint template are Yellow, Orange, Green. Progress is inevitable with our Business Logic Diagram 5 Circular Steps Illustration Innovation PowerPoint Slides. Download without worries with our money back guaranteee.
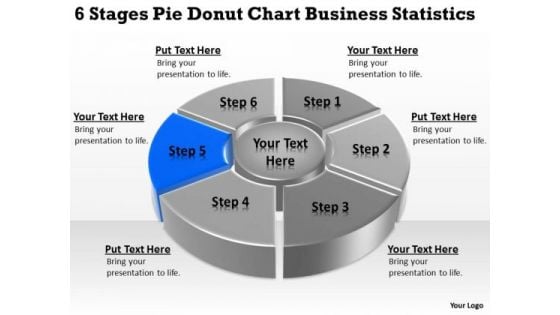
Templates Free Download Statistics Startup Business Plan Outline PowerPoint
We present our templates free download statistics startup business plan outline PowerPoint.Download our Process and Flows PowerPoint Templates because It can be used to Set your controls for the heart of the sun. Our PowerPoint Templates and Slides will be the propellant to get you there. Download our Circle Charts PowerPoint Templates because Our PowerPoint Templates and Slides will steer your racing mind. Hit the right buttons and spur on your audience. Present our Marketing PowerPoint Templates because You can Raise a toast with our PowerPoint Templates and Slides. Spread good cheer amongst your audience. Present our Flow Charts PowerPoint Templates because You can Double your output with our PowerPoint Templates and Slides. They make beating deadlines a piece of cake. Use our Business PowerPoint Templates because You can Rise to the occasion with our PowerPoint Templates and Slides. You will bring your audience on their feet in no time.Use these PowerPoint slides for presentations relating to Infographic, graph, chart, data, icon, diagram, progress, bar, line, download, button, pie, search, time, statistics, percent, segment, cloud, business, concept, sign,loading, symbol, template, circle, graphic, modern, status, visualization, roundabstract, management, mba, manage, illustration, weakness, strategy, project, clipart, guidelines, direction, design, organization, commerce, conceptual,heirarchy, resource, theoretical, action, goals, performance. The prominent colors used in the PowerPoint template are Blue, Gray, White. Display your class with our Templates Free Download Statistics Startup Business Plan Outline PowerPoint. Demonstrate your expertise to your audience.

Hyper Automation Solutions Table Of Contents Themes PDF
Find a pre-designed and impeccable Hyper Automation Solutions Table Of Contents Themes PDF. The templates can ace your presentation without additional effort. You can download these easy-to-edit presentation templates to make your presentation stand out from others. So, what are you waiting for Download the template from Slidegeeks today and give a unique touch to your presentation. Find a pre-designed and impeccable Hyper Automation Solutions Table Of Contents Themes PDF. The templates can ace your presentation without additional effort. You can download these easy-to-edit presentation templates to make your presentation stand out from others. So, what are you waiting for Download the template from Slidegeeks today and give a unique touch to your presentation.
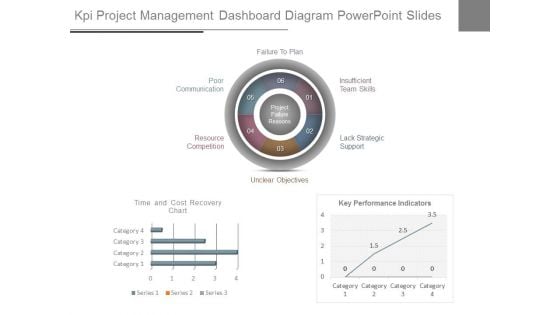
Kpi Project Management Dashboard Diagram Powerpoint Slides
This is a kpi project management dashboard diagram powerpoint slides. This is a three stage process. The stages in this process are unclear objectives, resource competition, poor communication, failure to plan, insufficient team skills, lack strategic support.
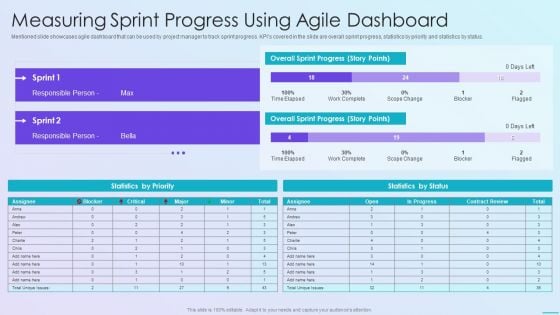
Playbook For Application Developers Measuring Sprint Progress Using Agile Dashboard Mockup PDF
Mentioned slide showcases agile dashboard that can be used by project manager to track sprint progress. KPIs covered in the slide are overall sprint progress, statistics by priority and statistics by status.Deliver and pitch your topic in the best possible manner with this Playbook for application developers measuring sprint progress using agile dashboard mockup pdf. Use them to share invaluable insights on measuring sprint progress using agile dashboard and impress your audience. This template can be altered and modified as per your expectations. So, grab it now.
Tracking The Improvements Buzz Marketing Techniques For Engaging Rules Pdf
This slide showcases the KPIs that would help the business organization to evaluate buzz marketing campaigns improvements. It includes social media followers, YouTube subscribers, Facebook engagement and page impressions, page likes, etc. If you are looking for a format to display your unique thoughts, then the professionally designed Tracking The Improvements Buzz Marketing Techniques For Engaging Rules Pdf is the one for you. You can use it as a Google Slides template or a PowerPoint template. Incorporate impressive visuals, symbols, images, and other charts. Modify or reorganize the text boxes as you desire. Experiment with shade schemes and font pairings. Alter, share or cooperate with other people on your work. Download Tracking The Improvements Buzz Marketing Techniques For Engaging Rules Pdf and find out how to give a successful presentation. Present a perfect display to your team and make your presentation unforgettable. This slide showcases the KPIs that would help the business organization to evaluate buzz marketing campaigns improvements. It includes social media followers, YouTube subscribers, Facebook engagement and page impressions, page likes, etc.
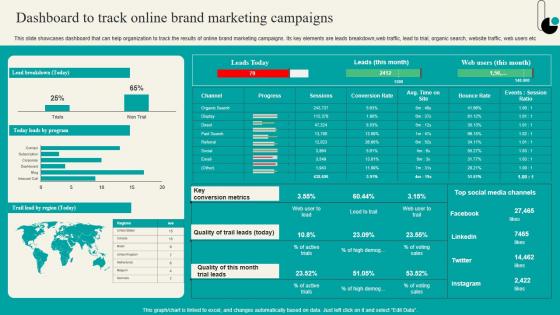
Dashboard To Track Online Brand Marketing Strategic Marketing Plan Themes PDF
This slide showcases dashboard that can help organization to track the results of online brand marketing campaigns. Its key elements are leads breakdown,web traffic, lead to trial, organic search, website traffic, web users etc. If you are looking for a format to display your unique thoughts, then the professionally designed Dashboard To Track Online Brand Marketing Strategic Marketing Plan Themes PDF is the one for you. You can use it as a Google Slides template or a PowerPoint template. Incorporate impressive visuals, symbols, images, and other charts. Modify or reorganize the text boxes as you desire. Experiment with shade schemes and font pairings. Alter, share or cooperate with other people on your work. Download Dashboard To Track Online Brand Marketing Strategic Marketing Plan Themes PDF and find out how to give a successful presentation. Present a perfect display to your team and make your presentation unforgettable. This slide showcases dashboard that can help organization to track the results of online brand marketing campaigns. Its key elements are leads breakdown,web traffic, lead to trial, organic search, website traffic, web users etc.
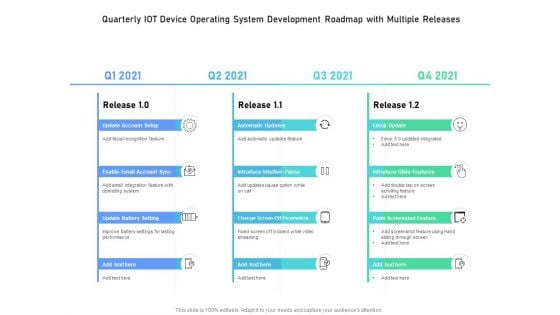
Quarterly IOT Device Operating System Development Roadmap With Multiple Releases Guidelines
Presenting the quarterly iot device operating system development roadmap with multiple releases guidelines. The template includes a roadmap that can be used to initiate a strategic plan. Not only this, the PowerPoint slideshow is completely editable and you can effortlessly modify the font size, font type, and shapes according to your needs. This PPT slide can be easily reached in standard screen and widescreen aspect ratios. The set is also available in various formats like PDF, PNG, and JPG. So download and use it multiple times as per your knowledge.
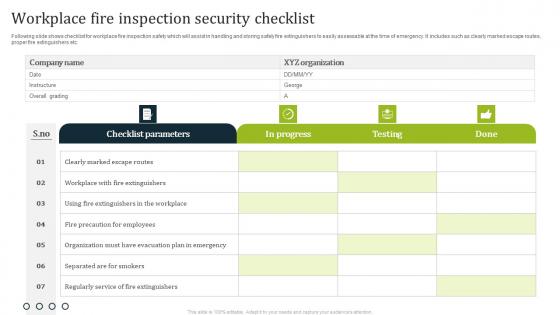
Workplace Fire Inspection Security Checklist Diagrams Pdf
Following slide shows checklist for workplace fire inspection safety which will assist in handling and storing safely fire extinguishers to easily assessable at the time of emergency. It includes such as clearly marked escape routes, proper fire extinguishers etc. Showcasing this set of slides titled Workplace Fire Inspection Security Checklist Diagrams Pdf. The topics addressed in these templates are Checklist Parameters, Done, Testing. All the content presented in this PPT design is completely editable. Download it and make adjustments in color, background, font etc. as per your unique business setting. Following slide shows checklist for workplace fire inspection safety which will assist in handling and storing safely fire extinguishers to easily assessable at the time of emergency. It includes such as clearly marked escape routes, proper fire extinguishers etc.
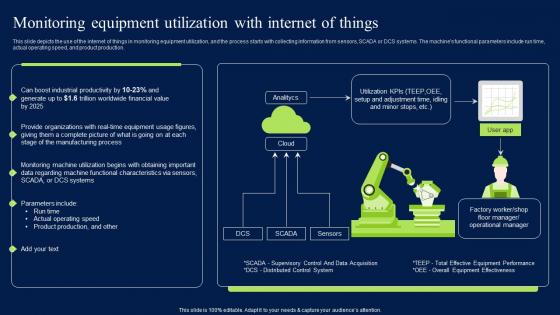
Monitoring Equipment Utilization With Internet Of Things Themes PDF
This slide depicts the use of the internet of things in monitoring equipment utilization, and the process starts with collecting information from sensors, SCADA or DCS systems. The machines functional parameters include run time, actual operating speed, and product production. Here you can discover an assortment of the finest PowerPoint and Google Slides templates. With these templates, you can create presentations for a variety of purposes while simultaneously providing your audience with an eye-catching visual experience. Download Monitoring Equipment Utilization With Internet Of Things Themes PDF to deliver an impeccable presentation. These templates will make your job of preparing presentations much quicker, yet still, maintain a high level of quality. Slidegeeks has experienced researchers who prepare these templates and write high-quality content for you. Later on, you can personalize the content by editing the Monitoring Equipment Utilization With Internet Of Things Themes PDF. This slide depicts the use of the internet of things in monitoring equipment utilization, and the process starts with collecting information from sensors, SCADA or DCS systems. The machines functional parameters include run time, actual operating speed, and product production.
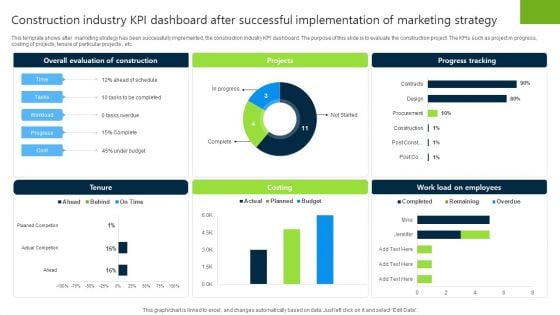
Construction Industry KPI Dashboard After Successful Implementation Of Marketing Strategy Sample PDF
This template shows after marketing strategy has been successfully implemented, the construction industry KPI dashboard. The purpose of this slide is to evaluate the construction project. The KPIs such as project in progress, costing of projects, tenure of particular projects , etc. Showcasing this set of slides titled Construction Industry KPI Dashboard After Successful Implementation Of Marketing Strategy Sample PDF. The topics addressed in these templates are Projetcs, Progress Tracking, Costing. All the content presented in this PPT design is completely editable. Download it and make adjustments in color, background, font etc. as per your unique business setting.
Firewall As A Service Performance Tracking Dashboard Network Security Guidelines Pdf
This slide represents the dashboard to track the performance of Firewall-as-a-Service deployed by different organizations. The purpose of this slide is to showcase the overall performance of FWaaS by demonstrating statistics of monthly threat status, etc. Crafting an eye-catching presentation has never been more straightforward. Let your presentation shine with this tasteful yet straightforward Firewall As A Service Performance Tracking Dashboard Network Security Guidelines Pdf template. It offers a minimalistic and classy look that is great for making a statement. The colors have been employed intelligently to add a bit of playfulness while still remaining professional. Construct the ideal Firewall As A Service Performance Tracking Dashboard Network Security Guidelines Pdf that effortlessly grabs the attention of your audience Begin now and be certain to wow your customers This slide represents the dashboard to track the performance of Firewall-as-a-Service deployed by different organizations. The purpose of this slide is to showcase the overall performance of FWaaS by demonstrating statistics of monthly threat status, etc.
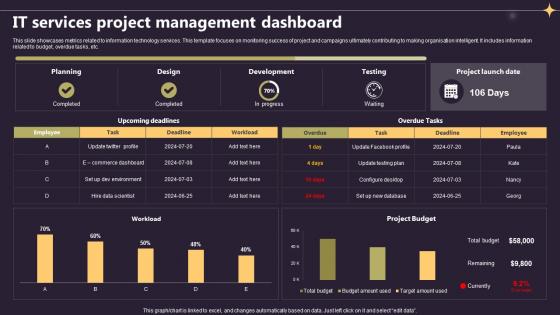
Closing A Project By Fulfilling It Services Project Management Dashboard PM SS V
This slide showcases metrics related to information technology services. This template focuses on monitoring success of project and campaigns ultimately contributing to making organisation intelligent. It includes information related to budget, overdue tasks, etc. Are you in need of a template that can accommodate all of your creative concepts This one is crafted professionally and can be altered to fit any style. Use it with Google Slides or PowerPoint. Include striking photographs, symbols, depictions, and other visuals. Fill, move around, or remove text boxes as desired. Test out color palettes and font mixtures. Edit and save your work, or work with colleagues. Download Closing A Project By Fulfilling It Services Project Management Dashboard PM SS V and observe how to make your presentation outstanding. Give an impeccable presentation to your group and make your presentation unforgettable. This slide showcases metrics related to information technology services. This template focuses on monitoring success of project and campaigns ultimately contributing to making organisation intelligent. It includes information related to budget, overdue tasks, etc.
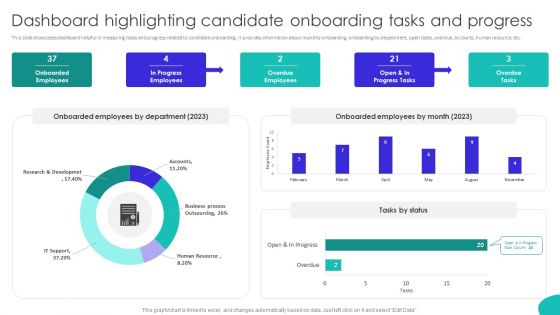
Improving Technology Based Dashboard Highlighting Candidate Onboarding Tasks Information PDF
This slide showcases dashboard helpful in measuring tasks and progress related to candidate onboarding. It provides information about monthly onboarding, onboarding by department, open tasks, overdue, accounts, human resource, etc. Slidegeeks is here to make your presentations a breeze with Improving Technology Based Dashboard Highlighting Candidate Onboarding Tasks Information PDF With our easy-to-use and customizable templates, you can focus on delivering your ideas rather than worrying about formatting. With a variety of designs to choose from, youre sure to find one that suits your needs. And with animations and unique photos, illustrations, and fonts, you can make your presentation pop. So whether youre giving a sales pitch or presenting to the board, make sure to check out Slidegeeks first.
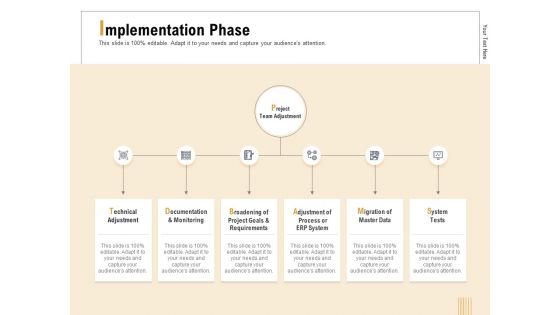
Business Activity Flows Optimization Implementation Phase Ppt PowerPoint Presentation Portfolio Smartart PDF
Presenting this set of slides with name business activity flows optimization implementation phase ppt powerpoint presentation portfolio smartart pdf. This is a eight stage process. The stages in this process are technical adjustment, documentation and monitoring, broadening of project goals and requirements, adjustment of process or erp system, migration of master data, system tests. This is a completely editable PowerPoint presentation and is available for immediate download. Download now and impress your audience.
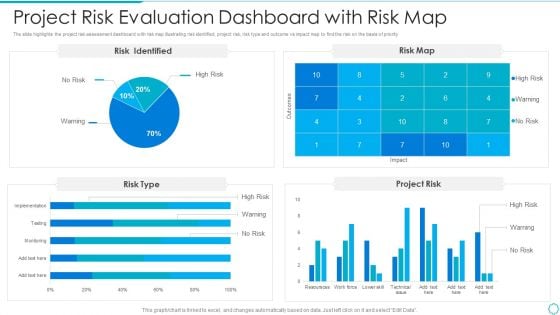
Project Risk Evaluation Dashboard With Risk Map Themes PDF
The slide highlights the project risk assessment dashboard with risk map illustrating risk identified, project risk, risk type and outcome vs impact map to find the risk on the basis of priority Showcasing this set of slides titled project risk evaluation dashboard with risk map themes pdf The topics addressed in these templates are project risk evaluation dashboard with risk map All the content presented in this PPT design is completely editable. Download it and make adjustments in color, background, font etc. as per your unique business setting.
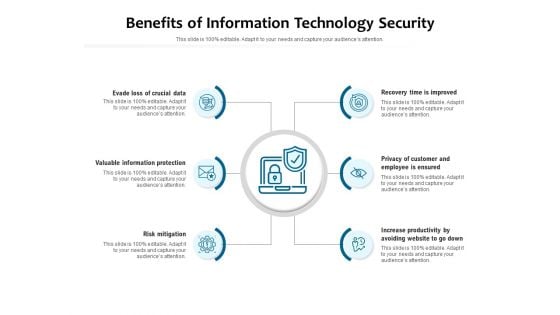
Benefits Of Information Technology Security Ppt PowerPoint Presentation Layouts Layouts PDF
Presenting benefits of information technology security ppt powerpoint presentation layouts layouts pdf to dispense important information. This template comprises six stages. It also presents valuable insights into the topics including evade loss of crucial data, valuable information protection, risk mitigation, recovery time is improved, privacy of customer and employee is ensured, increase productivity by avoiding website to go down. This is a completely customizable PowerPoint theme that can be put to use immediately. So, download it and address the topic impactfully.
Ppt Blue Factor Hexagon Angles Spider Diagram PowerPoint Template Editable Templates
PPT blue factor hexagon angles spider diagram PowerPoint template editable Templates-You can easily collaborate this PowerPoint diagram with colleagues to create detailed process diagrams and use them as a key element in streamlining your processes. Use this graphical approach to represent global business issues such as financial data, stock market Exchange, increase in sales, corporate presentations and more. -PPT blue factor hexagon angles spider diagram PowerPoint template editable Templates-attached, backgrounds, blue, cell, color, component, connect, connection, diagram, elements, geometric, graphic, group, hexagon, honeycomb, icon, illustration, intricacy, lines, link, map, mesh, model, network, science, shape, shiny, strategy, structure, symbol, teamwork, technology Out Ppt Blue Factor Hexagon Angles Spider Diagram PowerPoint Template Editable Templates embody the contemporary. They are always at the forefront of fashion.
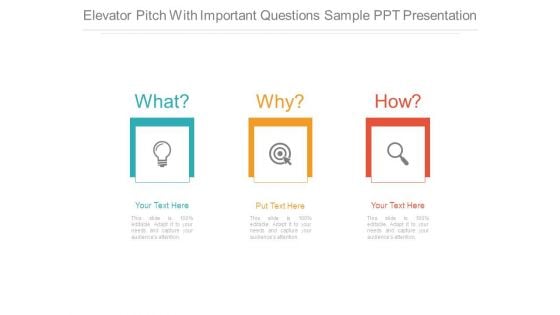
Elevator Pitch With Important Questions Sample Ppt Presentation
This is a elevator pitch with important questions sample ppt presentation. This is a three stage process. The stages in this process are technology, business, questioning, elevator, icons.

Silhouettes Ppt PowerPoint Presentation Layout
This is a silhouettes ppt powerpoint presentation layout. This is a five stage process. The stages in this process are icon, circle, process, people, technology.

Contact Us Ppt PowerPoint Presentation Pictures Aids
This is a contact us ppt powerpoint presentation pictures aids. This is a one stage process. The stages in this process are business, icons, strategy, technology.
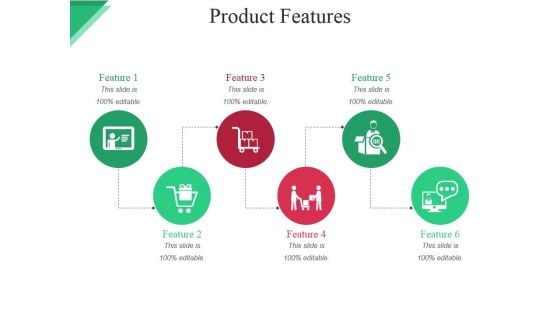
Product Features Template Ppt PowerPoint Presentation Gallery Examples
This is a product features template ppt powerpoint presentation gallery examples. This is a five stage process. The stages in this process are icons, technology, business, marketing, strategy.
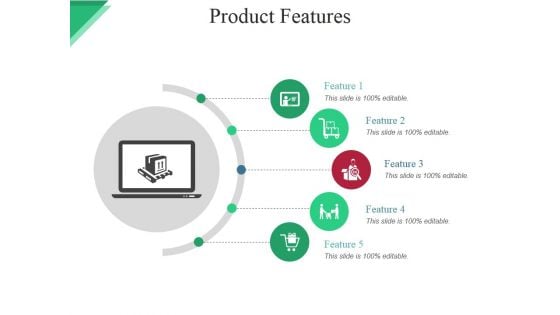
Product Features Ppt PowerPoint Presentation Infographics Microsoft
This is a product features ppt powerpoint presentation infographics microsoft. This is a six stage process. The stages in this process are icons, technology, business, marketing, strategy.
Bulb Or Idea Stretegy Ppt PowerPoint Presentation Pictures Aids
This is a bulb or idea stretegy ppt powerpoint presentation pictures aids. This is a four stage process. The stages in this process are icons, technology, strategy, marketing.
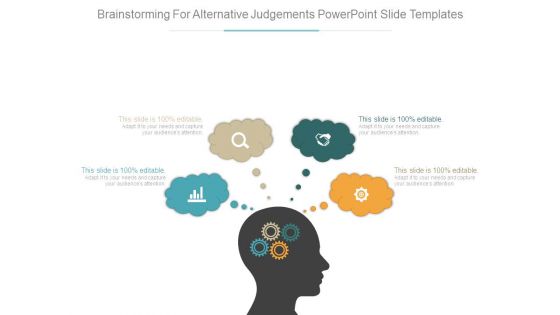
Brainstorming For Alternative Judgements Powerpoint Slide Templates
This is a brainstorming for alternative judgements powerpoint slide templates. This is a four stage process. The stages in this process are thought, business, gears, communication, icons, process.
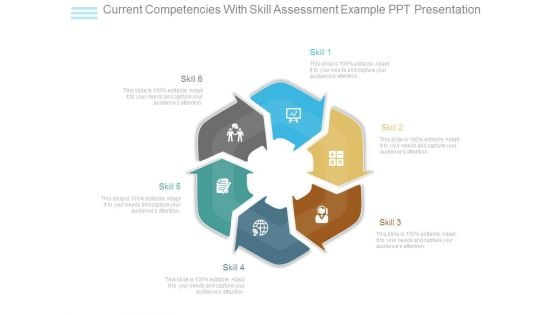
Current Competencies With Skill Assessment Example Ppt Presentation
This is a current competencies with skill assessment example ppt presentation. This is a six stage process. The stages in this process are process, business, management, marketing, icon.
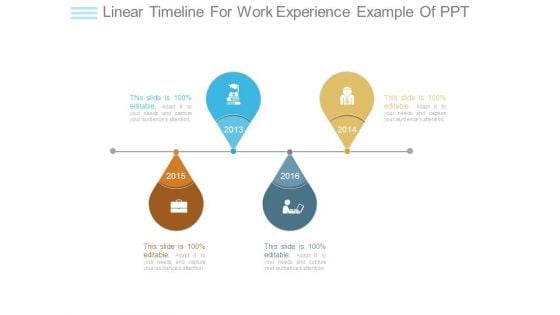
Linear Timeline For Work Experience Example Of Ppt
This is a linear timeline for work experience example of ppt. This is a four stage process. The stages in this process are business, management, icon, timeline, communication.
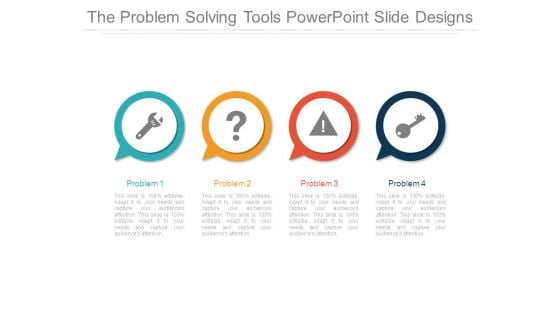
The Problem Solving Tools Powerpoint Slide Designs
This is a the problem solving tools powerpoint slide designs. This is a four stage process. The stages in this process are icon, business, marketing, solution, management.
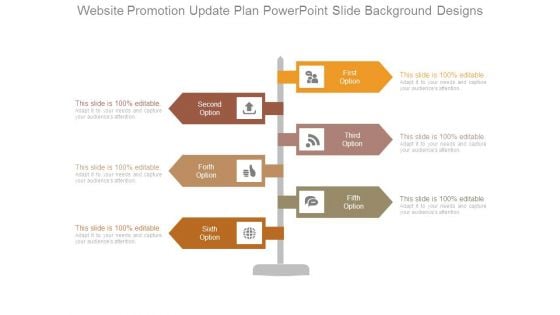
Website Promotion Update Plan Powerpoint Slide Background Designs
This is a website promotion update plan powerpoint slide background designs. This is a six stage process. The stages in this process are update, website, business, marketing, icon.
Company Goals And Objectives Good Ppt Example
This is a company goals and objectives good ppt example. This is a four stage process. The stages in this process are business, marketing, management, icon, goals.
Corporate Future Perspective Sample Ppt Presentation
This is a corporate future perspective sample ppt presentation. This is a four stage process. The stages in this process are business, marketing, icon, strategy, corporate.
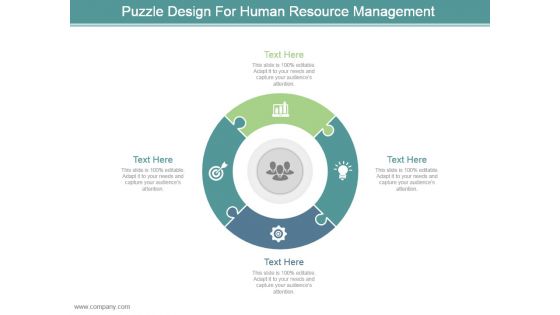
Puzzle Design For Human Resource Management Ppt Slide
This is a puzzle design for human resource management ppt slide. This is a four stage process. The stages in this process are circular, puzzles, icons, business, presentation.
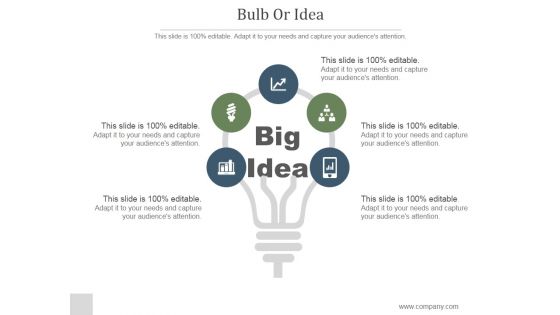
Bulb Or Idea Ppt PowerPoint Presentation Clipart
This is a bulb or idea ppt powerpoint presentation clipart. This is a five stage process. The stages in this process are ideas, business, marketing, icons.
Generate Idea Ppt PowerPoint Presentation Deck
This is a generate idea ppt powerpoint presentation deck. This is a two stage process. The stages in this process are marketing strategy, business, management, icons.
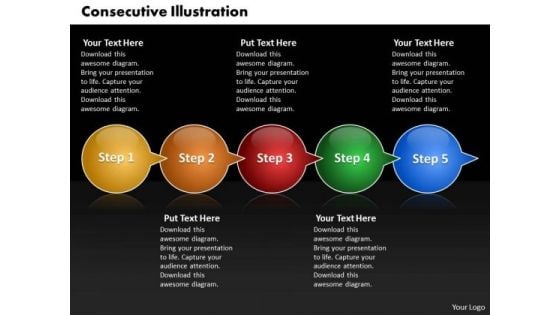
Ppt Consecutive Example Of 5 PowerPoint Slide Numbers Through Arrows Templates
PPT consecutive example of 5 powerpoint slide numbers through arrows Templates-The above template displays a diagram of circles connected with arrows. This is a graphic organizer for recording related ideas about a concept. It can be used to emphasize direction of movement and interconnections of stages in a flow. Deliver amazing presentations to mesmerize your audience.-PPT consecutive example of 5 powerpoint slide numbers through arrows Templates-3d, Abstract, Arrow, Circle, Circular, Click, Computer, Data, Direction, Graphic, Icon, Illustration, Insignia, Intention, Internet, Isolated, Label, Mail, Mascot, Media, Menu, Motion, Page, Pushing, Search, Shiny, Sign, Simple, Symbol Nest comfortably in success with our Ppt Consecutive Example Of 5 PowerPoint Slide Numbers Through Arrows Templates. You will be at the top of your game.
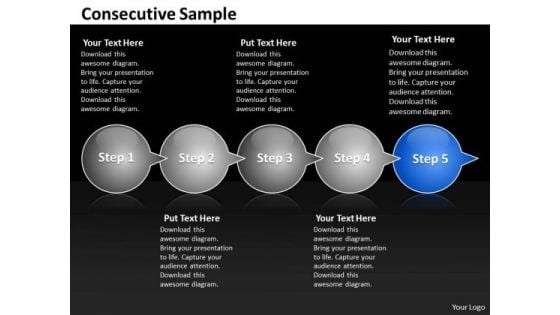
Ppt Consecutive Sample Of 5 Steps Through Curved Arrows PowerPoint 2010 Templates
PPT consecutive sample of 5 steps through curved arrows powerpoint 2010 Templates-The above template displays a diagram of circles connected with arrows. This is a graphic organizer for recording related ideas about a concept. It can be used to emphasize direction of movement and interconnections of stages in a flow. Deliver amazing presentations to mesmerize your audience.-PPT consecutive sample of 5 steps through curved arrows powerpoint 2010 Templates-3d, Abstract, Arrow, Circle, Circular, Click, Computer, Data, Direction, Graphic, Icon, Illustration, Insignia, Intention, Internet, Isolated, Label, Mail, Mascot, Media, Menu, Motion, Page, Pushing, Search, Shiny, Sign, Simple, Symbol Optimize your business cyclewith our Ppt Consecutive Sample Of 5 Steps Through Curved Arrows PowerPoint 2010 Templates. You'll deliver your best presentation yet.
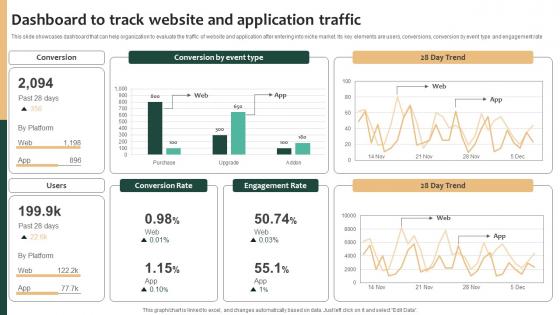
Tailored Product Approach Dashboard To Track Website And Application Traffic Structure Pdf
This slide showcases dashboard that can help organization to evaluate the traffic of website and application after entering into niche market. Its key elements are users, conversions, conversion by event type and engagement rate. Do you have to make sure that everyone on your team knows about any specific topic I yes, then you should give Tailored Product Approach Dashboard To Track Website And Application Traffic Structure Pdf a try. Our experts have put a lot of knowledge and effort into creating this impeccable Tailored Product Approach Dashboard To Track Website And Application Traffic Structure Pdf You can use this template for your upcoming presentations, as the slides are perfect to represent even the tiniest detail. You can download these templates from the Slidegeeks website and these are easy to edit. So grab these today This slide showcases dashboard that can help organization to evaluate the traffic of website and application after entering into niche market. Its key elements are users, conversions, conversion by event type and engagement rate
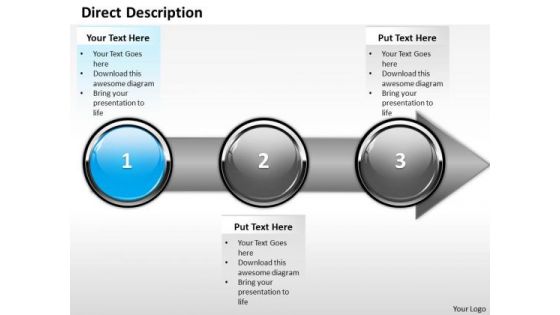
Ppt Consecutive Demonstration Of Arrow Process Using Stage 1 PowerPoint Templates
PPT consecutive demonstration of arrow process using stage 1 PowerPoint Templates-With this pre-designed process arrows diagram you can visualize almost any type of concept, chronological process or steps of your strategies.-PPT consecutive demonstration of arrow process using stage 1 PowerPoint Templates-Arrow, Bank, Benefit, Business, Calculate, Calculation, Capitalist, Communication, Company, Concern, Connection, Data, Diagram, Digital, Drawing, Earnings, Economic, Finance, Financial, Flow, Forecast, Gain, Goal, Graph, Growth, Illustration, Increase, Information, Interest, Investing, Management, Market, Money, Move, Network, Objective, Plan, Process, Profit, Progress, Report, Rise, Risk, Shares, Statistics, Stock, System, Technology Keep them enthused with our Ppt Consecutive Demonstration Of Arrow Process Using Stage 1 PowerPoint Templates. You will come out on top.
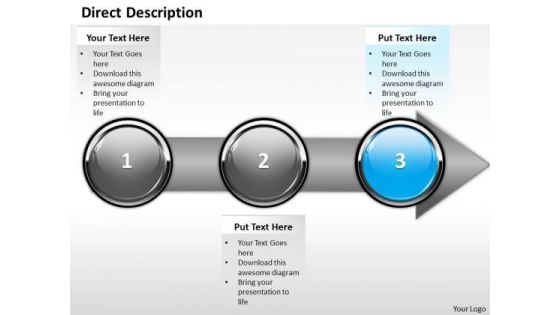
Ppt Direct Description Of Arrow Process Using Stage 3 PowerPoint Templates
PPT direct description of arrow process using stage 3 PowerPoint Templates-With this pre-designed process arrows diagram you can visualize almost any type of concept, chronological process or steps of your strategies.-PPT direct description of arrow process using stage 3 PowerPoint Templates-Arrow, Bank, Benefit, Business, Calculate, Calculation, Capitalist, Communication, Company, Concern, Connection, Data, Diagram, Digital, Drawing, Earnings, Economic, Finance, Financial, Flow, Forecast, Gain, Goal, Graph, Growth, Illustration, Increase, Information, Interest, Investing, Management, Market, Money, Move, Network, Objective, Plan, Process, Profit, Progress, Report, Rise, Risk, Shares, Statistics, Stock, System, Technology Our Ppt Direct Description Of Arrow Process Using Stage 3 PowerPoint Templates will soon be your favourites. They will delight you with their charm.
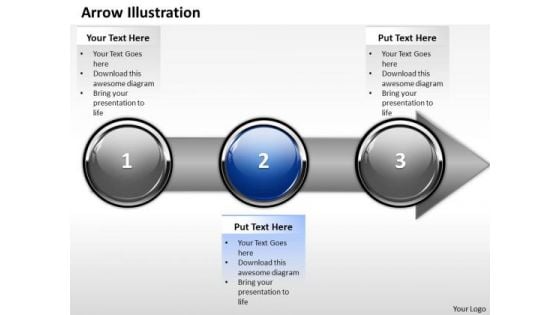
Ppt Direct Illustration Of Banking Process Using Stage 2 PowerPoint Templates
PPT direct illustration of banking process using stage 2 PowerPoint Templates-With this pre-designed process arrows diagram you can visualize almost any type of concept, chronological process or steps of your strategies.-PPT direct illustration of banking process using stage 2 PowerPoint Templates-Arrow, Bank, Benefit, Business, Calculate, Calculation, Capitalist, Communication, Company, Concern, Connection, Data, Diagram, Digital, Drawing, Earnings, Economic, Finance, Financial, Flow, Forecast, Gain, Goal, Graph, Growth, Illustration, Increase, Information, Interest, Investing, Management, Market, Money, Move, Network, Objective, Plan, Process, Profit, Progress, Report, Rise, Risk, Shares, Statistics, Stock, System, Technology Our Ppt Direct Illustration Of Banking Process Using Stage 2 PowerPoint Templates have a glossy look. Your thoughts will also acquire a sheen.
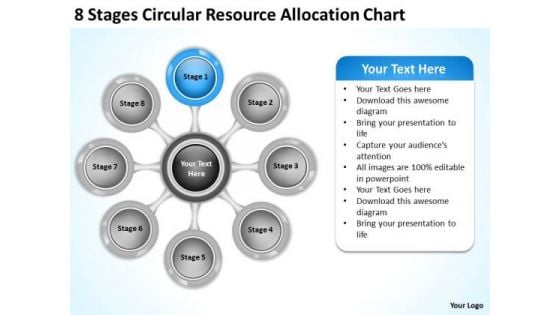
Business Strategy Implementation Resource Allocation Chart Internet
We present our business strategy implementation resource allocation chart internet.Use our Marketing PowerPoint Templates because You will get more than you ever bargained for. Use our Business PowerPoint Templates because Our PowerPoint Templates and Slides will let your words and thoughts hit bullseye everytime. Use our Circle Charts PowerPoint Templates because They will Put the wind in your sails. Skim smoothly over the choppy waters of the market. Download and present our Arrows PowerPoint Templates because Our PowerPoint Templates and Slides will bullet point your ideas. See them fall into place one by one. Present our Process and Flows PowerPoint Templates because Our PowerPoint Templates and Slides will definately Enhance the stature of your presentation. Adorn the beauty of your thoughts with their colourful backgrounds.Use these PowerPoint slides for presentations relating to 3d, Action, Analysis, Attitude, Brainstorming, Business, Chart, Classroom, Concept, Conceptual, Conference, Connection, Corporate, Design, Diagram, Direction, Element, Employee, Enhance, Financial, Formula, Future, Goal, Graphic, Guidelines, Idea, Link, Management, Market, Marketing, Mind, Mind Map, Organization, Organize, Plan, Process, Product, Relation, Render, Solutions, Strategy, Success, Successful, Tactic, Target, Text, Training, Unity. The prominent colors used in the PowerPoint template are Tan, Gray, Black. Color your presentation with success with our Business Strategy Implementation Resource Allocation Chart Internet. You will come out on top.
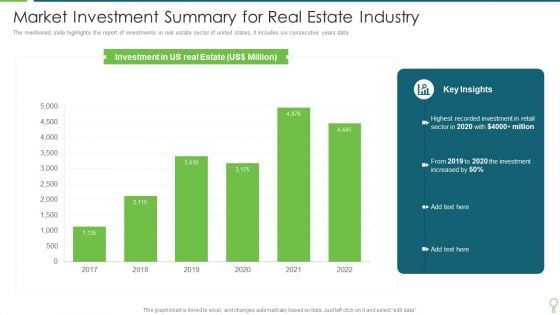
Market Investment Summary For Real Estate Industry Pictures PDF
The mentioned slide highlights the report of investments in real estate sector of united states, it includes six consecutive years data. Showcasing this set of slides titled Market Investment Summary For Real Estate Industry Pictures PDF. The topics addressed in these templates are Market Investment Summary For Real Estate Industry. All the content presented in this PPT design is completely editable. Download it and make adjustments in color, background, font etc. as per your unique business setting.
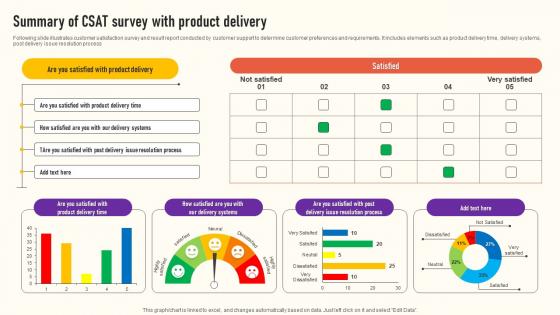
Summary Of CSAT Survey With Product Delivery Survey Ss
Following slide illustrates customer satisfaction survey and result report conducted by customer support to determine customer preferences and requirements. It includes elements such as product delivery time, delivery systems, post delivery issue resolution process Pitch your topic with ease and precision using this Summary Of CSAT Survey With Product Delivery Survey Ss This layout presents information on Delivery Systems, Resolution Process, Satisfied It is also available for immediate download and adjustment. So, changes can be made in the color, design, graphics or any other component to create a unique layout. Following slide illustrates customer satisfaction survey and result report conducted by customer support to determine customer preferences and requirements. It includes elements such as product delivery time, delivery systems, post delivery issue resolution process
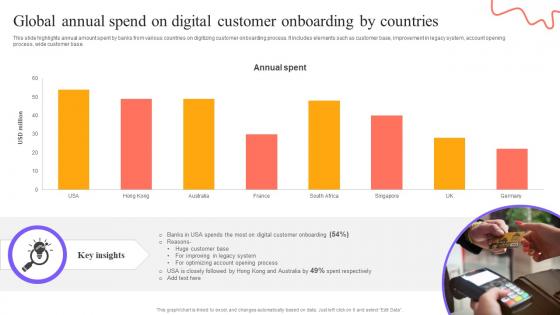
Digital Approach To Client Global Annual Spend On Digital Customer Onboarding
This slide highlights annual amount spent by banks from various countries on digitizing customer onboarding process. It includes elements such as customer base, improvement in legacy system, account opening process, wide customer base. The Digital Approach To Client Global Annual Spend On Digital Customer Onboarding is a compilation of the most recent design trends as a series of slides. It is suitable for any subject or industry presentation, containing attractive visuals and photo spots for businesses to clearly express their messages. This template contains a variety of slides for the user to input data, such as structures to contrast two elements, bullet points, and slides for written information. Slidegeeks is prepared to create an impression. This slide highlights annual amount spent by banks from various countries on digitizing customer onboarding process. It includes elements such as customer base, improvement in legacy system, account opening process, wide customer base.
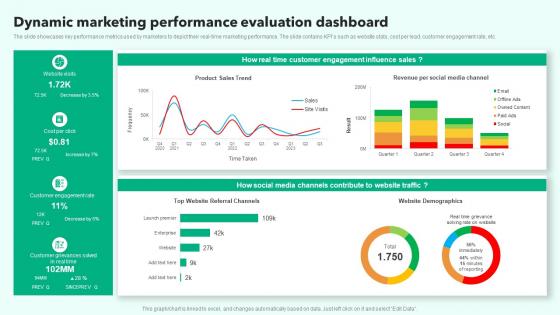
Dynamic Marketing Performance Evaluation Dashboard Microsoft Pdf
The slide showcases key performance metrics used by marketers to depict their real time marketing performance. The slide contains KPIs such as website stats, cost per lead, customer engagement rate, etc. Pitch your topic with ease and precision using this Dynamic Marketing Performance Evaluation Dashboard Microsoft Pdf. This layout presents information on Influence Sales, Customer Engagement, Customer Engagement Rate. It is also available for immediate download and adjustment. So, changes can be made in the color, design, graphics or any other component to create a unique layout. The slide showcases key performance metrics used by marketers to depict their real time marketing performance. The slide contains KPIs such as website stats, cost per lead, customer engagement rate, etc.
Venn Diagram Analyzing Global Commissary Kitchen Industry Portrait PDF
The Venn Diagram Analyzing Global Commissary Kitchen Industry Portrait PDF is a compilation of the most recent design trends as a series of slides. It is suitable for any subject or industry presentation, containing attractive visuals and photo spots for businesses to clearly express their messages. This template contains a variety of slides for the user to input data, such as structures to contrast two elements, bullet points, and slides for written information. Slidegeeks is prepared to create an impression.
Comprehensive Guide For Social Business Startup Venn Diagram Designs PDF
The Comprehensive Guide For Social Business Startup Venn Diagram Designs PDF is a compilation of the most recent design trends as a series of slides. It is suitable for any subject or industry presentation, containing attractive visuals and photo spots for businesses to clearly express their messages. This template contains a variety of slides for the user to input data, such as structures to contrast two elements, bullet points, and slides for written information. Slidegeeks is prepared to create an impression.
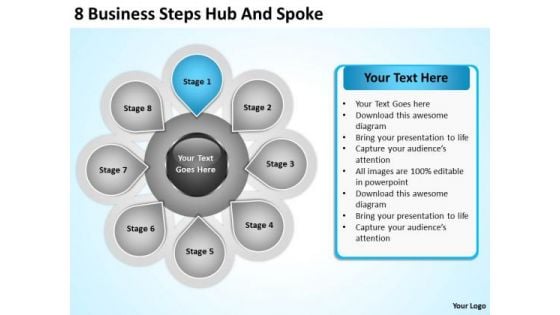
Business Model Diagram Examples PowerPoint Templates Steps Hub And Spoke
We present our business model diagram examples powerpoint templates steps hub and spoke.Download and present our Circle Charts PowerPoint Templates because You can Channelise the thoughts of your team with our PowerPoint Templates and Slides. Urge them to focus on the goals you have set. Use our Arrows PowerPoint Templates because Watching this your Audience will Grab their eyeballs, they wont even blink. Present our Business PowerPoint Templates because You can Double your output with our PowerPoint Templates and Slides. They make beating deadlines a piece of cake. Download our Flow Charts PowerPoint Templates because You can Zap them with our PowerPoint Templates and Slides. See them reel under the impact. Use our Ring Charts PowerPoint Templates because Your ideas provide food for thought. Our PowerPoint Templates and Slides will help you create a dish to tickle the most discerning palate.Use these PowerPoint slides for presentations relating to 3d, abstract, action, analysis, business, chart, competition, concept, connection, corporate, diagram, direction, employee, financial, future, graphic, idea, market, marketing, organization, process, strategy, success, target, timeline, training. The prominent colors used in the PowerPoint template are Blue, Gray, Black. Champion causes with our Business Model Diagram Examples PowerPoint Templates Steps Hub And Spoke. Download without worries with our money back guaranteee.
Effective Product Adaptation Dashboard Tracking Influencer Marketing Campaign Performance Diagrams PDF
If you are looking for a format to display your unique thoughts, then the professionally designed Effective Product Adaptation Dashboard Tracking Influencer Marketing Campaign Performance Diagrams PDF is the one for you. You can use it as a Google Slides template or a PowerPoint template. Incorporate impressive visuals, symbols, images, and other charts. Modify or reorganize the text boxes as you desire. Experiment with shade schemes and font pairings. Alter, share or cooperate with other people on your work. Download Effective Product Adaptation Dashboard Tracking Influencer Marketing Campaign Performance Diagrams PDF and find out how to give a successful presentation. Present a perfect display to your team and make your presentation unforgettable. This slide represents a dashboard monitoring the performance of local influencer marketing campaigns to promote the product in the target market. It tracks KPIs such as, post, Instagram impressions, likes, comments, visitor calculation, campaign insights, and top performers.
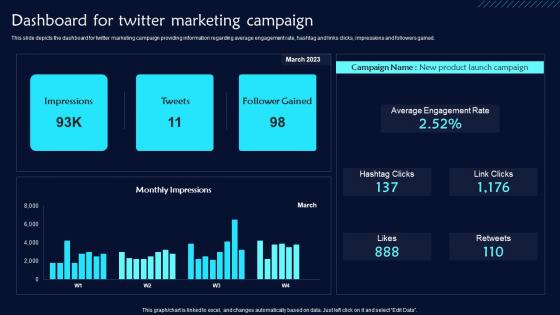
Dashboard For Twitter Marketing Campaign Twitter Promotional Techniques Formats Pdf
This slide depicts the dashboard for twitter marketing campaign providing information regarding average engagement rate, hashtag and links clicks, impressions and followers gained. From laying roadmaps to briefing everything in detail, our templates are perfect for you. You can set the stage with your presentation slides. All you have to do is download these easy-to-edit and customizable templates. Dashboard For Twitter Marketing Campaign Twitter Promotional Techniques Formats Pdf will help you deliver an outstanding performance that everyone would remember and praise you for. Do download this presentation today. This slide depicts the dashboard for twitter marketing campaign providing information regarding average engagement rate, hashtag and links clicks, impressions and followers gained.
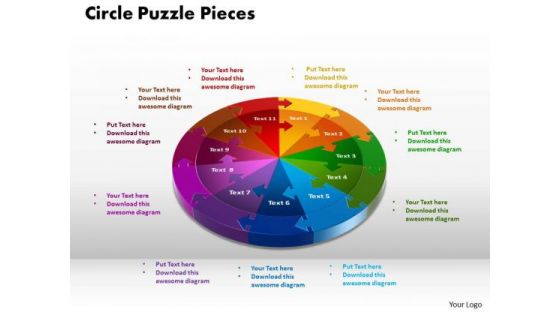
PowerPoint Designs Circle Puzzle Pieces Education Ppt Presentation
PowerPoint Designs Circle Puzzle Pieces Education PPT Presentation-This diagram is a graphical illustration of the relationships between and among sets of data, groups of objects.-PowerPoint Designs Circle Puzzle Pieces Education PPT Presentation Earn accolades with our PowerPoint Designs Circle Puzzle Pieces Education Ppt Presentation. Download without worries with our money back guaranteee.
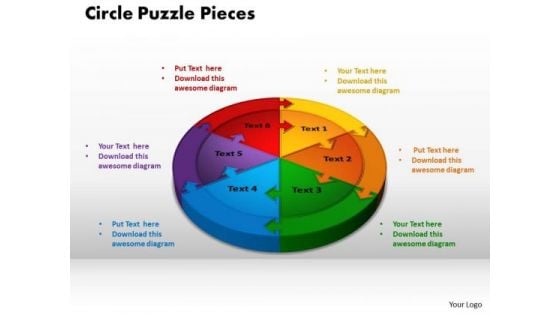
PowerPoint Process Circle Puzzle Pieces Success Ppt Presentation
PowerPoint Process Circle Puzzle Pieces Success PPT Presentation-This diagram is a graphical illustration of the relationships between and among sets of data, groups of objects.-PowerPoint Process Circle Puzzle Pieces Success PPT Presentation Decrease conflict with your thoughts.Enable communication with our PowerPoint Process Circle Puzzle Pieces Success Ppt Presentation.
Improving PPC Campaign Results Develop Campaign Performance Tracking Infographics Pdf
The following slide depicts campaign performance management dashboard to measure the results. It includes elements such as conversions funnel, conversion rates, opportunity value, landing pages, sources google, twitter, Facebook etc. If you are looking for a format to display your unique thoughts, then the professionally designed Improving PPC Campaign Results Develop Campaign Performance Tracking Infographics Pdf is the one for you. You can use it as a Google Slides template or a PowerPoint template. Incorporate impressive visuals, symbols, images, and other charts. Modify or reorganize the text boxes as you desire. Experiment with shade schemes and font pairings. Alter, share or cooperate with other people on your work. Download Improving PPC Campaign Results Develop Campaign Performance Tracking Infographics Pdf and find out how to give a successful presentation. Present a perfect display to your team and make your presentation unforgettable. The following slide depicts campaign performance management dashboard to measure the results. It includes elements such as conversions funnel, conversion rates, opportunity value, landing pages, sources google, twitter, Facebook etc.
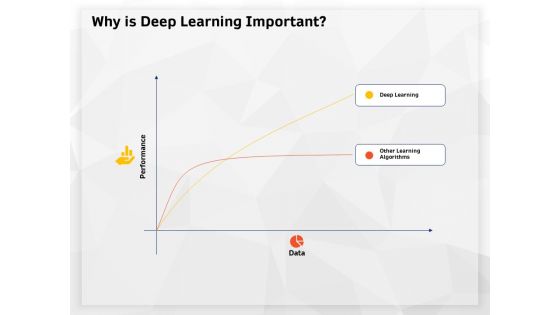
AI High Tech PowerPoint Templates Why Is Deep Learning Important Ppt Slides Inspiration PDF
Presenting this set of slides with name ai high tech powerpoint templates why is deep learning important ppt slides inspiration pdf. This is a two stage process. The stages in this process are data, performance. This is a completely editable PowerPoint presentation and is available for immediate download. Download now and impress your audience.
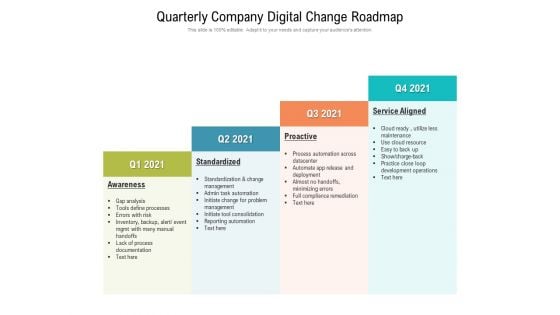
Quarterly Company Digital Change Roadmap Information
Presenting our innovatively-structured quarterly company digital change roadmap information Template. Showcase your roadmap process in different formats like PDF, PNG, and JPG by clicking the download button below. This PPT design is available in both Standard Screen and Widescreen aspect ratios. It can also be easily personalized and presented with modified font size, font type, color, and shapes to measure your progress in a clear way.
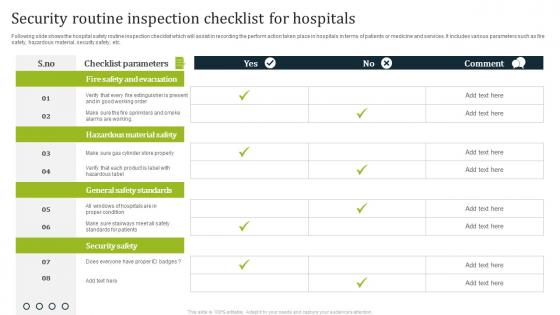
Security Routine Inspection Checklist For Hospitals Diagrams Pdf
Following slide shows the hospital safety routine inspection checklist which will assist in recording the perform action taken place in hospitals in terms of patients or medicine and services. It includes various parameters such as fire safety, hazardous material, security safety, etc. Showcasing this set of slides titled Security Routine Inspection Checklist For Hospitals Diagrams Pdf. The topics addressed in these templates are Checklist Parameters, Comment. All the content presented in this PPT design is completely editable. Download it and make adjustments in color, background, font etc. as per your unique business setting. Following slide shows the hospital safety routine inspection checklist which will assist in recording the perform action taken place in hospitals in terms of patients or medicine and services. It includes various parameters such as fire safety, hazardous material, security safety, etc.
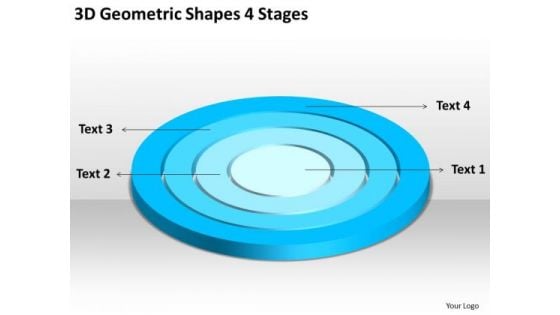
3d Geometric Shapes 4 Stages Written Business Plan PowerPoint Templates
We present our 3d geometric shapes 4 stages written business plan PowerPoint templates.Download and present our Circle Charts PowerPoint Templates because Our PowerPoint Templates and Slides will provide weight to your words. They will bring out the depth of your thought process. Download our Shapes PowerPoint Templates because Our PowerPoint Templates and Slides will let you Hit the target. Go the full distance with ease and elan. Download and present our Signs PowerPoint Templates because They will bring a lot to the table. Their alluring flavours will make your audience salivate. Download our Maketing PowerPoint Templates because Our PowerPoint Templates and Slides come in all colours, shades and hues. They help highlight every nuance of your views. Use our Metaphors-Visual Concepts PowerPoint Templates because you can Break through with our PowerPoint Templates and Slides. Bring down the mental barriers of your audience.Use these PowerPoint slides for presentations relating to diagram, circular, market, bar, advertise, interface, business, concept, vector, sign, success, presentation, symbol, template, circle, brochure, finance, data, description, report, marketing, title, label, abstract, management, graph, four, illustration, icon, pie, chart, strategy, catalog, research, web, design, growth, text, professional, banner, account, profit, information, background, info-graphic, analyze, financial, button, goals. The prominent colors used in the PowerPoint template are Blue, Blue light, White. Get fascinated by our 3d Geometric Shapes 4 Stages Written Business Plan PowerPoint Templates. They will keep attracting your attention.
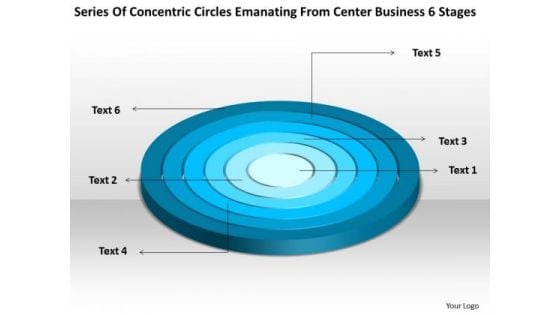
Emanating From Center Business 6 Stages Non Profit Plan Sample PowerPoint Templates
We present our emanating from center business 6 stages non profit plan sample PowerPoint templates.Use our Circle Charts PowerPoint Templates because You have the co-ordinates for your destination of success. Let our PowerPoint Templates and Slides map out your journey. Download our Shapes PowerPoint Templates because Our PowerPoint Templates and Slides will let you meet your Deadlines. Download our Signs PowerPoint Templates because Your audience will believe you are the cats whiskers. Download our Maketing PowerPoint Templates because Our PowerPoint Templates and Slides team portray an attitude of elegance. Personify this quality by using them regularly. Download our Metaphors-Visual Concepts PowerPoint Templates because Our PowerPoint Templates and Slides has conjured up a web of all you need with the help of our great team. Use them to string together your glistening ideas.Use these PowerPoint slides for presentations relating to diagram, circular, market, bar, advertise, interface, business, concept, vector, sign, success, presentation, symbol, template, circle, brochure, finance, data, description, report, marketing, title, label, abstract, management, graph, four, illustration, icon, pie, chart, strategy, catalog, research, web, design, growth, text, professional, banner, account, profit, information, background, info-graphic, analyze, financial, button, goals. The prominent colors used in the PowerPoint template are Blue, Blue light, White. Bonds created with our Emanating From Center Business 6 Stages Non Profit Plan Sample PowerPoint Templates will never break. They ensure alliances endure.
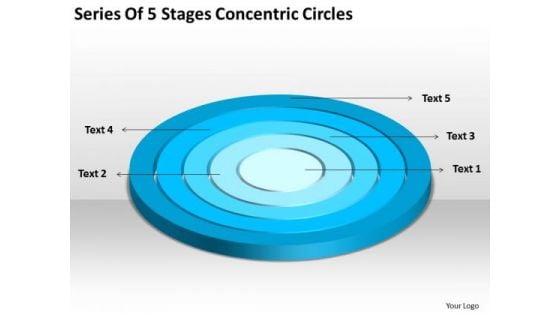
Series Of 5 Stages Concentric Circles Courier Business Plan PowerPoint Templates
We present our series of 5 stages concentric circles courier business plan PowerPoint templates.Use our Circle Charts PowerPoint Templates because Our PowerPoint Templates and Slides are designed to help you succeed. They have all the ingredients you need. Present our Shapes PowerPoint Templates because Our PowerPoint Templates and Slides will let you Leave a lasting impression to your audiences. They possess an inherent longstanding recall factor. Download our Signs PowerPoint Templates because You can Hit the nail on the head with our PowerPoint Templates and Slides. Embed your ideas in the minds of your audience. Present our Maketing PowerPoint Templates because Our PowerPoint Templates and Slides will Embellish your thoughts. They will help you illustrate the brilliance of your ideas. Use our Metaphors-Visual Concepts PowerPoint Templates because Our PowerPoint Templates and Slides will let your team Walk through your plans. See their energy levels rise as you show them the way.Use these PowerPoint slides for presentations relating to diagram, circular, market, bar, advertise, interface, business, concept, vector, sign, success, presentation, symbol, template, circle, brochure, finance, data, description, report, marketing, title, label, abstract, management, graph, four, illustration, icon, pie, chart, strategy, catalog, research, web, design, growth, text, professional, banner, account, profit, information, background, info-graphic, analyze, financial, button, goals. The prominent colors used in the PowerPoint template are Blue, Blue light, White. Our Series Of 5 Stages Concentric Circles Courier Business Plan PowerPoint Templates team are a multi-faceted lot. They address issues from different angles.
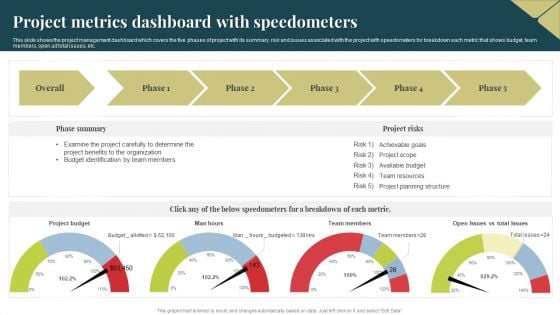
Project Metrics Dashboard With Speedometers Themes PDF
This slide shows the project management dashboard which covers the five phases of project with its summary, risk and issues associated with the project with speedometers for breakdown each metric that shows budget, team members, open ad total issues, etc. Showcasing this set of slides titled Project Metrics Dashboard With Speedometers Themes PDF. The topics addressed in these templates are Budget, Project Benefits, Organization. All the content presented in this PPT design is completely editable. Download it and make adjustments in color, background, font etc. as per your unique business setting.
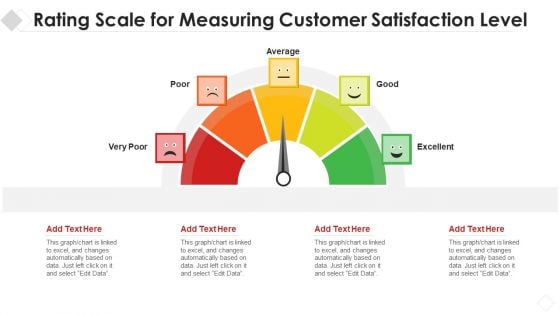
Rating Scale For Measuring Customer Satisfaction Level Themes PDF
Pitch your topic with ease and precision using this rating scale for measuring customer satisfaction level themes pdf. This layout presents information on rating scale for measuring customer satisfaction level. It is also available for immediate download and adjustment. So, changes can be made in the color, design, graphics or any other component to create a unique layout.
Construction Project Playbook Ongoing Construction Project Progress Tracking Dashboard Ppt Show Styles PDF
This slide provides information regarding ongoing construction project progress tracking dashboard along with details such as project status, project type, project progress, etc. Deliver an awe inspiring pitch with this creative construction project playbook ongoing construction project progress tracking dashboard ppt show styles pdf bundle. Topics like ongoing construction project progress tracking dashboard can be discussed with this completely editable template. It is available for immediate download depending on the needs and requirements of the user.
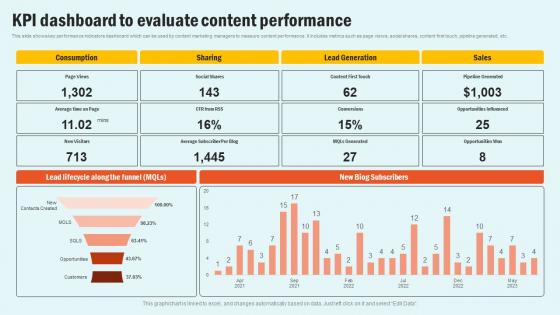
KPI Dashboard To Evaluate Enhancing Website Performance With Search Engine Content Pictures Pdf
This slide shows key performance indicators dashboard which can be used by content marketing managers to measure content performance. It includes metrics such as page views, social shares, content first touch, pipeline generated, etc. This KPI Dashboard To Evaluate Enhancing Website Performance With Search Engine Content Pictures Pdf is perfect for any presentation, be it in front of clients or colleagues. It is a versatile and stylish solution for organizing your meetings. The KPI Dashboard To Evaluate Enhancing Website Performance With Search Engine Content Pictures Pdf features a modern design for your presentation meetings. The adjustable and customizable slides provide unlimited possibilities for acing up your presentation. Slidegeeks has done all the homework before launching the product for you. So, do not wait, grab the presentation templates today This slide shows key performance indicators dashboard which can be used by content marketing managers to measure content performance. It includes metrics such as page views, social shares, content first touch, pipeline generated, etc.
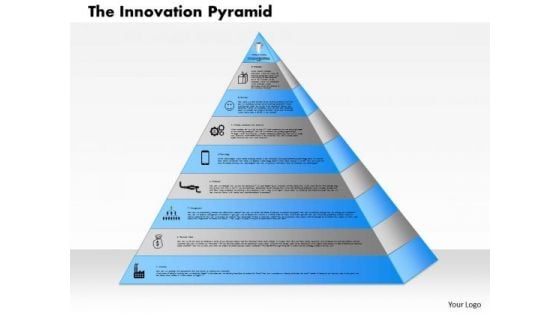
Business Framework The Innovation Pyramid PowerPoint Presentation
Captivate the attention of your audience with the help of professionally designed diagram of innovation pyramid. This diagram contains graphics of pyramid with innovative icons. Use this professional and customized business diagram in your PowerPoint presentations.
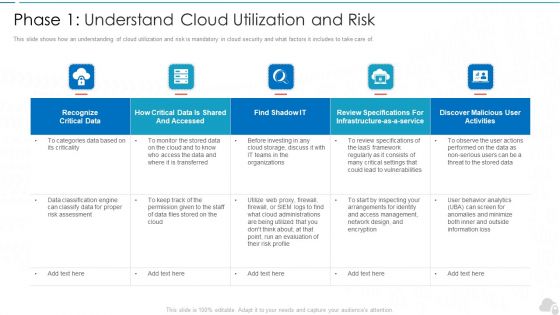
Phase 1 Understand Cloud Utilization And Risk Cloud Computing Security IT Ppt Summary Smartart PDF
This slide shows how an understanding of cloud utilization and risk is mandatory in cloud security and what factors it includes to take care of. Deliver and pitch your topic in the best possible manner with this phase 1 understand cloud utilization and risk cloud computing security it ppt summary smartart pdf. Use them to share invaluable insights on recognize critical data, infrastructure, evaluation, vulnerabilities, organizations and impress your audience. This template can be altered and modified as per your expectations. So, grab it now.
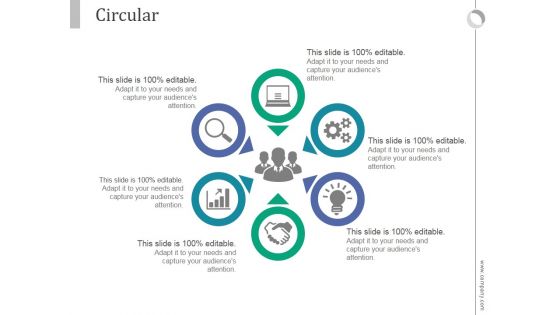
Circular Ppt PowerPoint Presentation Summary
This is a circular ppt powerpoint presentation summary. This is a six stage process. The stages in this process are business, marketing, process, strategy, icons.
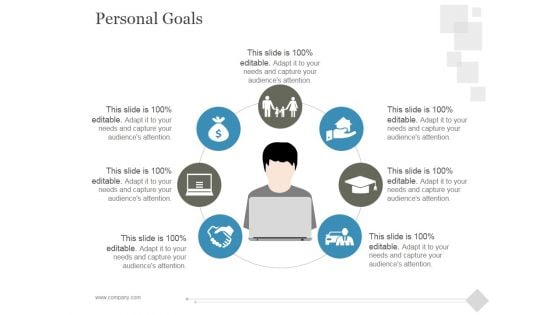
Personal Goals Ppt PowerPoint Presentation Outline
This is a personal goals ppt powerpoint presentation outline. This is a seven stage process. The stages in this process are icons, process, business, management, marketing.
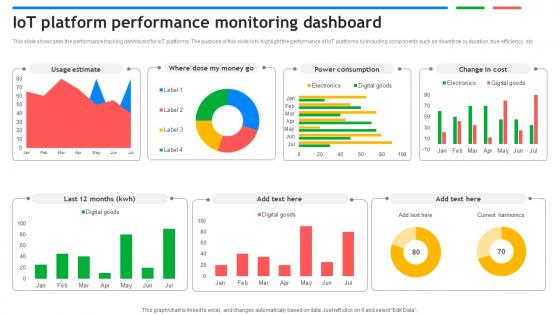
IoT Platform Performance Monitoring Dashboard Exploring Google Cloud IoT Platform
This slide showcases the performance tracking dashboard for IoT platforms. The purpose of this slide is to highlight the performance of IoT platforms by including components such as downtime by duration, true efficiency, etc. Are you searching for a IoT Platform Performance Monitoring Dashboard Exploring Google Cloud IoT Platform that is uncluttered, straightforward, and original Its easy to edit, and you can change the colors to suit your personal or business branding. For a presentation that expresses how much effort you have put in, this template is ideal With all of its features, including tables, diagrams, statistics, and lists, its perfect for a business plan presentation. Make your ideas more appealing with these professional slides. Download IoT Platform Performance Monitoring Dashboard Exploring Google Cloud IoT Platform from Slidegeeks today. This slide showcases the performance tracking dashboard for IoT platforms. The purpose of this slide is to highlight the performance of IoT platforms by including components such as downtime by duration, true efficiency, etc.

Survey Results Related To Social Media Recruitment Enhancing Social Media Recruitment Process Professional PDF
This slide focuses on survey results related to social media recruitment which shows importance of social media to recruitment strategy and how many remain companies remain active across different social media platforms.The Survey Results Related To Social Media Recruitment Enhancing Social Media Recruitment Process Professional PDF is a compilation of the most recent design trends as a series of slides. It is suitable for any subject or industry presentation, containing attractive visuals and photo spots for businesses to clearly express their messages. This template contains a variety of slides for the user to input data, such as structures to contrast two elements, bullet points, and slides for written information. Slidegeeks is prepared to create an impression.
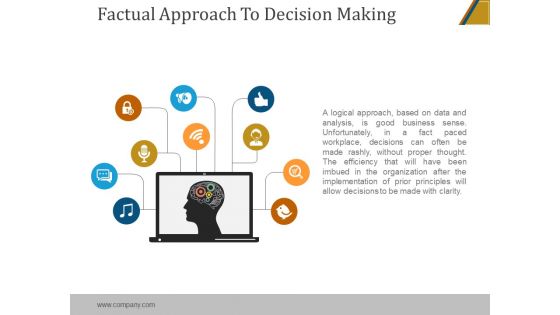
Factual Approach To Decision Making Ppt PowerPoint Presentation Show
This is a factual approach to decision making ppt powerpoint presentation show. This is a one stage process. The stages in this process are business, icons, marketing, strategy, management, success.
Dashboard For Tracking Impact Of Warehouse Leveraging Logistics Automation Information Pdf
This slide covers the dashboard with after automation warehouse overview. It include KPIs such as autonomous robots status, robotic arms status, battery level, performance, time to return, etc.Get a simple yet stunning designed Dashboard For Tracking Impact Of Warehouse Leveraging Logistics Automation Information Pdf. It is the best one to establish the tone in your meetings. It is an excellent way to make your presentations highly effective. So, download this PPT today from Slidegeeks and see the positive impacts. Our easy-to-edit Dashboard For Tracking Impact Of Warehouse Leveraging Logistics Automation Information Pdf can be your go-to option for all upcoming conferences and meetings. So, what are you waiting for Grab this template today. This slide covers the dashboard with after automation warehouse overview. It include KPIs such as autonomous robots status, robotic arms status, battery level, performance, time to return, etc.
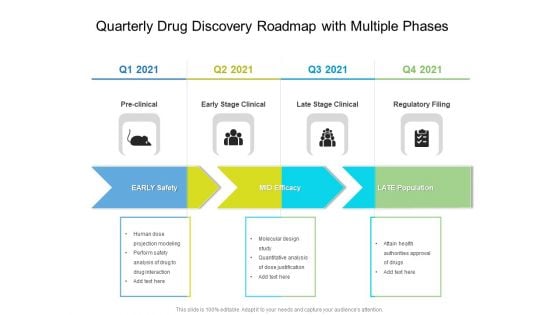
Quarterly Drug Discovery Roadmap With Multiple Phases Themes
Presenting our innovatively structured quarterly drug discovery roadmap with multiple phases themes Template. Showcase your roadmap process in different formats like PDF, PNG, and JPG by clicking the download button below. This PPT design is available in both Standard Screen and Widescreen aspect ratios. It can also be easily personalized and presented with modified font size, font type, color, and shapes to measure your progress in a clear way.
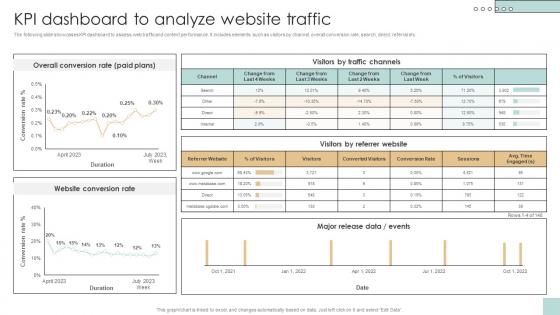
KPI Dashboard To Analyze Website Traffic Developing And Creating Digital Content Strategy SS V
The following slide showcases KPI dashboard to assess web traffic and content performance. It includes elements such as visitors by channel, overall conversion rate, search, direct, referral etc. The best PPT templates are a great way to save time, energy, and resources. Slidegeeks have 100 percent editable powerpoint slides making them incredibly versatile. With these quality presentation templates, you can create a captivating and memorable presentation by combining visually appealing slides and effectively communicating your message. Download KPI Dashboard To Analyze Website Traffic Developing And Creating Digital Content Strategy SS V from Slidegeeks and deliver a wonderful presentation. The following slide showcases KPI dashboard to assess web traffic and content performance. It includes elements such as visitors by channel, overall conversion rate, search, direct, referral etc.
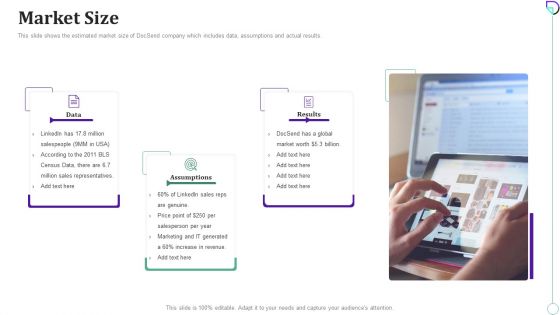
Docsend Capital Raising Pitch Deck Market Size Diagrams PDF
This slide shows the estimated market size of DocSend company which includes data, assumptions and actual results.Presenting Docsend Capital Raising Pitch Deck Market Size Diagrams PDF to provide visual cues and insights. Share and navigate important information on three stages that need your due attention. This template can be used to pitch topics like Assumptions, Marketing Generated, Sales Representatives In addtion, this PPT design contains high resolution images, graphics, etc, that are easily editable and available for immediate download.
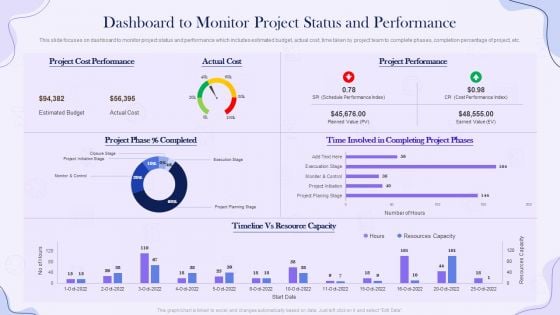
Project Time Management Execution Strategies Dashboard To Monitor Project Status And Performance Summary PDF
This slide focuses on dashboard to monitor project status and performance which includes estimated budget, actual cost, time taken by project team to complete phases, completion percentage of project, etc. If you are looking for a format to display your unique thoughts, then the professionally designed Project Time Management Execution Strategies Dashboard To Monitor Project Status And Performance Summary PDF is the one for you. You can use it as a Google Slides template or a PowerPoint template. Incorporate impressive visuals, symbols, images, and other charts. Modify or reorganize the text boxes as you desire. Experiment with shade schemes and font pairings. Alter, share or cooperate with other people on your work. Download Project Time Management Execution Strategies Dashboard To Monitor Project Status And Performance Summary PDF and find out how to give a successful presentation. Present a perfect display to your team and make your presentation unforgettable.
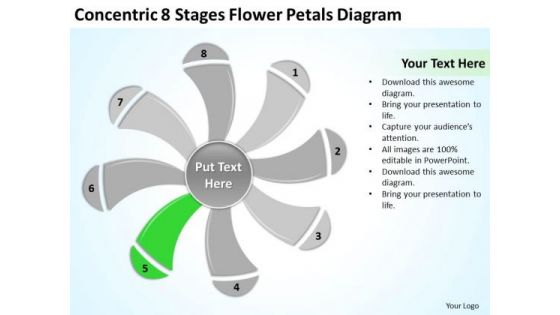
8 Stages Flower Petals Diagram Ppt Real Estate Business Plan Sample PowerPoint Templates
We present our 8 stages flower petals diagram ppt real estate business plan sample PowerPoint templates.Download our Competition PowerPoint Templates because Our PowerPoint Templates and Slides offer you the needful to organise your thoughts. Use them to list out your views in a logical sequence. Download our Communication PowerPoint Templates because Our PowerPoint Templates and Slides are innately eco-friendly. Their high recall value negate the need for paper handouts. Download and present our Circle Charts PowerPoint Templates because Our PowerPoint Templates and Slides are Clear and concise. Use them and dispel any doubts your team may have. Present our Business PowerPoint Templates because Our PowerPoint Templates and Slides are effectively colour coded to prioritise your plans They automatically highlight the sequence of events you desire. Download our Shapes PowerPoint Templates because Our PowerPoint Templates and Slides will let you meet your Deadlines.Use these PowerPoint slides for presentations relating to Flower, petals, segment, diagram, pie, circular, chart, combination, website, components, display, target, business, plan, concept, vector, presentation, template, combine, brochure, finance, boxes, process, analysis, goal, report, marketing, different, abstract, illustration, strategy, round, tab, company, competition, banner, information, navigation, button, communication. The prominent colors used in the PowerPoint template are Green, White, Gray. Bridge gaps with our 8 Stages Flower Petals Diagram Ppt Real Estate Business Plan Sample PowerPoint Templates. Just download, type and present.
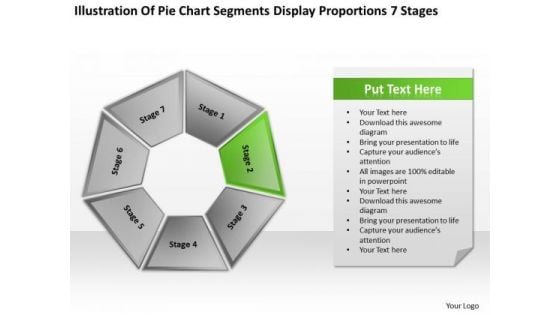
Chart Segments Display Proportions 7 Stages Business Development Plans PowerPoint Templates
We present our chart segments display proportions 7 stages business development plans PowerPoint templates.Use our Business PowerPoint Templates because It will get your audience in sync. Use our Leadership PowerPoint Templates because Our PowerPoint Templates and Slides are a sure bet. Gauranteed to win against all odds. Download our Shapes PowerPoint Templates because Our PowerPoint Templates and Slides help you meet the demand of the Market. Just browse and pick the slides that appeal to your intuitive senses. Download and present our Targets PowerPoint Templates because you should Whip up a frenzy with our PowerPoint Templates and Slides. They will fuel the excitement of your team. Present our Process and Flows PowerPoint Templates because Our PowerPoint Templates and Slides will generate and maintain the level of interest you desire. They will create the impression you want to imprint on your audience.Use these PowerPoint slides for presentations relating to Abstract, analysis, banner, blank, boxes, brochure, business, button, catalog, chart, circular, combination, combine, communication, company, competition, components, concept, diagram, different, display, finance, goal, illustration, information, link, marketing, mission, navigation, petals, pictogram, pie, plan, presentation, process, report, round, segment, strategy, tab, target, template, text, website. The prominent colors used in the PowerPoint template are Green, Gray, White. Get complimentary benefits with our Chart Segments Display Proportions 7 Stages Business Development Plans PowerPoint Templates. Recieve extra appreciation at no extra cost.

Real Time Content Marketing Result Dashboard Ppt Infographic Template Example PDF
The following slide depicts real time content marketing KPI dashboard to monitor traffic flow and manage promotional efforts. It includes elements such as visitors by channel, conversion rate, search, direct, sessions, average time engaged etc. The Real Time Content Marketing Result Dashboard Ppt Infographic Template Example PDF is a compilation of the most recent design trends as a series of slides. It is suitable for any subject or industry presentation, containing attractive visuals and photo spots for businesses to clearly express their messages. This template contains a variety of slides for the user to input data, such as structures to contrast two elements, bullet points, and slides for written information. Slidegeeks is prepared to create an impression.
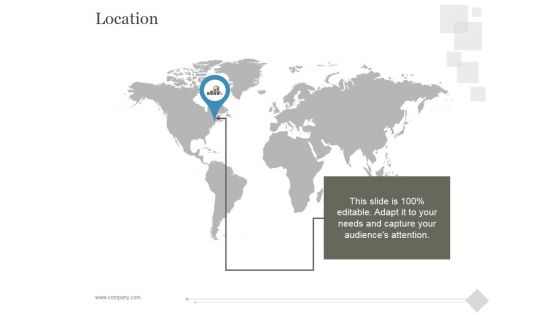
Location Ppt PowerPoint Presentation Layout
This is a location ppt powerpoint presentation layout. This is a one stage process. The stages in this process are location, information, success, icons, business.
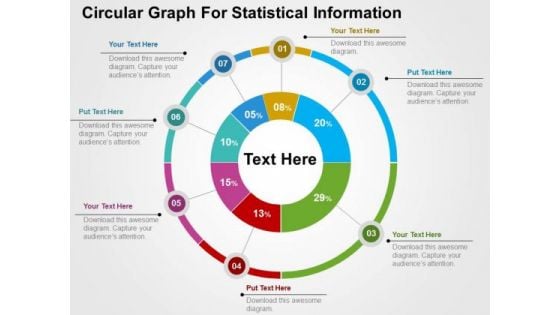
Circular Graph For Statistical Information PowerPoint Template
Visually support your presentation with our above template showing circular graph. This slide has been professionally designed to present statistical information. This template offers an excellent background to build impressive presentation.
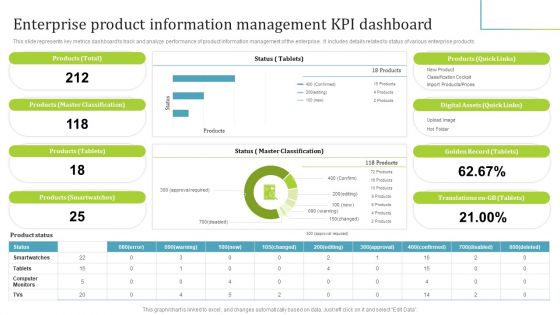
PIM Software Deployment To Enhance Conversion Rates Enterprise Product Information Management KPI Dashboard Infographics PDF
This slide represents key metrics dashboard to track and analyze performance of product information management of the enterprise. It includes details related to status of various enterprise products. Here you can discover an assortment of the finest PowerPoint and Google Slides templates. With these templates, you can create presentations for a variety of purposes while simultaneously providing your audience with an eye catching visual experience. Download PIM Software Deployment To Enhance Conversion Rates Enterprise Product Information Management KPI Dashboard Infographics PDF to deliver an impeccable presentation. These templates will make your job of preparing presentations much quicker, yet still, maintain a high level of quality. Slidegeeks has experienced researchers who prepare these templates and write high quality content for you. Later on, you can personalize the content by editing the PIM Software Deployment To Enhance Conversion Rates Enterprise Product Information Management KPI Dashboard Infographics PDF.
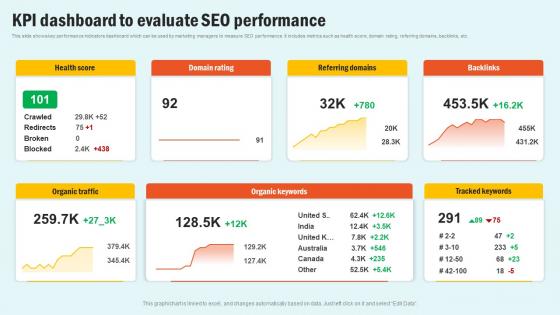
KPI Dashboard To Evaluate SEO Enhancing Website Performance With Search Engine Content Structure Pdf
This slide shows key performance indicators dashboard which can be used by marketing managers to measure SEO performance. It includes metrics such as health score, domain rating, referring domains, backlinks, etc. Welcome to our selection of the KPI Dashboard To Evaluate SEO Enhancing Website Performance With Search Engine Content Structure Pdf. These are designed to help you showcase your creativity and bring your sphere to life. Planning and Innovation are essential for any business that is just starting out. This collection contains the designs that you need for your everyday presentations. All of our PowerPoints are 100 percent editable, so you can customize them to suit your needs. This multi purpose template can be used in various situations. Grab these presentation templates today This slide shows key performance indicators dashboard which can be used by marketing managers to measure SEO performance. It includes metrics such as health score, domain rating, referring domains, backlinks, etc.
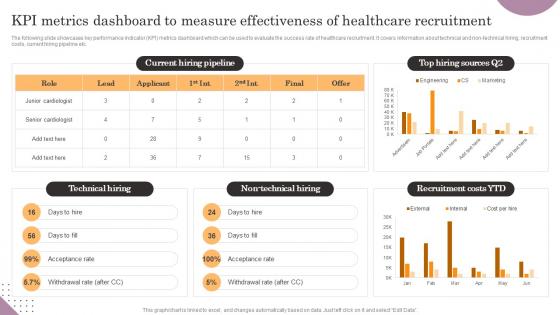
KPI Metrics Dashboard To Measure Effectiveness Of General Management Information Pdf
The following slide showcases key performance indicator KPI metrics dashboard which can be used to evaluate the success rate of healthcare recruitment. It covers information about technical and non-technical hiring, recruitment costs, current hiring pipeline etc. Presenting this PowerPoint presentation, titled KPI Metrics Dashboard To Measure Effectiveness Of General Management Information Pdf, with topics curated by our researchers after extensive research. This editable presentation is available for immediate download and provides attractive features when used. Download now and captivate your audience. Presenting this KPI Metrics Dashboard To Measure Effectiveness Of General Management Information Pdf. Our researchers have carefully researched and created these slides with all aspects taken into consideration. This is a completely customizable KPI Metrics Dashboard To Measure Effectiveness Of General Management Information Pdf that is available for immediate downloading. Download now and make an impact on your audience. Highlight the attractive features available with our PPTs. The following slide showcases key performance indicator KPI metrics dashboard which can be used to evaluate the success rate of healthcare recruitment. It covers information about technical and non-technical hiring, recruitment costs, current hiring pipeline etc.
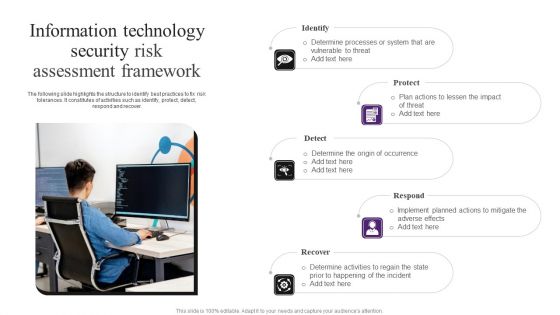
Information Technology Security Risk Assessment Framework Demonstration PDF
The following slide highlights the structure to identify best practices to fix risk tolerances. It constitutes of activities such as identify, protect, detect, respond and recover. Presenting Information Technology Security Risk Assessment Framework Demonstration PDF to dispense important information. This template comprises five stages. It also presents valuable insights into the topics including Protect, Detect, Respond. This is a completely customizable PowerPoint theme that can be put to use immediately. So, download it and address the topic impactfully.
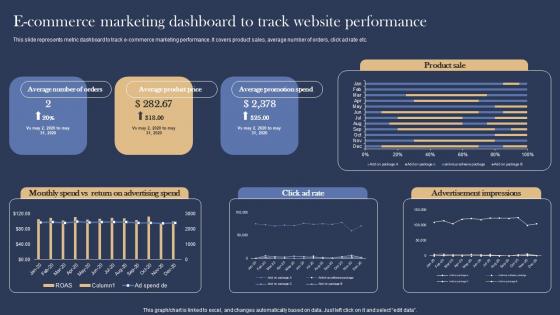
E Commerce Marketing Dashboard Management Marketing Strategies For E Commerce Information Pdf
This slide represents metric dashboard to track e commerce marketing performance. It covers product sales, average number of orders, click ad rate etc. This modern and well arranged E Commerce Marketing Dashboard Management Marketing Strategies For E Commerce Information Pdf provides lots of creative possibilities. It is very simple to customize and edit with the Powerpoint Software. Just drag and drop your pictures into the shapes. All facets of this template can be edited with Powerpoint, no extra software is necessary. Add your own material, put your images in the places assigned for them, adjust the colors, and then you can show your slides to the world, with an animated slide included. This slide represents metric dashboard to track e commerce marketing performance. It covers product sales, average number of orders, click ad rate etc.
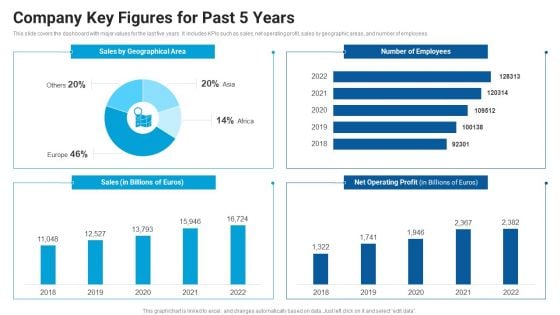
Company Key Figures For Past 5 Years Market Entry Approach For Apparel Sector Clipart PDF
This slide covers the dashboard with major values for the last five years. It includes KPIs such as sales, net operating profit, sales by geographic areas, and number of employees. Deliver an awe inspiring pitch with this creative Company Key Figures For Past 5 Years Market Entry Approach For Apparel Sector Clipart PDF bundle. Topics like Sales Geographical, Number Employees, Operating Profit can be discussed with this completely editable template. It is available for immediate download depending on the needs and requirements of the user.
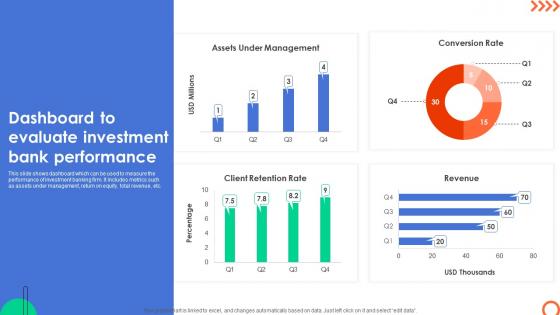
Dashboard To Evaluate Investment Bank Understanding Investment Banking Framework Fin SS V
This slide shows dashboard which can be used to measure the performance of investment banking firm. It includes metrics such as assets under management, return on equity, total revenue, etc. Find highly impressive Dashboard To Evaluate Investment Bank Understanding Investment Banking Framework Fin SS V on Slidegeeks to deliver a meaningful presentation. You can save an ample amount of time using these presentation templates. No need to worry to prepare everything from scratch because Slidegeeks experts have already done a huge research and work for you. You need to download Dashboard To Evaluate Investment Bank Understanding Investment Banking Framework Fin SS V for your upcoming presentation. All the presentation templates are 100 percent editable and you can change the color and personalize the content accordingly. Download now This slide shows dashboard which can be used to measure the performance of investment banking firm. It includes metrics such as assets under management, return on equity, total revenue, etc.
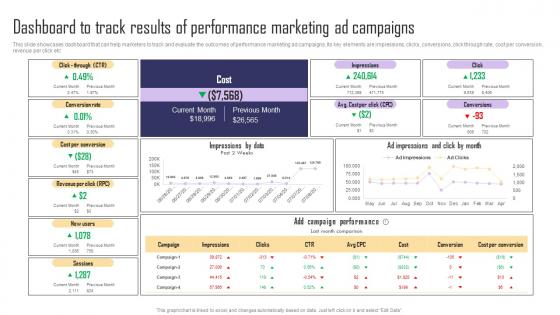
Dashboard To Track Results Of Performance Marketing Paid Internet Marketing Strategy Information Pdf
This slide showcases dashboard that can help marketers to track and evaluate the outcomes of performance marketing ad campaigns. Its key elements are impressions, clicks, conversions, click through rate, cost per conversion, revenue per click etc. Do you have an important presentation coming up Are you looking for something that will make your presentation stand out from the rest Look no further than Dashboard To Track Results Of Performance Marketing Paid Internet Marketing Strategy Information Pdf. With our professional designs, you can trust that your presentation will pop and make delivering it a smooth process. And with Slidegeeks, you can trust that your presentation will be unique and memorable. So why wait Grab Dashboard To Track Results Of Performance Marketing Paid Internet Marketing Strategy Information Pdf today and make your presentation stand out from the rest. This slide showcases dashboard that can help marketers to track and evaluate the outcomes of performance marketing ad campaigns. Its key elements are impressions, clicks, conversions, click through rate, cost per conversion, revenue per click etc.
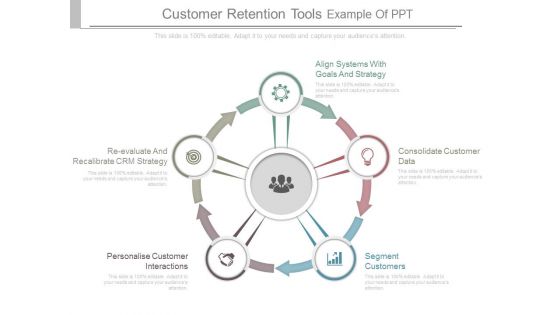
Customer Retention Tools Example Of Ppt
This is a customer retention tools example of ppt. This is a five stage process. The stages in this process are align systems with goals and strategy, consolidate customer data, segment customers, personalise customer interactions, re evaluate and recalibrate crm strategy.
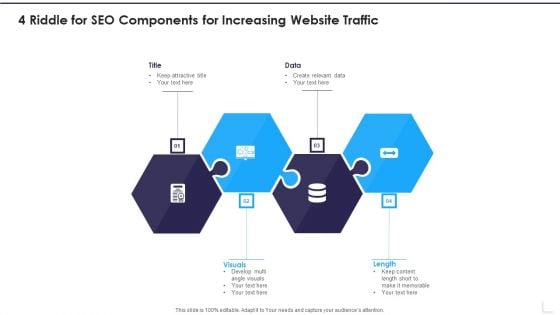
4 Riddle For SEO Components For Increasing Website Traffic Graphics PDF
Presenting 4 Riddle For SEO Components For Increasing Website Traffic Graphics PDF to dispense important information. This template comprises four stages. It also presents valuable insights into the topics including Visuals, Data, Title. This is a completely customizable PowerPoint theme that can be put to use immediately. So, download it and address the topic impactfully.
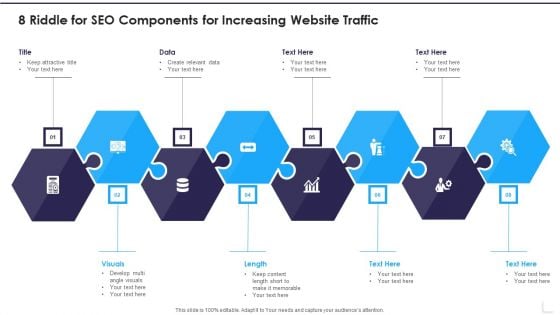
8 Riddle For SEO Components For Increasing Website Traffic Summary PDF
Presenting 8 Riddle For SEO Components For Increasing Website Traffic Summary PDF to dispense important information. This template comprises eight stages. It also presents valuable insights into the topics including Visuals, Length, Data. This is a completely customizable PowerPoint theme that can be put to use immediately. So, download it and address the topic impactfully.
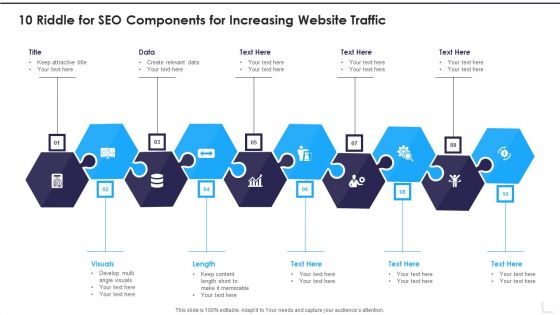
10 Riddle For SEO Components For Increasing Website Traffic Mockup PDF
Presenting 10 Riddle For SEO Components For Increasing Website Traffic Mockup PDF to dispense important information. This template comprises ten stages. It also presents valuable insights into the topics including Visuals, Length, Data. This is a completely customizable PowerPoint theme that can be put to use immediately. So, download it and address the topic impactfully.
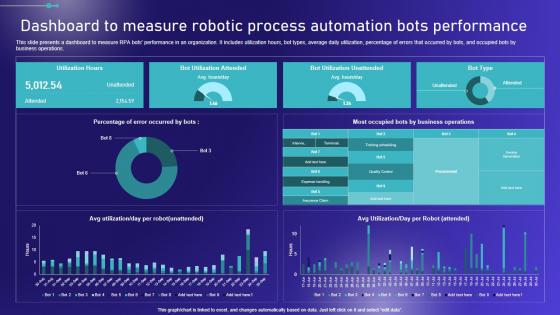
Dashboard To Measure Robotic Process Automation Embracing Robotic Process Diagrams PDF
This slide presents a dashboard to measure RPA bots performance in an organization. It includes utilization hours, bot types, average daily utilization, percentage of errors that occurred by bots, and occupied bots by business operations. If you are looking for a format to display your unique thoughts, then the professionally designed Dashboard To Measure Robotic Process Automation Embracing Robotic Process Diagrams PDF is the one for you. You can use it as a Google Slides template or a PowerPoint template. Incorporate impressive visuals, symbols, images, and other charts. Modify or reorganize the text boxes as you desire. Experiment with shade schemes and font pairings. Alter, share or cooperate with other people on your work. Download Dashboard To Measure Robotic Process Automation Embracing Robotic Process Diagrams PDF and find out how to give a successful presentation. Present a perfect display to your team and make your presentation unforgettable. This slide presents a dashboard to measure RPA bots performance in an organization. It includes utilization hours, bot types, average daily utilization, percentage of errors that occurred by bots, and occupied bots by business operations.
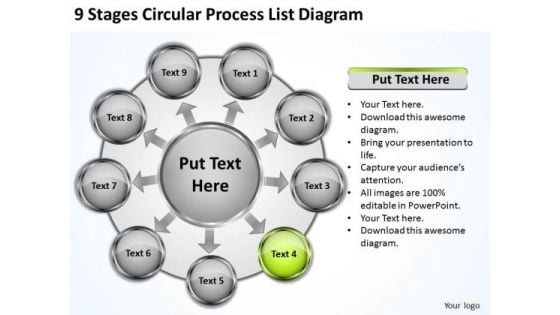
Stages Circular Process List Diagram Business Plan Software PowerPoint Templates
We present our stages circular process list diagram business plan software PowerPoint templates.Use our Circle Charts PowerPoint Templates because Our PowerPoint Templates and Slides will let you Clearly mark the path for others to follow. Download and present our Arrows PowerPoint Templates because You should Kick up a storm with our PowerPoint Templates and Slides. The heads of your listeners will swirl with your ideas. Download and present our Shapes PowerPoint Templates because Our PowerPoint Templates and Slides come in all colours, shades and hues. They help highlight every nuance of your views. Download our Business PowerPoint Templates because Our PowerPoint Templates and Slides are effectively colour coded to prioritise your plans They automatically highlight the sequence of events you desire. Download our Process and Flows PowerPoint Templates because You can Channelise the thoughts of your team with our PowerPoint Templates and Slides. Urge them to focus on the goals you have set.Use these PowerPoint slides for presentations relating to abstract, affiliate, analysis, banners, blog, branding, business, chart, circle, circular, communication, company, components, computer, content, copyspace, diagram, email, flower, forum, gift, graphic, hours, illustration, information, internet, list, market, marketing, network, online, options, petals, pictogram, presentation, sales, sectors, selling, seo, shop, social, social network, sphere, strategy, template, text, variations, vector, web. The prominent colors used in the PowerPoint template are Blue, Gray, Black. Lecture teams with our Stages Circular Process List Diagram Business Plan Software PowerPoint Templates. Download without worries with our money back guaranteee.
Digital Competency Evaluation And Modification Venn Ppt Model Objects PDF
The Digital Competency Evaluation And Modification Venn Ppt Model Objects PDF is a compilation of the most recent design trends as a series of slides. It is suitable for any subject or industry presentation, containing attractive visuals and photo spots for businesses to clearly express their messages. This template contains a variety of slides for the user to input data, such as structures to contrast two elements, bullet points, and slides for written information. Slidegeeks is prepared to create an impression.

Business Diagram Super Hero With Chest Open Text Box PowerPoint Template
This amazing PPT diagram has been designed with graphic of super hero. In this PPT diagram chest of hero is open and contains the text boxes. These text boxes can be used for displaying data. This PPT is suitable for business and marketing related presentations.

Ppt Four Segments Around Globe PowerPoint Presentation Circle Blue Templates
PPT four segments around globe powerpoint presentation circle blue Templates-This PowerPoint Diagram can be used to represent worldwide business issues such as financial data, stock market Exchange, increase in sales, corporate presentations and more. It illustrates the blue component of this worldwide PowerPoint Diagram.-Can be used for presentations on abstract, achievement, aim, arrow, background, business, chart, communication, company, competition, concept, design, development, diagram, direction, finance, financial, forecast, forward, goal, graph, graphic, growth, icon, illustration, increase, investment, leader, leadership, marketing, motion, moving, path, price, process, profit, progress, progress bar, shape, sign, success, symbol, target, team, teamwork, turquoise blue, up, upward-PPT four segments around globe powerpoint presentation circle blue Templates Add to your armoury with our Ppt Four Segments Around Globe PowerPoint Presentation Circle Blue Templates. Take up the contest with your thoughts.
Ppt Four Segments Around Microsoft PowerPoint Backgrounds Circle Purple Templates
PPT four segments around microsoft powerpoint backgrounds circle purple Templates-This PowerPoint Diagram can be used to represent worldwide business issues such as financial data, stock market Exchange, increase in sales, corporate presentations and more. It illustrates the purple component. This Diagram will fit for Business Presentations.-Can be used for presentations on abstract, achievement, aim, arrow, background, business, chart, communication, company, competition, concept, design, development, diagram, direction, finance, financial, forecast, forward, goal, graph, graphic, growth, icon, illustration, increase, investment, leader, leadership, marketing, motion, moving, path, price, process, profit, progress, progress bar, shape, sign, success, symbol, target, team, teamwork, turquoise blue, up, upward-PPT four segments around microsoft powerpoint backgrounds circle purple Templates Handle a delicate situation with our Ppt Four Segments Around Microsoft PowerPoint Backgrounds Circle Purple Templates. Just download, type and present.
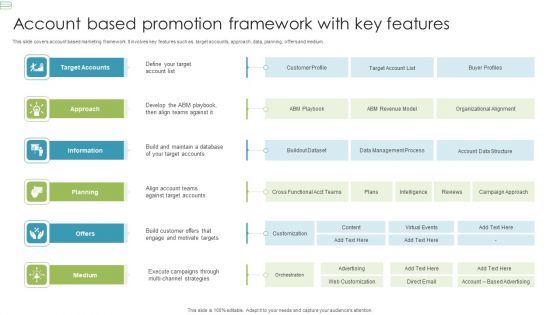
Account Based Promotion Framework With Key Features Graphics PDF
This slide covers account based marketing framework. It involves key features such as target accounts, approach, data, planning, offers and medium. Presenting Account Based Promotion Framework With Key Features Graphics PDF to dispense important information. This template comprises Six stages. It also presents valuable insights into the topics including Target Accounts, Information, Planning. This is a completely customizable PowerPoint theme that can be put to use immediately. So, download it and address the topic impactfully.
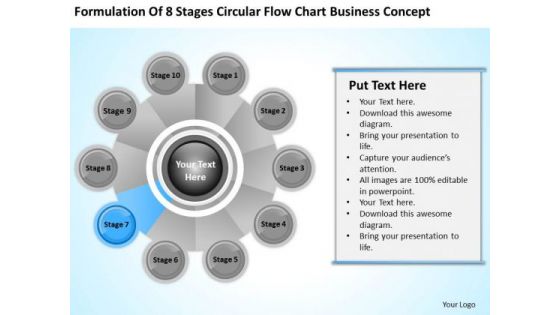
Business PowerPoint Examples Stages Circular Flow Chart Concept Ppt Slides
We present our business powerpoint examples stages circular flow chart concept ppt slides.Present our Business PowerPoint Templates because Our PowerPoint Templates and Slides will help you be quick off the draw. Just enter your specific text and see your points hit home. Present our Circle Charts PowerPoint Templates because Our PowerPoint Templates and Slides will embellish your thoughts. See them provide the desired motivation to your team. Download and present our Shapes PowerPoint Templates because Our PowerPoint Templates and Slides will give good value for money. They also have respect for the value of your time. Present our Process and Flows PowerPoint Templates because you should Whip up a frenzy with our PowerPoint Templates and Slides. They will fuel the excitement of your team. Use our Leadership PowerPoint Templates because Our PowerPoint Templates and Slides are designed to help you succeed. They have all the ingredients you need.Use these PowerPoint slides for presentations relating to project, flow, process, business, system, success, chart, work, innovation, implementation, plan, concept, evaluation, presentation, symbol, internet, diagram, analysis, flowchart, analyzing, technology, idea, development, management, steps, strategy, addie, design, outcome, assessment, structure. The prominent colors used in the PowerPoint template are Blue light, Gray, White. Supply great ideas with our Business PowerPoint Examples Stages Circular Flow Chart Concept Ppt Slides. Download without worries with our money back guaranteee.
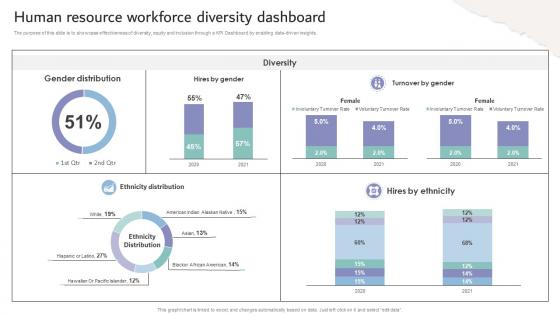
Inclusive Workplace Training Program Human Resource Workforce Diversity Dashboard DTE SS V
The purpose of this slide is to showcase effectiveness of diversity, equity and inclusion through a KPI Dashboard by enabling data-driven insights. Make sure to capture your audiences attention in your business displays with our gratis customizable Inclusive Workplace Training Program Human Resource Workforce Diversity Dashboard DTE SS V. These are great for business strategies, office conferences, capital raising or task suggestions. If you desire to acquire more customers for your tech business and ensure they stay satisfied, create your own sales presentation with these plain slides. The purpose of this slide is to showcase effectiveness of diversity, equity and inclusion through a KPI Dashboard by enabling data-driven insights.

Training Course Feedback Questionnaire Form Ppt PowerPoint Presentation Complete Deck With Slides Survey
Share a great deal of information on the topic by deploying this Training Course Feedback Questionnaire Form Ppt PowerPoint Presentation Complete Deck With Slides Survey. Support your ideas and thought process with this prefabricated set. It includes a set of four slides, all fully modifiable and editable. Each slide can be restructured and induced with the information and content of your choice. You can add or remove large content boxes as well, to make this PPT slideshow more personalized. Its high-quality graphics and visuals help in presenting a well-coordinated pitch. This PPT template is also a resourceful tool to take visual cues from and implement the best ideas to help your business grow and expand. The main attraction of this well-formulated deck is that everything is editable, giving you the freedom to adjust it to your liking and choice. Changes can be made in the background and theme as well to deliver an outstanding pitch. Therefore, click on the download button now to gain full access to this multifunctional set. Our Training Course Feedback Questionnaire Form Ppt PowerPoint Presentation Complete Deck With Slides Survey are topically designed to provide an attractive backdrop to any subject. Use them to look like a presentation pro.
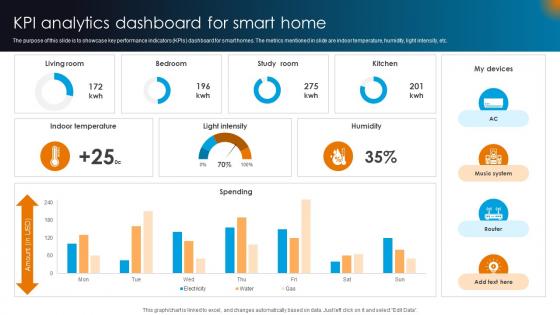
Integrating AI With IoT Kpi Analytics Dashboard For Smart Home IoT SS V
The purpose of this slide is to showcase key performance indicators KPIs dashboard for smart homes. The metrics mentioned in slide are indoor temperature, humidity, light intensity, etc. Are you searching for a Integrating AI With IoT Kpi Analytics Dashboard For Smart Home IoT SS V that is uncluttered, straightforward, and original Its easy to edit, and you can change the colors to suit your personal or business branding. For a presentation that expresses how much effort you have put in, this template is ideal With all of its features, including tables, diagrams, statistics, and lists, its perfect for a business plan presentation. Make your ideas more appealing with these professional slides. Download Integrating AI With IoT Kpi Analytics Dashboard For Smart Home IoT SS V from Slidegeeks today. The purpose of this slide is to showcase key performance indicators KPIs dashboard for smart homes. The metrics mentioned in slide are indoor temperature, humidity, light intensity, etc.
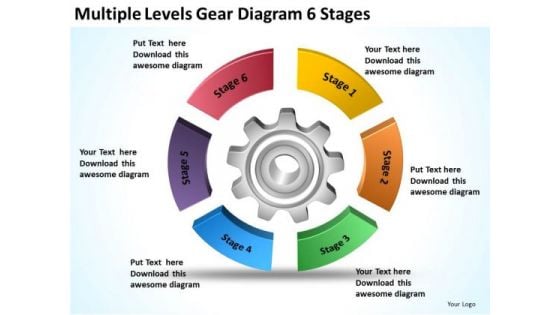
Multiple Levels Gear Diagram 6 Stages Business Plans PowerPoint Templates
We present our multiple levels gear diagram 6 stages business plans PowerPoint templates.Present our Process and Flows PowerPoint Templates because Our PowerPoint Templates and Slides are topically designed to provide an attractive backdrop to any subject. Download and present our Circle Charts PowerPoint Templates because Our PowerPoint Templates and Slides come in all colours, shades and hues. They help highlight every nuance of your views. Use our Business PowerPoint Templates because Our PowerPoint Templates and Slides will let you Leave a lasting impression to your audiences. They possess an inherent longstanding recall factor. Use our Shapes PowerPoint Templates because our PowerPoint Templates and Slides will give your ideas the shape. Use our Flow Charts PowerPoint Templates because They will Put the wind in your sails. Skim smoothly over the choppy waters of the market.Use these PowerPoint slides for presentations relating to Business, plan, vector, process, operation, organization, circle, market, target, formula, corporate, future, concept, render, unity, success,diagram, graphic, element, analysis, goal, marketing, idea, gear, abstract, mind, management, connection, chart, strategy, solutions, training, timeline,swot, direction, design, conference, link, competition, organize, attitude, financial, action, product. The prominent colors used in the PowerPoint template are Purple, Red, Green. Index your ascent with our Multiple Levels Gear Diagram 6 Stages Business Plans PowerPoint Templates. Illustrate every step of the way.
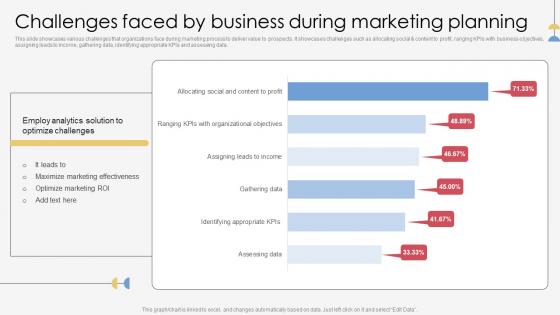
Challenges Faced By Business Marketing Process Execution For Successful Promotion Structure Pdf
This slide showcases various challenges that organizations face during marketing process to deliver value to prospects. It showcases challenges such as allocating social and content to profit, ranging KPIs with business objectives, assigning leads to income, gathering data, identifying appropriate KPIs and assessing data. Boost your pitch with our creative Challenges Faced By Business Marketing Process Execution For Successful Promotion Structure Pdf. Deliver an awe inspiring pitch that will mesmerize everyone. Using these presentation templates you will surely catch everyones attention. You can browse the ppts collection on our website. We have researchers who are experts at creating the right content for the templates. So you do not have to invest time in any additional work. Just grab the template now and use them. This slide showcases various challenges that organizations face during marketing process to deliver value to prospects. It showcases challenges such as allocating social and content to profit, ranging KPIs with business objectives, assigning leads to income, gathering data, identifying appropriate KPIs and assessing data.
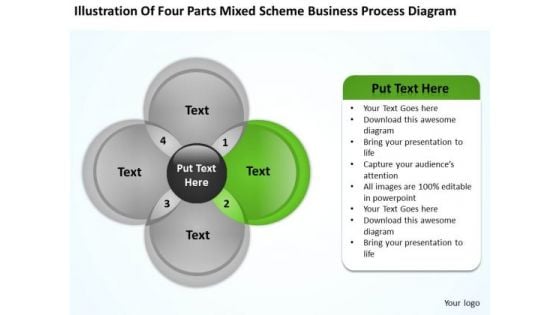
Scheme Business Process Diagram Ppt Plan For Startup PowerPoint Templates
We present our scheme business process diagram ppt plan for startup PowerPoint templates.Present our Circle Charts PowerPoint Templates because It will let you Set new benchmarks with our PowerPoint Templates and Slides. They will keep your prospects well above par. Use our Flow Charts PowerPoint Templates because You will get more than you ever bargained for. Present our Business PowerPoint Templates because It will Raise the bar of your Thoughts. They are programmed to take you to the next level. Download our Marketing PowerPoint Templates because Our PowerPoint Templates and Slides have the Brilliant backdrops. Guaranteed to illuminate the minds of your audience. Use our Process and Flows PowerPoint Templates because Our PowerPoint Templates and Slides are specially created by a professional team with vast experience. They diligently strive to come up with the right vehicle for your brilliant Ideas. Use these PowerPoint slides for presentations relating to Business, advertise, plan, concept, vector, success, diagram, process, analysis, marketing, development, manage, four, efficiency, project, place, color, consumer, services, four , profit, advertising, successful, mix, promotion . The prominent colors used in the PowerPoint template are Green, Gray, Black. Develop a customer driven ethic for your team. Use our Scheme Business Process Diagram Ppt Plan For Startup PowerPoint Templates to convince them to display care.
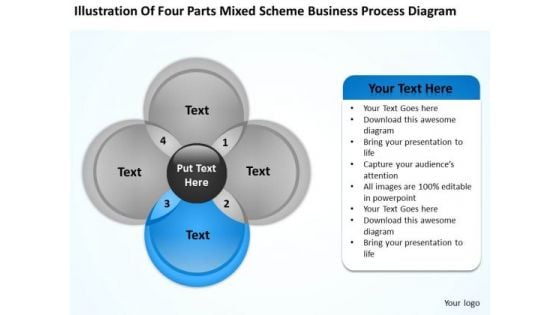
Scheme Business Process Diagram Ppt Plan Template Free PowerPoint Slides
We present our scheme business process diagram ppt plan template free PowerPoint Slides.Download our Circle Charts PowerPoint Templates because They will bring a lot to the table. Their alluring flavours will make your audience salivate. Download and present our Flow Charts PowerPoint Templates because Timeline crunches are a fact of life. Meet all deadlines using our PowerPoint Templates and Slides. Download and present our Business PowerPoint Templates because Our PowerPoint Templates and Slides will embellish your thoughts. See them provide the desired motivation to your team. Download our Marketing PowerPoint Templates because Your ideas provide food for thought. Our PowerPoint Templates and Slides will help you create a dish to tickle the most discerning palate. Present our Process and Flows PowerPoint Templates because Our PowerPoint Templates and Slides will provide you a launch platform. Give a lift off to your ideas and send them into orbit.Use these PowerPoint slides for presentations relating to Business, advertise, plan, concept, vector, success, diagram, process, analysis, marketing, development, manage, four, efficiency, project, place, color, consumer, services, four , profit, advertising, successful, mix, promotion . The prominent colors used in the PowerPoint template are Blue, Gray, Black. Be the diva of the dais with our Scheme Business Process Diagram Ppt Plan Template Free PowerPoint Slides. Display a dapper attitude with your thoughts.
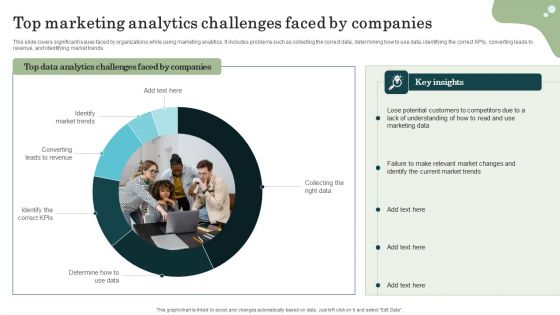
Marketing Success Metrics Top Marketing Analytics Challenges Faced By Inspiration PDF
This slide covers significant issues faced by organizations while using marketing analytics. It includes problems such as collecting the correct data, determining how to use data, identifying the correct KPIs, converting leads to revenue, and identifying market trends. Boost your pitch with our creative Marketing Success Metrics Top Marketing Analytics Challenges Faced By Inspiration PDF. Deliver an awe-inspiring pitch that will mesmerize everyone. Using these presentation templates you will surely catch everyones attention. You can browse the ppts collection on our website. We have researchers who are experts at creating the right content for the templates. So you dont have to invest time in any additional work. Just grab the template now and use them.
Diagram Planning Performance Of Process 12 Stages Ppt Business Company PowerPoint Slides
We present our diagram planning performance of process 12 stages ppt business company PowerPoint Slides.Download and present our Education PowerPoint Templates because Our PowerPoint Templates and Slides will provide weight to your words. They will bring out the depth of your thought process. Use our Flow Charts PowerPoint Templates because Our PowerPoint Templates and Slides will help you be quick off the draw. Just enter your specific text and see your points hit home. Download our Process and Flows PowerPoint Templates because Our PowerPoint Templates and Slides will weave a web of your great ideas. They are gauranteed to attract even the most critical of your colleagues. Present our Arrows PowerPoint Templates because you should once Tap the ingenuity of our PowerPoint Templates and Slides. They are programmed to succeed. Use our Marketing PowerPoint Templates because Our PowerPoint Templates and Slides will let you meet your Deadlines.Use these PowerPoint slides for presentations relating to Mark, corporate, business, plan, concept, bright, symbol, diagram, crayon, stack, graphic, finance, stock,analysis, drawing, paint, calculation, accounting, creative, economic, creativity, chart, forecast, design, color, objects, stationary, pencil, education,profit, information, background, investment, figures, business, business process. The prominent colors used in the PowerPoint template are Yellow, Gray, Black. Get fascinated by our Diagram Planning Performance Of Process 12 Stages Ppt Business Company PowerPoint Slides. They will keep attracting your attention.
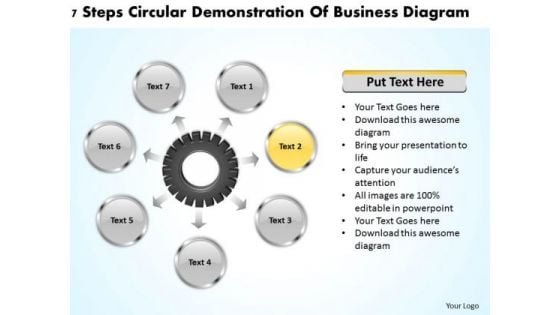
Business Concepts 7 Steps Circular Demonstration Of Diagram Ppt PowerPoint
We present our business concepts 7 steps circular demonstration of diagram ppt Powerpoint.Present our Marketing PowerPoint Templates because Our PowerPoint Templates and Slides provide you with a vast range of viable options. Select the appropriate ones and just fill in your text. Use our Business PowerPoint Templates because Our PowerPoint Templates and Slides will steer your racing mind. Hit the right buttons and spur on your audience. Present our Circle Charts PowerPoint Templates because It will Strengthen your hand with your thoughts. They have all the aces you need to win the day. Present our Arrows PowerPoint Templates because It will Give impetus to the hopes of your colleagues. Our PowerPoint Templates and Slides will aid you in winning their trust. Use our Process and Flows PowerPoint Templates because They will Put your wonderful verbal artistry on display. Our PowerPoint Templates and Slides will provide you the necessary glam and glitter.Use these PowerPoint slides for presentations relating to 3d, Action, Analysis, Attitude, Brainstorming, Business, Chart, Classroom, Concept, Conceptual, Conference, Connection, Corporate, Design, Diagram, Direction, Element, Employee, Enhance, Financial, Formula, Future, Goal, Graphic, Guidelines, Idea, Link, Management, Market, Marketing, Mind, Mind Map, Organization, Organize, Plan, Process, Product, Relation, Render, Solutions, Strategy, Success, Successful, Tactic, Target, Text, Training, Unity. The prominent colors used in the PowerPoint template are Yellow, Gray, Black. Our Business Concepts 7 Steps Circular Demonstration Of Diagram Ppt PowerPoint are like a dictionary. They will have the right words for you.
Insider Threat In Cyber Security Tracking Dashboard With User Details Portrait PDF
This slide shows user details tracked by insider threat dashboard. It provides information such as exposure events, file activity, archive, document, image, pdf, ppt, scripts, etc. Pitch your topic with ease and precision using this Insider Threat In Cyber Security Tracking Dashboard With User Details Portrait PDF. This layout presents information on Private Data, Exposure Events, User Activity, File Activity, Over Time. It is also available for immediate download and adjustment. So, changes can be made in the color, design, graphics or any other component to create a unique layout.
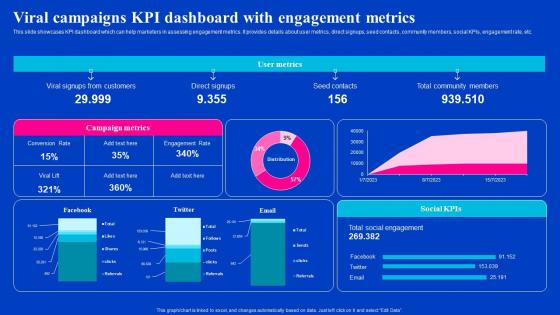
Viral Campaigns KPI Dashboard With Engagement Metrics Viral Video Outreach Plan Diagrams Pdf
This slide showcases KPI dashboard which can help marketers in assessing engagement metrics. It provides details about user metrics, direct signups, seed contacts, community members, social KPIs, engagement rate, etc. Find highly impressive Viral Campaigns KPI Dashboard With Engagement Metrics Viral Video Outreach Plan Diagrams Pdf on Slidegeeks to deliver a meaningful presentation. You can save an ample amount of time using these presentation templates. No need to worry to prepare everything from scratch because Slidegeeks experts have already done a huge research and work for you. You need to download Viral Campaigns KPI Dashboard With Engagement Metrics Viral Video Outreach Plan Diagrams Pdf for your upcoming presentation. All the presentation templates are 100Precent editable and you can change the color and personalize the content accordingly. Download now. This slide showcases KPI dashboard which can help marketers in assessing engagement metrics. It provides details about user metrics, direct signups, seed contacts, community members, social KPIs, engagement rate, etc.
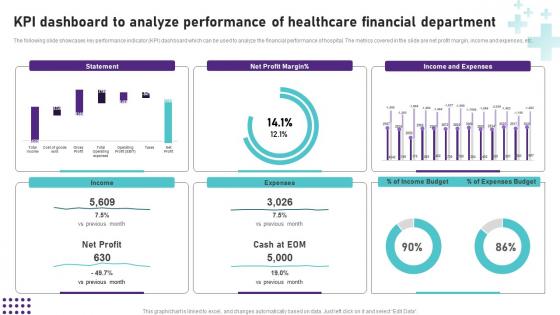
KPI Dashboard To Analyze Performance Of Healthcare Operational Areas Healthcare Clipart PDF
Are you searching for a KPI Dashboard To Analyze Performance Of Healthcare Operational Areas Healthcare Clipart PDF that is uncluttered, straightforward, and original Its easy to edit, and you can change the colors to suit your personal or business branding. For a presentation that expresses how much effort you have put in, this template is ideal With all of its features, including tables, diagrams, statistics, and lists, its perfect for a business plan presentation. Make your ideas more appealing with these professional slides. Download Kpi Dashboard To Analyze Performance Of Healthcare Operational Areas Healthcare Clipart PDF from Slidegeeks today. The following slide showcases key performance indicator KPI dashboard which can be used to analyze the financial performance of hospital. The metrics covered in the slide are net profit margin, income and expenses, etc.
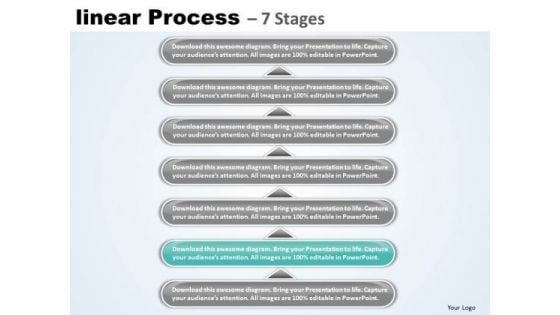
Usa Ppt Linear Process 7 Phase Diagram Project Management PowerPoint 3 Graphic
USA PPT linear process 7 phase diagram project management powerpoint 3 Graphic-This slide is an excellent backdrop for you to enlighten your audience on the process you have gone through and the vision you have for the future. Narrow them down and prove their viability to help your organization -USA PPT linear process 7 phase diagram project management powerpoint 3 Graphic-Abstract, Achievement, Adding, Analyzing, Arrow, Art, Background, Blank, Blue, Business, Chart, Color, Colorful, Cycle, Data, Design, Diagram, Element, Flow, Graph, Graphic, Gray, Green, Icon, Linear, Management, Market, Numbers, Percent, Process, Project, Round, Stock, Success Hop over obstacles with our Usa Ppt Linear Process 7 Phase Diagram Project Management PowerPoint 3 Graphic. Make sure your presentation gets the attention it deserves.
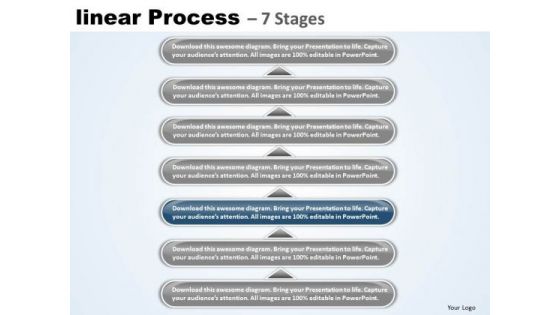
Usa Ppt Linear Process 7 Phase Diagram Project Management PowerPoint 4 Graphic
USA PPT linear process 7 phase diagram project management powerpoint 4 Graphic-Outline the path you have in mind in order to boost sales and stay ahead of the competition enhancing your corporate reputation as you go along the road to success. Now use this slide to transmit this clarity of purpose onto the eager minds of your team.-USA PPT linear process 7 phase diagram project management powerpoint 4 Graphic-Abstract, Achievement, Adding, Analyzing, Arrow, Art, Background, Blank, Blue, Business, Chart, Color, Colorful, Cycle, Data, Design, Diagram, Element, Flow, Graph, Graphic, Gray, Green, Icon, Linear, Management, Market, Numbers, Percent, Process, Project, Round, Stock, Success Making plans with our Usa Ppt Linear Process 7 Phase Diagram Project Management PowerPoint 4 Graphic entails success. They ensure automatic returns.
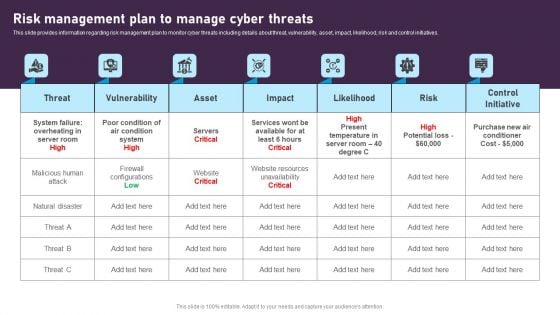
Risk Management Plan To Manage Cyber Threats Themes PDF
This slide provides information regarding risk management plan to monitor cyber threats including details about threat, vulnerability, asset, impact, likelihood, risk and control initiatives. The Risk Management Plan To Manage Cyber Threats Themes PDF is a compilation of the most recent design trends as a series of slides. It is suitable for any subject or industry presentation, containing attractive visuals and photo spots for businesses to clearly express their messages. This template contains a variety of slides for the user to input data, such as structures to contrast two elements, bullet points, and slides for written information. Slidegeeks is prepared to create an impression.

 Home
Home