Data Analysis Icon
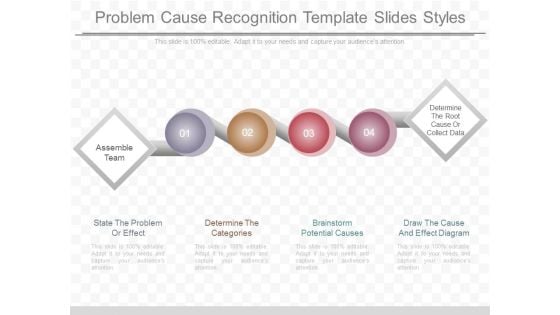
Problem Cause Recognition Template Slides Styles
This is a problem cause recognition template slides styles. This is a four stage process. The stages in this process are assemble team, determine the root cause or collect data, state the problem or effect, determine the categories, brainstorm potential causes, draw the cause and effect diagram.
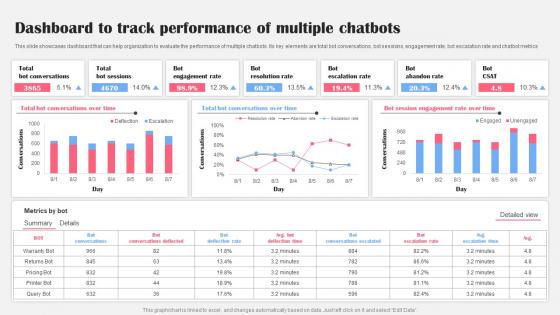
Dashboard To Track Performance Multiple AI Bot Application For Various Industries Demonstration Pdf
This slide showcases dashboard that can help organization to evaluate the performance of multiple chatbots. Its key elements are total bot conversations, bot sessions, engagement rate, bot escalation rate and chatbot metrics Are you searching for a Dashboard To Track Performance Multiple AI Bot Application For Various Industries Demonstration Pdf that is uncluttered, straightforward, and original Its easy to edit, and you can change the colors to suit your personal or business branding. For a presentation that expresses how much effort you have put in, this template is ideal With all of its features, including tables, diagrams, statistics, and lists, its perfect for a business plan presentation. Make your ideas more appealing with these professional slides. Download Dashboard To Track Performance Multiple AI Bot Application For Various Industries Demonstration Pdf from Slidegeeks today. This slide showcases dashboard that can help organization to evaluate the performance of multiple chatbots. Its key elements are total bot conversations, bot sessions, engagement rate, bot escalation rate and chatbot metrics
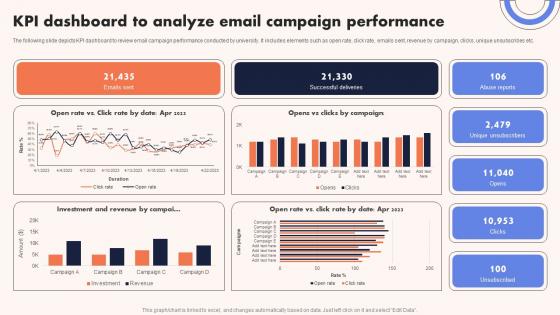
University Marketing Guide KPI Dashboard To Analyze Email Campaign Performance Strategy SS V
The following slide depicts KPI dashboard to review email campaign performance conducted by university. It includes elements such as open rate, click rate, emails sent, revenue by campaign, clicks, unique unsubscribes etc. Are you searching for a University Marketing Guide KPI Dashboard To Analyze Email Campaign Performance Strategy SS V that is uncluttered, straightforward, and original Its easy to edit, and you can change the colors to suit your personal or business branding. For a presentation that expresses how much effort you have put in, this template is ideal With all of its features, including tables, diagrams, statistics, and lists, its perfect for a business plan presentation. Make your ideas more appealing with these professional slides. Download University Marketing Guide KPI Dashboard To Analyze Email Campaign Performance Strategy SS V from Slidegeeks today. The following slide depicts KPI dashboard to review email campaign performance conducted by university. It includes elements such as open rate, click rate, emails sent, revenue by campaign, clicks, unique unsubscribes etc.
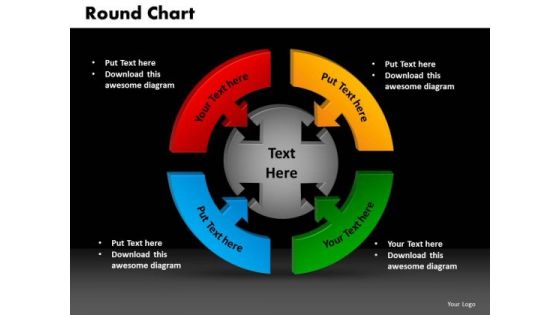
PowerPoint Design Round Chart Leadership Ppt Process
PowerPoint Design Round Chart Leadership PPT Process-Determine your targets and sequence them as per your priorities. Unravel each one for your audience while setting key timelines as you go along. Educate your listeners on the relevance and importance of each one as per your plan and how they all contribute as you strive to hit the Bullseye-PowerPoint Design Round Chart Leadership PPT Process-This ppt can be used for presentations relating to-3d, Angle, Arrow, Business, Chart, Circle, Complex, Concept, Data, Depth, Diagram, Dimensional, Financial, Graph, Graphic, Process Advise them on the regimen with our PowerPoint Design Round Chart Leadership Ppt Process. Get them ready to take the field.
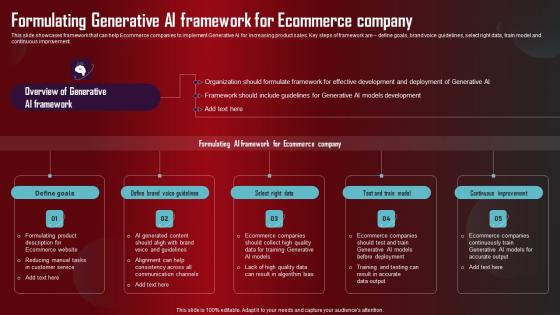
Formulating Generative AI Framework Role Of Generative AI Tools Across Themes Pdf
This slide showcases framework that can help Ecommerce companies to implement Generative AI for increasing product sales. Key steps of framework are define goals, brand voice guidelines, select right data, train model and continuous improvement. Whether you have daily or monthly meetings, a brilliant presentation is necessary. Formulating Generative AI Framework Role Of Generative AI Tools Across Themes Pdf can be your best option for delivering a presentation. Represent everything in detail using Formulating Generative AI Framework Role Of Generative AI Tools Across Themes Pdf and make yourself stand out in meetings. The template is versatile and follows a structure that will cater to your requirements. All the templates prepared by Slidegeeks are easy to download and edit. Our research experts have taken care of the corporate themes as well. So, give it a try and see the results. This slide showcases framework that can help Ecommerce companies to implement Generative AI for increasing product sales. Key steps of framework are define goals, brand voice guidelines, select right data, train model and continuous improvement.
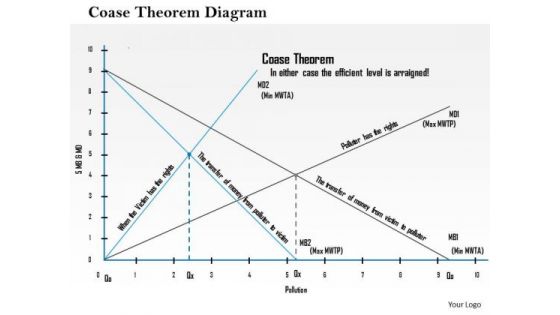
Business Framework Coase Theorem Diagram PowerPoint Presentation
This professional power point template has been crafted with graphic of cloud with laptop and application icons. This PPt shows the concept of cloud computing for devices. Use this PPT for your technology and business related topics.
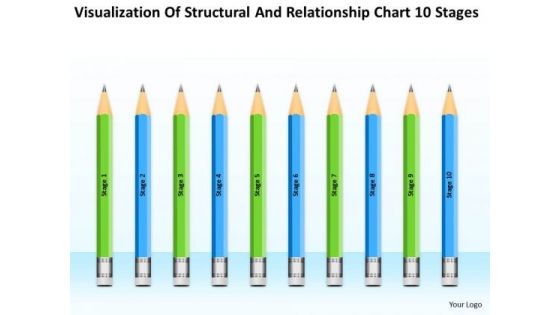
Structural And Relationship Chart 10 Stages Ppt One Page Business Plan PowerPoint Templates
We present our structural and relationship chart 10 stages ppt one page business plan PowerPoint templates.Download and present our Business PowerPoint Templates because Our PowerPoint Templates and Slides will fulfill your every need. Use them and effectively satisfy the desires of your audience. Download and present our Flow Charts PowerPoint Templates because Our PowerPoint Templates and Slides are conceived by a dedicated team. Use them and give form to your wondrous ideas. Download and present our Shapes PowerPoint Templates because It can Bubble and burst with your ideas. Use our Marketing PowerPoint Templates because You have a driving passion to excel in your field. Our PowerPoint Templates and Slides will prove ideal vehicles for your ideas. Download and present our Process and Flows PowerPoint Templates because Our PowerPoint Templates and Slides are created by a hardworking bunch of busybees. Always flitting around with solutions gauranteed to please.Use these PowerPoint slides for presentations relating to Market, isolated, rate, mark, corporate, row, business, plan, concept, bright, symbol, diagram, crayon, stack, graphic, finance, stock,analysis, drawing, paint, calculation, accounting, creative, economic, creativity, chart, forecast, design, color, objects, stationary, pencil, education,profit, information, background, investment, figures, rainbow, financial, artist, capital, business, business process. The prominent colors used in the PowerPoint template are Green, Blue, Black. Be productive with our Structural And Relationship Chart 10 Stages Ppt One Page Business Plan PowerPoint Templates. You will come out on top.
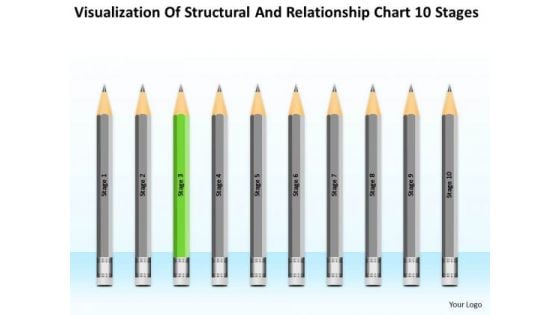
Structural And Relationship Chart 10 Stages Ppt Business Planning PowerPoint Templates
We present our structural and relationship chart 10 stages ppt business planning PowerPoint templates.Present our Process and Flows PowerPoint Templates because Our PowerPoint Templates and Slides are Clear and concise. Use them and dispel any doubts your team may have. Download our Flow Charts PowerPoint Templates because You can Double your output with our PowerPoint Templates and Slides. They make beating deadlines a piece of cake. Use our Education PowerPoint Templates because Our PowerPoint Templates and Slides will definately Enhance the stature of your presentation. Adorn the beauty of your thoughts with their colourful backgrounds. Download and present our Shapes PowerPoint Templates because You can Flag mark the road ahead with our PowerPoint Templates and Slides. They will unfurl your brilliant plans to your audience. Download our Marketing PowerPoint Templates because Our PowerPoint Templates and Slides will let Your superior ideas hit the target always and everytime.Use these PowerPoint slides for presentations relating to Mark, corporate, business, plan, concept, bright, symbol, diagram, crayon, stack, graphic, finance, stock,analysis, drawing, paint, calculation, accounting, creative, economic, creativity, chart, forecast, design, color, objects, stationary, pencil, education,profit, information, background, investment, figures, ten, business, business process. The prominent colors used in the PowerPoint template are Green, Gray, Black. However faint their hopes may be. Buck them up with our Structural And Relationship Chart 10 Stages Ppt Business Planning PowerPoint Templates.
Structural And Relationship Chart 10 Stages Ppt Help With Business Plan PowerPoint Templates
We present our structural and relationship chart 10 stages ppt help with business plan PowerPoint templates.Use our Education PowerPoint Templates because You are an avid believer in ethical practices. Highlight the benefits that accrue with our PowerPoint Templates and Slides. Download our Process and Flows PowerPoint Templates because You can Double your output with our PowerPoint Templates and Slides. They make beating deadlines a piece of cake. Use our Flow Charts PowerPoint Templates because It is Aesthetically crafted by artistic young minds. Our PowerPoint Templates and Slides are designed to display your dexterity. Use our Marketing PowerPoint Templates because You can Connect the dots. Fan expectations as the whole picture emerges. Download and present our Business PowerPoint Templates because Our PowerPoint Templates and Slides will let you Clearly mark the path for others to follow.Use these PowerPoint slides for presentations relating to Mark, corporate, business, plan, concept, bright, symbol, diagram, crayon, stack, graphic, finance, stock,analysis, drawing, paint, calculation, accounting, creative, economic, creativity, chart, forecast, design, color, objects, stationary, pencil, education,profit, information, background, investment, figures, ten, business, business process. The prominent colors used in the PowerPoint template are Black, Green, Gray. Preach the value of good business ethics. Our Structural And Relationship Chart 10 Stages Ppt Help With Business Plan PowerPoint Templates will keep the faith.
Structural And Relationship Chart 10 Stages Ppt Samples Business Plan PowerPoint Slides
We present our structural and relationship chart 10 stages ppt samples business plan PowerPoint Slides.Download and present our Education PowerPoint Templates because You can Score a slam dunk with our PowerPoint Templates and Slides. Watch your audience hang onto your every word. Download and present our Process and Flows PowerPoint Templates because Our PowerPoint Templates and Slides help you pinpoint your timelines. Highlight the reasons for your deadlines with their use. Use our Flow Charts PowerPoint Templates because our PowerPoint Templates and Slides are the string of your bow. Fire of your ideas and conquer the podium. Download and present our Marketing PowerPoint Templates because You can Bait your audience with our PowerPoint Templates and Slides. They will bite the hook of your ideas in large numbers. Download our Business PowerPoint Templates because You can Zap them with our PowerPoint Templates and Slides. See them reel under the impact.Use these PowerPoint slides for presentations relating to Mark, corporate, business, plan, concept, bright, symbol, diagram, crayon, stack, graphic, finance, stock,analysis, drawing, paint, calculation, accounting, creative, economic, creativity, chart, forecast, design, color, objects, stationary, pencil, education,profit, information, background, investment, figures, ten, business, business process. The prominent colors used in the PowerPoint template are Blue, Gray, Black. Flood your audience with great slides with our Structural And Relationship Chart 10 Stages Ppt Samples Business Plan PowerPoint Slides. Try us out and see what a difference our templates make.
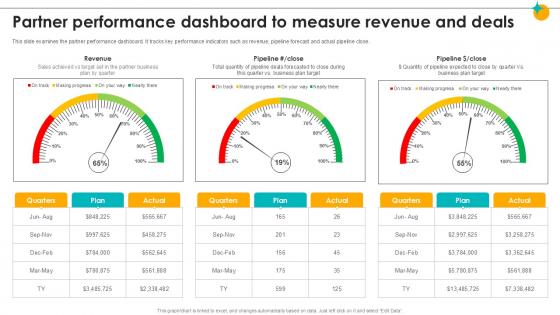
Partner Performance Dashboard To Measure Revenue Partner Relationship Ppt Template
This slide examines the partner performance dashboard. It tracks key performance indicators such as revenue, pipeline forecast and actual pipeline close. Are you in need of a template that can accommodate all of your creative concepts This one is crafted professionally and can be altered to fit any style. Use it with Google Slides or PowerPoint. Include striking photographs, symbols, depictions, and other visuals. Fill, move around, or remove text boxes as desired. Test out color palettes and font mixtures. Edit and save your work, or work with colleagues. Download Partner Performance Dashboard To Measure Revenue Partner Relationship Ppt Template and observe how to make your presentation outstanding. Give an impeccable presentation to your group and make your presentation unforgettable. This slide examines the partner performance dashboard. It tracks key performance indicators such as revenue, pipeline forecast and actual pipeline close.
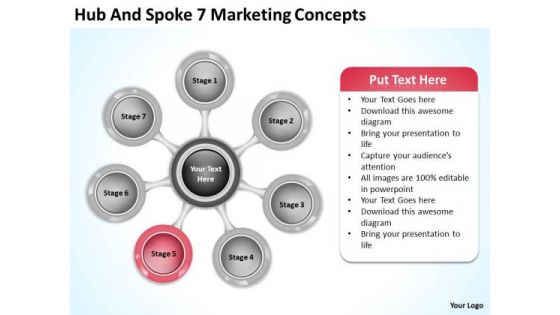
Hub And Spoke 7 Marketing Concepts Create Business Plan PowerPoint Templates
We present our hub and spoke 7 marketing concepts create business plan PowerPoint templates.Download our Process and Flows PowerPoint Templates because Our PowerPoint Templates and Slides will let Your superior ideas hit the target always and everytime. Present our Circle Charts PowerPoint Templates because You can Inspire your team with our PowerPoint Templates and Slides. Let the force of your ideas flow into their minds. Download and present our Business PowerPoint Templates because Our PowerPoint Templates and Slides have the Brilliant backdrops. Guaranteed to illuminate the minds of your audience. Present our Shapes PowerPoint Templates because You can Be the star of the show with our PowerPoint Templates and Slides. Rock the stage with your ideas. Download our Marketing PowerPoint Templates because you should Whip up a frenzy with our PowerPoint Templates and Slides. They will fuel the excitement of your team.Use these PowerPoint slides for presentations relating to Hub, networking, concept, diagram, flowchart, work, points, net, corporation, corporate, business, plan, render, teamwork, seven, circle,cooperation, scheme, analysis, technology, relation, idea, team, graph, molecule, illustration, pie, object, connection, chart, strategy, prioritize, web, group,organization, connect, organize, connectivity, marketing, interact, site, structure, international, communication. The prominent colors used in the PowerPoint template are White, Gray, Red. Compose your song with our Hub And Spoke 7 Marketing Concepts Create Business Plan PowerPoint Templates. You will come out on top.
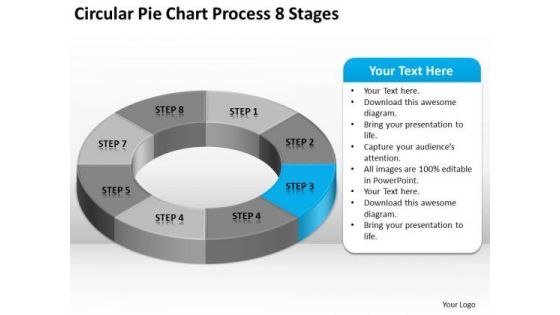
Circular Pie Chart Process 8 Stages Business Plan Forms PowerPoint Slides
We present our circular pie chart process 8 stages business plan forms PowerPoint Slides.Download our Marketing PowerPoint Templates because Our PowerPoint Templates and Slides will give good value for money. They also have respect for the value of your time. Download and present our Finance PowerPoint Templates because Our PowerPoint Templates and Slides will help you be quick off the draw. Just enter your specific text and see your points hit home. Download our Business PowerPoint Templates because Our PowerPoint Templates and Slides will generate and maintain the level of interest you desire. They will create the impression you want to imprint on your audience. Download and present our Circle Charts PowerPoint Templates because You have gained great respect for your brilliant ideas. Use our PowerPoint Templates and Slides to strengthen and enhance your reputation. Present our Shapes PowerPoint Templates because They will Put the wind in your sails. Skim smoothly over the choppy waters of the market.Use these PowerPoint slides for presentations relating to Chart, Pie, Graph, Vector, 3d, Icon, Diagram, Progress, Business, Circular, Design, Information, Market, Opinion, Corporate, Sign, Symbol, Shadow, Percentage, Graphic, Finance, Data, Element, Drawing, Report, Marketing, Shape, Illustration, Earnings, Number, Strategy, Money, Dimensional, Survey, Growth, Colorful, Global, Account, Part, Investment, Statistic, Financial. The prominent colors used in the PowerPoint template are Blue light, Gray, White. Get the largest value at the lowest price with our Circular Pie Chart Process 8 Stages Business Plan Forms PowerPoint Slides. Dont waste time struggling with PowerPoint. Let us do it for you.
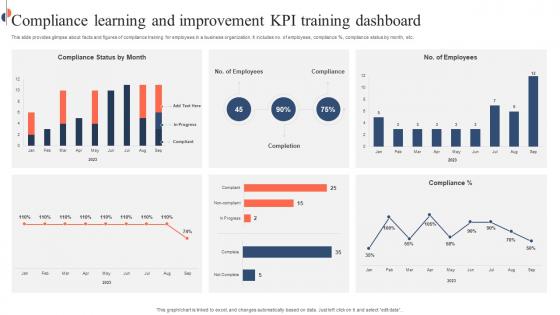
Compliance Learning And Improvement KPI Training Dashboard Sample Pdf
This slide provides glimpse about facts and figures of compliance training for employees in a business organization. It includes no. of employees, compliance percent, compliance status by month, etc. Pitch your topic with ease and precision using this Compliance Learning And Improvement KPI Training Dashboard Sample Pdf. This layout presents information on Compliance Learning, Improvement KPI, Training Dashboard, Compliance Training. It is also available for immediate download and adjustment. So, changes can be made in the color, design, graphics or any other component to create a unique layout. This slide provides glimpse about facts and figures of compliance training for employees in a business organization. It includes no. of employees, compliance percent, compliance status by month, etc.
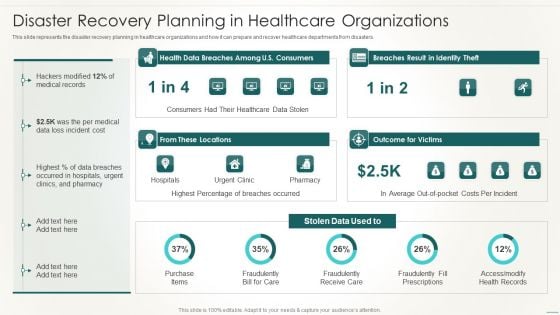
Information Technology Disaster Resilience Plan Disaster Recovery Planning Pictures PDF
This slide represents the disaster recovery planning in healthcare organizations and how it can prepare and recover healthcare departments from disasters.Deliver an awe inspiring pitch with this creative Information Technology Disaster Resilience Plan Disaster Recovery Planning Pictures PDF bundle. Topics like Healthcare Data, Highest Percentage, Breaches Occurred can be discussed with this completely editable template. It is available for immediate download depending on the needs and requirements of the user.

Investment Project KPI Dashboard Ppt PowerPoint Presentation Complete Deck With Slides
This Investment Project KPI Dashboard Ppt PowerPoint Presentation Complete Deck With Slides acts as backup support for your ideas, vision, thoughts, etc. Use it to present a thorough understanding of the topic. This PPT slideshow can be utilized for both in-house and outside presentations depending upon your needs and business demands. Entailing fourteen slides with a consistent design and theme, this template will make a solid use case. As it is intuitively designed, it suits every business vertical and industry. All you have to do is make a few tweaks in the content or any other component to design unique presentations. The biggest advantage of this complete deck is that it can be personalized multiple times once downloaded. The color, design, shapes, and other elements are free to modify to add personal touches. You can also insert your logo design in this PPT layout. Therefore a well-thought and crafted presentation can be delivered with ease and precision by downloading this Investment Project KPI Dashboard Ppt PowerPoint Presentation Complete Deck With Slides PPT slideshow.

Project Risk KPI Dashboard Ppt PowerPoint Presentation Complete Deck With Slides
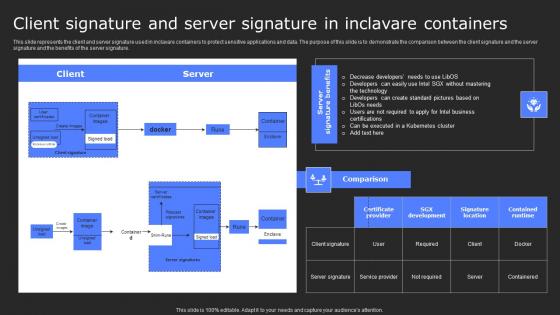
Client Signature And Server Signature In Secure Computing Framework Themes Pdf
This slide represents the client and server signature used in inclavare containers to protect sensitive applications and data. The purpose of this slide is to demonstrate the comparison between the client signature and the server signature and the benefits of the server signature. From laying roadmaps to briefing everything in detail, our templates are perfect for you. You can set the stage with your presentation slides. All you have to do is download these easy-to-edit and customizable templates. Client Signature And Server Signature In Secure Computing Framework Themes Pdf will help you deliver an outstanding performance that everyone would remember and praise you for. Do download this presentation today. This slide represents the client and server signature used in inclavare containers to protect sensitive applications and data. The purpose of this slide is to demonstrate the comparison between the client signature and the server signature and the benefits of the server signature.
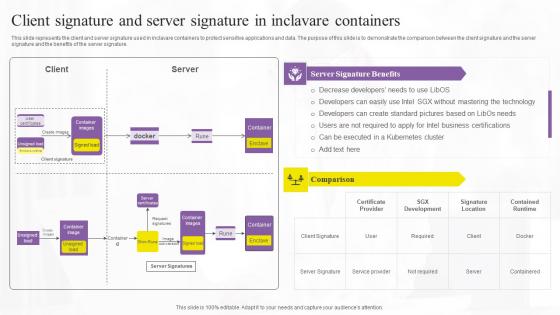
Client Signature And Server Signature In Confidential Computing Technologies Themes Pdf
This slide represents the client and server signature used in inclavare containers to protect sensitive applications and data. The purpose of this slide is to demonstrate the comparison between the client signature and the server signature and the benefits of the server signature. From laying roadmaps to briefing everything in detail, our templates are perfect for you. You can set the stage with your presentation slides. All you have to do is download these easy-to-edit and customizable templates. Client Signature And Server Signature In Confidential Computing Technologies Themes Pdf will help you deliver an outstanding performance that everyone would remember and praise you for. Do download this presentation today. This slide represents the client and server signature used in inclavare containers to protect sensitive applications and data. The purpose of this slide is to demonstrate the comparison between the client signature and the server signature and the benefits of the server signature.
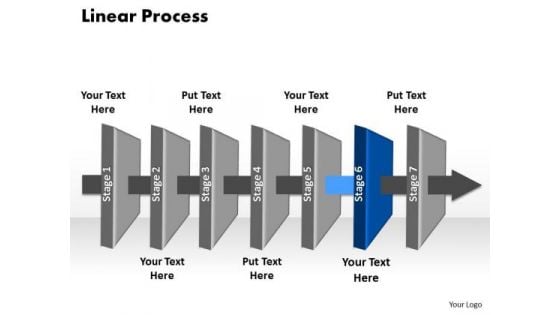
Ppt Ozone Layer PowerPoint Presentation 6 Social Linear Process Templates
PPT ozone layer PowerPoint presentation 6 social linear process Templates-Use this 3D PowerPoint Diagram to represent the Seven stages of Sequential Process. It portrays beeline, continuous, even, horizontal, in bee line, in straight line, linear , nonstop, not crooked, point-blank, right, shortest, straight, straightaway, though, true, unbroken etc.-PPT ozone layer PowerPoint presentation 6 social linear process Templates-abstract, achievement, adding, analyzing, arrow, art, background, blank, blue, business, chart, color, colorful, cycle, data, design, diagram, element, flow, graph, graphic, gray, green, icon, linear, management, market, numbers, percent, process, project, round, stock, success, up, value Experience the striking graphics of our Ppt Ozone Layer PowerPoint Presentation 6 Social Linear Process Templates. They bring good quality to the table.
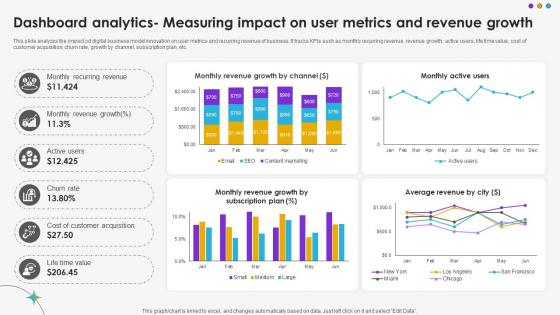
Dashboard Analytics Measuring Impact On User Metrics And Revenue Growth DT SS V
This slide analyzes the impact od digital business model innovation on user metrics and recurring revenue of business. It tracks KPIs such as monthly recurring revenue, revenue growth, active users, life time value, cost of customer acquisition, churn rate, growth by channel, subscription plan, etc.Are you searching for a Dashboard Analytics Measuring Impact On User Metrics And Revenue Growth DT SS V that is uncluttered, straightforward, and original Its easy to edit, and you can change the colors to suit your personal or business branding. For a presentation that expresses how much effort you have put in, this template is ideal With all of its features, including tables, diagrams, statistics, and lists, its perfect for a business plan presentation. Make your ideas more appealing with these professional slides. Download Dashboard Analytics Measuring Impact On User Metrics And Revenue Growth DT SS V from Slidegeeks today. This slide analyzes the impact od digital business model innovation on user metrics and recurring revenue of business. It tracks KPIs such as monthly recurring revenue, revenue growth, active users, life time value, cost of customer acquisition, churn rate, growth by channel, subscription plan, etc.
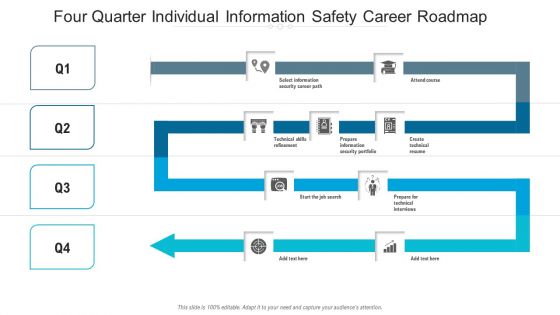
Four Quarter Individual Information Safety Career Roadmap Diagrams
We present our four quarter individual information safety career roadmap diagrams. This PowerPoint layout is easy to edit so you can change the font size, font type, color, and shape conveniently. In addition to this, the PowerPoint layout is Google Slides compatible, so you can share it with your audience and give them access to edit it. Therefore, download and save this well researched four quarter individual information safety career roadmap diagrams in different formats like PDF, PNG, and JPG to smoothly execute your business plan.
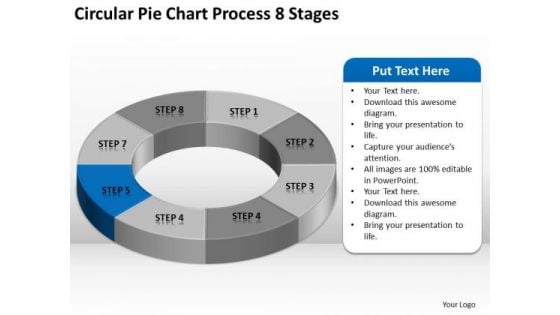
Circular Pie Chart Process 8 Stages Business Plan Executive Summary PowerPoint Templates
We present our circular pie chart process 8 stages business plan executive summary PowerPoint templates.Download and present our Marketing PowerPoint Templates because Our PowerPoint Templates and Slides will let you Hit the right notes. Watch your audience start singing to your tune. Use our Finance PowerPoint Templates because Our PowerPoint Templates and Slides are effectively colour coded to prioritise your plans They automatically highlight the sequence of events you desire. Download our Business PowerPoint Templates because you should Experience excellence with our PowerPoint Templates and Slides. They will take your breath away. Download our Circle Charts PowerPoint Templates because Our PowerPoint Templates and Slides ensures Effective communication. They help you put across your views with precision and clarity. Download our Shapes PowerPoint Templates because Our PowerPoint Templates and Slides are like the strings of a tennis racquet. Well strung to help you serve aces.Use these PowerPoint slides for presentations relating to Chart, Pie, Graph, Vector, 3d, Icon, Diagram, Progress, Business, Circular, Design, Information, Market, Opinion, Corporate, Sign, Symbol, Shadow, Percentage, Graphic, Finance, Data, Element, Drawing, Report, Marketing, Shape, Illustration, Earnings, Number, Strategy, Money, Dimensional, Survey, Growth, Colorful, Global, Account, Part, Investment, Statistic, Financial. The prominent colors used in the PowerPoint template are Blue, Gray, White. Steal the affection of your audience. Our Circular Pie Chart Process 8 Stages Business Plan Executive Summary PowerPoint Templates will abet you in the crime.
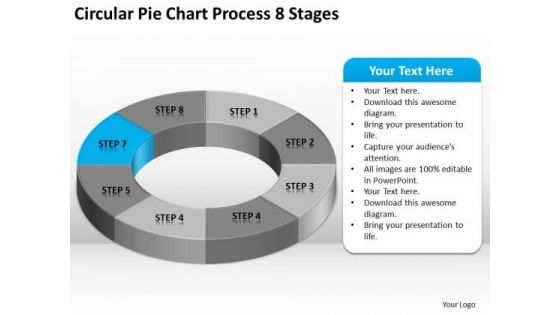
Circular Pie Chart Process 8 Stages Business Plan Template PowerPoint Templates
We present our circular pie chart process 8 stages business plan template PowerPoint templates.Present our Marketing PowerPoint Templates because It will Give impetus to the hopes of your colleagues. Our PowerPoint Templates and Slides will aid you in winning their trust. Use our Finance PowerPoint Templates because You can Connect the dots. Fan expectations as the whole picture emerges. Use our Business PowerPoint Templates because Watching this your Audience will Grab their eyeballs, they wont even blink. Use our Circle Charts PowerPoint Templates because Our PowerPoint Templates and Slides are created with admirable insight. Use them and give your group a sense of your logical mind. Download and present our Shapes PowerPoint Templates because Our PowerPoint Templates and Slides have the Brilliant backdrops. Guaranteed to illuminate the minds of your audience.Use these PowerPoint slides for presentations relating to Chart, Pie, Graph, Vector, 3d, Icon, Diagram, Progress, Business, Circular, Design, Information, Market, Opinion, Corporate, Sign, Symbol, Shadow, Percentage, Graphic, Finance, Data, Element, Drawing, Report, Marketing, Shape, Illustration, Earnings, Number, Strategy, Money, Dimensional, Survey, Growth, Colorful, Global, Account, Part, Investment, Statistic, Financial. The prominent colors used in the PowerPoint template are Blue light, Gray, White. Battle it out with our Circular Pie Chart Process 8 Stages Business Plan Template PowerPoint Templates. You will come out on top.
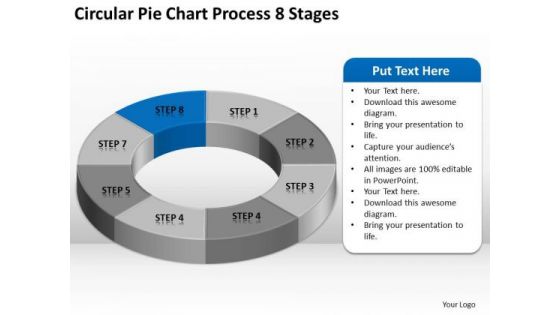
Circular Pie Chart Process 8 Stages Ppt Business Plan Financials PowerPoint Slides
We present our circular pie chart process 8 stages ppt business plan financials PowerPoint Slides.Present our Marketing PowerPoint Templates because Our PowerPoint Templates and Slides come in all colours, shades and hues. They help highlight every nuance of your views. Use our Finance PowerPoint Templates because you should Experience excellence with our PowerPoint Templates and Slides. They will take your breath away. Present our Business PowerPoint Templates because You can Create a matrix with our PowerPoint Templates and Slides. Feel the strength of your ideas click into place. Download our Circle Charts PowerPoint Templates because Our PowerPoint Templates and Slides team portray an attitude of elegance. Personify this quality by using them regularly. Present our Shapes PowerPoint Templates because It is Aesthetically crafted by artistic young minds. Our PowerPoint Templates and Slides are designed to display your dexterity.Use these PowerPoint slides for presentations relating to Chart, Pie, Graph, Vector, 3d, Icon, Diagram, Progress, Business, Circular, Design, Information, Market, Opinion, Corporate, Sign, Symbol, Shadow, Percentage, Graphic, Finance, Data, Element, Drawing, Report, Marketing, Shape, Illustration, Earnings, Number, Strategy, Money, Dimensional, Survey, Growth, Colorful, Global, Account, Part, Investment, Statistic, Financial. The prominent colors used in the PowerPoint template are Blue, Gray, White. Our Circular Pie Chart Process 8 Stages Ppt Business Plan Financials PowerPoint Slides compare to a classic dessert. Your audience will have their cake and eat it too.
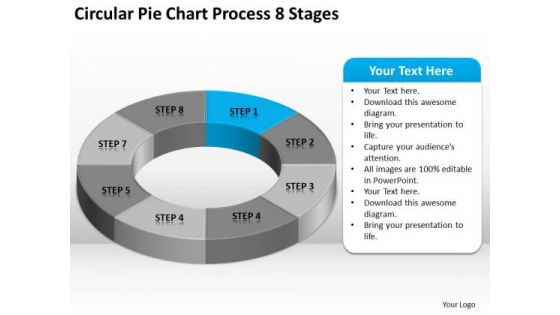
Circular Pie Chart Process 8 Stages Sample Nonprofit Business Plan PowerPoint Slides
We present our circular pie chart process 8 stages sample nonprofit business plan PowerPoint Slides.Download and present our Marketing PowerPoint Templates because You can Channelise the thoughts of your team with our PowerPoint Templates and Slides. Urge them to focus on the goals you have set. Use our Finance PowerPoint Templates because It can Bubble and burst with your ideas. Use our Business PowerPoint Templates because Our PowerPoint Templates and Slides will let you Hit the target. Go the full distance with ease and elan. Download and present our Circle Charts PowerPoint Templates because Our PowerPoint Templates and Slides will let your words and thoughts hit bullseye everytime. Use our Shapes PowerPoint Templates because Our PowerPoint Templates and Slides are focused like a searchlight beam. They highlight your ideas for your target audience.Use these PowerPoint slides for presentations relating to Chart, Pie, Graph, Vector, 3d, Icon, Diagram, Progress, Business, Circular, Design, Information, Market, Opinion, Corporate, Sign, Symbol, Shadow, Percentage, Graphic, Finance, Data, Element, Drawing, Report, Marketing, Shape, Illustration, Earnings, Number, Strategy, Money, Dimensional, Survey, Growth, Colorful, Global, Account, Part, Investment, Statistic, Financial. The prominent colors used in the PowerPoint template are Blue light, Gray, White. Give an exhaustive account with our Circular Pie Chart Process 8 Stages Sample Nonprofit Business Plan PowerPoint Slides. Your thoughts will illuminate every little detail.
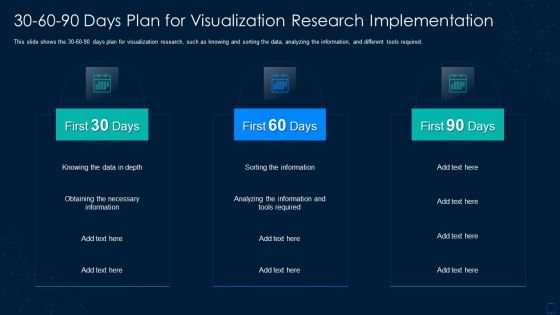
Graphical Representation Of Research IT 30 60 90 Days Plan For Visualization Diagrams PDF
This slide shows the 30 60 90 days plan for visualization research, such as knowing and sorting the data, analyzing the information, and different tools required. This is a graphical representation of research it 30 60 90 days plan for visualization diagrams pdf template with various stages. Focus and dispense information on three stages using this creative set, that comes with editable features. It contains large content boxes to add your information on topics like information, required, analyzing. You can also showcase facts, figures, and other relevant content using this PPT layout. Grab it now.
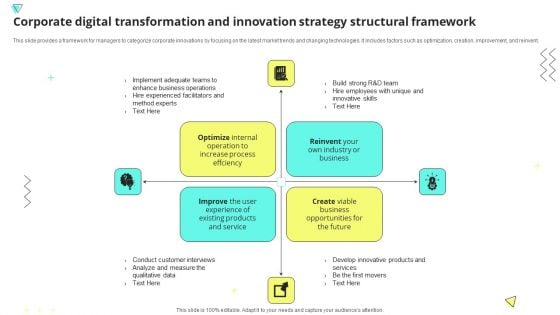
Corporate Digital Transformation And Innovation Strategy Structural Framework Professional PDF
This slide provides a framework for managers to categorize corporate innovations by focusing on the latest market trends and changing technologies. It includes factors such as optimization, creation, improvement, and reinvent. Persuade your audience using this Corporate Digital Transformation And Innovation Strategy Structural Framework Professional PDF. This PPT design covers four stages, thus making it a great tool to use. It also caters to a variety of topics including Conduct customer interviews, Analyze, qualitative data. Download this PPT design now to present a convincing pitch that not only emphasizes the topic but also showcases your presentation skills.
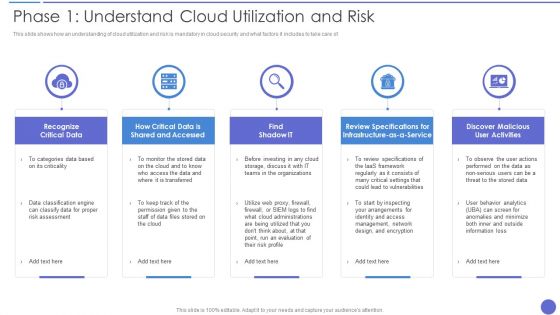
Phase 1 Understand Cloud Utilization And Risk Topics PDF
This slide shows how an understanding of cloud utilization and risk is mandatory in cloud security and what factors it includes to take care of. This is a Phase 1 Understand Cloud Utilization And Risk Topics PDF template with various stages. Focus and dispense information on five stages using this creative set, that comes with editable features. It contains large content boxes to add your information on topics like Recognize Critical Data, Risk Assessment, Management. You can also showcase facts, figures, and other relevant content using this PPT layout. Grab it now.
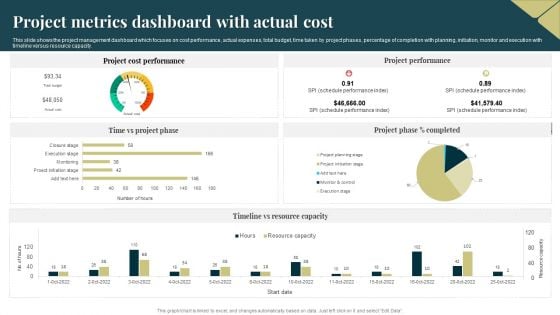
Project Metrics Dashboard With Actual Cost Background PDF
This slide shows the project management dashboard which focuses on cost performance, actual expenses, total budget, time taken by project phases, percentage of completion with planning, initiation, monitor and execution with timeline versus resource capacity. Showcasing this set of slides titled Project Metrics Dashboard With Actual Cost Background PDF. The topics addressed in these templates are Project Cost Performance, Project Performance, Resource Capacity. All the content presented in this PPT design is completely editable. Download it and make adjustments in color, background, font etc. as per your unique business setting.
Rebranding Project Progress Tracking Dashboard Strategies For Rebranding Without Losing Template PDF
This slide provides information regarding essential characteristics of co branding in terms of strategic partnership, build credibility, developing marketing strategy, develop innovation and value addition, etc. If your project calls for a presentation, then Slidegeeks is your go-to partner because we have professionally designed, easy-to-edit templates that are perfect for any presentation. After downloading, you can easily edit Rebranding Project Progress Tracking Dashboard Strategies For Rebranding Without Losing Template PDF and make the changes accordingly. You can rearrange slides or fill them with different images. Check out all the handy templates
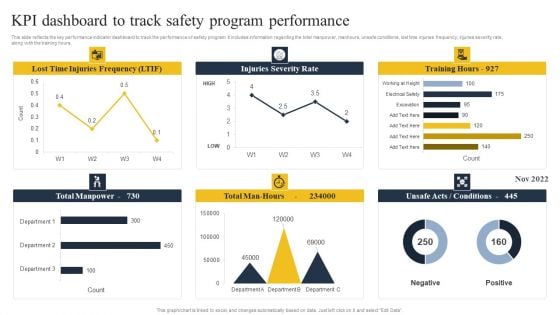
Security Control Techniques For Real Estate Project KPI Dashboard To Track Safety Program Performance Brochure PDF
This slide reflects the key performance indicator dashboard to track the performance of safety program. It includes information regarding the total manpower, manhours, unsafe conditions, lost time injuries frequency, injuries severity rate, along with the training hours. Create an editable Security Control Techniques For Real Estate Project KPI Dashboard To Track Safety Program Performance Brochure PDF that communicates your idea and engages your audience. Whether youre presenting a business or an educational presentation, pre-designed presentation templates help save time. Security Control Techniques For Real Estate Project KPI Dashboard To Track Safety Program Performance Brochure PDF is highly customizable and very easy to edit, covering many different styles from creative to business presentations. Slidegeeks has creative team members who have crafted amazing templates. So, go and get them without any delay.
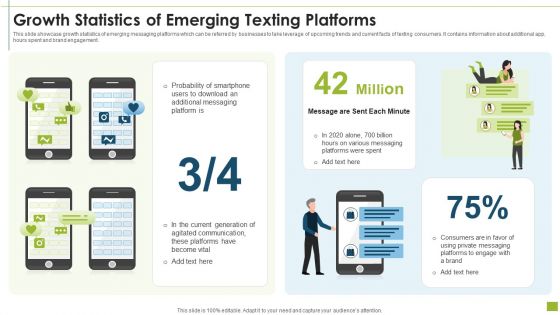
Growth Statistics Of Emerging Texting Platforms Pictures PDF
This slide showcase growth statistics of emerging messaging platforms which can be referred by businesses to take leverage of upcoming trends and current facts of texting consumers. It contains information about additional app, hours spent and brand engagement.Presenting growth statistics of emerging texting platforms pictures pdf to dispense important information. This template comprises one stage. It also presents valuable insights into the topics including probability of smartphone, platforms were spent, agitated communication This is a completely customizable PowerPoint theme that can be put to use immediately. So, download it and address the topic impactfully.
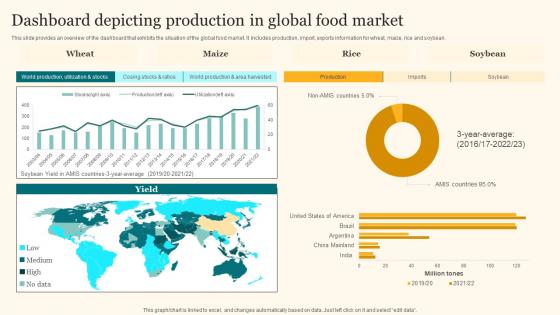
Dashboard Depicting Production In Global Agricultural Product Promotion Template Pdf
This slide provides an overview of the dashboard that exhibits the situation of the global food market. It includes production, import, exports information for wheat, maize, rice and soybean. Are you in need of a template that can accommodate all of your creative concepts This one is crafted professionally and can be altered to fit any style. Use it with Google Slides or PowerPoint. Include striking photographs, symbols, depictions, and other visuals. Fill, move around, or remove text boxes as desired. Test out color palettes and font mixtures. Edit and save your work, or work with colleagues. Download Dashboard Depicting Production In Global Agricultural Product Promotion Template Pdf and observe how to make your presentation outstanding. Give an impeccable presentation to your group and make your presentation unforgettable. This slide provides an overview of the dashboard that exhibits the situation of the global food market. It includes production, import, exports information for wheat, maize, rice and soybean.
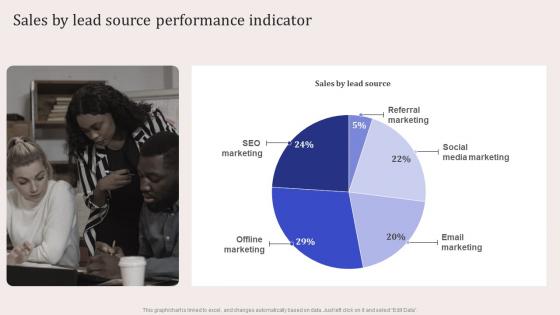
Sales By Lead Source Performance Indicator Virtual Event Promotion To Capture Infographics Pdf
The Sales By Lead Source Performance Indicator Virtual Event Promotion To Capture Infographics Pdf is a compilation of the most recent design trends as a series of slides. It is suitable for any subject or industry presentation, containing attractive visuals and photo spots for businesses to clearly express their messages. This template contains a variety of slides for the user to input data, such as structures to contrast two elements, bullet points, and slides for written information. Slidegeeks is prepared to create an impression. Our Sales By Lead Source Performance Indicator Virtual Event Promotion To Capture Infographics Pdf are topically designed to provide an attractive backdrop to any subject. Use them to look like a presentation pro.
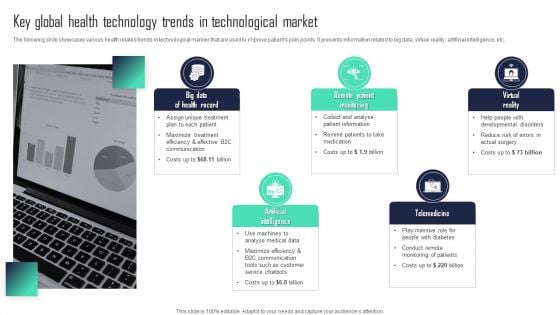
Key Global Health Technology Trends In Technological Market Infographics PDF
The following slide showcases various health related trends in technological manner that are used to improve patients pain points. It presents information related to big data, virtual reality, artificial intelligence, etc. Presenting Key Global Health Technology Trends In Technological Market Infographics PDF to dispense important information. This template comprises five stages. It also presents valuable insights into the topics including Remote Patient Monitoring, Artificial Intelligence, Telemedicine. This is a completely customizable PowerPoint theme that can be put to use immediately. So, download it and address the topic impactfully.
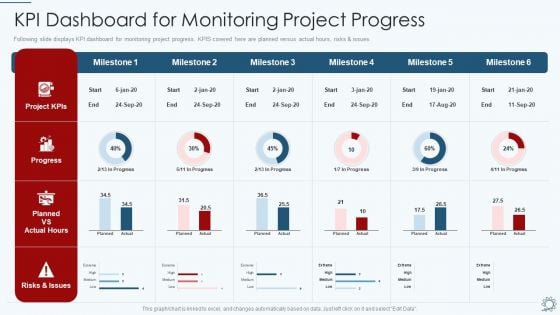
Development And Operations Pipeline IT KPI Dashboard For Monitoring Project Progress Ideas PDF
Following slide displays KPI dashboard for monitoring project progress. KPIS covered here are planned versus actual hours, risks and issues. Deliver and pitch your topic in the best possible manner with this development and operations pipeline it kpi dashboard for monitoring project progress ideas pdf. Use them to share invaluable insights on project kpis, progress, planned vs actual hours, risks and issues and impress your audience. This template can be altered and modified as per your expectations. So, grab it now.
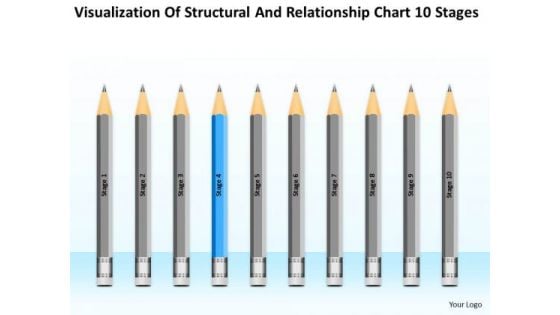
Structural And Relationship Chart 10 Stages Ppt Business Plan Steps PowerPoint Templates
We present our structural and relationship chart 10 stages ppt business plan steps PowerPoint templates.Use our Education PowerPoint Templates because You can Double your output with our PowerPoint Templates and Slides. They make beating deadlines a piece of cake. Download and present our Process and Flows PowerPoint Templates because Our PowerPoint Templates and Slides are created by a hardworking bunch of busybees. Always flitting around with solutions gauranteed to please. Present our Arrows PowerPoint Templates because Our PowerPoint Templates and Slides are the chords of your song. String them along and provide the lilt to your views. Present our Business PowerPoint Templates because Our PowerPoint Templates and Slides are aesthetically designed to attract attention. We gaurantee that they will grab all the eyeballs you need. Use our Shapes PowerPoint Templates because Our PowerPoint Templates and Slides ensures Effective communication. They help you put across your views with precision and clarity.Use these PowerPoint slides for presentations relating to Mark, corporate, business, plan, concept, bright, symbol, diagram, crayon, stack, graphic, finance, stock,analysis, drawing, paint, calculation, accounting, creative, economic, creativity, chart, forecast, design, color, objects, stationary, pencil, education,profit, information, background, investment, figures, ten, business, business process. The prominent colors used in the PowerPoint template are Blue, Gray, Black. Boil it down with our Structural And Relationship Chart 10 Stages Ppt Business Plan Steps PowerPoint Templates. You will come out on top.
Industrial Robots Performance Tracking Dashboard Industrial Robots Designs Pdf
This slide shows the dashboard to keep a regular track of the performance of industrial robots. The purpose of this slide is to provide a graphical representation of robots performance to enhance the accuracy and effectiveness of these machines. Slidegeeks has constructed Industrial Robots Performance Tracking Dashboard Industrial Robots Designs Pdf after conducting extensive research and examination. These presentation templates are constantly being generated and modified based on user preferences and critiques from editors. Here, you will find the most attractive templates for a range of purposes while taking into account ratings and remarks from users regarding the content. This is an excellent jumping-off point to explore our content and will give new users an insight into our top-notch PowerPoint Templates. This slide shows the dashboard to keep a regular track of the performance of industrial robots. The purpose of this slide is to provide a graphical representation of robots performance to enhance the accuracy and effectiveness of these machines.
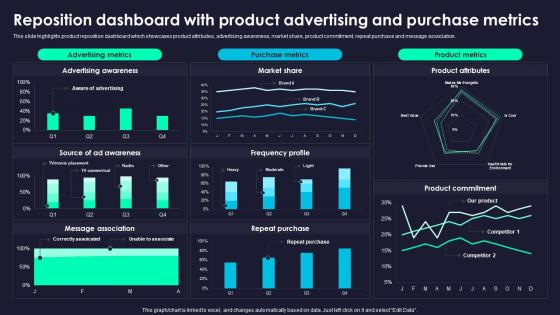
Reposition Dashboard Rebranding Marketing Strategies For Effective Clipart Pdf
This slide highlights product reposition dashboard which showcases product attributes, advertising awareness, market share, product commitment, repeat purchase and message association. Slidegeeks has constructed Reposition Dashboard Rebranding Marketing Strategies For Effective Clipart Pdf after conducting extensive research and examination. These presentation templates are constantly being generated and modified based on user preferences and critiques from editors. Here, you will find the most attractive templates for a range of purposes while taking into account ratings and remarks from users regarding the content. This is an excellent jumping off point to explore our content and will give new users an insight into our top notch PowerPoint Templates. This slide highlights product reposition dashboard which showcases product attributes, advertising awareness, market share, product commitment, repeat purchase and message association.
Performance Tracking Dashboard For Food Product And Beverage Business
The slide showcases dashboard representing food and beverage business performance tracking tool , which assist to evaluate monthly performance of employees, customer retention etc. Slidegeeks has constructed Performance Tracking Dashboard For Food Product And Beverage Business after conducting extensive research and examination. These presentation templates are constantly being generated and modified based on user preferences and critiques from editors. Here, you will find the most attractive templates for a range of purposes while taking into account ratings and remarks from users regarding the content. This is an excellent jumping-off point to explore our content and will give new users an insight into our top-notch PowerPoint Templates. The slide showcases dashboard representing food and beverage business performance tracking tool , which assist to evaluate monthly performance of employees, customer retention etc.
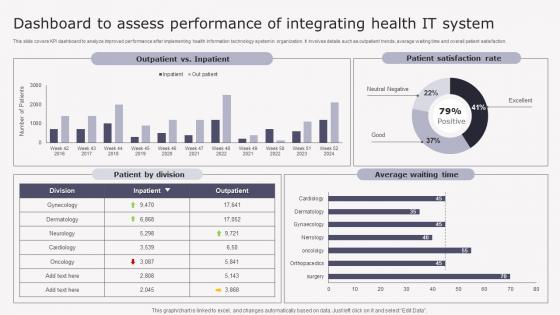
Transforming Medicare Services Using Health Dashboard To Assess Performance Introduction Pdf
This slide covers KPI dashboard to analyze improved performance after implementing health information technology system in organization. It involves details such as outpatient trends, average waiting time and overall patient satisfaction. Do you have to make sure that everyone on your team knows about any specific topic I yes, then you should give Transforming Medicare Services Using Health Dashboard To Assess Performance Introduction Pdf a try. Our experts have put a lot of knowledge and effort into creating this impeccable Transforming Medicare Services Using Health Dashboard To Assess Performance Introduction Pdf. You can use this template for your upcoming presentations, as the slides are perfect to represent even the tiniest detail. You can download these templates from the Slidegeeks website and these are easy to edit. So grab these today This slide covers KPI dashboard to analyze improved performance after implementing health information technology system in organization. It involves details such as outpatient trends, average waiting time and overall patient satisfaction.
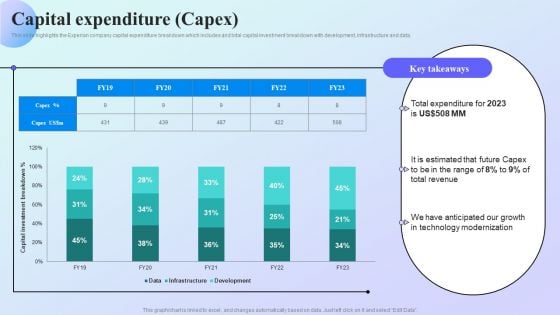
Information Analytics Company Outline Capital Expenditure Capex Information PDF
This slide highlights the Experian company capital expenditure breakdown which includes and total capital investment breakdown with development, infrastructure and data. Are you in need of a template that can accommodate all of your creative concepts This one is crafted professionally and can be altered to fit any style. Use it with Google Slides or PowerPoint. Include striking photographs, symbols, depictions, and other visuals. Fill, move around, or remove text boxes as desired. Test out color palettes and font mixtures. Edit and save your work, or work with colleagues. Download Information Analytics Company Outline Capital Expenditure Capex Information PDF and observe how to make your presentation outstanding. Give an impeccable presentation to your group and make your presentation unforgettable.
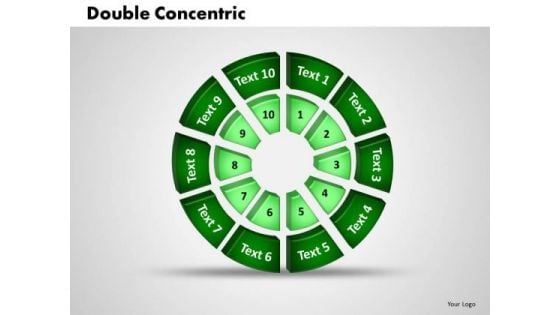
Business Leadership PowerPoint Templates Business 3d Double Concentric Rings Piece Ppt Slides
Business Leadership PowerPoint Templates Business 3d double concentric rings piece PPT Slides-Use this diagram to explain the contribution of each of the elements and how they provide impetus to the next phase. Highlight any anticipated problems, shortfalls or weak areas-Business Leadership PowerPoint Templates Business 3d double concentric rings pieces PPT Slides-This ppt can be used for concepts relating to-3d, Abstract, Account, Achievement, Analyst, Annual, Background, Blue, Business, Capital, Chart, Circular, Conceptual, Data, Design, Diagram, Document, Earnings, Economic, Finance Etc. Present pioneering technologies with our Business Leadership PowerPoint Templates Business 3d Double Concentric Rings Piece Ppt Slides. They will make you look good.
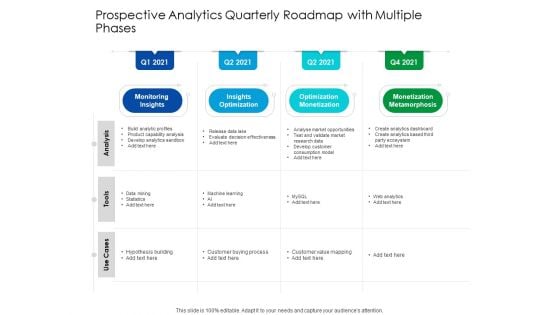
Predictive Analytics Quarterly Roadmap With Multiple Phases Topics
Presenting the predictive analytics quarterly roadmap with multiple phases topics. The template includes a roadmap that can be used to initiate a strategic plan. Not only this, the PowerPoint slideshow is completely editable and you can effortlessly modify the font size, font type, and shapes according to your needs. This PPT slide can be easily reached in standard screen and widescreen aspect ratios. The set is also available in various formats like PDF, PNG, and JPG. So download and use it multiple times as per your knowledge.
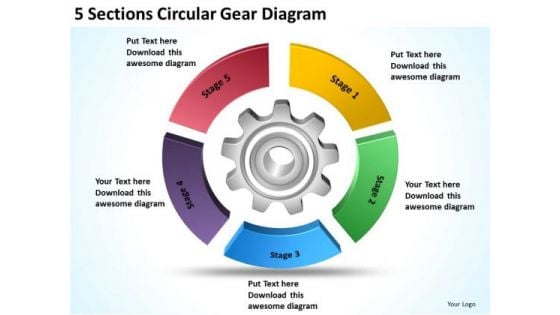
Circular Gear Diagram Example Of Executive Summary For Business Plan PowerPoint Slides
We present our circular gear diagram example of executive summary for business plan PowerPoint Slides.Use our Circle Charts PowerPoint Templates because You have gained great respect for your brilliant ideas. Use our PowerPoint Templates and Slides to strengthen and enhance your reputation. Use our Process and Flows PowerPoint Templates because It will get your audience in sync. Download and present our Business PowerPoint Templates because It will mark the footprints of your journey. Illustrate how they will lead you to your desired destination. Use our Shapes PowerPoint Templates because It will Strengthen your hand with your thoughts. They have all the aces you need to win the day. Present our Marketing PowerPoint Templates because You are working at that stage with an air of royalty. Let our PowerPoint Templates and Slides be the jewels in your crown.Use these PowerPoint slides for presentations relating to Business, plan, process, operation, organization, circle, market, corporate, future, concept, render, unity, success,diagram, graphic, element, analysis, goal, marketing, idea, gear, abstract, mind, management, connection, chart, strategy, solutions, training, direction, design, conference, link, competition, organize, attitude, financial, action, product. The prominent colors used in the PowerPoint template are Yellow, Purple, Green. Realign your team with our Circular Gear Diagram Example Of Executive Summary For Business Plan PowerPoint Slides. Download without worries with our money back guaranteee.
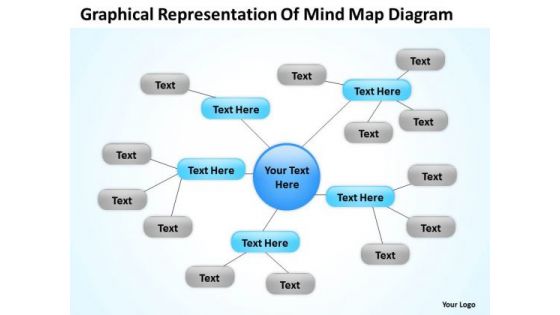
Graphical Representation Of Mind Map Diagram Ppt Business Plan PowerPoint Slides
We present our graphical representation of mind map diagram ppt business plan PowerPoint Slides.Download our Business PowerPoint Templates because Our PowerPoint Templates and Slides will let you Hit the target. Go the full distance with ease and elan. Present our Process and Flows PowerPoint Templates because Our PowerPoint Templates and Slides will embellish your thoughts. See them provide the desired motivation to your team. Download and present our Shapes PowerPoint Templates because You can Score a slam dunk with our PowerPoint Templates and Slides. Watch your audience hang onto your every word. Use our Marketing PowerPoint Templates because You should Bet on your luck with our PowerPoint Templates and Slides. Be assured that you will hit the jackpot. Download our Flow Charts PowerPoint Templates because Our PowerPoint Templates and Slides are conceived by a dedicated team. Use them and give form to your wondrous ideas.Use these PowerPoint slides for presentations relating to 3d,process, chart, organization, vision, market, enhance, target, formula, corporate, future, business, plan, success, mindmap, analysis, marketing, relation, idea, solutions, training, guidelines, direction, design,employee, conference, brainstorming, successful, conceptual, financial, action, product, tactic. The prominent colors used in the PowerPoint template are Blue, Gray, Blue light. Our Graphical Representation Of Mind Map Diagram Ppt Business Plan PowerPoint Slides will extend a hand. They provide all the assistance you desire.
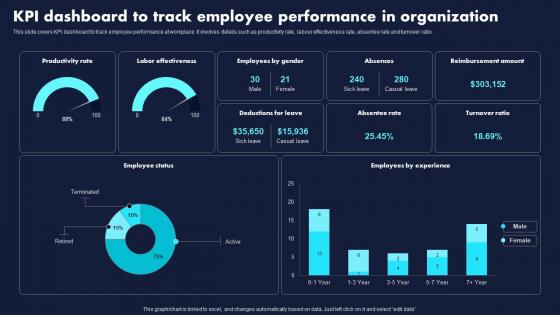
KPI Dashboard To Track Employee Performance Proven Techniques For Enhancing Formats Pdf
This slide covers KPI dashboard to track employee performance at workplace. It involves details such as productivity rate, labour effectiveness rate, absentee rate and turnover ratio.Whether you have daily or monthly meetings, a brilliant presentation is necessary. KPI Dashboard To Track Employee Performance Proven Techniques For Enhancing Formats Pdf can be your best option for delivering a presentation. Represent everything in detail using KPI Dashboard To Track Employee Performance Proven Techniques For Enhancing Formats Pdf and make yourself stand out in meetings. The template is versatile and follows a structure that will cater to your requirements. All the templates prepared by Slidegeeks are easy to download and edit. Our research experts have taken care of the corporate themes as well. So, give it a try and see the results. This slide covers KPI dashboard to track employee performance at workplace. It involves details such as productivity rate, labour effectiveness rate, absentee rate and turnover ratio.
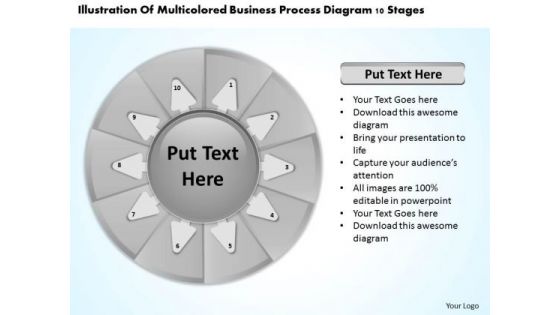
Presentation Process Diagram 10 Stages Ppt How Write Business Plan PowerPoint Templates
We present our presentation process diagram 10 stages ppt how write business plan PowerPoint templates.Download and present our Circle Charts PowerPoint Templates because you should Experience excellence with our PowerPoint Templates and Slides. They will take your breath away. Download and present our Business PowerPoint Templates because You can Inspire your team with our PowerPoint Templates and Slides. Let the force of your ideas flow into their minds. Use our Shapes PowerPoint Templates because Our PowerPoint Templates and Slides are created with admirable insight. Use them and give your group a sense of your logical mind. Download our Success PowerPoint Templates because Our PowerPoint Templates and Slides will let your team Walk through your plans. See their energy levels rise as you show them the way. Present our Process and Flows PowerPoint Templates because You will get more than you ever bargained for. Use these PowerPoint slides for presentations relating to process, closeup, model, white, consultant, concept, arrow, scope, presentation, finger, arm, diagram, analyst, analysis, drawing, female, management, expectation, diamond, time, project, money, girl, close up, direction, woman, group, person, quality, pointing, education, virtual, manager, explanation, screen, hand. The prominent colors used in the PowerPoint template are Gray, Black, White. Be the expert you truly are. Use our Presentation Process Diagram 10 Stages Ppt How Write Business Plan PowerPoint Templates to affirm your erudition.
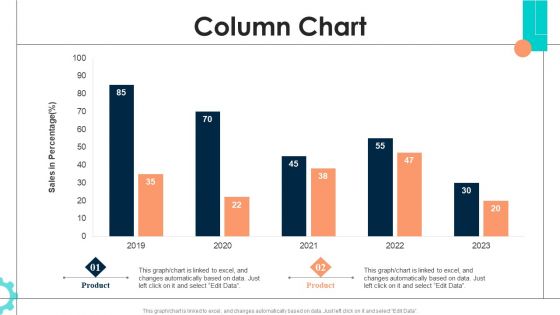
Intelligent Manufacturing Column Chart Ppt PowerPoint Presentation File Example File PDF
The Intelligent Manufacturing Column Chart Ppt PowerPoint Presentation File Example File PDF is a compilation of the most recent design trends as a series of slides. It is suitable for any subject or industry presentation, containing attractive visuals and photo spots for businesses to clearly express their messages. This template contains a variety of slides for the user to input data, such as structures to contrast two elements, bullet points, and slides for written information. Slidegeeks is prepared to create an impression.
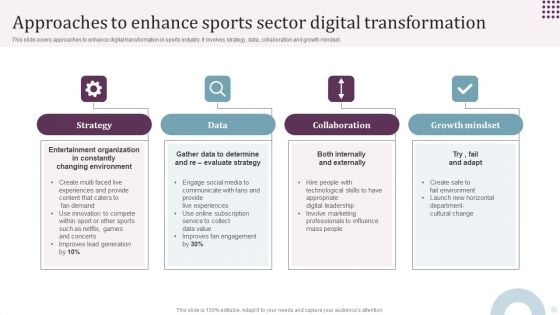
Approaches To Enhance Sports Sector Digital Transformation Ppt PowerPoint Presentation Portfolio Graphic Tips PDF
This slide covers approaches to enhance digital transformation in sports industry. It involves strategy, data, collaboration and growth mindset. Presenting Approaches To Enhance Sports Sector Digital Transformation Ppt PowerPoint Presentation Portfolio Graphic Tips PDF to dispense important information. This template comprises four stages. It also presents valuable insights into the topics including Strategy, Collaboration, Growth Mindset. This is a completely customizable PowerPoint theme that can be put to use immediately. So, download it and address the topic impactfully.
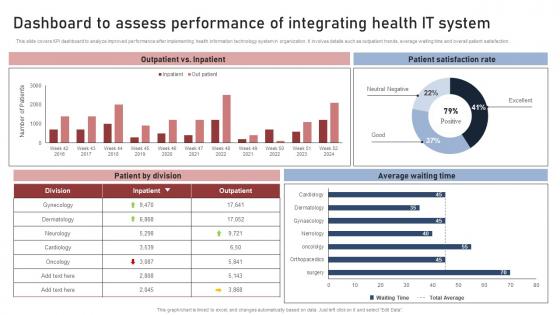
Dashboard To Assess Performance Transforming Medical Workflows Via His Integration Elements Pdf
This slide covers KPI dashboard to analyze improved performance after implementing health information technology system in organization. It involves details such as outpatient trends, average waiting time and overall patient satisfaction. Present like a pro with Dashboard To Assess Performance Transforming Medical Workflows Via His Integration Elements Pdf Create beautiful presentations together with your team, using our easy to use presentation slides. Share your ideas in real time and make changes on the fly by downloading our templates. So whether you are in the office, on the go, or in a remote location, you can stay in sync with your team and present your ideas with confidence. With Slidegeeks presentation got a whole lot easier. Grab these presentations today. This slide covers KPI dashboard to analyze improved performance after implementing health information technology system in organization. It involves details such as outpatient trends, average waiting time and overall patient satisfaction.
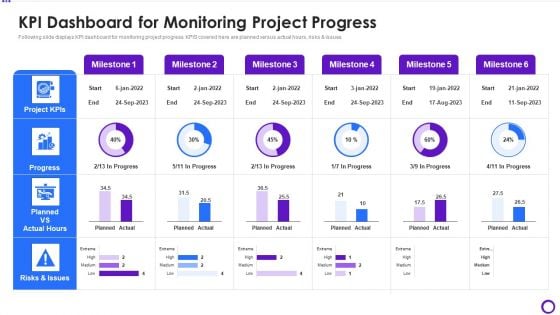
KPI Dashboard For Monitoring Project Progress Ppt Layouts Design Inspiration PDF
Following slide displays KPI dashboard for monitoring project progress. KPIS covered here are planned versus actual hours, risks and issues.Deliver and pitch your topic in the best possible manner with this kpi dashboard for monitoring project progress ppt layouts design inspiration pdf Use them to share invaluable insights on serverless computing, become a standard, hybrid cloud and impress your audience. This template can be altered and modified as per your expectations. So, grab it now.
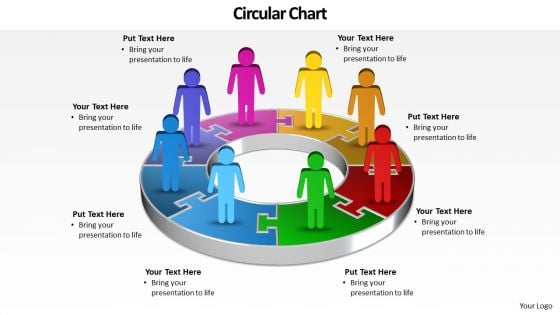
Ppt A Team Of Business People Standing On Pie Org Chart PowerPoint 2007 Pieces Templates
PPT a team of business people standing on pie org chart PowerPoint 2007 pieces Templates-Use this PowerPoint Diagram which shows the group of people on the Circular Puzzle to demonstrate the steps. It elaborates eight concepts. It is a powerful tool conceived to enable you to define your message in your Marketing PPT presentations. An excellent graphic to attract the attention of your audience to improve earnings. You can apply other 3D Styles and shapes to the slide to enhance your presentations.-PPT a team of business people standing on pie org chart PowerPoint 2007 pieces Templates-3d, analysis, brainstorming, business, chart, circle, circular, concept, conference, curving, cycle, design, financial, flow, flowchart, formula, future, goal, graphic, idea, management, market, marketing, movement, organization, presentation, process, product, solve, success, symbol, target, text, training, trends Dont make your presetations long and boring. Make them to the point with our Ppt A Team Of Business People Standing On Pie Org Chart PowerPoint 2007 Pieces Templates. You will be at the top of your game.
Dashboard For Tracking Sales By Various Sales Techniques For Achieving Summary Pdf
This slide covers the KPI dashboard for tracking sales by different categories such as product, region, channel, inventory outstanding, sales growth, actual and target sales, etc. Whether you have daily or monthly meetings, a brilliant presentation is necessary. Dashboard For Tracking Sales By Various Sales Techniques For Achieving Summary Pdf can be your best option for delivering a presentation. Represent everything in detail usingDashboard For Tracking Sales By Various Sales Techniques For Achieving Summary Pdf and make yourself stand out in meetings. The template is versatile and follows a structure that will cater to your requirements. All the templates prepared by Slidegeeks are easy to download and edit. Our research experts have taken care of the corporate themes as well. So, give it a try and see the results. This slide covers the KPI dashboard for tracking sales by different categories such as product, region, channel, inventory outstanding, sales growth, actual and target sales, etc.
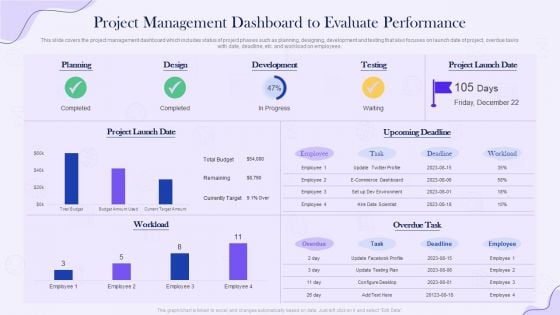
Project Time Management Execution Strategies Project Management Dashboard To Evaluate Performance Template PDF
This slide covers the project management dashboard which includes status of project phases such as planning, designing, development and testing that also focuses on launch date of project, overdue tasks with date, deadline, etc. and workload on employees. Coming up with a presentation necessitates that the majority of the effort goes into the content and the message you intend to convey. The visuals of a PowerPoint presentation can only be effective if it supplements and supports the story that is being told. Keeping this in mind our experts created Project Time Management Execution Strategies Project Management Dashboard To Evaluate Performance Template PDF to reduce the time that goes into designing the presentation. This way, you can concentrate on the message while our designers take care of providing you with the right template for the situation.
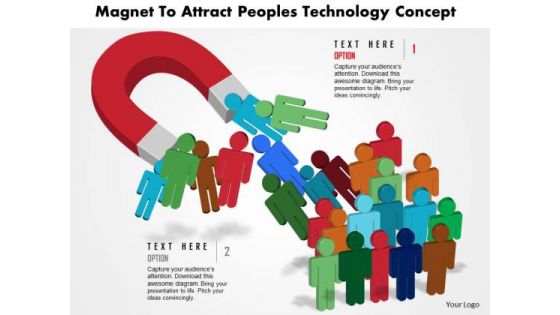
Business Daigram Magnet To Attarct Peoples Technology Concept Presentation Templets
This business slide is designed with magnet and people icons. Download this image containing magnet attracting people to illustrate magnetic technologies. Grab the attention of your listeners using this diagram
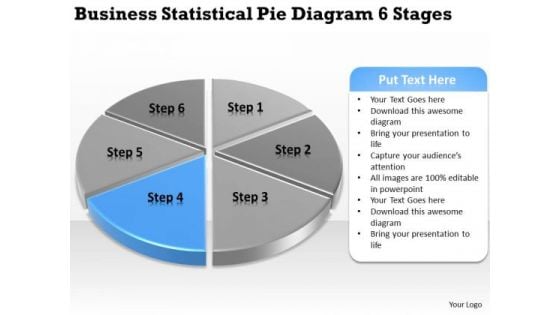
Statistical Pie Diagram 6 Stages Simple Business Plan Templates PowerPoint Slides
We present our statistical pie diagram 6 stages simple business plan templates PowerPoint Slides.Use our Circle Charts PowerPoint Templates because Our PowerPoint Templates and Slides has conjured up a web of all you need with the help of our great team. Use them to string together your glistening ideas. Download our Process and Flows PowerPoint Templates because Our PowerPoint Templates and Slides will bullet point your ideas. See them fall into place one by one. Use our Business PowerPoint Templates because It can be used to Set your controls for the heart of the sun. Our PowerPoint Templates and Slides will be the propellant to get you there. Download and present our Shapes PowerPoint Templates because Our PowerPoint Templates and Slides will provide weight to your words. They will bring out the depth of your thought process. Use our Marketing PowerPoint Templates because Our PowerPoint Templates and Slides have the Brilliant backdrops. Guaranteed to illuminate the minds of your audience.Use these PowerPoint slides for presentations relating to Pie, chart, business, market, presentation, symbol, element, bank, marketing, illustration, organization, movement,sheet, background, financial, isolated, slice, display, perspective, corporate, six, concept, diagram, circle, graphic, finance, data, report, abstract,management, graph, modern, icon, company, control, information, environment, banking. The prominent colors used in the PowerPoint template are Blue, Gray, White. Be a creative problem-solver with our Statistical Pie Diagram 6 Stages Simple Business Plan Templates PowerPoint Slides. They will make you look good.
Project Management Tracking Dashboard To Review Decision Download PDF
The below slide depicts the key performing indicators in project decision making. It includes elements such as overall status, progress, progress, time, cost and work volume. Pitch your topic with ease and precision using this Project Management Tracking Dashboard To Review Decision Download PDF. This layout presents information on Progress, Activity Status, Overall Status. It is also available for immediate download and adjustment. So, changes can be made in the color, design, graphics or any other component to create a unique layout.
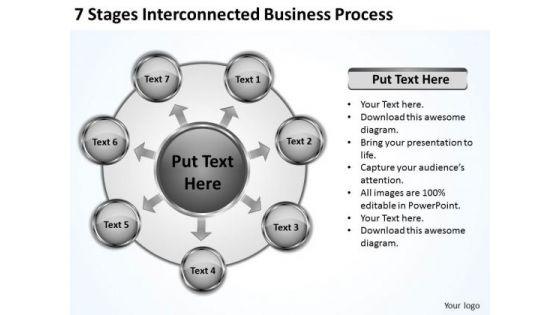
Business Strategy Consulting 7 Stages Interconnected Process Ppt PowerPoint
We present our business strategy consulting 7 stages interconnected process ppt Powerpoint.Download and present our Marketing PowerPoint Templates because You can Inspire your team with our PowerPoint Templates and Slides. Let the force of your ideas flow into their minds. Use our Business PowerPoint Templates because Your success is our commitment. Our PowerPoint Templates and Slides will ensure you reach your goal. Use our Arrows PowerPoint Templates because Our PowerPoint Templates and Slides will Activate the energies of your audience. Get their creative juices flowing with your words. Download our Circle Charts PowerPoint Templates because You can Be the star of the show with our PowerPoint Templates and Slides. Rock the stage with your ideas. Present our Shapes PowerPoint Templates because Our PowerPoint Templates and Slides will let you Illuminate the road ahead to Pinpoint the important landmarks along the way.Use these PowerPoint slides for presentations relating to 3d, Analysis, Brainstorming, Business, Chart, Circle, Circular, Classroom, Concept, Conference, Curving, Cycle, Design, Diagram, Direction, Element, Financial, Flow, Flowchart, Formula, Future, Goal, Graphic, Idea, Management, Market, Marketing, Mind, Mind Map, Motion, Movement, Organization, Organize, Plan, Presentation, Process, Product, Questions, Render, Solutions, Solve, Strategy, Success, Symbol, Target. The prominent colors used in the PowerPoint template are White, Gray, Black. You have fathereda great idea. Baptise it with our Business Strategy Consulting 7 Stages Interconnected Process Ppt PowerPoint.
Facebook Marketing Plan Dashboard For Tracking Facebook Post Performance Strategy SS V
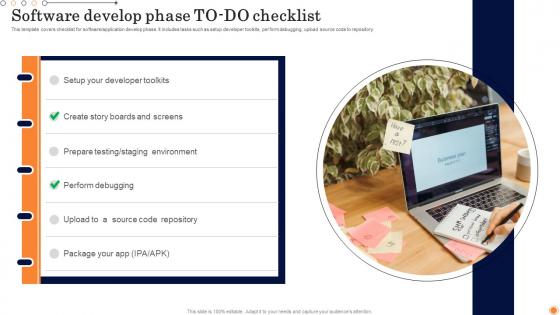
Software Develop Phase To Do Checklist Design And Develop Customized Software Guides Themes Pdf
This template covers checklist for software application develop phase. It includes tasks such as setup developer toolkits, perform debugging, upload source code to repository. Here you can discover an assortment of the finest PowerPoint and Google Slides templates. With these templates, you can create presentations for a variety of purposes while simultaneously providing your audience with an eye catching visual experience. Download Software Develop Phase To Do Checklist Design And Develop Customized Software Guides Themes Pdf to deliver an impeccable presentation. These templates will make your job of preparing presentations much quicker, yet still, maintain a high level of quality. Slidegeeks has experienced researchers who prepare these templates and write high quality content for you. Later on, you can personalize the content by editing the Software Develop Phase To Do Checklist Design And Develop Customized Software Guides Themes Pdf. This template covers checklist for software application develop phase. It includes tasks such as setup developer toolkits, perform debugging, upload source code to repository.
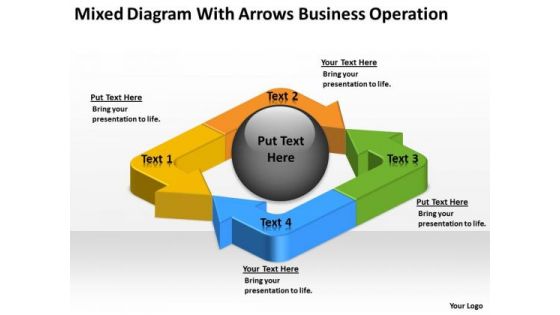
Arrows Business Operation Ppt Small Plan Template PowerPoint Slides
We present our arrows business operation ppt small plan template PowerPoint Slides.Download and present our Arrows PowerPoint Templates because You are working at that stage with an air of royalty. Let our PowerPoint Templates and Slides be the jewels in your crown. Present our Process and Flows PowerPoint Templates because You will get more than you ever bargained for. Present our Flow Charts PowerPoint Templates because Our PowerPoint Templates and Slides will let you Clearly mark the path for others to follow. Use our Business PowerPoint Templates because You have gained great respect for your brilliant ideas. Use our PowerPoint Templates and Slides to strengthen and enhance your reputation. Present our Shapes PowerPoint Templates because You aspire to touch the sky with glory. Let our PowerPoint Templates and Slides provide the fuel for your ascent.Use these PowerPoint slides for presentations relating to Corporate, tool, business, plan, study, concept, evaluation, success, presentation, symbol, stragety,graphic, finance, data, goal, report, publication, management, graph, icon, chart, system, objective, direction, projections, growth, operation, interpretation,organization, illustrate, competition, profit, detail, publish, financial, prediction, present, communicate, arrows. The prominent colors used in the PowerPoint template are Yellow, Green, Orange. Enhance your chances of asset creation. Diversify your base with our Arrows Business Operation Ppt Small Plan Template PowerPoint Slides.
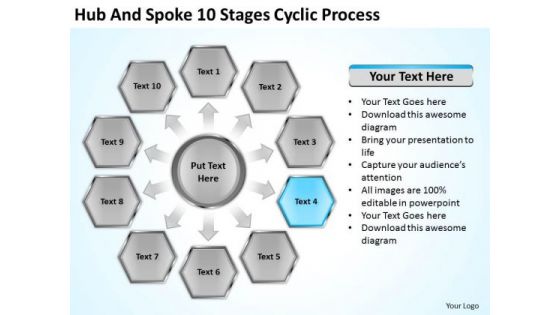
Hub And Spoke 10 Stages Cyclic Process Business Plan Examples PowerPoint Slides
We present our hub and spoke 10 stages cyclic process business plan examples PowerPoint Slides.Use our Arrows PowerPoint Templates because Our PowerPoint Templates and Slides will let Your superior ideas hit the target always and everytime. Use our Process and Flows PowerPoint Templates because Our PowerPoint Templates and Slides are conceived by a dedicated team. Use them and give form to your wondrous ideas. Download our Flow Charts PowerPoint Templates because They will Put your wonderful verbal artistry on display. Our PowerPoint Templates and Slides will provide you the necessary glam and glitter. Download and present our Business PowerPoint Templates because Our PowerPoint Templates and Slides will Embellish your thoughts. They will help you illustrate the brilliance of your ideas. Download our Marketing PowerPoint Templates because Our PowerPoint Templates and Slides will bullet point your ideas. See them fall into place one by one.Use these PowerPoint slides for presentations relating to Hub, diagram, chart, abstract,model, business,round, website, cross, concept, presentation, circle, brochure, guide,description, marketing, gray, development, management, wheel, illustration, ten, catalog, plans, reports, navigation, parts, circle,cooperation, scheme, analysis, technology, relation, idea, team, graph, molecule, illustration, pie, object, organize, connectivity, marketing, interact, structure, international, communication. The prominent colors used in the PowerPoint template are Blue light, White, Gray. Compile it on our Hub And Spoke 10 Stages Cyclic Process Business Plan Examples PowerPoint Slides. Give your thoughts exclusive exposure.
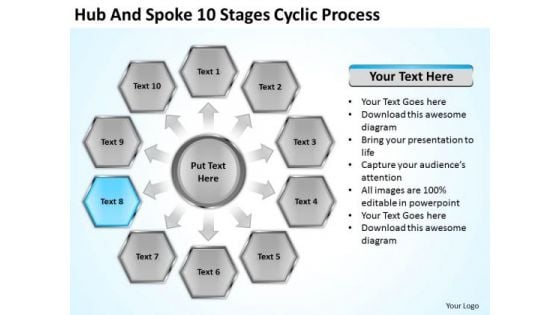
Hub And Spoke 10 Stages Cyclic Process Business Plan Format PowerPoint Slides
We present our hub and spoke 10 stages cyclic process business plan format PowerPoint Slides.Download and present our Flow Charts PowerPoint Templates because You can Double your output with our PowerPoint Templates and Slides. They make beating deadlines a piece of cake. Present our Arrows PowerPoint Templates because Our PowerPoint Templates and Slides will weave a web of your great ideas. They are gauranteed to attract even the most critical of your colleagues. Download and present our Business PowerPoint Templates because Our PowerPoint Templates and Slides are aesthetically designed to attract attention. We gaurantee that they will grab all the eyeballs you need. Download our Process and Flows PowerPoint Templates because you can Add colour to your speech with our PowerPoint Templates and Slides. Your presentation will leave your audience speechless. Download our Marketing PowerPoint Templates because You aspire to touch the sky with glory. Let our PowerPoint Templates and Slides provide the fuel for your ascent.Use these PowerPoint slides for presentations relating to Hub, diagram, chart, abstract,model, business,round, website, cross, concept, presentation, circle, brochure, guide,description, marketing, gray, development, management, wheel, illustration, ten, catalog, plans, reports, navigation, parts, circle,cooperation, scheme, analysis, technology, relation, idea, team, graph, molecule, illustration, pie, object, organize, connectivity, marketing, interact, structure, international, communication. The prominent colors used in the PowerPoint template are Blue light, Gray, White. Customers can be very fastidious. Cater to their every fancy with our Hub And Spoke 10 Stages Cyclic Process Business Plan Format PowerPoint Slides.
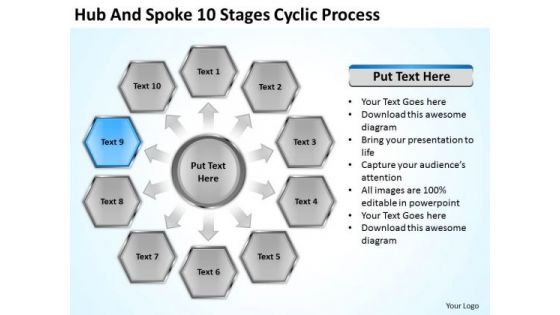
Hub And Spoke 10 Stages Cyclic Process Business Plan Forms PowerPoint Templates
We present our hub and spoke 10 stages cyclic process business plan forms PowerPoint templates.Present our Process and Flows PowerPoint Templates because It is Aesthetically crafted by artistic young minds. Our PowerPoint Templates and Slides are designed to display your dexterity. Present our Flow Charts PowerPoint Templates because Our PowerPoint Templates and Slides will let you Hit the right notes. Watch your audience start singing to your tune. Download our Arrows PowerPoint Templates because you should once Tap the ingenuity of our PowerPoint Templates and Slides. They are programmed to succeed. Use our Marketing PowerPoint Templates because It will mark the footprints of your journey. Illustrate how they will lead you to your desired destination. Download our Business PowerPoint Templates because Our PowerPoint Templates and Slides are the chords of your song. String them along and provide the lilt to your views.Use these PowerPoint slides for presentations relating to Hub, diagram, chart, abstract,model, business,round, website, cross, concept, presentation, circle, brochure, guide,description, marketing, gray, development, management, wheel, illustration, ten, catalog, plans, reports, navigation, parts, circle,cooperation, scheme, analysis, technology, relation, idea, team, graph, molecule, illustration, pie, object, organize, connectivity, marketing, interact, structure, international, communication. The prominent colors used in the PowerPoint template are White, Gray, Blue. Set up the base with our Hub And Spoke 10 Stages Cyclic Process Business Plan Forms PowerPoint Templates. You will soon celebrate success.
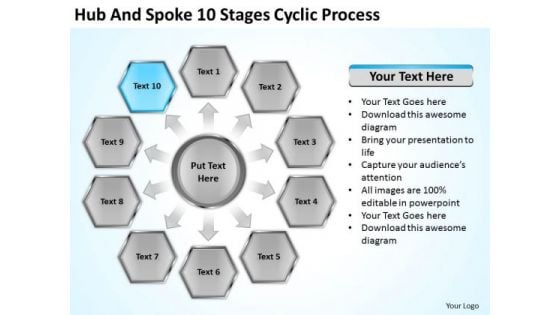
Hub And Spoke 10 Stages Cyclic Process Business Plan PowerPoint Slides
We present our hub and spoke 10 stages cyclic process business plan PowerPoint Slides.Use our Process and Flows PowerPoint Templates because our PowerPoint Templates and Slides will give your ideas the shape. Use our Arrows PowerPoint Templates because Our PowerPoint Templates and Slides will let you meet your Deadlines. Download and present our Business PowerPoint Templates because Our PowerPoint Templates and Slides come in all colours, shades and hues. They help highlight every nuance of your views. Download and present our Marketing PowerPoint Templates because You can Hit a home run with our PowerPoint Templates and Slides. See your ideas sail into the minds of your audience. Download and present our Flow Charts PowerPoint Templates because our PowerPoint Templates and Slides are the string of your bow. Fire of your ideas and conquer the podium.Use these PowerPoint slides for presentations relating to Hub, diagram, chart, abstract,model, business,round, website, cross, concept, presentation, circle, brochure, guide,description, marketing, gray, development, management, wheel, illustration, ten, catalog, reports, navigation, cooperation, scheme, analysis, technology, relation, idea, team, graph, molecule, illustration, pie, object, organize, connectivity, marketing, interact, structure, international, communication. The prominent colors used in the PowerPoint template are Blue light, Gray, White. Taste success with our Hub And Spoke 10 Stages Cyclic Process Business Plan PowerPoint Slides. You will come out on top.
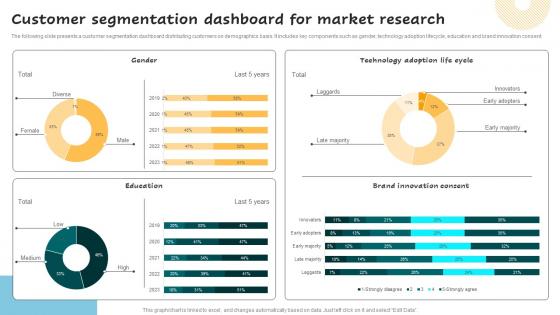
Customer Segmentation Dashboard Successful Guide For Market Segmentation Background Pdf
The following slide presents a customer segmentation dashboard distributing customers on demographics basis. It includes key components such as gender, technology adoption lifecycle, education and brand innovation consent. Do you have to make sure that everyone on your team knows about any specific topic I yes, then you should give Customer Segmentation Dashboard Successful Guide For Market Segmentation Background Pdf a try. Our experts have put a lot of knowledge and effort into creating this impeccable Customer Segmentation Dashboard Successful Guide For Market Segmentation Background Pdf. You can use this template for your upcoming presentations, as the slides are perfect to represent even the tiniest detail. You can download these templates from the Slidegeeks website and these are easy to edit. So grab these today. The following slide presents a customer segmentation dashboard distributing customers on demographics basis. It includes key components such as gender, technology adoption lifecycle, education and brand innovation consent.
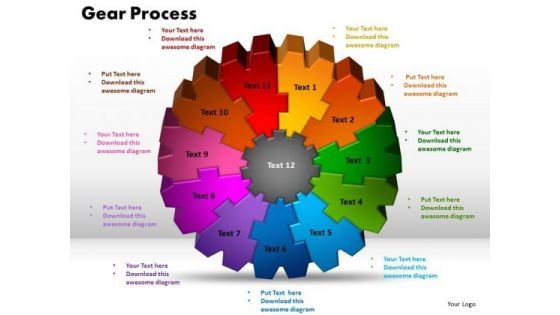
PowerPoint Design Gear Process Success Ppt Slide
PowerPoint Design Gear Process Success PPT Slide-If you need to create advanced, completely customizable diagrams for your data, Use this diagram with excellent graphics that help you convey your ideas successfully.-PowerPoint Design Gear Process Success PPT Slide Our PowerPoint Design Gear Process Success Ppt Slide adore facts and figures. Remove the fig leaves and expose it all.
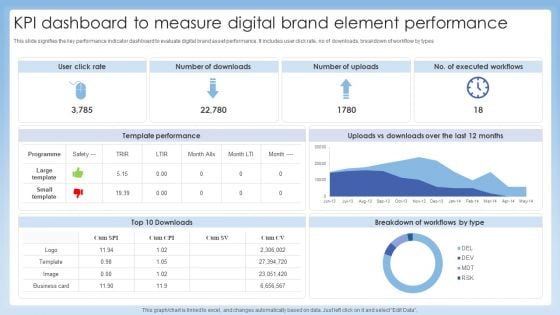
KPI Dashboard To Measure Digital Brand Element Performance Professional PDF
This slide signifies the key performance indicator dashboard to evaluate digital brand asset performance. It includes user click rate, no of downloads, breakdown of workflow by types. Showcasing this set of slides titled KPI Dashboard To Measure Digital Brand Element Performance Professional PDF. The topics addressed in these templates are Template Performance, Breakdown Workflows, Executed Workflows. All the content presented in this PPT design is completely editable. Download it and make adjustments in color, background, font etc. as per your unique business setting.
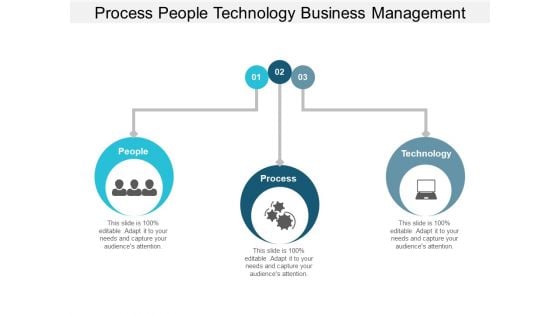
Process People Technology Business Management Ppt PowerPoint Presentation File Demonstration
This is a process people technology business management ppt powerpoint presentation file demonstration. This is a three stage process. The stages in this process are 3 successful organizational transformation elements icons, people process technology.
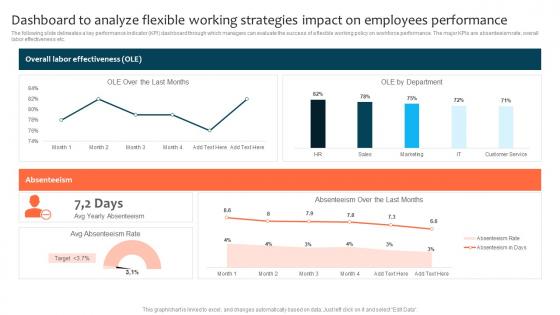
Dashboard To Analyze Flexible Working Strategies Impact Optimizing Staff Retention Rate Background Pdf
The following slide delineates a key performance indicator KPI dashboard through which managers can evaluate the success of a flexible working policy on workforce performance. The major KPIs are absenteeism rate, overall labor effectiveness etc. Slidegeeks has constructed Dashboard To Analyze Flexible Working Strategies Impact Optimizing Staff Retention Rate Background Pdf after conducting extensive research and examination. These presentation templates are constantly being generated and modified based on user preferences and critiques from editors. Here, you will find the most attractive templates for a range of purposes while taking into account ratings and remarks from users regarding the content. This is an excellent jumping-off point to explore our content and will give new users an insight into our top-notch PowerPoint Templates. The following slide delineates a key performance indicator KPI dashboard through which managers can evaluate the success of a flexible working policy on workforce performance. The major KPIs are absenteeism rate, overall labor effectiveness etc.
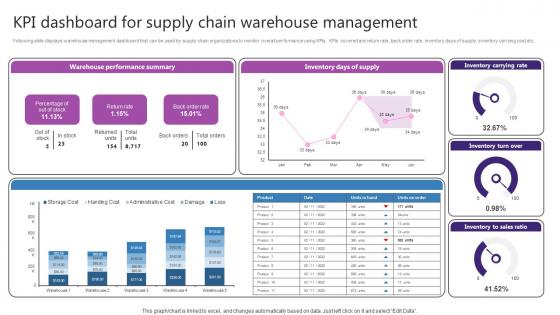
KPI Dashboard For Supply Chain Warehouse Strategic Plan For Enhancing Brochure Pdf
Following slide displays warehouse management dashboard that can be used by supply chain organizations to monitor overall performance using KPIs. KPIs covered are return rate, back order rate, inventory days of supply, inventory carrying cost etc. Slidegeeks has constructed KPI Dashboard For Supply Chain Warehouse Strategic Plan For Enhancing Brochure Pdf after conducting extensive research and examination. These presentation templates are constantly being generated and modified based on user preferences and critiques from editors. Here, you will find the most attractive templates for a range of purposes while taking into account ratings and remarks from users regarding the content. This is an excellent jumping-off point to explore our content and will give new users an insight into our top-notch PowerPoint Templates. Following slide displays warehouse management dashboard that can be used by supply chain organizations to monitor overall performance using KPIs. KPIs covered are return rate, back order rate, inventory days of supply, inventory carrying cost etc.
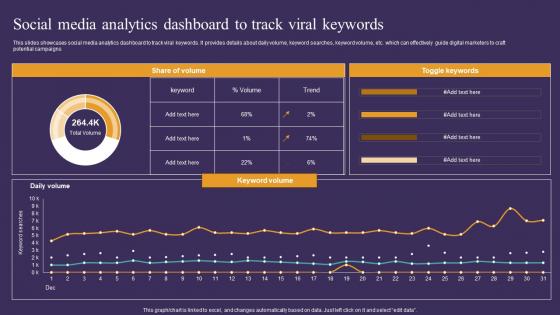
Strategic Guide To Attract Social Media Analytics Dashboard To Track Viral Inspiration Pdf
This slides showcases social media analytics dashboard to track viral keywords. It provides details about daily volume, keyword searches, keyword volume, etc. which can effectively guide digital marketers to craft potential campaigns. Slidegeeks has constructed Strategic Guide To Attract Social Media Analytics Dashboard To Track Viral Inspiration Pdf after conducting extensive research and examination. These presentation templates are constantly being generated and modified based on user preferences and critiques from editors. Here, you will find the most attractive templates for a range of purposes while taking into account ratings and remarks from users regarding the content. This is an excellent jumping-off point to explore our content and will give new users an insight into our top-notch PowerPoint Templates. This slides showcases social media analytics dashboard to track viral keywords. It provides details about daily volume, keyword searches, keyword volume, etc. which can effectively guide digital marketers to craft potential campaigns.
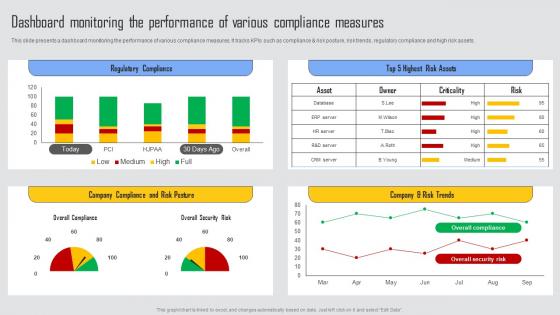
Dashboard Monitoring Performance Managing Risks And Establishing Trust Through Efficient Graphics Pdf
This slide presents a dashboard monitoring the performance of various compliance measures. It tracks KPIs such as compliance and risk posture, risk trends, regulatory compliance and high risk assets. Slidegeeks has constructed Dashboard Monitoring Performance Managing Risks And Establishing Trust Through Efficient Graphics Pdf after conducting extensive research and examination. These presentation templates are constantly being generated and modified based on user preferences and critiques from editors. Here, you will find the most attractive templates for a range of purposes while taking into account ratings and remarks from users regarding the content. This is an excellent jumping off point to explore our content and will give new users an insight into our top notch PowerPoint Templates. This slide presents a dashboard monitoring the performance of various compliance measures. It tracks KPIs such as compliance and risk posture, risk trends, regulatory compliance and high risk assets.
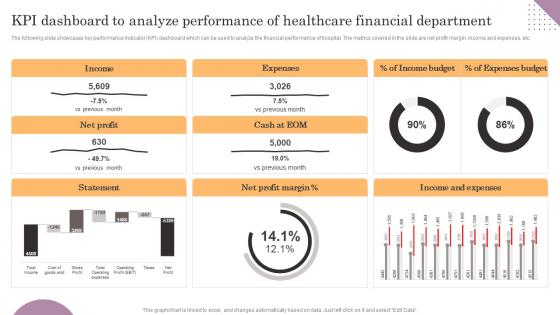
KPI Dashboard To Analyze Performance Of Healthcare General Management Introduction Pdf
The following slide showcases key performance indicator KPI dashboard which can be used to analyze the financial performance of hospital. The metrics covered in the slide are net profit margin, income and expenses, etc. Slidegeeks has constructed KPI Dashboard To Analyze Performance Of Healthcare General Management Introduction Pdf after conducting extensive research and examination. These presentation templates are constantly being generated and modified based on user preferences and critiques from editors. Here, you will find the most attractive templates for a range of purposes while taking into account ratings and remarks from users regarding the content. This is an excellent jumping-off point to explore our content and will give new users an insight into our top-notch PowerPoint Templates. The following slide showcases key performance indicator KPI dashboard which can be used to analyze the financial performance of hospital. The metrics covered in the slide are net profit margin, income and expenses, etc.
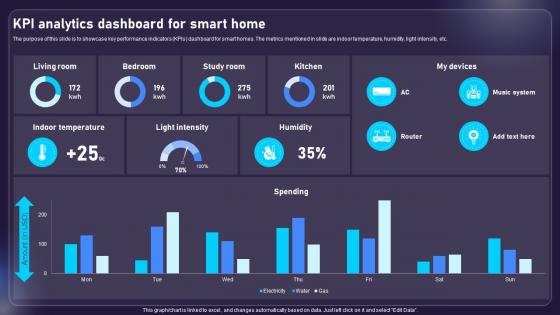
Kpi Analytics Dashboard For Smart Home AIOT Applications For Various Industries IoT SS V
The purpose of this slide is to showcase key performance indicators KPIs dashboard for smart homes. The metrics mentioned in slide are indoor temperature, humidity, light intensity, etc. Slidegeeks has constructed Kpi Analytics Dashboard For Smart Home AIOT Applications For Various Industries IoT SS V after conducting extensive research and examination. These presentation templates are constantly being generated and modified based on user preferences and critiques from editors. Here, you will find the most attractive templates for a range of purposes while taking into account ratings and remarks from users regarding the content. This is an excellent jumping-off point to explore our content and will give new users an insight into our top-notch PowerPoint Templates. The purpose of this slide is to showcase key performance indicators KPIs dashboard for smart homes. The metrics mentioned in slide are indoor temperature, humidity, light intensity, etc.
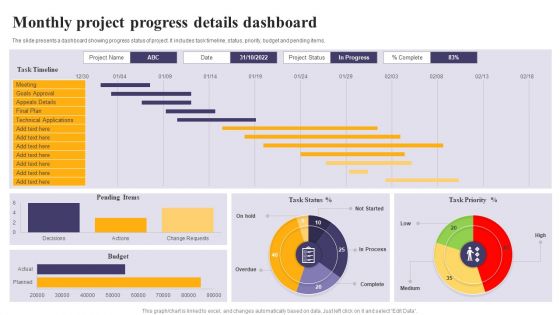
Monthly Project Progress Details Dashboard Ppt PowerPoint Presentation Gallery Clipart PDF
The slide presents a dashboard showing progress status of project. It includes task timeline, status, priority, budget and pending items. Showcasing this set of slides titled Monthly Project Progress Details Dashboard Ppt PowerPoint Presentation Gallery Clipart PDF. The topics addressed in these templates are Goals Approval, Technical Applications, Task Priority. All the content presented in this PPT design is completely editable. Download it and make adjustments in color, background, font etc. as per your unique business setting.
Dashboard For Tracking Referral Techniques For Generating Brand Awareness Sample Pdf
This slide covers the KPI dashboard for brands to evaluate the performance of referral marketing campaigns. It includes metrics such as referral participation rate, referred customers, referral conversion rate, total revenue generated, etc Whether you have daily or monthly meetings, a brilliant presentation is necessary. Dashboard For Tracking Referral Techniques For Generating Brand Awareness Sample Pdf can be your best option for delivering a presentation. Represent everything in detail using Dashboard For Tracking Referral Techniques For Generating Brand Awareness Sample Pdf and make yourself stand out in meetings. The template is versatile and follows a structure that will cater to your requirements. All the templates prepared by Slidegeeks are easy to download and edit. Our research experts have taken care of the corporate themes as well. So, give it a try and see the results. This slide covers the KPI dashboard for brands to evaluate the performance of referral marketing campaigns. It includes metrics such as referral participation rate, referred customers, referral conversion rate, total revenue generated, etc.
Energy Tracking Device Track And Monitor Baseline Ppt PowerPoint Presentation Slides Information PDF
Deliver an awe-inspiring pitch with this creative energy tracking device track and monitor baseline ppt powerpoint presentation slides information pdf bundle. Topics like measured data, baseline, control chart, production can be discussed with this completely editable template. It is available for immediate download depending on the needs and requirements of the user.
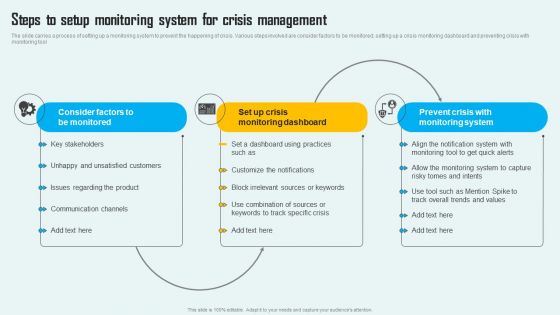
Key Phase Of Crisis Communication Management Plan Steps To Setup Monitoring System For Crisis Themes PDF
The slide carries a process of setting up a monitoring system to prevent the happening of crisis. Various steps involved are consider factors to be monitored, setting up a crisis monitoring dashboard and preventing crisis with monitoring tool The Key Phase Of Crisis Communication Management Plan Steps To Setup Monitoring System For Crisis Themes PDF is a compilation of the most recent design trends as a series of slides. It is suitable for any subject or industry presentation, containing attractive visuals and photo spots for businesses to clearly express their messages. This template contains a variety of slides for the user to input data, such as structures to contrast two elements, bullet points, and slides for written information. Slidegeeks is prepared to create an impression.
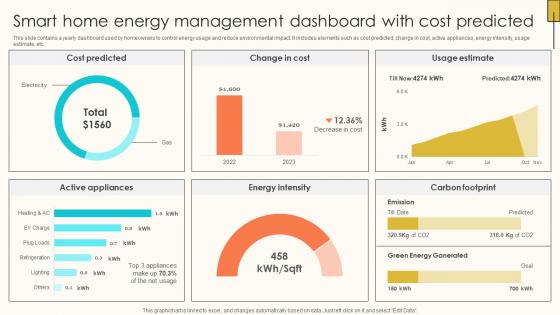
Smart Home Energy Management Dashboard Internet Of Things Solutions To Enhance Energy IoT SS V
This slide contains a yearly dashboard used by homeowners to control energy usage and reduce environmental impact. It includes elements such as cost predicted, change in cost, active appliances, energy intensity, usage estimate, etc. Explore a selection of the finest Smart Home Energy Management Dashboard Internet Of Things Solutions To Enhance Energy IoT SS V here. With a plethora of professionally designed and pre-made slide templates, you can quickly and easily find the right one for your upcoming presentation. You can use our Smart Home Energy Management Dashboard Internet Of Things Solutions To Enhance Energy IoT SS V to effectively convey your message to a wider audience. Slidegeeks has done a lot of research before preparing these presentation templates. The content can be personalized and the slides are highly editable. Grab templates today from Slidegeeks. This slide contains a yearly dashboard used by homeowners to control energy usage and reduce environmental impact. It includes elements such as cost predicted, change in cost, active appliances, energy intensity, usage estimate, etc.
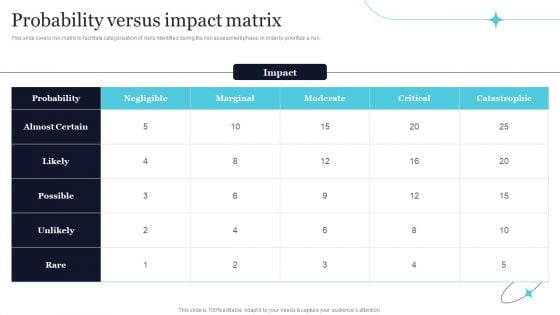
Quality Evaluation Probability Versus Impact Matrix Ideas PDF
This slide covers risk matrix to facilitate categorization of risks identified during the risk assessment phase. In order to prioritize a risk. The Quality Evaluation Probability Versus Impact Matrix Ideas PDF is a compilation of the most recent design trends as a series of slides. It is suitable for any subject or industry presentation, containing attractive visuals and photo spots for businesses to clearly express their messages. This template contains a variety of slides for the user to input data, such as structures to contrast two elements, bullet points, and slides for written information. Slidegeeks is prepared to create an impression.
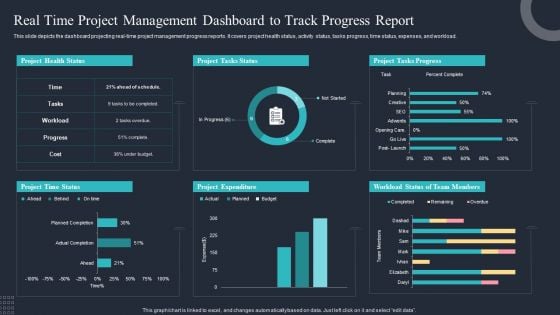
Real Time Project Management Dashboard To Track Progress Report Clipart PDF
This slide depicts the dashboard projecting real-time project management progress reports. It covers project health status, activity status, tasks progress, time status, expenses, and workload. Showcasing this set of slides titled Real Time Project Management Dashboard To Track Progress Report Clipart PDF. The topics addressed in these templates are Project Health Status, Project Tasks Status, Project Tasks Progress. All the content presented in this PPT design is completely editable. Download it and make adjustments in color, background, font etc. as per your unique business setting.
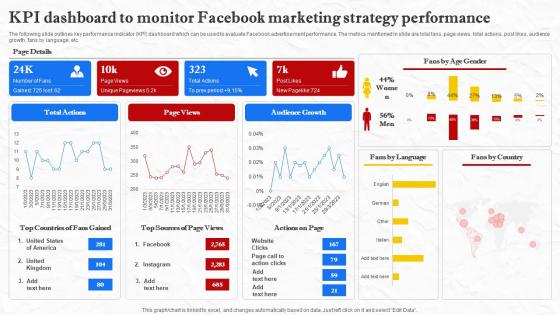
Facebook Marketing Techniques KPI Dashboard To Monitor Facebook Marketing Strategy SS V
The following slide outlines key performance indicator KPI dashboard which can be used to evaluate Facebook advertisement performance. The metrics mentioned in slide are total fans, page views, total actions, post likes, audience growth, fans by language, etc. Do you know about Slidesgeeks Facebook Marketing Techniques KPI Dashboard To Monitor Facebook Marketing Strategy SS V These are perfect for delivering any kind od presentation. Using it, create PowerPoint presentations that communicate your ideas and engage audiences. Save time and effort by using our pre-designed presentation templates that are perfect for a wide range of topic. Our vast selection of designs covers a range of styles, from creative to business, and are all highly customizable and easy to edit. Download as a PowerPoint template or use them as Google Slides themes. The following slide outlines key performance indicator KPI dashboard which can be used to evaluate Facebook advertisement performance. The metrics mentioned in slide are total fans, page views, total actions, post likes, audience growth, fans by language, etc.
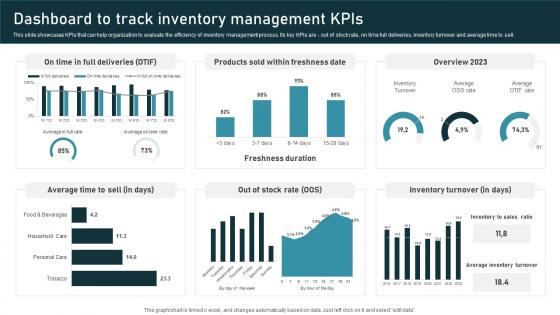
Dashboard To Track Inventory Administration Techniques For Enhanced Stock Accuracy Structure Pdf
This slide showcases KPIs that can help organization to evaluate the efficiency of inventory management process. Its key KPIs are out of stock rate, on time full deliveries, inventory turnover and average time to sell. Whether you have daily or monthly meetings, a brilliant presentation is necessary. Dashboard To Track Inventory Administration Techniques For Enhanced Stock Accuracy Structure Pdf can be your best option for delivering a presentation. Represent everything in detail using Dashboard To Track Inventory Administration Techniques For Enhanced Stock Accuracy Structure Pdf and make yourself stand out in meetings. The template is versatile and follows a structure that will cater to your requirements. All the templates prepared by Slidegeeks are easy to download and edit. Our research experts have taken care of the corporate themes as well. So, give it a try and see the results. This slide showcases KPIs that can help organization to evaluate the efficiency of inventory management process. Its key KPIs are out of stock rate, on time full deliveries, inventory turnover and average time to sell.
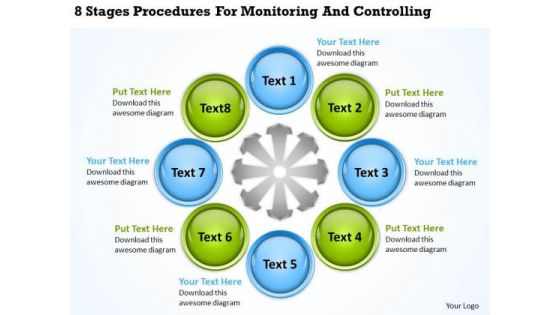
Business Charts 8 Stages Procedures For Monitoring And Controlling PowerPoint Slides
We present our business charts 8 stages procedures for monitoring and controlling PowerPoint Slides.Present our Circle Charts PowerPoint Templates because Our PowerPoint Templates and Slides will let your words and thoughts hit bullseye everytime. Present our Ring Charts PowerPoint Templates because Our PowerPoint Templates and Slides are created with admirable insight. Use them and give your group a sense of your logical mind. Use our Circle Charts PowerPoint Templates because It will get your audience in sync. Use our Process and Flows PowerPoint Templates because Our PowerPoint Templates and Slides will give you great value for your money. Be assured of finding the best projection to highlight your words. Download our Ring Charts PowerPoint Templates because Our PowerPoint Templates and Slides will let Your superior ideas hit the target always and everytime.Use these PowerPoint slides for presentations relating to Action, analysis, attitude, brainstorming, business, chart, classroom, concept,conceptual, conference, connection, corporate, design, diagram, direction,eight, employee, enhance, financial, formula, future, goal, graphic, guidelines,idea, link, management, market, marketing, mind, mindmap, organization,organize, plan, process, product, relation, render, solutions, strategy, success, successful, tactic, target, training, unity, vision. The prominent colors used in the PowerPoint template are Green lime, Blue, Gray. Our Business Charts 8 Stages Procedures For Monitoring And Controlling PowerPoint Slides capture the attention of your audience. With our money back guarantee you have nothing to lose.
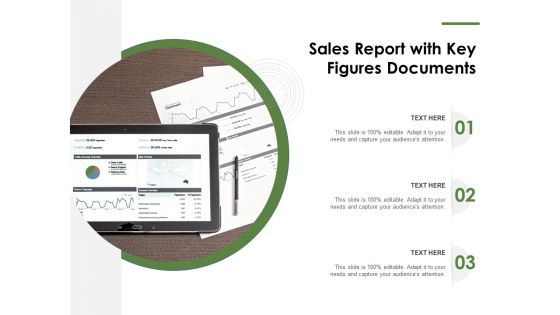
Sales Report With Key Figures Documents Ppt PowerPoint Presentation Portfolio Model PDF
Presenting sales report with key figures documents ppt powerpoint presentation portfolio model pdf to dispense important information. This template comprises three stages. It also presents valuable insights into the topics including sales report with key figures documents. This is a completely customizable PowerPoint theme that can be put to use immediately. So, download it and address the topic impactfully.
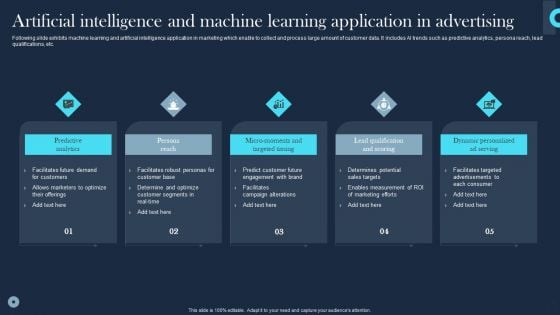
Artificial Intelligence And Machine Learning Application In Advertising Themes PDF
Following slide exhibits machine learning and artificial intelligence application in marketing which enable to collect and process large amount of customer data. It includes AI trends such as predictive analytics, persona reach, lead qualifications, etc. Presenting Artificial Intelligence And Machine Learning Application In Advertising Themes PDF to dispense important information. This template comprises three stages. It also presents valuable insights into the topics including Predictive Analytics, Persona Reach, Scoring. This is a completely customizable PowerPoint theme that can be put to use immediately. So, download it and address the topic impactfully.
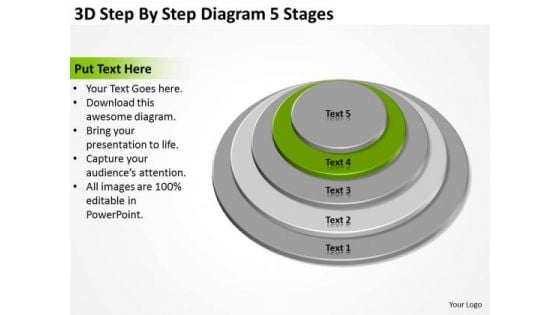
By Diagram 5 Stages How To Write Business Plan For PowerPoint Templates
We present our by diagram 5 stages how to write business plan for PowerPoint templates.Use our Process and Flows PowerPoint Templates because It will let you Set new benchmarks with our PowerPoint Templates and Slides. They will keep your prospects well above par. Download our Circle Charts PowerPoint Templates because Our PowerPoint Templates and Slides will Activate the energies of your audience. Get their creative juices flowing with your words. Present our Business PowerPoint Templates because our PowerPoint Templates and Slides are the string of your bow. Fire of your ideas and conquer the podium. Use our Flow Charts PowerPoint Templates because It will Raise the bar of your Thoughts. They are programmed to take you to the next level. Download our Shapes PowerPoint Templates because It will Strengthen your hand with your thoughts. They have all the aces you need to win the day.Use these PowerPoint slides for presentations relating to Chart, round, growth, pyramid, market, isolated, demographic, infochart, document, isometric, piechart, perspective, business, blank, concept, vector, sign,diagramchart, visual, presentation, glossy, symbol, template, diagram, circle, ring, graphic, finance, data, stock, element, report, abstract, graph, illustration, icon,economic, rating, web, infographic, design, text, organization, information, background, office, statistic, financial. The prominent colors used in the PowerPoint template are Green, White, Gray. Stand on your own feet with our By Diagram 5 Stages How To Write Business Plan For PowerPoint Templates. They will deliver all the assistance you need.
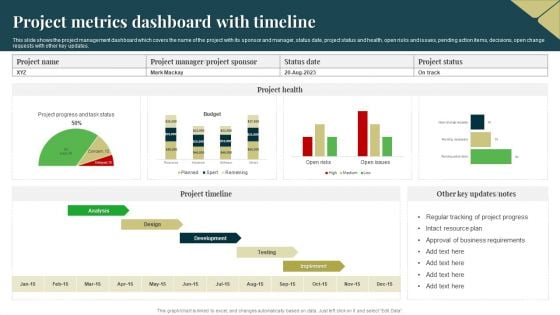
Project Metrics Dashboard With Timeline Themes PDF
This slide shows the project management dashboard which covers the name of the project with its sponsor and manager, status date, project status and health, open risks and issues, pending action items, decisions, open change requests with other key updates. Showcasing this set of slides titled Project Metrics Dashboard With Timeline Themes PDF. The topics addressed in these templates are Resource Plan, Business Requirements, Development. All the content presented in this PPT design is completely editable. Download it and make adjustments in color, background, font etc. as per your unique business setting.
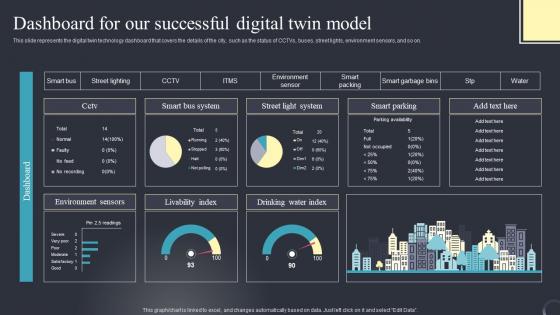
Dashboard For Our Successful Industrial Transformation Using Digital Twin Pictures Pdf
This slide represents the digital twin technology dashboard that covers the details of the city, such as the status of CCTVs, buses, street lights, environment sensors, and so on. Do you have an important presentation coming up Are you looking for something that will make your presentation stand out from the rest Look no further than Dashboard For Our Successful Industrial Transformation Using Digital Twin Pictures Pdf. With our professional designs, you can trust that your presentation will pop and make delivering it a smooth process. And with Slidegeeks, you can trust that your presentation will be unique and memorable. So why wait Grab Dashboard For Our Successful Industrial Transformation Using Digital Twin Pictures Pdf today and make your presentation stand out from the rest This slide represents the digital twin technology dashboard that covers the details of the city, such as the status of CCTVs, buses, street lights, environment sensors, and so on.
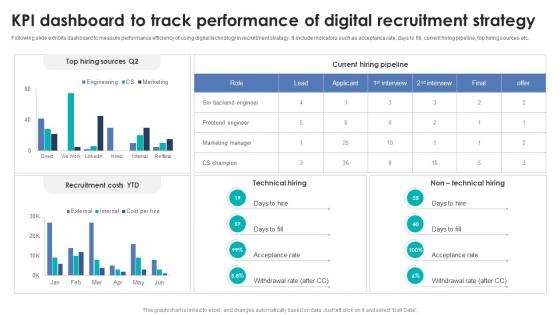
Integrating Automation For Effective Business Kpi Dashboard To Track Performance Of Digital
Following slide exhibits dashboard to measure performance efficiency of using digital technology in recruitment strategy. It include indicators such as acceptance rate, days to fill, current hiring pipeline, top hiring sources etc. Crafting an eye-catching presentation has never been more straightforward. Let your presentation shine with this tasteful yet straightforward Integrating Automation For Effective Business Kpi Dashboard To Track Performance Of Digital template. It offers a minimalistic and classy look that is great for making a statement. The colors have been employed intelligently to add a bit of playfulness while still remaining professional. Construct the ideal Integrating Automation For Effective Business Kpi Dashboard To Track Performance Of Digital that effortlessly grabs the attention of your audience Begin now and be certain to wow your customers Following slide exhibits dashboard to measure performance efficiency of using digital technology in recruitment strategy. It include indicators such as acceptance rate, days to fill, current hiring pipeline, top hiring sources etc.
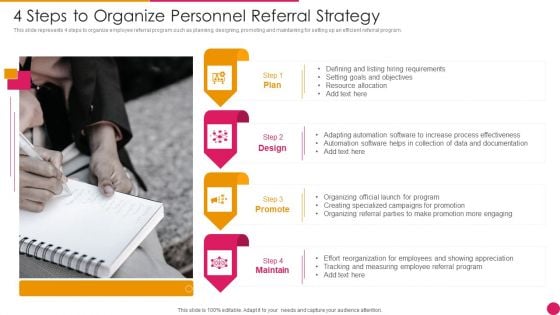
4 Steps To Organize Personnel Referral Strategy Themes PDF
This slide represents 4 steps to organize employee referral program such as planning, designing, promoting and maintaining for setting up an efficient referral program. Presenting 4 steps to organize personnel referral strategy themes pdf to dispense important information. This template comprises four stages. It also presents valuable insights into the topics including documentation, process, data. This is a completely customizable PowerPoint theme that can be put to use immediately. So, download it and address the topic impactfully.
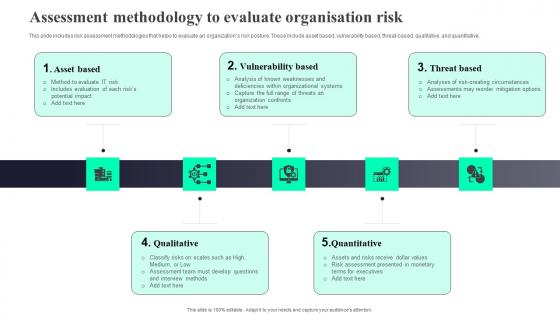
Assessment Methodology To Evaluate Organisation Risk Diagrams Pdf
This slide includes risk assessment methodologies that helps to evaluate an organizations risk posture. These include asset based, vulnerability based, threat-based, qualitative, and quantitative. Pitch your topic with ease and precision using this Assessment Methodology To Evaluate Organisation Risk Diagrams Pdf. This layout presents information on Asset Based, Vulnerability Based, Threat Based. It is also available for immediate download and adjustment. So, changes can be made in the color, design, graphics or any other component to create a unique layout. This slide includes risk assessment methodologies that helps to evaluate an organizations risk posture. These include asset based, vulnerability based, threat-based, qualitative, and quantitative.
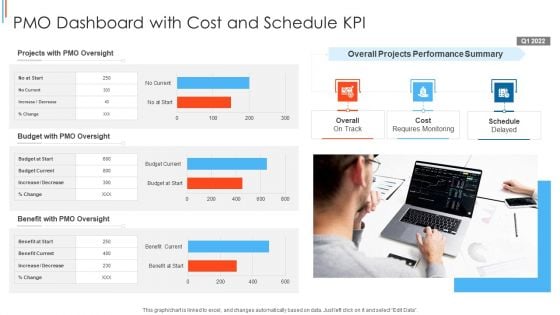
PMO Dashboard With Cost And Schedule KPI Template PDF
Showcasing this set of slides titled PMO Dashboard With Cost And Schedule KPI Themes PDF The topics addressed in these templates are Projects With Pmo Oversight, Budget With Pmo Oversight, Benefit With Pmo Oversight All the content presented in this PPT design is completely editable. Download it and make adjustments in color, background, font etc. as per your unique business setting.

Devops Project Incident Administration Dashboard Diagrams PDF
This slide depicts developer operations DevOps project incident management dashboard. It provides information about after hour, daytime, escalation policy, escalations made, etc. Showcasing this set of slides titled Devops Project Incident Administration Dashboard Diagrams PDF. The topics addressed in these templates are Devops Project Incident, Administration Dashboard. All the content presented in this PPT design is completely editable. Download it and make adjustments in color, background, font etc. as per your unique business setting.
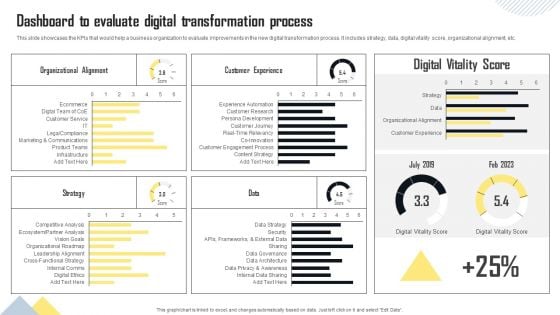
Dashboard To Evaluate Digital Transformation Process Graphics PDF
This slide showcases the KPIs that would help a business organization to evaluate improvements in the new digital transformation process. It includes strategy, data, digital vitality score, organizational alignment, etc. Here you can discover an assortment of the finest PowerPoint and Google Slides templates. With these templates, you can create presentations for a variety of purposes while simultaneously providing your audience with an eye catching visual experience. Download Dashboard To Evaluate Digital Transformation Process Graphics PDF to deliver an impeccable presentation. These templates will make your job of preparing presentations much quicker, yet still, maintain a high level of quality. Slidegeeks has experienced researchers who prepare these templates and write high quality content for you. Later on, you can personalize the content by editing the Dashboard To Evaluate Digital Transformation Process Graphics PDF.
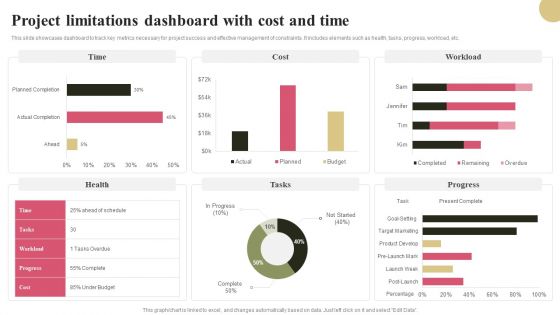
Project Limitations Dashboard With Cost And Time Graphics PDF
This slide showcases dashboard to track key metrics necessary for project success and effective management of constraints. It includes elements such as health, tasks, progress, workload, etc. Pitch your topic with ease and precision using this Project Limitations Dashboard With Cost And Time Graphics PDF. This layout presents information on Time, Workload, Tasks, Progress. It is also available for immediate download and adjustment. So, changes can be made in the color, design, graphics or any other component to create a unique layout.
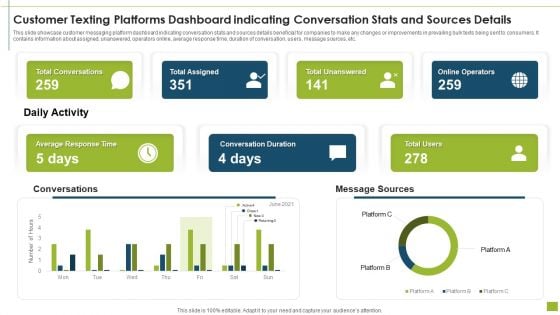
Customer Texting Platforms Dashboard Indicating Conversation Stats And Sources Details Ideas PDF
This slide showcase customer messaging platform dashboard indicating conversation stats and sources details beneficial for companies to make any changes or improvements in prevailing bulk texts being sent to consumers. It contains information about assigned, unanswered, operators online, average response time, duration of conversation, users, message sources, etc.Showcasing this set of slides titled customer texting platforms dashboard indicating conversation stats and sources details ideas pdf The topics addressed in these templates are total conversations, total assigned, total unanswered All the content presented in this PPT design is completely editable. Download it and make adjustments in color, background, font etc. as per your unique business setting.
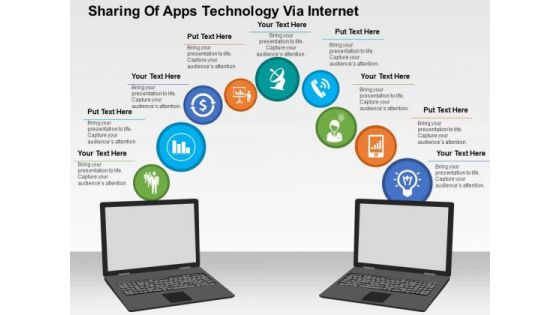
Sharing Of Apps Technology Via Internet PowerPoint Template
You can download this technology slide for topics like technology, internet and communication etc. It contains graphics of two laptops with modern icons. Capture the attention of your audience using this exclusive template.
Tracking Energy Consumption Track And Monitor Baseline Ppt Infographic Template Picture PDF
Deliver and pitch your topic in the best possible manner with this tracking energy consumption track and monitor baseline ppt infographic template picture pdf. Use them to share invaluable insights on measured data, baseline, control chart and impress your audience. This template can be altered and modified as per your expectations. So, grab it now.
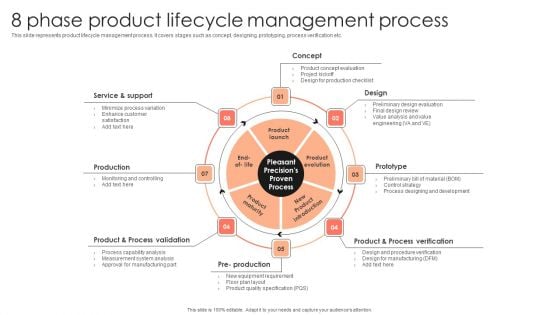
Management Plan For Product Life Cycle 8 Phase Product Lifecycle Management Process Template PDF
This slide represents product lifecycle management process. It covers stages such as concept, designing, prototyping, process verification etc. The Management Plan For Product Life Cycle 8 Phase Product Lifecycle Management Process Template PDF is a compilation of the most recent design trends as a series of slides. It is suitable for any subject or industry presentation, containing attractive visuals and photo spots for businesses to clearly express their messages. This template contains a variety of slides for the user to input data, such as structures to contrast two elements, bullet points, and slides for written information. Slidegeeks is prepared to create an impression.
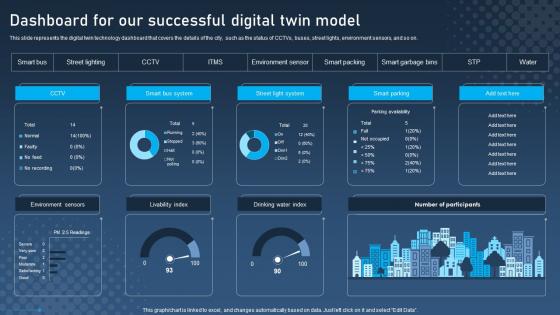
Dashboard For Our Successful Digital Twin Digital Twins For Enhanced Industrial Inspiration Pdf
This slide represents the digital twin technology dashboard that covers the details of the city, such as the status of CCTVs, buses, street lights, environment sensors, and so on. Whether you have daily or monthly meetings, a brilliant presentation is necessary. Dashboard For Our Successful Digital Twin Digital Twins For Enhanced Industrial Inspiration Pdf can be your best option for delivering a presentation. Represent everything in detail using Dashboard For Our Successful Digital Twin Digital Twins For Enhanced Industrial Inspiration Pdf and make yourself stand out in meetings. The template is versatile and follows a structure that will cater to your requirements. All the templates prepared by Slidegeeks are easy to download and edit. Our research experts have taken care of the corporate themes as well. So, give it a try and see the results. This slide represents the digital twin technology dashboard that covers the details of the city, such as the status of CCTVs, buses, street lights, environment sensors, and so on.
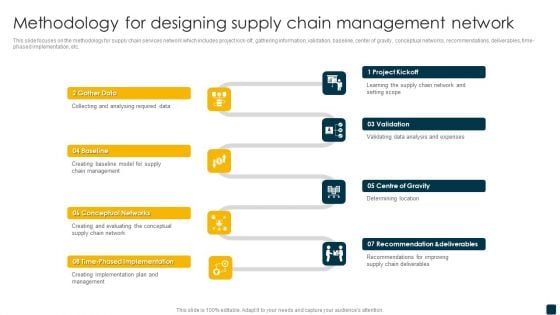
Methodology For Designing Supply Chain Management Network Background PDF
This slide focuses on the methodology for supply chain services network which includes project kick off, gathering information, validation, baseline, center of gravity, conceptual networks, recommendations, deliverables, time phased implementation, etc. Presenting Methodology For Designing Supply Chain Management Network Background PDF to dispense important information. This template comprises eight stages. It also presents valuable insights into the topics including Conceptual Networks, Gather Data, Validation. This is a completely customizable PowerPoint theme that can be put to use immediately. So, download it and address the topic impactfully.

Approaches To Improve Infra Cyber Security In AI Infrastructure Diagrams PDF
The following slide showcases various approaches to AI infrastructure which bodes well for future of organizations association. It presents information related to regulatory framework, expert consultations, etc. Presenting Approaches To Improve Infra Cyber Security In AI Infrastructure Diagrams PDF to dispense important information. This template comprises three stages. It also presents valuable insights into the topics including Regulatory Framework, Protect AI Related Data, Involve Cybersecurity Experts. This is a completely customizable PowerPoint theme that can be put to use immediately. So, download it and address the topic impactfully.
Multiple Projects Progress Tracking Report Management Dashboard With Duration Summary PDF
This slide shows the dashboard representing status of various projects which would be helpful in project management. It shows information related to project status, tasks status, milestones completed, upcoming milestones, critical tasks, projects names along with their start and end date, duration etc.Pitch your topic with ease and precision using this Multiple Projects Progress Tracking Report Management Dashboard With Duration Summary PDF. This layout presents information on Start Date, Finish Date, Percent Complete. It is also available for immediate download and adjustment. So, changes can be made in the color, design, graphics or any other component to create a unique layout.
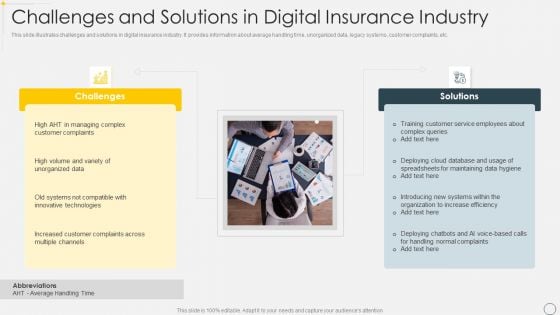
Challenges And Solutions In Digital Insurance Industry Rules PDF
This slide illustrates challenges and solutions in digital insurance industry. It provides information about average handling time, unorganized data, legacy systems, customer complaints, etc. Presenting Challenges And Solutions In Digital Insurance Industry Rules PDF to dispense important information. This template comprises two stages. It also presents valuable insights into the topics including Challenges, Solutions. This is a completely customizable PowerPoint theme that can be put to use immediately. So, download it and address the topic impactfully.
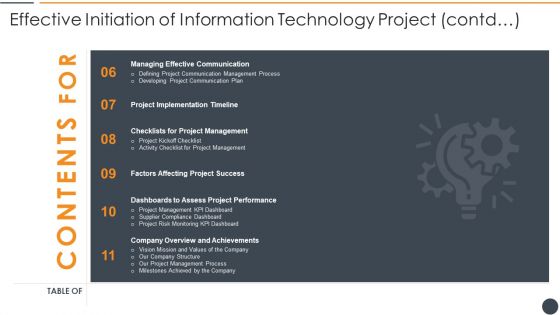
Effective Initiation Of Information Technology Project Contd Table Of Contents Themes PDF
This is a effective initiation of information technology project contd table of contents themes pdf template with various stages. Focus and dispense information on eleven stages using this creative set, that comes with editable features. It contains large content boxes to add your information on topics like managing effective communication, project implementation timeline, dashboards to assess project performance. You can also showcase facts, figures, and other relevant content using this PPT layout. Grab it now.
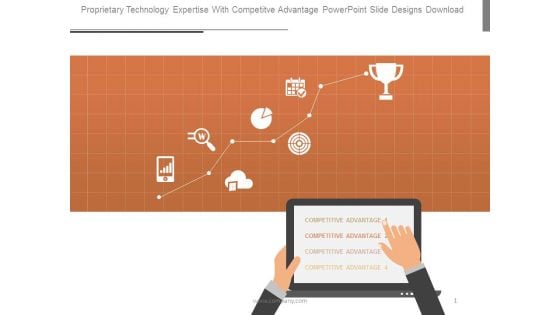
Proprietary Technology Expertise With Competitve Advantage Powerpoint Slide Designs Download
This is a proprietary technology expertise with competitve advantage powerpoint slide designs download. This is a two stage process. The stages in this process are business, process, marketing, strategy, opportunity, growth, icon.
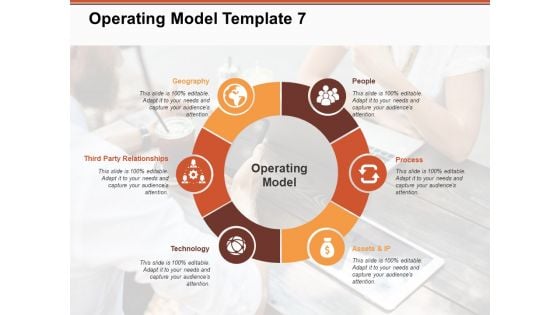
Operating Model Geography Technology Ppt PowerPoint Presentation Pictures Layout Ideas
This is a operating model geography technology ppt powerpoint presentation pictures layout ideas. This is a six stage process. The stages in this process are business, management, icons, geography, process.
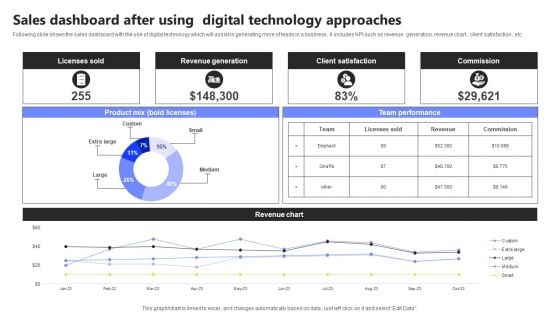
Sales Dashboard After Using Digital Technology Approaches Infographics PDF
Following slide shows the sales dashboard with the use of digital technology which will assist in generating more of leads in a business . It includes KPI such as revenue generation, revenue chart , client satisfaction , etc. Showcasing this set of slides titled Sales Dashboard After Using Digital Technology Approaches Infographics PDF. The topics addressed in these templates are Licenses Sold, Revenue Generation, Client Satisfaction. All the content presented in this PPT design is completely editable. Download it and make adjustments in color, background, font etc. as per your unique business setting.
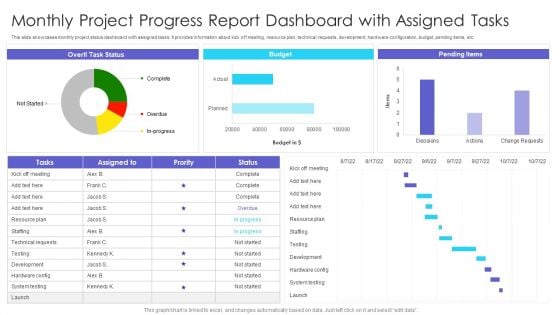
Monthly Project Progress Report Dashboard With Assigned Tasks Ppt Styles Clipart PDF
This slide showcases monthly project status dashboard with assigned tasks. It provides information about kick off meeting, resource plan, technical requests, development, hardware configuration, budget, pending items, etc. Pitch your topic with ease and precision using this Monthly Project Progress Report Dashboard With Assigned Tasks Ppt Styles Clipart PDF. This layout presents information on Pending Items, Budget, Kick Off Meeting. It is also available for immediate download and adjustment. So, changes can be made in the color, design, graphics or any other component to create a unique layout.
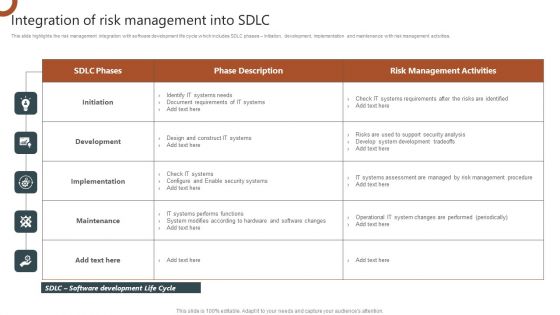
Organizations Risk Management And IT Security Integration Of Risk Management Into SDLC Inspiration PDF
This slide highlights the risk management integration with software development life cycle which includes SDLC phases Initiation, development, implementation and maintenance with risk management activities. The Organizations Risk Management And IT Security Prioritized Cyber Security Threats With Risk Mitigation Plan Demonstration PDF is a compilation of the most recent design trends as a series of slides. It is suitable for any subject or industry presentation, containing attractive visuals and photo spots for businesses to clearly express their messages. This template contains a variety of slides for the user to input data, such as structures to contrast two elements, bullet points, and slides for written information. Slidegeeks is prepared to create an impression.
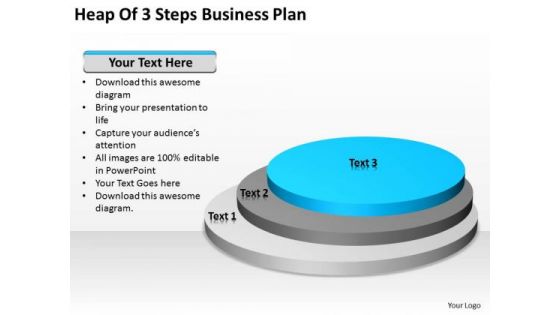
Heap Of 3 Steps Business Plan Ppt Help With PowerPoint Templates
We present our heap of 3 steps business plan ppt help with PowerPoint templates.Download our Flow Charts PowerPoint Templates because You can Create a matrix with our PowerPoint Templates and Slides. Feel the strength of your ideas click into place. Use our Process and Flows PowerPoint Templates because you can Add colour to your speech with our PowerPoint Templates and Slides. Your presentation will leave your audience speechless. Download and present our Circle Charts PowerPoint Templates because You can Double your output with our PowerPoint Templates and Slides. They make beating deadlines a piece of cake. Download our Shapes PowerPoint Templates because They will Put your wonderful verbal artistry on display. Our PowerPoint Templates and Slides will provide you the necessary glam and glitter. Download and present our Business PowerPoint Templates because Our PowerPoint Templates and Slides help you pinpoint your timelines. Highlight the reasons for your deadlines with their use.Use these PowerPoint slides for presentations relating to Chart, round, growth, pyramid, market, isolated, demographic, infochart, document, isometric, piechart, perspective, business, blank, concept, vector, sign,diagramchart, visual, presentation, glossy, symbol, template, diagram, circle, ring, graphic, finance, data, stock, element, report, abstract, graph, illustration, icon,economic, shiny, rating, web, infographic, design, text, organization, information, background, office, statistic, financial. The prominent colors used in the PowerPoint template are Blue light, Gray, Black. Synthesize presentations with our Heap Of 3 Steps Business Plan Ppt Help With PowerPoint Templates. Download without worries with our money back guaranteee.
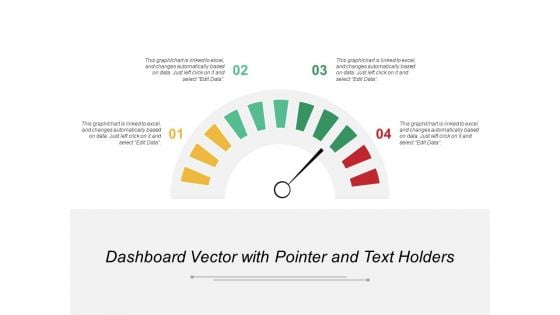
Dashboard Vector With Pointer And Text Holders Ppt PowerPoint Presentation Portfolio Format Ideas
This is a dashboard vector with pointer and text holders ppt powerpoint presentation portfolio format ideas. This is a four stage process. The stages in this process are performance dashboard, performance meter, performance kpi.

Consumer Segmentation Dashboard Ppt Powerpoint Presentation Complete Deck With Slides
This Consumer Segmentation Dashboard Ppt Powerpoint Presentation Complete Deck With Slides acts as backup support for your ideas, vision, thoughts, etc. Use it to present a thorough understanding of the topic. This PPT slideshow can be utilized for both in-house and outside presentations depending upon your needs and business demands. Entailing twelve slides with a consistent design and theme, this template will make a solid use case. As it is intuitively designed, it suits every business vertical and industry. All you have to do is make a few tweaks in the content or any other component to design unique presentations. The biggest advantage of this complete deck is that it can be personalized multiple times once downloaded. The color, design, shapes, and other elements are free to modify to add personal touches. You can also insert your logo design in this PPT layout. Therefore a well-thought and crafted presentation can be delivered with ease and precision by downloading this Consumer Segmentation Dashboard Ppt Powerpoint Presentation Complete Deck With Slides PPT slideshow. Our Consumer Segmentation Dashboard Ppt Powerpoint Presentation Complete Deck With Slides are topically designed to provide an attractive backdrop to any subject. Use them to look like a presentation pro.
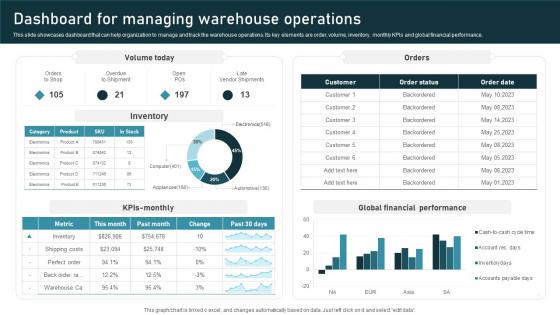
Dashboard Managing Inventory Administration Techniques For Enhanced Stock Accuracy Mockup Pdf
This slide showcases dashboard that can help organization to manage and track the warehouse operations. Its key elements are order, volume, inventory, monthly KPIs and global financial performance. Do you have an important presentation coming up Are you looking for something that will make your presentation stand out from the rest Look no further than Dashboard Managing Inventory Administration Techniques For Enhanced Stock Accuracy Mockup Pdf. With our professional designs, you can trust that your presentation will pop and make delivering it a smooth process. And with Slidegeeks, you can trust that your presentation will be unique and memorable. So why wait Grab Dashboard Managing Inventory Administration Techniques For Enhanced Stock Accuracy Mockup Pdf today and make your presentation stand out from the rest This slide showcases dashboard that can help organization to manage and track the warehouse operations. Its key elements are order, volume, inventory, monthly KPIs and global financial performance.
Dashboard For Tracking Impact Of Implementing Sales Techniques For Achieving Rules Pdf
This slide covers the KPI dashboard for tracking KPIs such as new customer YTD, sales revenue, profit, average weekly sales, above sales target, average revenue per unit, customer lifetime value, etc. Do you have an important presentation coming up Are you looking for something that will make your presentation stand out from the rest Look no further than Dashboard For Tracking Impact Of Implementing Sales Techniques For Achieving Rules Pdf. With our professional designs, you can trust that your presentation will pop and make delivering it a smooth process. And with Slidegeeks, you can trust that your presentation will be unique and memorable. So why wait Grab Dashboard For Tracking Impact Of Implementing Sales Techniques For Achieving Rules Pdf today and make your presentation stand out from the rest This slide covers the KPI dashboard for tracking KPIs such as new customer YTD, sales revenue, profit, average weekly sales, above sales target, average revenue per unit, customer lifetime value, etc.
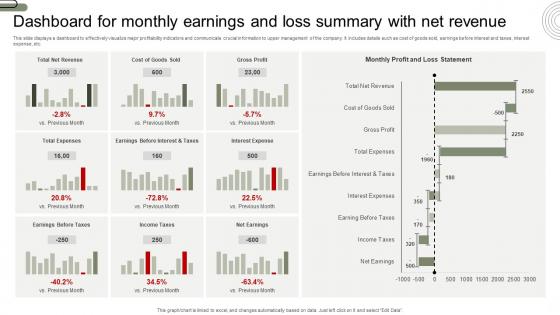
Dashboard For Monthly Earnings And Loss Summary With Net Revenue Background Pdf
This slide displays a dashboard to effectively visualize major profitability indicators and communicate crucial information to upper management of the company. It includes details such as cost of goods sold, earnings before interest and taxes, interest expense, etc. Pitch your topic with ease and precision using this Dashboard For Monthly Earnings And Loss Summary With Net Revenue Background Pdf. This layout presents information on Dashboard For Monthly Earnings, Loss Summary, Net Revenue. It is also available for immediate download and adjustment. So, changes can be made in the color, design, graphics or any other component to create a unique layout. This slide displays a dashboard to effectively visualize major profitability indicators and communicate crucial information to upper management of the company. It includes details such as cost of goods sold, earnings before interest and taxes, interest expense, etc.

 Home
Home