Data Analysis Icon
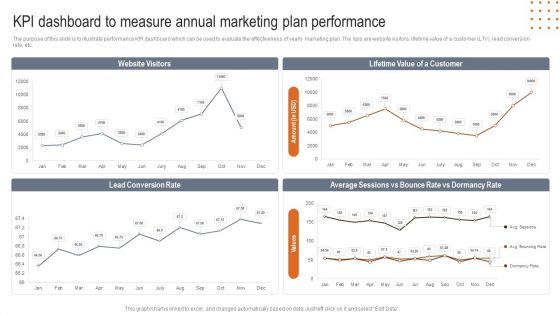
KPI Dashboard To Measure Annual Marketing Plan Performance Microsoft PDF
The purpose of this slide is to illustrate performance KPI dashboard which can be used to evaluate the effectiveness of yearly marketing plan. The kpis are website visitors, lifetime value of a customer LTV, lead conversion rate, etc. Showcasing this set of slides titled KPI Dashboard To Measure Annual Marketing Plan Performance Microsoft PDF. The topics addressed in these templates are Website Visitors, Lifetime Value Customer, Bounce Dormancy Rate. All the content presented in this PPT design is completely editable. Download it and make adjustments in color, background, font etc. as per your unique business setting.
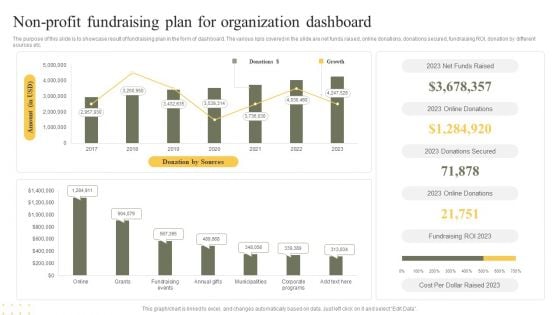
Non Profit Fundraising Plan For Organization Dashboard Clipart PDF
The purpose of this slide is to showcase result of fundraising plan in the form of dashboard. The various kpis covered in the slide are net funds raised, online donations, donations secured, fundraising ROI, donation by different sources etc. Showcasing this set of slides titled Non Profit Fundraising Plan For Organization Dashboard Clipart PDF. The topics addressed in these templates are Donation By Sources, Growth, Cost. All the content presented in this PPT design is completely editable. Download it and make adjustments in color, background, font etc. as per your unique business setting.
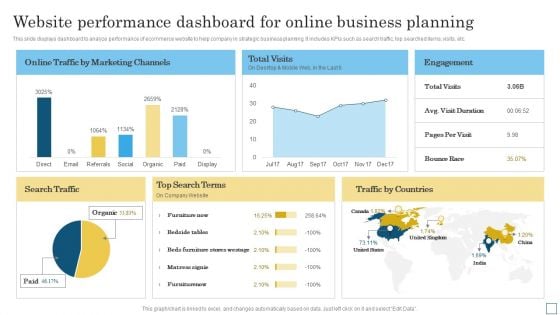
Website Performance Dashboard For Online Business Planning Graphics PDF
This slide displays dashboard to analyze performance of ecommerce website to help company in strategic business planning. It includes KPIs such as search traffic, top searched items, visits, etc. Showcasing this set of slides titled Website Performance Dashboard For Online Business Planning Graphics PDF. The topics addressed in these templates are Marketing Channels, Bounce Race, Search Traffic. All the content presented in this PPT design is completely editable. Download it and make adjustments in color, background, font etc. as per your unique business setting.
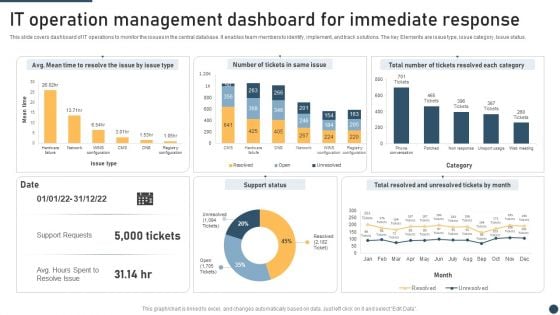
It Operation Management Dashboard For Immediate Response Demonstration PDF
This slide covers dashboard of IT operations to monitor the issues in the central database. It enables team members to identify, implement, and track solutions. The key Elements are issue type, issue category, Issue status. Showcasing this set of slides titled It Operation Management Dashboard For Immediate Response Demonstration PDF. The topics addressed in these templates are Support Status, Immediate Response, Time To Resolve. All the content presented in this PPT design is completely editable. Download it and make adjustments in color, background, font etc. as per your unique business setting.
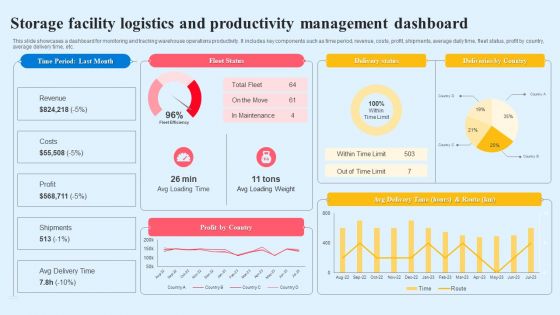
Storage Facility Logistics And Productivity Management Dashboard Summary PDF
This slide showcases a dashboard for monitoring and tracking warehouse operations productivity. It includes key components such as time period, revenue, costs, profit, shipments, average daily time, fleet status, profit by country, average delivery time, etc. Showcasing this set of slides titled Storage Facility Logistics And Productivity Management Dashboard Summary PDF. The topics addressed in these templates are Fleet Status, Delivery Status, Deliveries By Country. All the content presented in this PPT design is completely editable. Download it and make adjustments in color, background, font etc. as per your unique business setting.
Storage Facility Productivity Tracking KPI Dashboard Graphics PDF
This slide showcases a dashboard for tracking and managing warehouse productivity to optimize logistics operations. It includes key components such as warehouse operating costs, perfect order rate, total shipments by country and on time shipments. Showcasing this set of slides titled Storage Facility Productivity Tracking KPI Dashboard Graphics PDF. The topics addressed in these templates are Warehouse Operating Costs, Perfect Order Rate, Total Shipment Country. All the content presented in this PPT design is completely editable. Download it and make adjustments in color, background, font etc. as per your unique business setting.
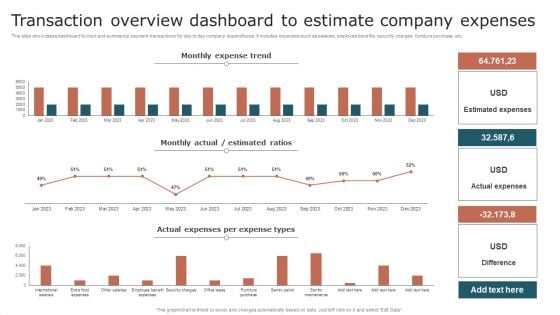
Transaction Overview Dashboard To Estimate Company Expenses Mockup PDF
This slide showcases dashboard to track and summarize payment transactions for day to day company expenditures. It includes expenses such as salaries, employee benefits, security charges, furniture purchase, etc. Showcasing this set of slides titled Transaction Overview Dashboard To Estimate Company Expenses Mockup PDF. The topics addressed in these templates are Monthly Expense Trend, Estimated Ratios, Actual Expenses. All the content presented in this PPT design is completely editable. Download it and make adjustments in color, background, font etc. as per your unique business setting.
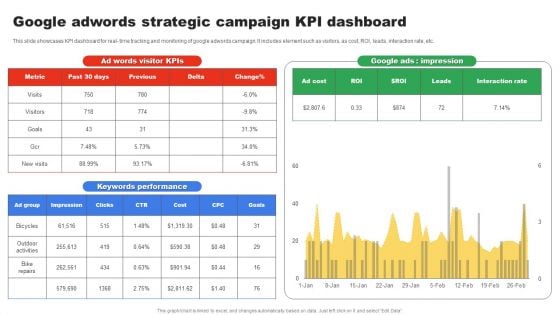
Google Adwords Strategic Campaign KPI Dashboard Topics PDF
This slide showcases KPI dashboard for real time tracking and monitoring of google adwords campaign. It includes element such as visitors, as cost, ROI, leads, interaction rate, etc. Showcasing this set of slides titled Google Adwords Strategic Campaign KPI Dashboard Topics PDF. The topics addressed in these templates are Keywords Performance, Google Ads Impression, Ad Words Visitor Kpis. All the content presented in this PPT design is completely editable. Download it and make adjustments in color, background, font etc. as per your unique business setting.
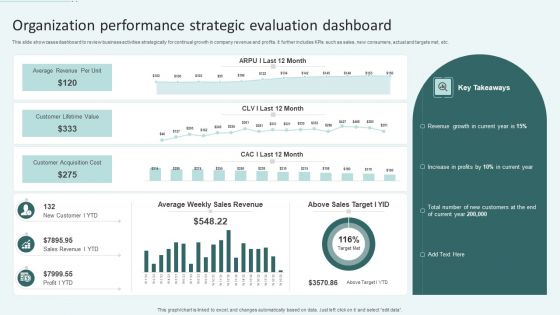
Organization Performance Strategic Evaluation Dashboard Ppt Slides Visual Aids PDF
This slide showcases dashboard to review business activities strategically for continual growth in company revenue and profits. It further includes KPIs such as sales, new consumers, actual and targets met, etc. Showcasing this set of slides titled Organization Performance Strategic Evaluation Dashboard Ppt Slides Visual Aids PDF. The topics addressed in these templates are Average Revenue Per Unit, Customer Lifetime Value, Customer Acquisition Cost. All the content presented in this PPT design is completely editable. Download it and make adjustments in color, background, font etc. as per your unique business setting.
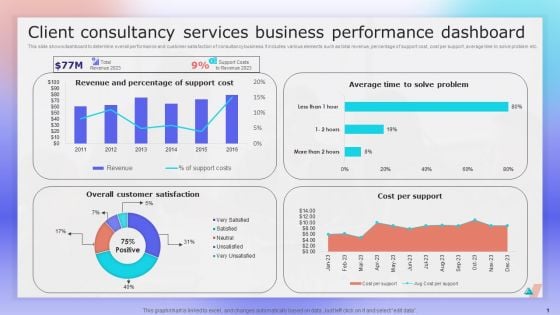
Client Consultancy Services Business Performance Dashboard Ppt File Layout PDF
This slide shows dashboard to determine overall performance and customer satisfaction of consultancy business. It includes various elements such as total revenue, percentage of support cost, cost per support, average time to solve problem etc. Showcasing this set of slides titled Client Consultancy Services Business Performance Dashboard Ppt File Layout PDF. The topics addressed in these templates are Revenue And Percentage, Support Cost, Cost Per Support. All the content presented in this PPT design is completely editable. Download it and make adjustments in color, background, font etc. as per your unique business setting.
Digital Marketing Dashboard For Tracking Lead Generation Guidelines PDF
This slide showcases dashboard for digital marketing that can help organization track the monthly leads generated and performance of online marketing campaigns. Its key components are lead breakdown, total lead by program, web traffic targets, key conversion metrics, trial leads by region, total social media channels and key conversion metrics. Showcasing this set of slides titled Digital Marketing Dashboard For Tracking Lead Generation Guidelines PDF. The topics addressed in these templates are Lead By Program, Lead Breakdown, Key Conversion Metrics. All the content presented in this PPT design is completely editable. Download it and make adjustments in color, background, font etc. as per your unique business setting.
Monthly Comparison Dashboard For Lead Tracking Sample PDF
This slide showcases dashboard that can help organization to compare the leads converted in different months and make changes in sales and marketing campaigns . Its key components lead generated by country, by industry type and lead sources by month. Showcasing this set of slides titled Monthly Comparison Dashboard For Lead Tracking Sample PDF. The topics addressed in these templates are Leads Received, Industry Type, Lead Generated. All the content presented in this PPT design is completely editable. Download it and make adjustments in color, background, font etc. as per your unique business setting.
Sales Performance Dashboard With Average Lead Tracking Time Background PDF
This slide showcases dashboard for sales performance that can help organization to analyze the effectiveness of sales campaigns and average response time of lead. Its key components are average contract value, average sales cycle length, follow up contract rate and sales activity. Showcasing this set of slides titled Sales Performance Dashboard With Average Lead Tracking Time Background PDF. The topics addressed in these templates are Avg Contract Value, Sales Activity, Contract Rate. All the content presented in this PPT design is completely editable. Download it and make adjustments in color, background, font etc. as per your unique business setting.
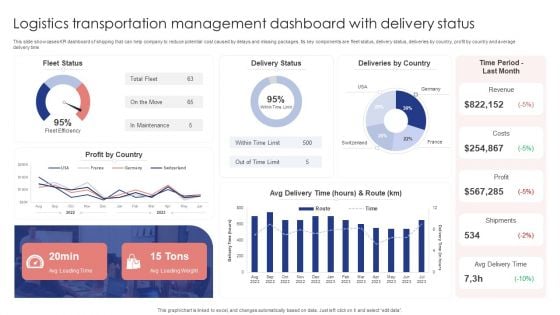
Logistics Transportation Management Dashboard With Delivery Status Portrait PDF
This slide showcases KPI dashboard of shipping that can help company to reduce potential cost caused by delays and missing packages. Its key components are fleet status, delivery status, deliveries by country, profit by country and average delivery time. Showcasing this set of slides titled Logistics Transportation Management Dashboard With Delivery Status Portrait PDF. The topics addressed in these templates are Fleet Status, Delivery Status, Deliveries By Country. All the content presented in this PPT design is completely editable. Download it and make adjustments in color, background, font etc. as per your unique business setting.
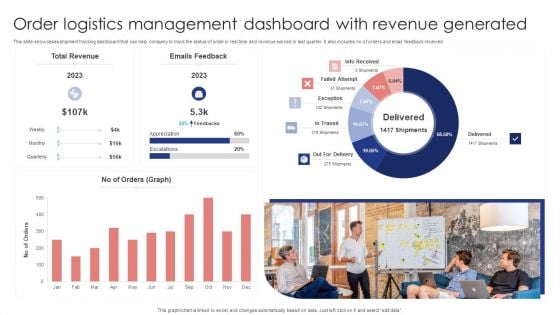
Order Logistics Management Dashboard With Revenue Generated Slides PDF
This slide showcases shipment tracking dashboard that can help company to track the status of order in real time and revenue earned in last quarter. It also includes no of orders and email feedback received. Showcasing this set of slides titled Order Logistics Management Dashboard With Revenue Generated Slides PDF. The topics addressed in these templates are Total Revenue, Emails Feedback, Orders Graph. All the content presented in this PPT design is completely editable. Download it and make adjustments in color, background, font etc. as per your unique business setting.
Dashboard For Tracking Global Share Market Indices Formats PDF
Following slide represent a comprehensive dashboard to track stock market indices of different countries. The indices mentioned in the slide are DOW jones, NASDAQ, S and P along with the highest and lowest price of indices on a particular day. Showcasing this set of slides titled Dashboard For Tracking Global Share Market Indices Formats PDF. The topics addressed in these templates are Global Share, Market Indices, Abbreviations. All the content presented in this PPT design is completely editable. Download it and make adjustments in color, background, font etc. as per your unique business setting.
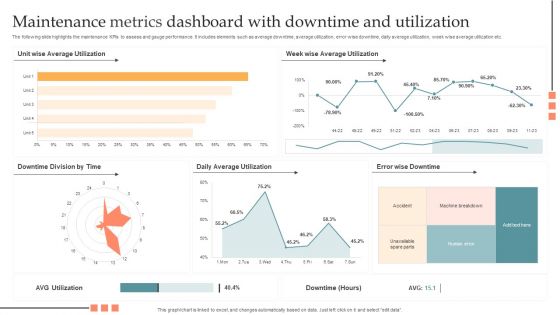
Maintenance Metrics Dashboard With Downtime And Utilization Pictures PDF
The following slide highlights the maintenance KPIs to assess and gauge performance. It includes elements such as average downtime, average utilization, error wise downtime, daily average utilization, week wise average utilization etc. Showcasing this set of slides titled Maintenance Metrics Dashboard With Downtime And Utilization Pictures PDF. The topics addressed in these templates are Maintenance Metrics Dashboard, Downtime And Utilization. All the content presented in this PPT design is completely editable. Download it and make adjustments in color, background, font etc. as per your unique business setting.
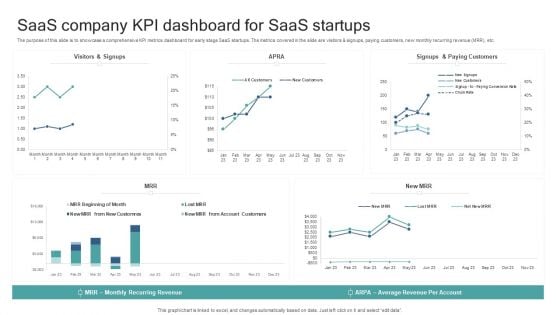
Saas Company KPI Dashboard For Saas Startups Background PDF
The purpose of this slide is to showcase a comprehensive KPI metrics dashboard for early stage SaaS startups. The metrics covered in the slide are visitors and signups, paying customers, new monthly recurring revenue MRR, etc. Showcasing this set of slides titled Saas Company KPI Dashboard For Saas Startups Background PDF. The topics addressed in these templates are Average Revenue Per Account, Monthly Recurring Revenue. All the content presented in this PPT design is completely editable. Download it and make adjustments in color, background, font etc. as per your unique business setting.
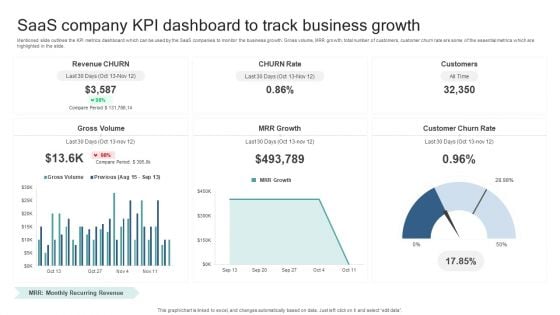
Saas Company KPI Dashboard To Track Business Growth Guidelines PDF
Mentioned slide outlines the KPI metrics dashboard which can be used by the SaaS companies to monitor the business growth. Gross volume, MRR growth, total number of customers, customer churn rate are some of the essential metrics which are highlighted in the slide. Showcasing this set of slides titled Saas Company KPI Dashboard To Track Business Growth Guidelines PDF. The topics addressed in these templates are Gross Volume, Mrr Growth, Customer Churn Rate. All the content presented in this PPT design is completely editable. Download it and make adjustments in color, background, font etc. as per your unique business setting.
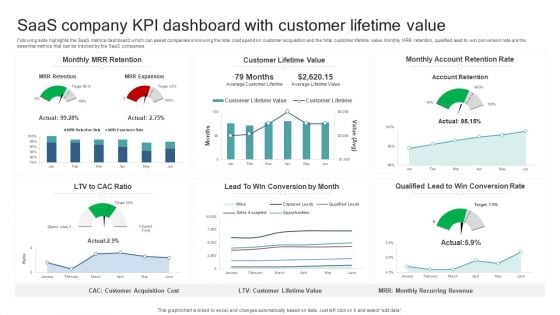
Saas Company KPI Dashboard With Customer Lifetime Value Professional PDF
Following slide highlights the SaaS metrics dashboard which can assist companies in knowing the total cost spend on customer acquisition and the total customer lifetime value. Monthly MRR retention, qualified lead to win conversion rate are the essential metrics that can be tracked by the SaaS companies. Showcasing this set of slides titled Saas Company KPI Dashboard With Customer Lifetime Value Professional PDF. The topics addressed in these templates are Monthly Mrr Retention, Customer Lifetime Value, Monthly Account Retention Rate. All the content presented in this PPT design is completely editable. Download it and make adjustments in color, background, font etc. as per your unique business setting.
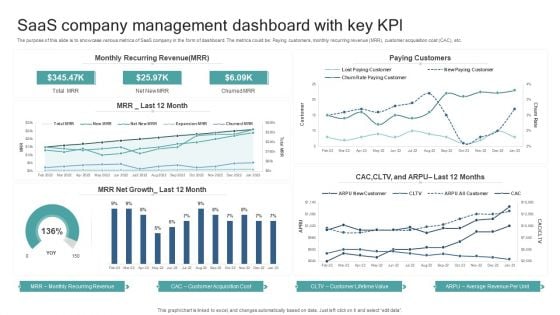
Saas Company Management Dashboard With Key Kpl Template PDF
The purpose of this slide is to showcase various metrics of SaaS company in the form of dashboard. The metrics could be, Paying customers, monthly recurring revenue MRR, customer acquisition cost CAC, etc. Showcasing this set of slides titled Saas Company Management Dashboard With Key Kpl Template PDF. The topics addressed in these templates are Monthly Recurring Revenue, Customer Acquisition Cost, Customer Lifetime Value, Average Revenue Per Unit. All the content presented in this PPT design is completely editable. Download it and make adjustments in color, background, font etc. as per your unique business setting.
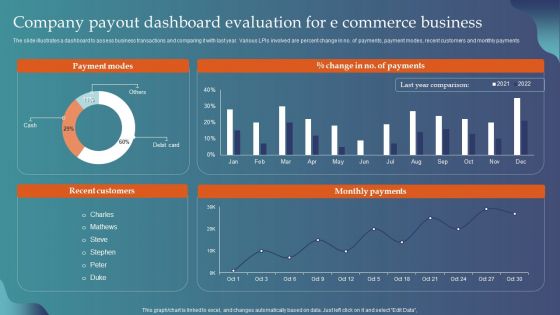
Company Payout Dashboard Evaluation For E Commerce Business Background PDF
The slide illustrates a dashboard to assess business transactions and comparing it with last year. Various LPIs involved are percent change in no. of payments, payment modes, recent customers and monthly payments. Showcasing this set of slides titled Company Payout Dashboard Evaluation For E Commerce Business Background PDF. The topics addressed in these templates are Payment Modes, Recent Customers, Monthly Payments. All the content presented in this PPT design is completely editable. Download it and make adjustments in color, background, font etc. as per your unique business setting.
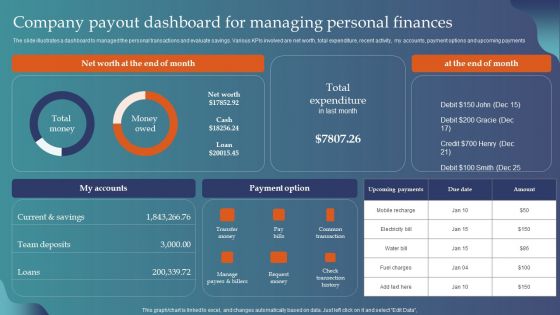
Company Payout Dashboard For Managing Personal Finances Brochure PDF
The slide illustrates a dashboard to managed the personal transactions and evaluate savings. Various KPIs involved are net worth, total expenditure, recent activity, my accounts, payment options and upcoming payments. Showcasing this set of slides titled Company Payout Dashboard For Managing Personal Finances Brochure PDF. The topics addressed in these templates are Net Worth, Total Expenditure, My Accounts, Payment Option. All the content presented in this PPT design is completely editable. Download it and make adjustments in color, background, font etc. as per your unique business setting.
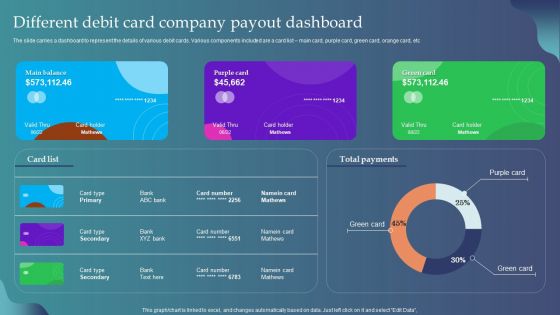
Different Debit Card Company Payout Dashboard Ppt Pictures Inspiration PDF
The slide carries a dashboard to represent the details of various debit cards. Various components included are a card list main card, purple card, green card, orange card, etc. Showcasing this set of slides titled Different Debit Card Company Payout Dashboard Ppt Pictures Inspiration PDF. The topics addressed in these templates are Main Balance, Purple Card, Green Card, Total Payments. All the content presented in this PPT design is completely editable. Download it and make adjustments in color, background, font etc. as per your unique business setting.
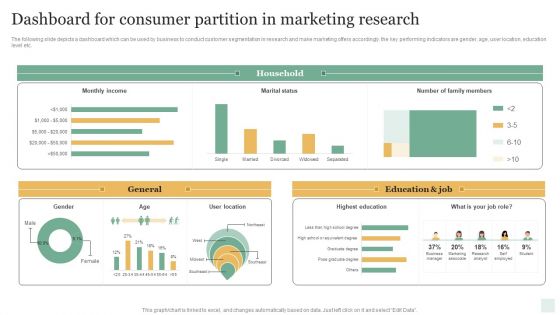
Dashboard For Consumer Partition In Marketing Research Microsoft PDF
The following slide depicts a dashboard which can be used by business to conduct customer segmentation in research and make marketing offers accordingly. the key performing indicators are gender, age, user location, education level etc. Showcasing this set of slides titled Dashboard For Consumer Partition In Marketing Research Microsoft PDF. The topics addressed in these templates are General, Education And Job, Household. All the content presented in this PPT design is completely editable. Download it and make adjustments in color, background, font etc. as per your unique business setting.
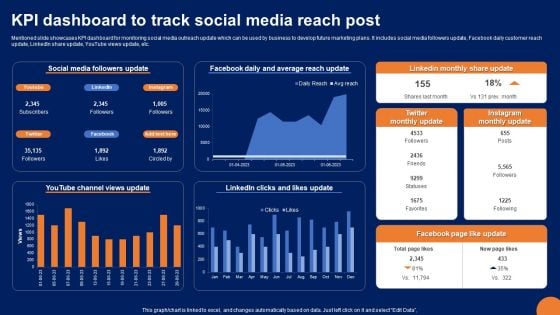
KPI Dashboard To Track Social Media Reach Post Portrait PDF
Mentioned slide showcases KPI dashboard for monitoring social media outreach update which can be used by business to develop future marketing plans. It includes social media followers update, Facebook daily customer reach update, LinkedIn share update, YouTube views update, etc. Showcasing this set of slides titled KPI Dashboard To Track Social Media Reach Post Portrait PDF. The topics addressed in these templates are Social Media Followers Update, Facebook Daily, Average Reach Update. All the content presented in this PPT design is completely editable. Download it and make adjustments in color, background, font etc. as per your unique business setting.
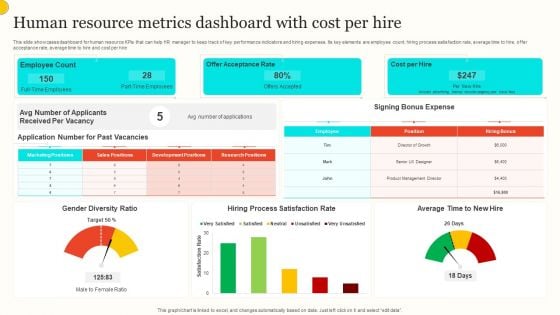
Human Resource Metrics Dashboard With Cost Per Hire Portrait PDF
This slide showcases dashboard for human resource KPIs that can help HR manager to keep track of key performance indicators and hiring expenses. Its key elements are employee count, hiring process satisfaction rate, average time to hire, offer acceptance rate, average time to hire and cost per hire. Showcasing this set of slides titled Human Resource Metrics Dashboard With Cost Per Hire Portrait PDF. The topics addressed in these templates are Employee Count, Offer Acceptance Rate, Cost Per Hire. All the content presented in this PPT design is completely editable. Download it and make adjustments in color, background, font etc. as per your unique business setting.
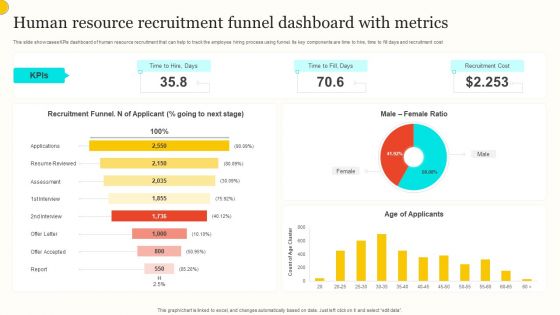
Human Resource Recruitment Funnel Dashboard With Metrics Summary PDF
This slide showcases KPIs dashboard of human resource recruitment that can help to track the employee hiring process using funnel. Its key components are time to hire, time to fill days and recruitment cost. Showcasing this set of slides titled Human Resource Recruitment Funnel Dashboard With Metrics Summary PDF. The topics addressed in these templates are Recruitment Funnel, Male Female Ratio, Age Applicants. All the content presented in this PPT design is completely editable. Download it and make adjustments in color, background, font etc. as per your unique business setting.
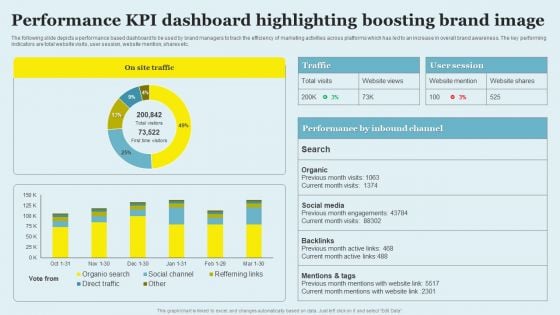
Performance KPI Dashboard Highlighting Boosting Brand Image Sample PDF
The following slide depicts a performance based dashboard to be used by brand managers to track the efficiency of marketing activities across platforms which has led to an increase in overall brand awareness. The key performing indicators are total website visits, user session, website mention, shares etc. Showcasing this set of slides titled Performance KPI Dashboard Highlighting Boosting Brand Image Sample PDF. The topics addressed in these templates are Social Media, Backlinks, Mentions Tags. All the content presented in this PPT design is completely editable. Download it and make adjustments in color, background, font etc. as per your unique business setting.
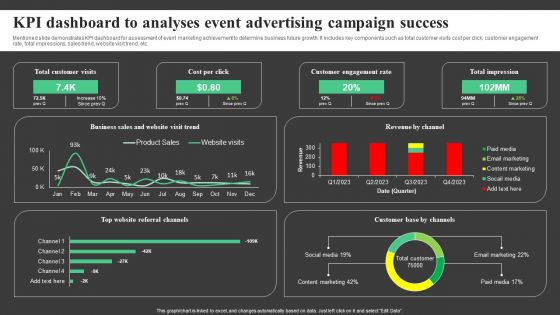
KPI Dashboard To Analyses Event Advertising Campaign Success Topics PDF
Mentioned slide demonstrates KPI dashboard for assessment of event marketing achievement to determine business future growth. It includes key components such as total customer visits cost per click, customer engagement rate, total impressions, sales trend, website visit trend, etc. Showcasing this set of slides titled KPI Dashboard To Analyses Event Advertising Campaign Success Topics PDF. The topics addressed in these templates are Total Customer Visits, Cost Per Click, Customer Engagement Rate . All the content presented in this PPT design is completely editable. Download it and make adjustments in color, background, font etc. as per your unique business setting.
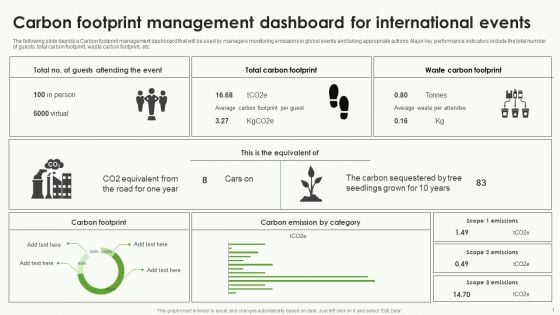
Carbon Footprint Management Dashboard For International Events Brochure PDF
The following slide depicts a Carbon footprint management dashboard that will be used by managers monitoring emissions in global events and taking appropriate actions. Major key performance indicators include the total number of guests, total carbon footprint, waste carbon footprint, etc. Showcasing this set of slides titled Carbon Footprint Management Dashboard For International Events Brochure PDF. The topics addressed in these templates are Carbon Footprint, Carbon Emission By Category, Waste Carbon Footprint. All the content presented in this PPT design is completely editable. Download it and make adjustments in color, background, font etc. as per your unique business setting.
Dashboard For Tracking Sales Order Processing Rate Inspiration PDF
The following slide showcases sales order fulfilment rate dashboard to measure efficiency of shipping, process and packaging. It includes components such as partially fulfilled orders, pending orders, total number of orders etc. Showcasing this set of slides titled Dashboard For Tracking Sales Order Processing Rate Inspiration PDF. The topics addressed in these templates are Order Fulfilment, Partially Fulfilled, Pending. All the content presented in this PPT design is completely editable. Download it and make adjustments in color, background, font etc. as per your unique business setting.
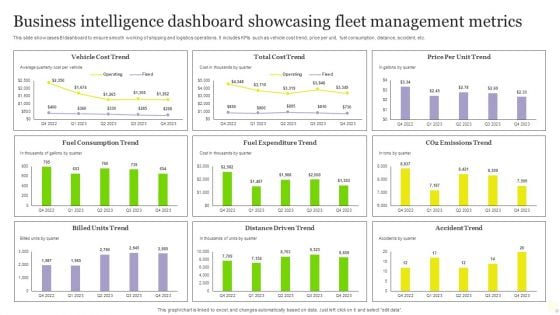
Business Intelligence Dashboard Showcasing Fleet Management Metrics Elements PDF
This slide showcases BI dashboard to ensure smooth working of shipping and logistics operations. It includes KPIs such as vehicle cost trend, price per unit, fuel consumption, distance, accident, etc. Showcasing this set of slides titled Business Intelligence Dashboard Showcasing Fleet Management Metrics Elements PDF. The topics addressed in these templates are Cost Trend, Price Per Unit Trend, Vehicle Cost Trend. All the content presented in this PPT design is completely editable. Download it and make adjustments in color, background, font etc. as per your unique business setting.
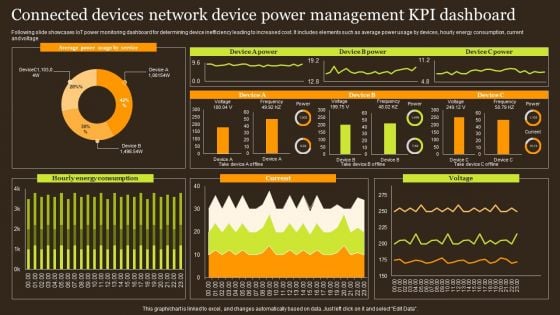
Connected Devices Network Device Power Management KPI Dashboard Template PDF
Following slide showcases IoT power monitoring dashboard for determining device inefficiency leading to increased cost. It includes elements such as average power usage by devices, hourly energy consumption, current and voltage. Showcasing this set of slides titled Connected Devices Network Device Power Management KPI Dashboard Template PDF. The topics addressed in these templates are Hourly Energy Consumption, Average Power Usage Service, Current. All the content presented in this PPT design is completely editable. Download it and make adjustments in color, background, font etc. as per your unique business setting.
Dashboard For Tracking Aftersales Customer Services Team Performance Designs PDF
This slide covers the KPI dashboard for ticket tracking. It includes metrics such as tickets by month, service level, and details of customer service department agents. Boost your pitch with our creative Dashboard For Tracking Aftersales Customer Services Team Performance Designs PDF. Deliver an awe inspiring pitch that will mesmerize everyone. Using these presentation templates you will surely catch everyones attention. You can browse the ppts collection on our website. We have researchers who are experts at creating the right content for the templates. So you do not have to invest time in any additional work. Just grab the template now and use them.
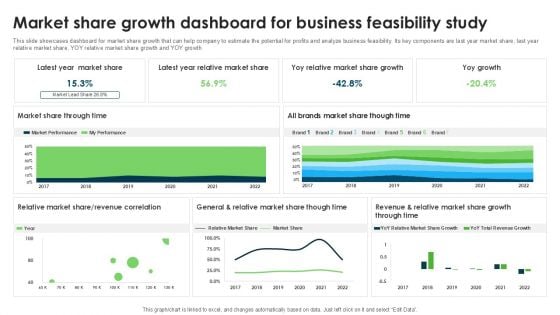
Market Share Growth Dashboard For Business Feasibility Study Demonstration PDF
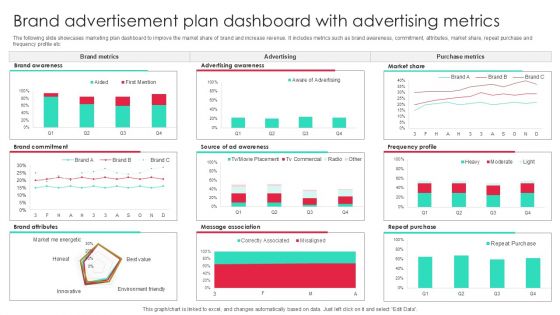
Brand Advertisement Plan Dashboard With Advertising Metrics Inspiration PDF
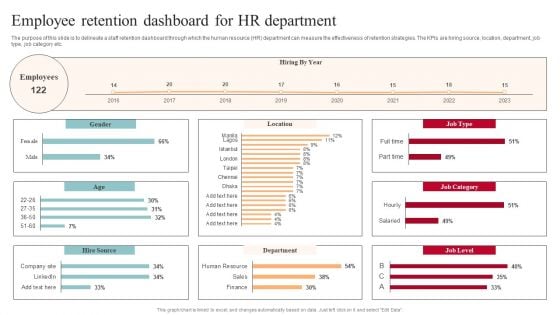
Employee Retention Dashboard For Hr Department Sample PDF
The purpose of this slide is to delineate a staff retention dashboard through which the human resource HR department can measure the effectiveness of retention strategies. The KPIs are hiring source, location, department, job type, job category etc. Boost your pitch with our creative Employee Retention Dashboard For Hr Department Sample PDF. Deliver an awe-inspiring pitch that will mesmerize everyone. Using these presentation templates you will surely catch everyones attention. You can browse the ppts collection on our website. We have researchers who are experts at creating the right content for the templates. So you do not have to invest time in any additional work. Just grab the template now and use them.
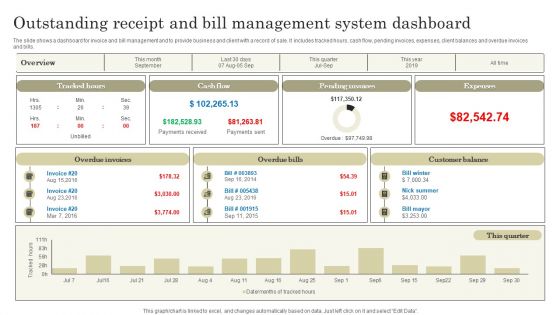
Outstanding Receipt And Bill Management System Dashboard Pictures PDF
The slide shows a dashboard for invoice and bill management and to provide business and client with a record of sale. It includes tracked hours, cash flow, pending invoices, expenses, client balances and overdue invoices and bills. Showcasing this set of slides titled Outstanding Receipt And Bill Management System Dashboard Pictures PDF. The topics addressed in these templates are Tracked hours, Cash flow, Pending invoices, Expenses. All the content presented in this PPT design is completely editable. Download it and make adjustments in color, background, font etc. as per your unique business setting.

Call Center Kpis Agent Performance Dashboard Clipart PDF
This slide covers contact center agent performance metrics KPI dashboard. It involves metrics such as number of calls, average response time, average hold time, daily average transfer rate and agents with most hold time and transfer rate. Showcasing this set of slides titled Call Center Kpis Agent Performance Dashboard Clipart PDF. The topics addressed in these templates are Transfer Rate, Call Center, Hold Time. All the content presented in this PPT design is completely editable. Download it and make adjustments in color, background, font etc. as per your unique business setting.
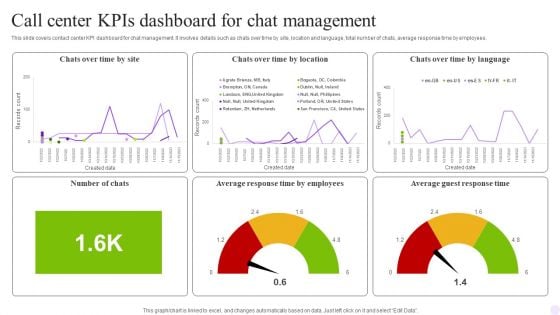
Call Center Kpis Dashboard For Chat Management Graphics PDF
This slide covers contact center KPI dashboard for chat management. It involves details such as chats over time by site, location and language, total number of chats, average response time by employees. Showcasing this set of slides titled Call Center Kpis Dashboard For Chat Management Graphics PDF. The topics addressed in these templates are Management, Employees, Chats. All the content presented in this PPT design is completely editable. Download it and make adjustments in color, background, font etc. as per your unique business setting.
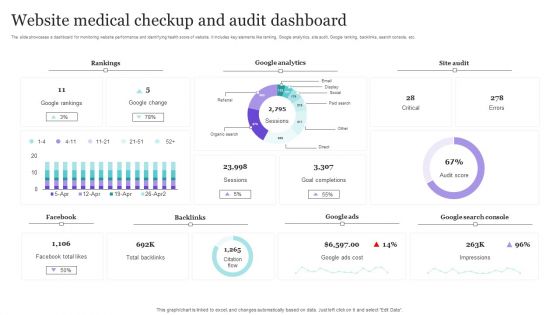
Website Medical Checkup And Audit Dashboard Background PDF
The slide showcases a dashboard for monitoring website performance and identifying health score of website. It includes key elements like ranking, Google analytics, site audit, Google ranking, backlinks, search console, etc. Showcasing this set of slides titled Website Medical Checkup And Audit Dashboard Background PDF. The topics addressed in these templates are Rankings, Google Analytics, Site Audit. All the content presented in this PPT design is completely editable. Download it and make adjustments in color, background, font etc. as per your unique business setting.
KPI Dashboard For Tracking Financial Management Challenges Download PDF
Following slide demonstrates KPI dashboard for monitoring business cash flow management pain points to improve organisation financial performance. It includes elements such as quick ratio, current ration, annual cash balance, monthly cash balance, accounts receivable and payables, etc. Showcasing this set of slides titled KPI Dashboard For Tracking Financial Management Challenges Download PDF. The topics addressed in these templates are Monthly Cash Flow, Account Payable By Days, Annual Revenue, Annual Cost, Annual Net Profits. All the content presented in this PPT design is completely editable. Download it and make adjustments in color, background, font etc. as per your unique business setting.

HR Security Training And Wellbeing KPI Dashboard Professional PDF
This slide showcases dashboard for HR safety training and wellbeing. This template aims to improve employee working efficiency and enhance working conditions to foster their working efficiency. It provides details regarding incidents reported, training programs implemented to reduce number of incidents, cost of providing training and level of employee satisfaction with training. Showcasing this set of slides titled HR Security Training And Wellbeing KPI Dashboard Professional PDF. The topics addressed in these templates are Severity, Injury Consequence, Employee Satisfaction Training. All the content presented in this PPT design is completely editable. Download it and make adjustments in color, background, font etc. as per your unique business setting.
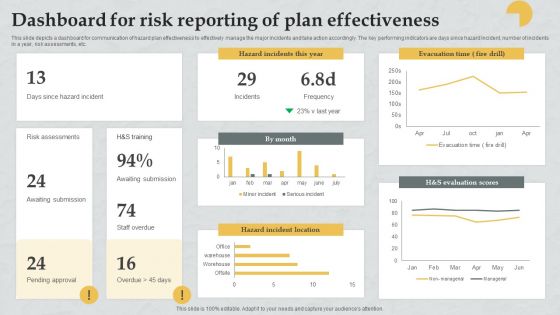
Dashboard For Risk Reporting Of Plan Effectiveness Download PDF
This slide depicts a dashboard for communication of hazard plan effectiveness to effectively manage the major incidents and take action accordingly. The key performing indicators are days since hazard incident, number of incidents in a year, risk assessments, etc. Showcasing this set of slides titled Dashboard For Risk Reporting Of Plan Effectiveness Download PDF. The topics addressed in these templates are Risk Assessments, Awaiting Submission, Awaiting Submission. All the content presented in this PPT design is completely editable. Download it and make adjustments in color, background, font etc. as per your unique business setting.
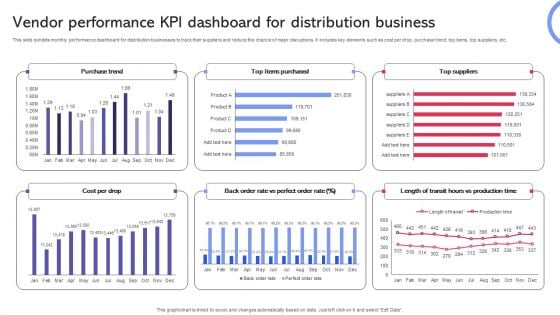
Vendor Performance KPI Dashboard For Distribution Business Formats PDF
This slide exhibits monthly performance dashboard for distribution businesses to track their suppliers and reduce the chance of major disruptions. It includes key elements such as cost per drop, purchase trend, top items, top suppliers, etc. Showcasing this set of slides titled Vendor Performance KPI Dashboard For Distribution Business Formats PDF. The topics addressed in these templates are Purchase Trend, Suppliers, Distribution Business. All the content presented in this PPT design is completely editable. Download it and make adjustments in color, background, font etc. as per your unique business setting.
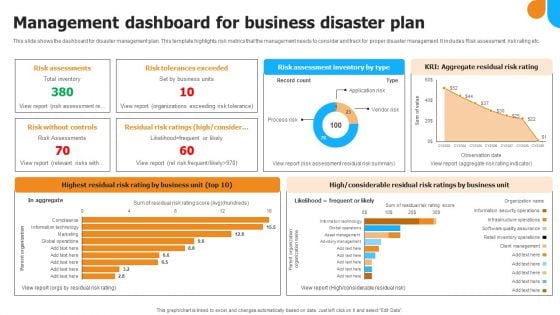
Management Dashboard For Business Disaster Plan Infographics PDF
This slide shows the dashboard for disaster management plan. This template highlights risk metrics that the management needs to consider and track for proper disaster management. It includes Risk assessment, risk rating etc. Showcasing this set of slides titled Management Dashboard For Business Disaster Plan Infographics PDF Graphics. The topics addressed in these templates are Risk Assessments, Risk Tolerances Exceeded, Risk Without Controls. All the content presented in this PPT design is completely editable. Download it and make adjustments in color, background, font etc. as per your unique business setting.
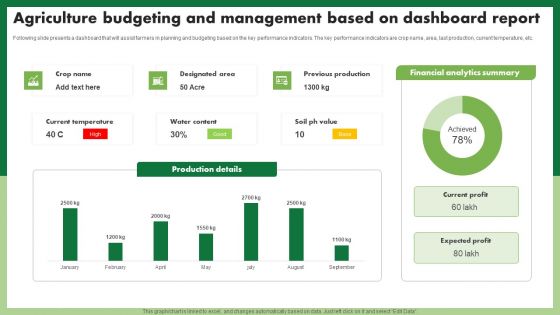
Agriculture Budgeting And Management Based On Dashboard Report Topics PDF
Following slide presents a dashboard that will assist farmers in planning and budgeting based on the key performance indicators. The key performance indicators are crop name, area, last production, current temperature, etc. Showcasing this set of slides titled Agriculture Budgeting And Management Based On Dashboard Report Topics PDF. The topics addressed in these templates are Production Details. All the content presented in this PPT design is completely editable. Download it and make adjustments in color, background, font etc. as per your unique business setting.
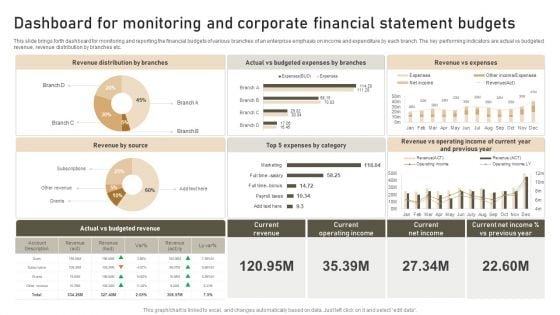
Dashboard For Monitoring And Corporate Financial Statement Budgets Template PDF
This slide brings forth dashboard for monitoring and reporting the financial budgets of various branches of an enterprise emphasis on income and expenditure by each branch. The key performing indicators are actual vs budgeted revenue, revenue distribution by branches etc. Showcasing this set of slides titled Dashboard For Monitoring And Corporate Financial Statement Budgets Template PDF. The topics addressed in these templates are Revenue Distribution, Revenue Source, Revenue Expenses. All the content presented in this PPT design is completely editable. Download it and make adjustments in color, background, font etc. as per your unique business setting.
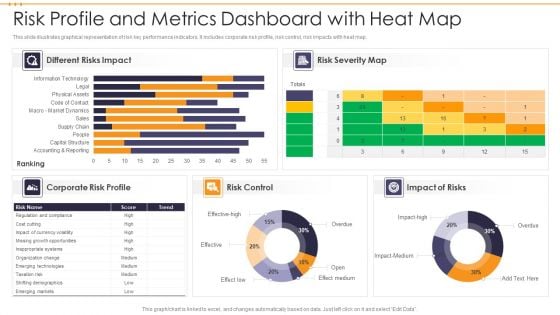
Risk Profile And Metrics Dashboard With Heat Map Brochure PDF
This slide illustrates graphical representation of risk key performance indicators. It includes corporate risk profile, risk control, risk impacts with heat map. Showcasing this set of slides titled Risk Profile And Metrics Dashboard With Heat Map Brochure PDF. The topics addressed in these templates are Risk Control, Impact Of Risks, Risk Severity Map. All the content presented in this PPT design is completely editable. Download it and make adjustments in color, background, font etc. as per your unique business setting.
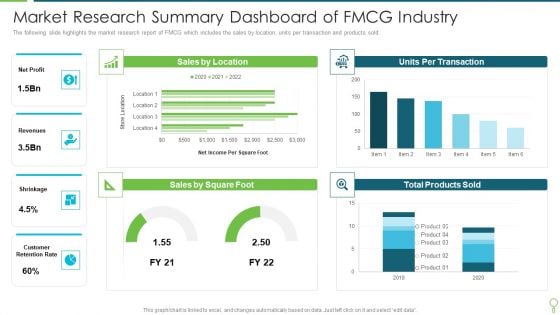
Market Research Summary Dashboard Of Fmcg Industry Pictures PDF
The following slide highlights the market research report of FMCG which includes the sales by location, units per transaction and products sold. Showcasing this set of slides titled Market Research Summary Dashboard Of Fmcg Industry Pictures PDF. The topics addressed in these templates are Revenues, Net Profit, Sales. All the content presented in this PPT design is completely editable. Download it and make adjustments in color, background, font etc. as per your unique business setting.
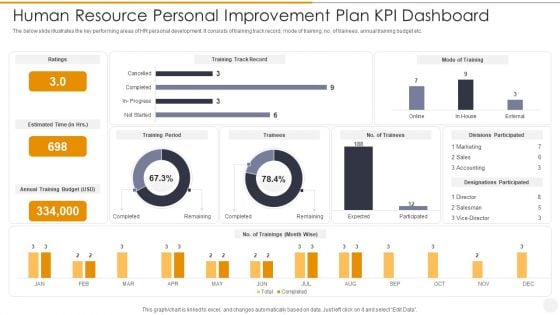
Human Resource Personal Improvement Plan Kpi Dashboard Topics PDF
The below slide illustrates the key performing areas of HR personal development. It consists of training track record, mode of training, no. of trainees, annual training budget etc. Showcasing this set of slides titled Human Resource Personal Improvement Plan Kpi Dashboard Topics PDF. The topics addressed in these templates are Sales, Marketing, Accounting. All the content presented in this PPT design is completely editable. Download it and make adjustments in color, background, font etc. as per your unique business setting.

Sales Training KPI Dashboard For Improving Skills Portrait PDF
The following slide depicts the sales training assessment to work upon the areas need improvement. It also includes current status, goals along with training basis, index and scores.Showcasing this set of slides titled Sales Training KPI Dashboard For Improving Skills Portrait PDF The topics addressed in these templates are Acquisition Process, Sales Presentation, Customer Relationship Management All the content presented in this PPT design is completely editable. Download it and make adjustments in color, background, font etc. as per your unique business setting.
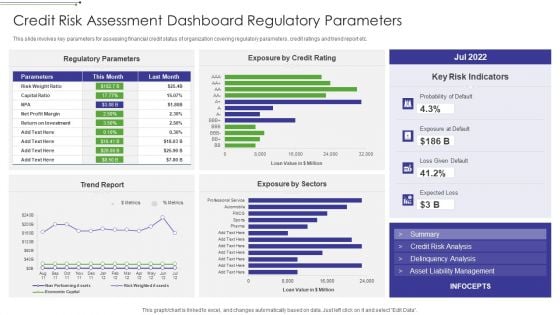
Credit Risk Assessment Dashboard Regulatory Parameters Microsoft PDF
This slide involves key parameters for assessing financial credit status of organization covering regulatory parameters, credit ratings and trend report etc.Showcasing this set of slides titled Credit Risk Assessment Dashboard Regulatory Parameters Microsoft PDF The topics addressed in these templates are Regulatory Parameters, Exposure By Credit Rating, Exposure By Sectors All the content presented in this PPT design is completely editable. Download it and make adjustments in color, background, font etc. as per your unique business setting.
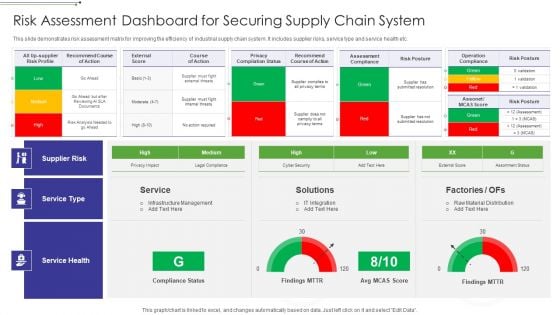
Risk Assessment Dashboard For Securing Supply Chain System Graphics PDF
This slide demonstrates risk assessment matrix for improving the efficiency of industrial supply chain system. It includes supplier risks, service type and service health etc.Showcasing this set of slides titled Risk Assessment Dashboard For Securing Supply Chain System Graphics PDF The topics addressed in these templates are Operation Compliance, Privacy Compilation, External Score All the content presented in this PPT design is completely editable. Download it and make adjustments in color, background, font etc. as per your unique business setting.

Development And Operations KPI Dashboard With Successful Deployments Inspiration PDF
This template covers about total number of deployments with success ratio. Further, this slide includes average duration time and total breakdown due to errors in whole year.Showcasing this set of slides titled Development And Operations KPI Dashboard With Successful Deployments Inspiration PDF The topics addressed in these templates are Environment Deployments, Average Deployment, Breakdown Deployments All the content presented in this PPT design is completely editable. Download it and make adjustments in color, background, font etc. as per your unique business setting.
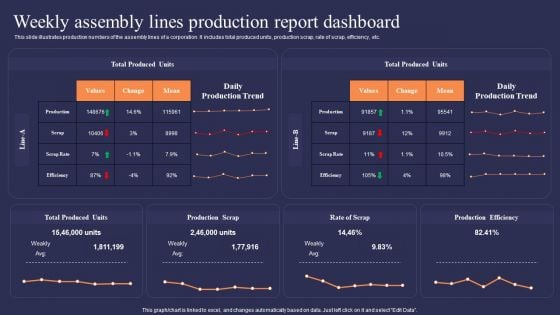
Weekly Assembly Lines Production Report Dashboard Demonstration PDF
This slide illustrates production numbers of the assembly lines of a corporation. It includes total produced units, production scrap, rate of scrap, efficiency, etc.Showcasing this set of slides titled Weekly Assembly Lines Production Report Dashboard Demonstration PDF. The topics addressed in these templates are Total Produced, Production Efficiency, Production Scrap. All the content presented in this PPT design is completely editable. Download it and make adjustments in color, background, font etc. as per your unique business setting.

Facility Planning Management Workforce Productivity Dashboard Formats PDF
This slide showcase employees productivity driven by facility planning in organisation.it includes workforce productivity , organisation department , monthly productivity percentage and facility percentage. Showcasing this set of slides titled Facility Planning Management Workforce Productivity Dashboard Formats PDF. The topics addressed in these templates are Workforce Productivity, Work Productivity, Facility Percentage. All the content presented in this PPT design is completely editable. Download it and make adjustments in color, background, font etc. as per your unique business setting.
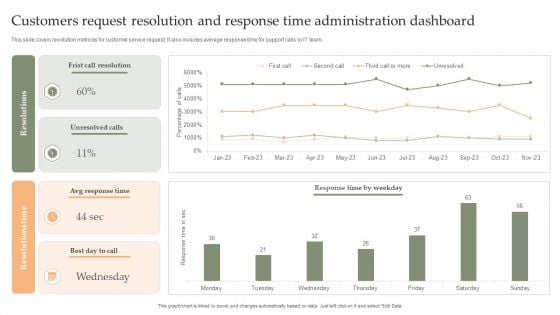
Customers Request Resolution And Response Time Administration Dashboard Mockup PDF
This slide covers resolution metrices for customer service request. It also includes average response time for support calls by IT team. Showcasing this set of slides titled Customers Request Resolution And Response Time Administration Dashboard Mockup PDF. The topics addressed in these templates are Frist Call Resolution, Unresolved Calls, Avg Response Time. All the content presented in this PPT design is completely editable. Download it and make adjustments in color, background, font etc. as per your unique business setting.
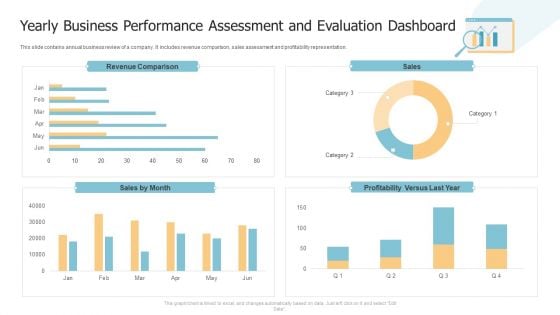
Yearly Business Performance Assessment And Evaluation Dashboard Structure PDF
This slide contains annual business review of a company. It includes revenue comparison, sales assessment and profitability representation. Showcasing this set of slides titled Yearly Business Performance Assessment And Evaluation Dashboard Structure PDF. The topics addressed in these templates are Revenue Comparison, Sales, Profitability. All the content presented in this PPT design is completely editable. Download it and make adjustments in color, background, font etc. as per your unique business setting.
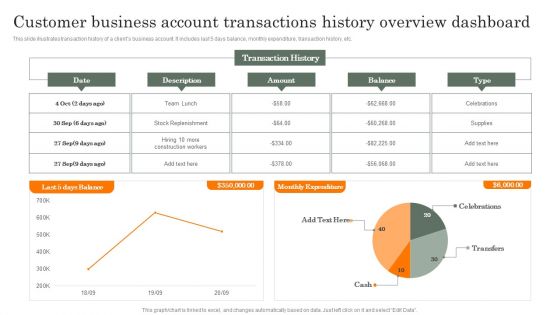
Customer Business Account Transactions History Overview Dashboard Guidelines PDF
This slide illustrates transaction history of a clients business account. It includes last 5 days balance, monthly expenditure, transaction history, etc. Showcasing this set of slides titled Customer Business Account Transactions History Overview Dashboard Guidelines PDF. The topics addressed in these templates are Customer Business, Account Transactions, History Overview. All the content presented in this PPT design is completely editable. Download it and make adjustments in color, background, font etc. as per your unique business setting.
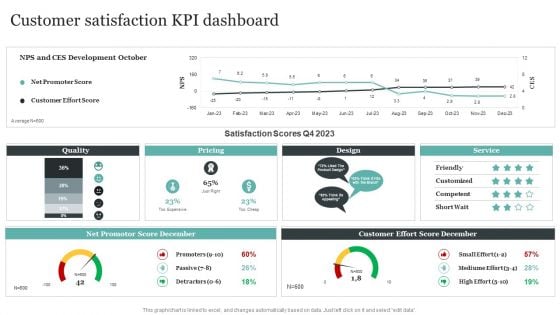
Comprehensive Personal Branding Guidelines Customer Satisfaction Kpi Dashboard Microsoft PDF
Boost your pitch with our creative Comprehensive Personal Branding Guidelines Customer Satisfaction Kpi Dashboard Microsoft PDF. Deliver an awe-inspiring pitch that will mesmerize everyone. Using these presentation templates you will surely catch everyones attention. You can browse the ppts collection on our website. We have researchers who are experts at creating the right content for the templates. So you do not have to invest time in any additional work. Just grab the template now and use them.
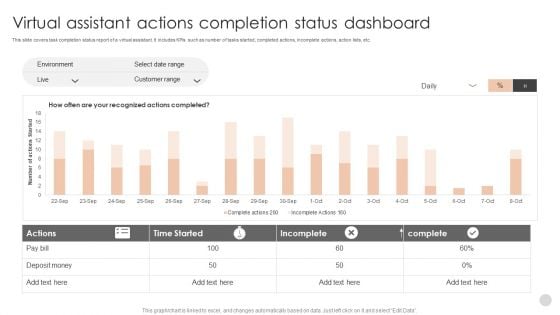
Virtual Assistant Actions Completion Status Dashboard Elements PDF
This slide covers task completion status report of a virtual assistant. It includes KPIs such as number of tasks started, completed actions, incomplete actions, action lists, etc.Showcasing this set of slides titled Virtual Assistant Actions Completion Status Dashboard Elements PDF. The topics addressed in these templates are Customer Range, Time Started, Incomplete. All the content presented in this PPT design is completely editable. Download it and make adjustments in color, background, font etc. as per your unique business setting.
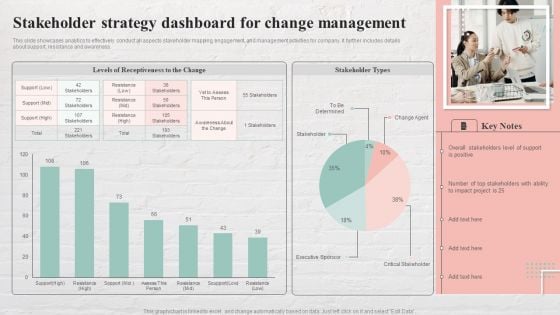
Stakeholder Strategy Dashboard For Change Management Brochure PDF
This slide showcases analytics to effectively conduct all aspects stakeholder mapping, engagement, and management activities for company. It further includes details about support, resistance and awareness. Showcasing this set of slides titled Stakeholder Strategy Dashboard For Change Management Brochure PDF. The topics addressed in these templates are Level Of Support, Stakeholders With Ability. All the content presented in this PPT design is completely editable. Download it and make adjustments in color, background, font etc. as per your unique business setting.
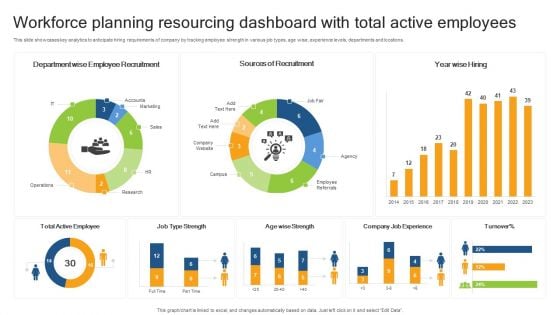
Workforce Planning Resourcing Dashboard With Total Active Employees Rules PDF
This slide showcases key analytics to anticipate hiring requirements of company by tracking employee strength in various job types, age wise, experience levels, departments and locations. Showcasing this set of slides titled Workforce Planning Resourcing Dashboard With Total Active Employees Rules PDF. The topics addressed in these templates are Employee Recruitment, Sources Recruitment, Active Employee . All the content presented in this PPT design is completely editable. Download it and make adjustments in color, background, font etc. as per your unique business setting.
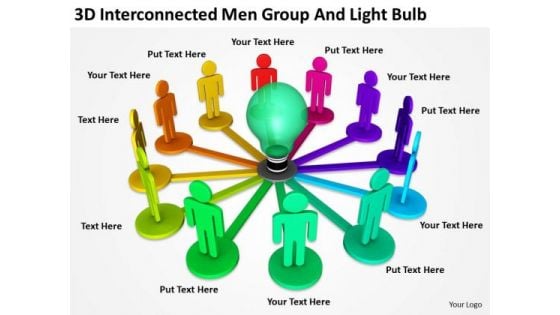
People Business 3d Interconnected Men Group And Light Bulb PowerPoint Slides
We present our people business 3d interconnected men group and light bulb PowerPoint Slides.Present our People PowerPoint Templates because It will Raise the bar of your Thoughts. They are programmed to take you to the next level. Present our Light bulbs PowerPoint Templates because It can Leverage your style with our PowerPoint Templates and Slides. Charm your audience with your ability. Present our Business PowerPoint Templates because You can Rise to the occasion with our PowerPoint Templates and Slides. You will bring your audience on their feet in no time. Download our Success PowerPoint Templates because You are an avid believer in ethical practices. Highlight the benefits that accrue with our PowerPoint Templates and Slides. Present our Teamwork PowerPoint Templates because Our PowerPoint Templates and Slides help you pinpoint your timelines. Highlight the reasons for your deadlines with their use.Use these PowerPoint slides for presentations relating to 3d, answer, colleague, collective, communication, discussion, game,group, help, icon, idea, illustration, info,information, interaction, jigsaw, join, link,mark, meet, men, office, opportunity,partner, partnership, people, person,piece, problem, professional,pie, puzzle,render, search, shape, sign, solution,success, symbol, team, teamwork. The prominent colors used in the PowerPoint template are Green, Red, Yellow. Professionals tell us our people business 3d interconnected men group and light bulb PowerPoint Slides are incredible easy to use. People tell us our group PowerPoint templates and PPT Slides provide great value for your money. Be assured of finding the best projection to highlight your words. We assure you our people business 3d interconnected men group and light bulb PowerPoint Slides are visually appealing. Presenters tell us our help PowerPoint templates and PPT Slides are effectively colour coded to prioritise your plans They automatically highlight the sequence of events you desire. We assure you our people business 3d interconnected men group and light bulb PowerPoint Slides provide great value for your money. Be assured of finding the best projection to highlight your words. PowerPoint presentation experts tell us our group PowerPoint templates and PPT Slides will make the presenter look like a pro even if they are not computer savvy. Cruise along with our People Business 3d Interconnected Men Group And Light Bulb PowerPoint Slides. Your thoughts will pick up the flow.
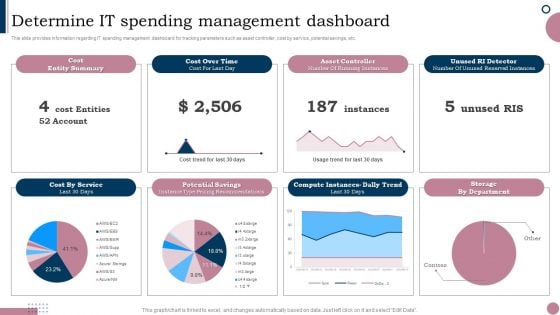
Cios Guide To Optimize Determine IT Spending Management Dashboard Portrait PDF
This slide provides information regarding IT spending management dashboard for tracking parameters such as asset controller, cost by service, potential savings, etc. If you are looking for a format to display your unique thoughts, then the professionally designed Cios Guide To Optimize Determine IT Spending Management Dashboard Portrait PDF is the one for you. You can use it as a Google Slides template or a PowerPoint template. Incorporate impressive visuals, symbols, images, and other charts. Modify or reorganize the text boxes as you desire. Experiment with shade schemes and font pairings. Alter, share or cooperate with other people on your work. Download Cios Guide To Optimize Determine IT Spending Management Dashboard Portrait PDF and find out how to give a successful presentation. Present a perfect display to your team and make your presentation unforgettable.
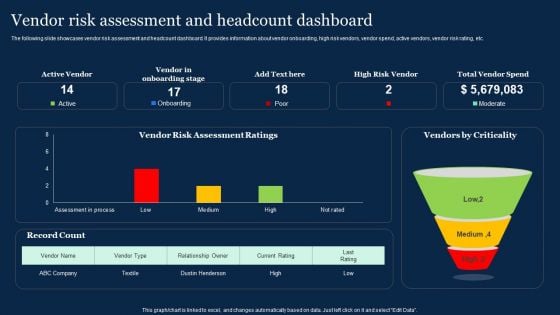
Vendor Risk Assessment And Headcount Dashboard Effective Vendor Management For Enhancing Elements PDF
The following slide showcases vendor risk assessment and headcount dashboard. It provides information about vendor onboarding, high risk vendors, vendor spend, active vendors, vendor risk rating, etc. If you are looking for a format to display your unique thoughts, then the professionally designed Vendor Risk Assessment And Headcount Dashboard Effective Vendor Management For Enhancing Elements PDF is the one for you. You can use it as a Google Slides template or a PowerPoint template. Incorporate impressive visuals, symbols, images, and other charts. Modify or reorganize the text boxes as you desire. Experiment with shade schemes and font pairings. Alter, share or cooperate with other people on your work. Download Vendor Risk Assessment And Headcount Dashboard Effective Vendor Management For Enhancing Elements PDF and find out how to give a successful presentation. Present a perfect display to your team and make your presentation unforgettable.
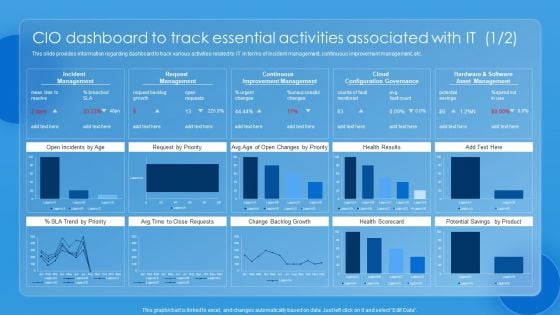
Key CIO Initiatives CIO Dashboard To Track Essential Activities Associated With IT Portrait PDF
This slide provides information regarding dashboard to track various activities related to IT in terms of incident management, continuous improvement management, etc. If you are looking for a format to display your unique thoughts, then the professionally designed Key CIO Initiatives CIO Dashboard To Track Essential Activities Associated With IT Portrait PDF is the one for you. You can use it as a Google Slides template or a PowerPoint template. Incorporate impressive visuals, symbols, images, and other charts. Modify or reorganize the text boxes as you desire. Experiment with shade schemes and font pairings. Alter, share or cooperate with other people on your work. Download Key CIO Initiatives CIO Dashboard To Track Essential Activities Associated With IT Portrait PDF and find out how to give a successful presentation. Present a perfect display to your team and make your presentation unforgettable.
Product Branding To Enhance Product Branding Performance Tracking Dashboard Graphics PDF
This slide provides information regarding product branding performance tracking dashboard in terms of revenues, new customers, customer satisfaction rate. If you are looking for a format to display your unique thoughts, then the professionally designed Product Branding To Enhance Product Branding Performance Tracking Dashboard Graphics PDF is the one for you. You can use it as a Google Slides template or a PowerPoint template. Incorporate impressive visuals, symbols, images, and other charts. Modify or reorganize the text boxes as you desire. Experiment with shade schemes and font pairings. Alter, share or cooperate with other people on your work. Download Product Branding To Enhance Product Branding Performance Tracking Dashboard Graphics PDF and find out how to give a successful presentation. Present a perfect display to your team and make your presentation unforgettable.
Maximizing Brand Growth With Umbrella Branding Activities Corporate Branding Performance Tracking Dashboard Summary PDF
This slide provides information regarding corporate branding performance tracking dashboard in terms of leads, conversion metrics, web traffic, etc. If you are looking for a format to display your unique thoughts, then the professionally designed Maximizing Brand Growth With Umbrella Branding Activities Corporate Branding Performance Tracking Dashboard Summary PDF is the one for you. You can use it as a Google Slides template or a PowerPoint template. Incorporate impressive visuals, symbols, images, and other charts. Modify or reorganize the text boxes as you desire. Experiment with shade schemes and font pairings. Alter, share or cooperate with other people on your work. Download Maximizing Brand Growth With Umbrella Branding Activities Corporate Branding Performance Tracking Dashboard Summary PDF and find out how to give a successful presentation. Present a perfect display to your team and make your presentation unforgettable.

Agriculture Marketing Strategy To Improve Revenue Performance Dashboard Depicting Production Global Food Market Brochure PDF
This slide provides an overview of the dashboard that exhibits the situation of the global food market. It includes production, import, exports information for wheat, maize, rice and soybean. If you are looking for a format to display your unique thoughts, then the professionally designed Agriculture Marketing Strategy To Improve Revenue Performance Dashboard Depicting Production Global Food Market Brochure PDF is the one for you. You can use it as a Google Slides template or a PowerPoint template. Incorporate impressive visuals, symbols, images, and other charts. Modify or reorganize the text boxes as you desire. Experiment with shade schemes and font pairings. Alter, share or cooperate with other people on your work. Download Agriculture Marketing Strategy To Improve Revenue Performance Dashboard Depicting Production Global Food Market Brochure PDF and find out how to give a successful presentation. Present a perfect display to your team and make your presentation unforgettable.
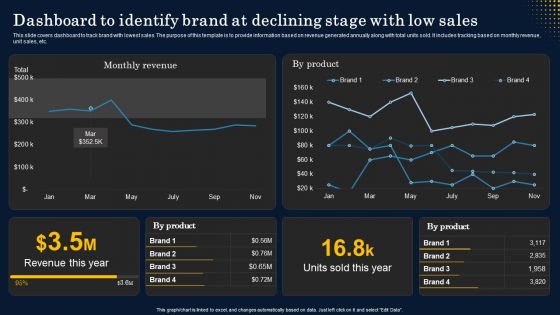
Dashboard To Identify Brand At Declining Stage With Low Sales Demonstration PDF
This slide covers dashboard to track brand with lowest sales. The purpose of this template is to provide information based on revenue generated annually along with total units sold. It includes tracking based on monthly revenue, unit sales, etc. If you are looking for a format to display your unique thoughts, then the professionally designed Dashboard To Identify Brand At Declining Stage With Low Sales Demonstration PDF is the one for you. You can use it as a Google Slides template or a PowerPoint template. Incorporate impressive visuals, symbols, images, and other charts. Modify or reorganize the text boxes as you desire. Experiment with shade schemes and font pairings. Alter, share or cooperate with other people on your work. Download Dashboard To Identify Brand At Declining Stage With Low Sales Demonstration PDF and find out how to give a successful presentation. Present a perfect display to your team and make your presentation unforgettable.
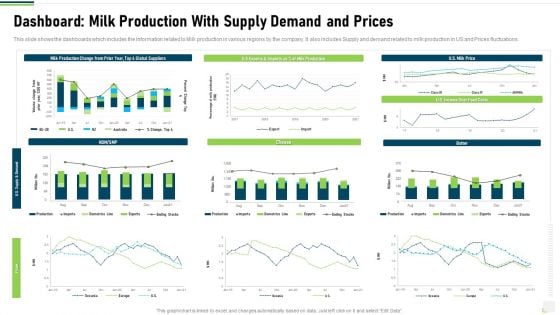
Dashboard Milk Production With Supply Demand And Prices Pictures PDF
This slide shows the dashboards which includes the information related to Milk production in various regions by the company. It also includes Supply and demand related to milk production in US and Prices fluctuations. Deliver an awe inspiring pitch with this creative dashboard milk production with supply demand and prices pictures pdf bundle. Topics like dashboard milk production with supply demand and prices can be discussed with this completely editable template. It is available for immediate download depending on the needs and requirements of the user.

KPI Dashboard To Measurement Brand Equity Microsoft PDF
Mentioned slide highlights multiple metrics which can be used by marketer to measure the brand value. The metrics mentioned in the dashboard are total sales, customer lifetime value, customer adoption rate, customer acquisition cost etc. Pitch your topic with ease and precision using this kpi dashboard to measurement brand equity microsoft pdf. This layout presents information on kpi dashboard to measurement brand equity. It is also available for immediate download and adjustment. So, changes can be made in the color, design, graphics or any other component to create a unique layout.
Supplier Compensation Due Tracking Dashboard With Paid Invoices Topics PDF
This slide showcases dashboard that can help organization to track the outstanding payment of different vendors and take timely action in case of delay. Its key elements are due by age summary, top 5 vendor by purchases, top 5 vendors by amount due and total invoice vs paid invoices. Pitch your topic with ease and precision using this supplier compensation due tracking dashboard with paid invoices topics pdf. This layout presents information on supplier compensation due tracking dashboard with paid invoices. It is also available for immediate download and adjustment. So, changes can be made in the color, design, graphics or any other component to create a unique layout.
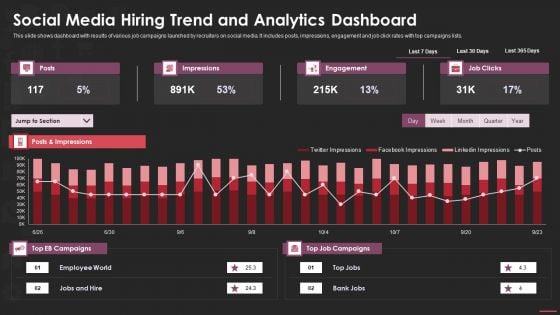
Social Media Hiring Trend And Analytics Dashboard Microsoft PDF
This slide shows dashboard with results of various job campaigns launched by recruiters on social media. It includes posts, impressions, engagement and job click rates with top campaigns lists. Pitch your topic with ease and precision using this social media hiring trend and analytics dashboard microsoft pdf. This layout presents information on social media hiring trend and analytics dashboard. It is also available for immediate download and adjustment. So, changes can be made in the color, design, graphics or any other component to create a unique layout.
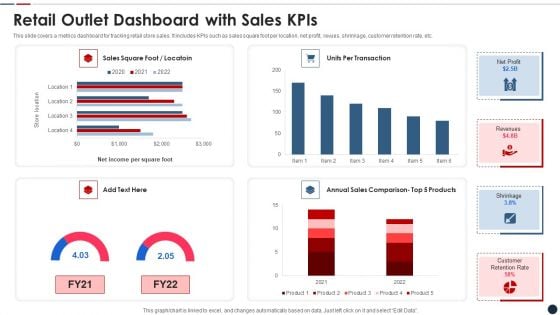
Retail Outlet Dashboard With Sales Kpis Clipart PDF
This slide covers a metrics dashboard for tracking retail store sales. It includes KPIs such as sales square foot per location, net profit, revues, shrinkage, customer retention rate, etc. Pitch your topic with ease and precision using this retail outlet dashboard with sales kpis clipart pdf This layout presents information on Retail outlet dashboard with sales kpis It is also available for immediate download and adjustment. So, changes can be made in the color, design, graphics or any other component to create a unique layout.
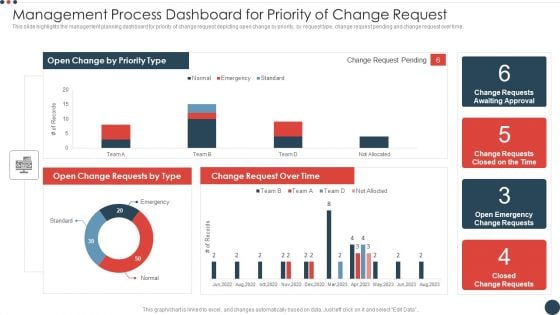
Management Process Dashboard For Priority Of Change Request Demonstration PDF
This slide highlights the management planning dashboard for priority of change request depicting open change by priority, by request type, change request pending and change request over time. Pitch your topic with ease and precision using this management process dashboard for priority of change request demonstration pdf. This layout presents information on management process dashboard for priority of change request. It is also available for immediate download and adjustment. So, changes can be made in the color, design, graphics or any other component to create a unique layout.
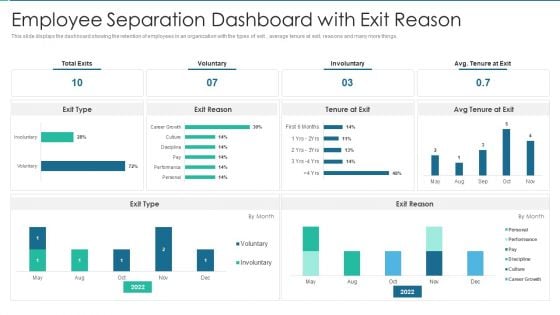
Employee Separation Dashboard With Exit Reason Rules PDF
This slide displays the dashboard showing the retention of employees in an organization with the types of exit , average tenure at exit, reasons and many more things. Pitch your topic with ease and precision using this Employee Separation Dashboard With Exit Reason Rules PDF This layout presents information on Employee Separation Dashboard With Exit Reason It is also available for immediate download and adjustment. So, changes can be made in the color, design, graphics or any other component to create a unique layout.
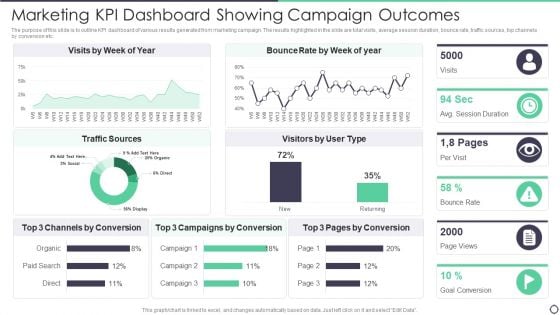
Marketing Kpi Dashboard Showing Campaign Outcomes Pictures PDF
The purpose of this slide is to outline KPI dashboard of various results generated from marketing campaign. The results highlighted in the slide are total visits, average session duration, bounce rate, traffic sources, top channels by conversion etc. Pitch your topic with ease and precision using this Marketing Kpi Dashboard Showing Campaign Outcomes Pictures PDF. This layout presents information on Marketing Kpi Dashboard Showing Campaign Outcomes. It is also available for immediate download and adjustment. So, changes can be made in the color, design, graphics or any other component to create a unique layout.
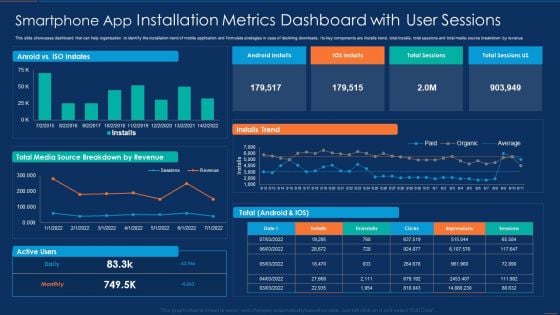
Smartphone App Installation Metrics Dashboard With User Sessions Microsoft PDF
This slide showcases dashboard that can help organization to identify the installation trend of mobile application and formulate strategies in case of declining downloads. Its key components are installs trend, total installs, total sessions and total media source breakdown by revenue. Pitch your topic with ease and precision using this Smartphone App Installation Metrics Dashboard With User Sessions Microsoft PDF. This layout presents information on Smartphone App Installation Metrics Dashboard With User Sessions. It is also available for immediate download and adjustment. So, changes can be made in the color, design, graphics or any other component to create a unique layout.
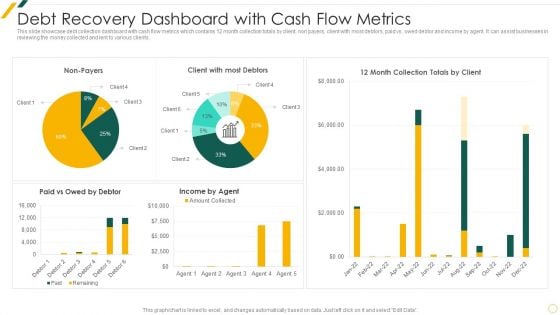
Debt Recovery Dashboard With Cash Flow Metrics Summary PDF
This slide showcase debt collection dashboard with cash flow metrics which contains 12 month collection totals by client, non payers, client with most debtors, paid vs. owed debtor and income by agent. It can assist businesses in reviewing the money collected and lent to various clients.Pitch your topic with ease and precision using this Debt Recovery Dashboard With Cash Flow Metrics Summary PDF This layout presents information on Debt Recovery, Dashboard Cash, Flow Metrics It is also available for immediate download and adjustment. So, changes can be made in the color, design, graphics or any other component to create a unique layout.
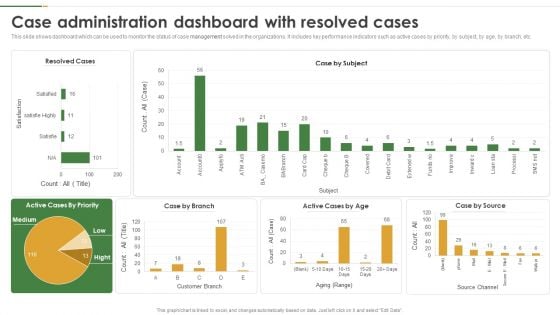
Case Administration Dashboard With Resolved Cases Graphics PDF
This slide shows dashboard which can be used to monitor the status of case management solved in the organizations. It includes key performance indicators such as active cases by priority, by subject, by age, by branch, etc. Pitch your topic with ease and precision using this Case Administration Dashboard With Resolved Cases Graphics PDF. This layout presents information on Case Administration Dashboard, Resolved Cases. It is also available for immediate download and adjustment. So, changes can be made in the color, design, graphics or any other component to create a unique layout.
IT Security Hacker Dashboard For Threat Tracking Rules PDF
This slide depicts the dashboard for threat tracking through cyber security measures and ethical hackers by covering monthly threat status, current risk status, threat-based on the role, threats by owners, risk by threats, and threat report.Deliver an awe inspiring pitch with this creative IT Security Hacker Dashboard For Threat Tracking Rules PDF bundle. Topics like Threat Dashboard, Loss Of Information, Regulations And Contracts can be discussed with this completely editable template. It is available for immediate download depending on the needs and requirements of the user.
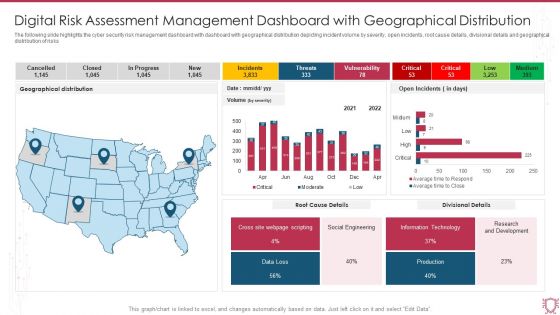
Digital Risk Assessment Management Dashboard With Geographical Distribution Clipart PDF
The following slide highlights the cyber security risk management dashboard with dashboard with geographical distribution depicting incident volume by severity, open incidents, root cause details, divisional details and geographical distribution of risks. Pitch your topic with ease and precision using this Digital Risk Assessment Management Dashboard With Geographical Distribution Clipart PDF. This layout presents information on Geographical Distribution, Root Cause Details, Divisional Details, Social Engineering. It is also available for immediate download and adjustment. So, changes can be made in the color, design, graphics or any other component to create a unique layout.
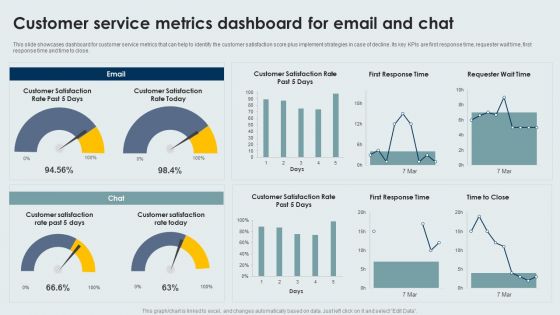
Customer Service Metrics Dashboard For Email And Chat Infographics PDF
This slide showcases dashboard for customer service metrics that can help to identify the customer satisfaction score plus implement strategies in case of decline. Its key KPIs are first response time, requester wait time, first response time and time to close. Pitch your topic with ease and precision using this Customer Service Metrics Dashboard For Email And Chat Infographics PDF. This layout presents information on Customer Service, Metrics Dashboard, Email And Chat. It is also available for immediate download and adjustment. So, changes can be made in the color, design, graphics or any other component to create a unique layout.
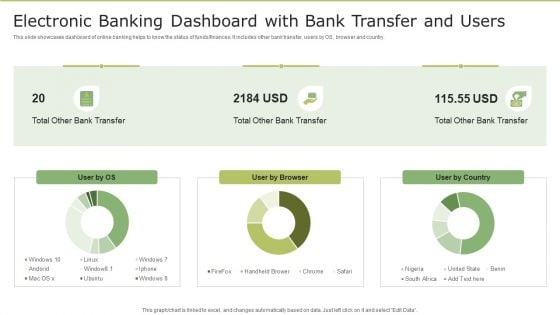
Electronic Banking Dashboard With Bank Transfer And Users Background PDF
This slide showcases dashboard of online banking helps to know the status of funds or finances. It includes other bank transfer, users by OS, browser and country. Pitch your topic with ease and precision using this Electronic Banking Dashboard With Bank Transfer And Users Background PDF. This layout presents information on Electronic Banking Dashboard, Bank Transfer And Users. It is also available for immediate download and adjustment. So, changes can be made in the color, design, graphics or any other component to create a unique layout.
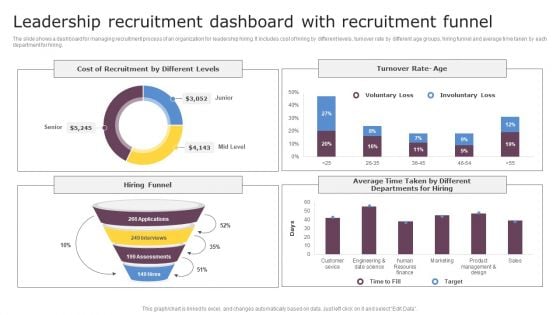
Leadership Recruitment Dashboard With Recruitment Funnel Slides PDF
The slide shows a dashboard for managing recruitment process of an organization for leadership hiring. It includes cost of hiring by different levels, turnover rate by different age groups, hiring funnel and average time taken by each department for hiring. Pitch your topic with ease and precision using this Leadership Recruitment Dashboard With Recruitment Funnel Slides PDF. This layout presents information on Leadership Recruitment, Dashboard With Recruitment. It is also available for immediate download and adjustment. So, changes can be made in the color, design, graphics or any other component to create a unique layout.

Engineering Performance Metrics Dashboard To Track Pull Requests Background PDF
This slide covers engineering KPI dashboard to track pull request. It involves KPIs such as open time of average pull requests, average comment received, revision rounds, frequency of posting pull requests. Pitch your topic with ease and precision using this Engineering Performance Metrics Dashboard To Track Pull Requests Background PDF. This layout presents information on Dashboard Track Pull Requests, Engineering Performance Metrics. It is also available for immediate download and adjustment. So, changes can be made in the color, design, graphics or any other component to create a unique layout.
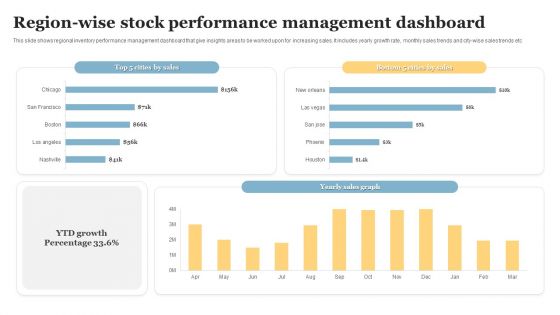
Region Wise Stock Performance Management Dashboard Introduction PDF
This slide shows regional inventory performance management dashboard that give insights areas to be worked upon for increasing sales. It includes yearly growth rate, monthly sales trends and city wise sales trends etc. Pitch your topic with ease and precision using this Region Wise Stock Performance Management Dashboard Introduction PDF. This layout presents information on Stock Performance, Management Dashboard. It is also available for immediate download and adjustment. So, changes can be made in the color, design, graphics or any other component to create a unique layout.
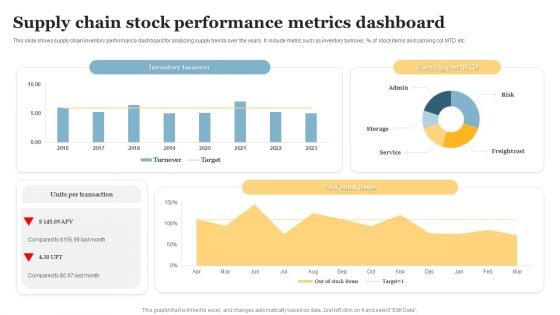
Supply Chain Stock Performance Metrics Dashboard Mockup PDF
This slide shows supply chain inventory performance dashboard for analyzing supply trends over the years. It include metric such as inventory turnover, Percent of stock items and carrying cot MTD etc . Pitch your topic with ease and precision using this Supply Chain Stock Performance Metrics Dashboard Mockup PDF. This layout presents information on Supply Chain Stock, Performance Metrics Dashboard. It is also available for immediate download and adjustment. So, changes can be made in the color, design, graphics or any other component to create a unique layout.
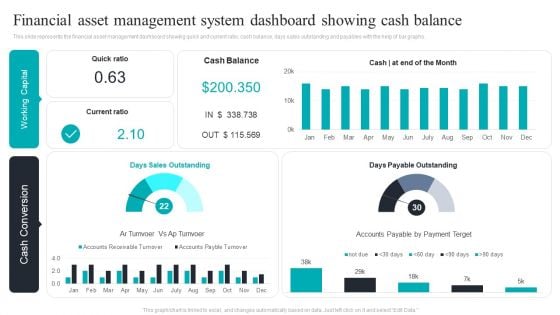
Financial Asset Management System Dashboard Showing Cash Balance Download PDF
This slide represents the financial asset management dashboard showing quick and current ratio, cash balance, days sales outstanding and payables with the help of bar graphs. Pitch your topic with ease and precision using this Financial Asset Management System Dashboard Showing Cash Balance Download PDF. This layout presents information on Financial Asset, Management System, Dashboard Showing, Cash Balance. It is also available for immediate download and adjustment. So, changes can be made in the color, design, graphics or any other component to create a unique layout.

Consumer Risk Assessment Dashboard Reporting Ppt Layouts Ideas PDF
This slide showcases the customer risk assessment dashboard with major kpis. It includes reporting risks summary, risk mitigation, risk profile, and detail. It also reflects the risk score and score distribution across different areas and activities. Pitch your topic with ease and precision using this Consumer Risk Assessment Dashboard Reporting Ppt Layouts Ideas PDF. This layout presents information on Risk Summary, Customer Risk Dashboard, Risk Profile. It is also available for immediate download and adjustment. So, changes can be made in the color, design, graphics or any other component to create a unique layout.
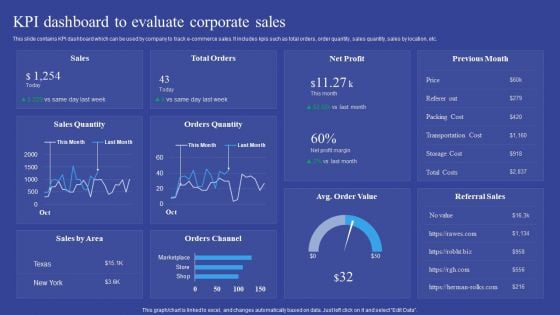
KPI Dashboard To Evaluate Corporate Sales Introduction PDF
This slide contains KPI dashboard which can be used by company to track e-commerce sales. It includes kpis such as total orders, order quantity, sales quantity, sales by location, etc. Pitch your topic with ease and precision using this KPI Dashboard To Evaluate Corporate Sales Introduction PDF. This layout presents information on KPI Dashboard, Evaluate Corporate Sales. It is also available for immediate download and adjustment. So, changes can be made in the color, design, graphics or any other component to create a unique layout.
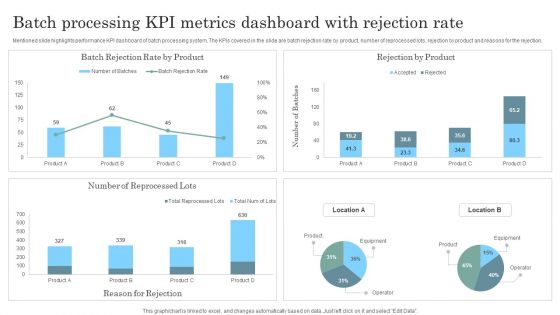
Batch Processing KPI Metrics Dashboard With Rejection Rate Topics PDF
Mentioned slide highlights performance KPI dashboard of batch processing system. The KPIs covered in the slide are batch rejection rate by product, number of reprocessed lots, rejection by product and reasons for the rejection. Pitch your topic with ease and precision using this Batch Processing KPI Metrics Dashboard With Rejection Rate Topics PDF. This layout presents information on Batch Processing KPI Metrics, Dashboard Rejection Rate. It is also available for immediate download and adjustment. So, changes can be made in the color, design, graphics or any other component to create a unique layout.
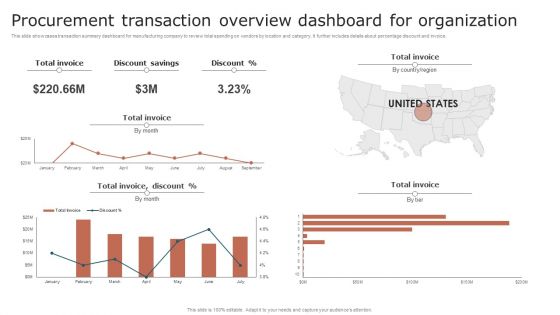
Procurement Transaction Overview Dashboard For Organization Background PDF
This slide showcases transaction summary dashboard for manufacturing company to review total spending on vendors by location and category. It further includes details about percentage discount and invoice. Pitch your topic with ease and precision using this Procurement Transaction Overview Dashboard For Organization Background PDF. This layout presents information on Procurement Transaction, Overview Dashboard For Organization. It is also available for immediate download and adjustment. So, changes can be made in the color, design, graphics or any other component to create a unique layout.
Optimize Brand Valuation Product Branding Performance Tracking Dashboard Background PDF
This slide provides information regarding product branding performance tracking dashboard in terms of revenues, new customers, customer satisfaction rate. Create an editable Optimize Brand Valuation Product Branding Performance Tracking Dashboard Background PDF that communicates your idea and engages your audience. Whether you are presenting a business or an educational presentation, pre-designed presentation templates help save time. Optimize Brand Valuation Product Branding Performance Tracking Dashboard Background PDF is highly customizable and very easy to edit, covering many different styles from creative to business presentations. Slidegeeks has creative team members who have crafted amazing templates. So, go and get them without any delay.
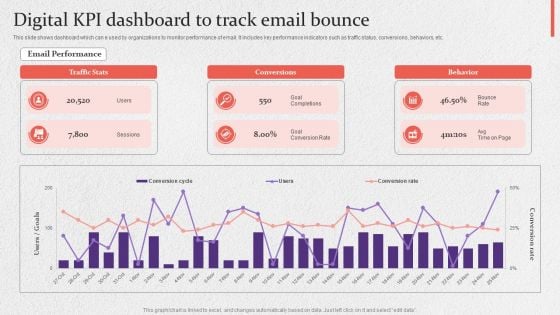
Digital KPI Dashboard To Track Email Bounce Slides PDF
This slide shows dashboard which can e used by organizations to monitor performance of email. It includes key performance indicators such as traffic status, conversions, behaviors, etc. Pitch your topic with ease and precision using this Digital KPI Dashboard To Track Email Bounce Slides PDF. This layout presents information on Digital Kpi Dashboard, Track Email Bounce. It is also available for immediate download and adjustment. So, changes can be made in the color, design, graphics or any other component to create a unique layout.
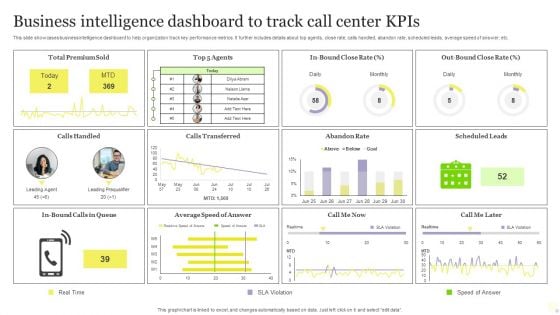
Business Intelligence Dashboard To Track Call Center Kpis Download PDF
This slide showcases business intelligence dashboard to help organization track key performance metrics. It further includes details about top agents, close rate, calls handled, abandon rate, scheduled leads, average speed of answer, etc. Pitch your topic with ease and precision using this Business Intelligence Dashboard To Track Call Center Kpis Download PDF. This layout presents information on Business Intelligence Dashboard, Track Call Center Kpis. It is also available for immediate download and adjustment. So, changes can be made in the color, design, graphics or any other component to create a unique layout.
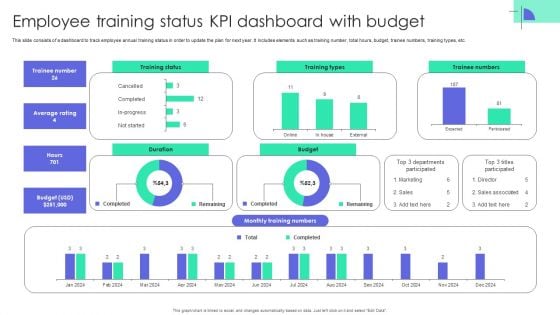
Employee Training Status KPI Dashboard With Budget Summary PDF
This slide consists of a dashboard to track employee annual training status in order to update the plan for next year. It includes elements such as training number, total hours, budget, trainee numbers, training types, etc. Pitch your topic with ease and precision using this Employee Training Status KPI Dashboard With Budget Summary PDF. This layout presents information on Employee Training Status, KPI Dashboard With Budget. It is also available for immediate download and adjustment. So, changes can be made in the color, design, graphics or any other component to create a unique layout.
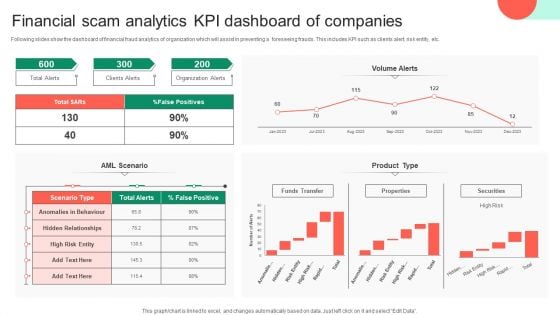
Financial Scam Analytics KPI Dashboard Of Companies Clipart PDF
Following slides show the dashboard of financial fraud analytics of organization which will assist in preventing a foreseeing frauds. This includes KPI such as clients alert, risk entity, etc. Pitch your topic with ease and precision using this Financial Scam Analytics KPI Dashboard Of Companies Clipart PDF. This layout presents information on Financial Scam Analytics, Kpi Dashboard Of Companies. It is also available for immediate download and adjustment. So, changes can be made in the color, design, graphics or any other component to create a unique layout.
Tracking Expenditure Incurred On Cloud Deployment Dashboard Download PDF
The following slide highlights cloud implementation expenditure dashboard to determine overspend, unused resources, plan future costs, available discounts, customization options etc. It includes components such as cloud native, software, departments, cost centre etc. Pitch your topic with ease and precision using this Tracking Expenditure Incurred On Cloud Deployment Dashboard Download PDF. This layout presents information on Dashboard, Tracking, Deployment. It is also available for immediate download and adjustment. So, changes can be made in the color, design, graphics or any other component to create a unique layout.
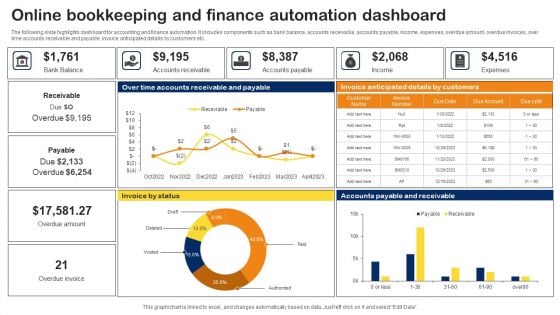
Online Bookkeeping And Finance Automation Dashboard Topics PDF
The following slide highlights dashboard for accounting and finance automation. It includes components such as bank balance, accounts receivable, accounts payable, income, expenses, overdue amount, overdue invoices, over time accounts receivable and payable, invoice anticipated details by customers etc. Pitch your topic with ease and precision using this Online Bookkeeping And Finance Automation Dashboard Topics PDF. This layout presents information on Online Bookkeeping, Finance Automation Dashboard. It is also available for immediate download and adjustment. So, changes can be made in the color, design, graphics or any other component to create a unique layout.
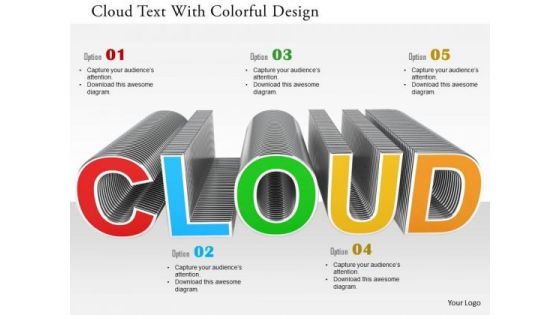
Stock Photo Cloud Text With Colorful Design PowerPoint Slide
This power point image template has been designed with graphic of cloud text with colorful design. This PPT contains the concept of cloud technology. Use this image template for your cloud technology and business related presentations.
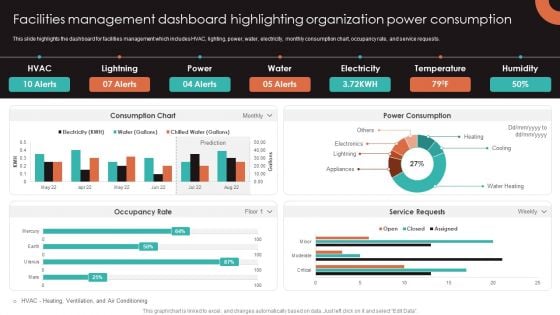
Facilities Management Dashboard Highlighting Organization Power Consumption Background PDF
This slide highlights the dashboard for facilities management which includes HVAC, lighting, power, water, electricity, monthly consumption chart, occupancy rate, and service requests. This Facilities Management Dashboard Highlighting Organization Power Consumption Background PDF from Slidegeeks makes it easy to present information on your topic with precision. It provides customization options, so you can make changes to the colors, design, graphics, or any other component to create a unique layout. It is also available for immediate download, so you can begin using it right away. Slidegeeks has done good research to ensure that you have everything you need to make your presentation stand out. Make a name out there for a brilliant performance.
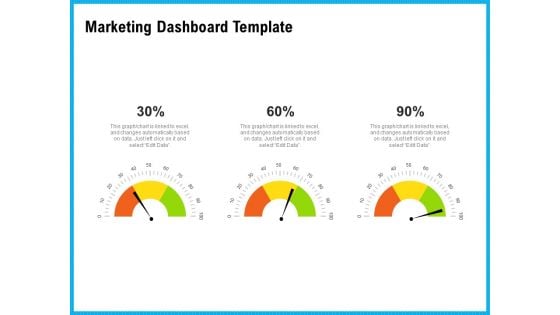
Requirement Gathering Techniques Marketing Dashboard Template Inspiration PDF
Deliver and pitch your topic in the best possible manner with this requirement gathering techniques marketing dashboard template inspiration pdf. Use them to share invaluable insights on marketing dashboard template and impress your audience. This template can be altered and modified as per your expectations. So, grab it now.
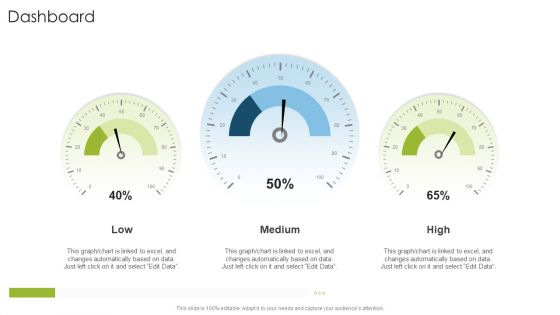
Dashboard Organizational Strategies And Promotion Techniques Brochure PDF
Deliver an awe inspiring pitch with this creative dashboard organizational strategies and promotion techniques brochure pdf bundle. Topics like dashboard can be discussed with this completely editable template. It is available for immediate download depending on the needs and requirements of the user.
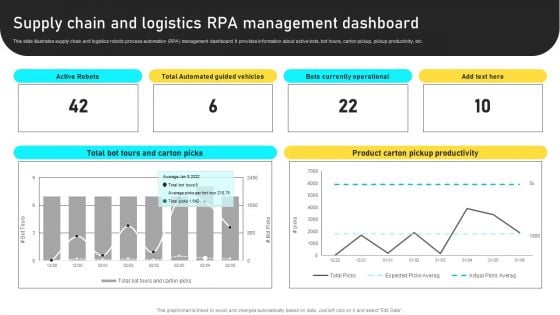
Manufacturing Process Automation For Enhancing Productivity Supply Chain And Logistics RPA Management Dashboard Diagrams PDF
This slide illustrates supply chain and logistics robotic process automation RPA management dashboard. It provides information about active bots, bot hours, carton pickup, pickup productivity, etc. Present like a pro with Manufacturing Process Automation For Enhancing Productivity Supply Chain And Logistics RPA Management Dashboard Diagrams PDF Create beautiful presentations together with your team, using our easy to use presentation slides. Share your ideas in real time and make changes on the fly by downloading our templates. So whether you are in the office, on the go, or in a remote location, you can stay in sync with your team and present your ideas with confidence. With Slidegeeks presentation got a whole lot easier. Grab these presentations today.
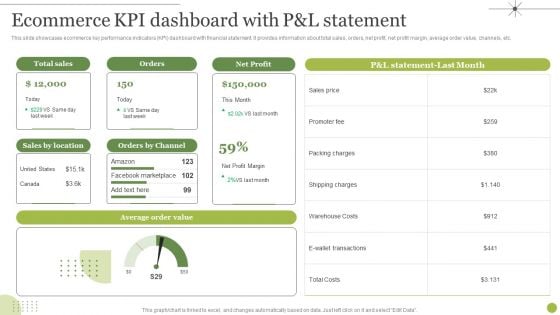
Managing E Commerce Business Accounting Ecommerce KPI Dashboard With P And L Statement Diagrams PDF
This slide showcases ecommerce key performance indicators KPI dashboard with financial statement. It provides information about total sales, orders, net profit, net profit margin, average order value, channels, etc. Present like a pro with Managing E Commerce Business Accounting Ecommerce KPI Dashboard With P And L Statement Diagrams PDF Create beautiful presentations together with your team, using our easy to use presentation slides. Share your ideas in real time and make changes on the fly by downloading our templates. So whether you are in the office, on the go, or in a remote location, you can stay in sync with your team and present your ideas with confidence. With Slidegeeks presentation got a whole lot easier. Grab these presentations today.
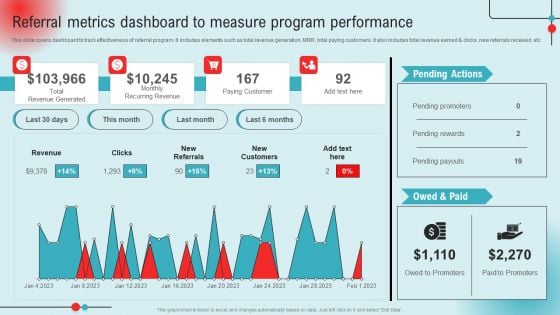
Referral Metrics Dashboard To Measure Program Performance Ppt PowerPoint Presentation Diagram Lists PDF
This slide covers dashboard to track effectiveness of referral program. It includes elements such as total revenue generation, MRR, total paying customers. It also includes total revenue earned and clicks, new referrals received, etc. This Referral Metrics Dashboard To Measure Program Performance Ppt PowerPoint Presentation Diagram Lists PDF from Slidegeeks makes it easy to present information on your topic with precision. It provides customization options, so you can make changes to the colors, design, graphics, or any other component to create a unique layout. It is also available for immediate download, so you can begin using it right away. Slidegeeks has done good research to ensure that you have everything you need to make your presentation stand out. Make a name out there for a brilliant performance.
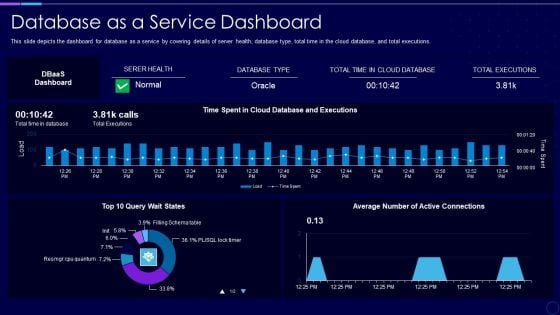
Everything As A Service Xaas For Cloud Computing IT Database As A Service Dashboard Microsoft PDF
This slide depicts the dashboard for database as a service by covering details of server health, database type, total time in the cloud database, and total executions. Deliver an awe inspiring pitch with this creative everything as a service xaas for cloud computing it database as a service dashboard microsoft pdf bundle. Topics like database as a service dashboard can be discussed with this completely editable template. It is available for immediate download depending on the needs and requirements of the user.
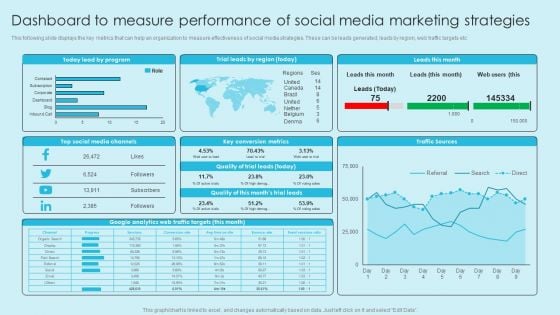
Online Marketing Techniques For Acquiring Clients Dashboard To Measure Performance Of Social Media Guidelines PDF
This following slide displays the key metrics that can help an organization to measure effectiveness of e commerce strategies. These can be revenue generated using e-commerce platform, conversion rates etc. This Online Marketing Techniques For Acquiring Clients Dashboard To Measure Performance Of Social Media Guidelines PDF from Slidegeeks makes it easy to present information on your topic with precision. It provides customization options, so you can make changes to the colors, design, graphics, or any other component to create a unique layout. It is also available for immediate download, so you can begin using it right away. Slidegeeks has done good research to ensure that you have everything you need to make your presentation stand out. Make a name out there for a brilliant performance.

Pictures Of Business Men 3d Green Man With Wrench PowerPoint Templates Ppt Backgrounds For Slides
We present our pictures of business men 3d green man with wrench PowerPoint templates PPT backgrounds for slides.Download and present our Business PowerPoint Templates because our PowerPoint Templates and Slides will give your ideas the shape. Download our People PowerPoint Templates because Our PowerPoint Templates and Slides will give you great value for your money. Be assured of finding the best projection to highlight your words. Use our Technology PowerPoint Templates because Our PowerPoint Templates and Slides help you pinpoint your timelines. Highlight the reasons for your deadlines with their use. Present our Success PowerPoint Templates because Our PowerPoint Templates and Slides will Activate the energies of your audience. Get their creative juices flowing with your words. Use our Services PowerPoint Templates because Our PowerPoint Templates and Slides will steer your racing mind. Hit the right buttons and spur on your audience.Use these PowerPoint slides for presentations relating to 3d, abstract, architect, background, builder, business, cartoon, character, concept, construction, engineer, equipment, figure, fix, green, guy, hat, help, human, icon, idea, illustration, mechanic, people, presentation, professional, puppet, render, repair, repairman, screwdriver, service, spanner, steel, support, technician, technology, tool, work, worker, wrench. The prominent colors used in the PowerPoint template are Green, Yellow, White. Run the show with our Pictures Of Business Men 3d Green Man With Wrench PowerPoint Templates Ppt Backgrounds For Slides. You will come out on top.
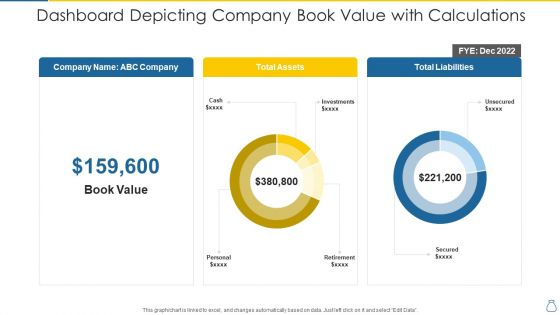
Dashboard Depicting Company Book Value With Calculations Microsoft PDF
Pitch your topic with ease and precision using this dashboard depicting company book value with calculations microsoft pdf. This layout presents information on cash, investments, personal, retirement, secured. It is also available for immediate download and adjustment. So, changes can be made in the color, design, graphics or any other component to create a unique layout.
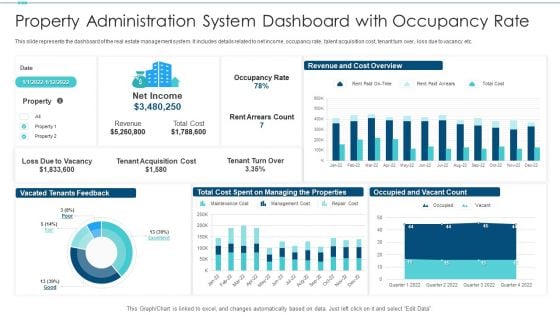
Property Administration System Dashboard With Occupancy Rate Infographics PDF
Pitch your topic with ease and precision using this property administration system dashboard with occupancy rate infographics pdf. This layout presents information on revenue, cost, occupancy rate. It is also available for immediate download and adjustment. So, changes can be made in the color, design, graphics or any other component to create a unique layout.
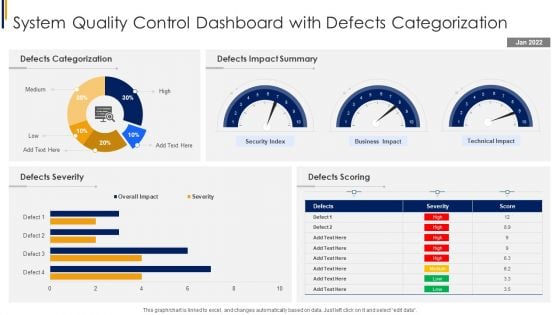
System Quality Control Dashboard With Defects Categorization Download PDF
Pitch your topic with ease and precision using this System Quality Control Dashboard With Defects Categorization Download PDF. This layout presents information on Defects Categorization, Defects Severity, Defects Scoring. It is also available for immediate download and adjustment. So, changes can be made in the color, design, graphics or any other component to create a unique layout.
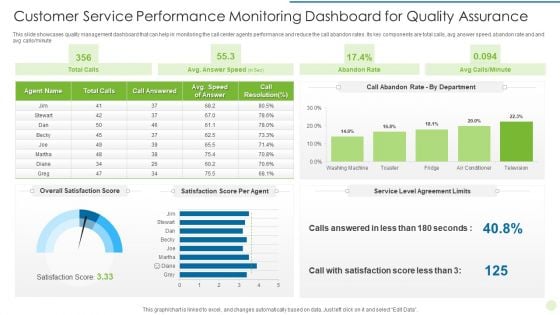
Customer Service Performance Monitoring Dashboard For Quality Assurance Professional PDF
Pitch your topic with ease and precision using this Customer Service Performance Monitoring Dashboard For Quality Assurance Professional PDF This layout presents information on Overall Satisfaction Score, Satisfaction Score Per Agent, Answered In Less It is also available for immediate download and adjustment. So, changes can be made in the color, design, graphics or any other component to create a unique layout.
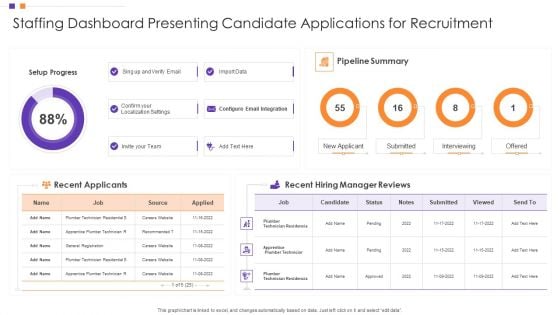
Staffing Dashboard Presenting Candidate Applications For Recruitment Elements PDF
Pitch your topic with ease and precision using this Staffing Dashboard Presenting Candidate Applications For Recruitment Elements PDF This layout presents information on Recent Hiring Manager Reviews, Pipeline Summary, Plumber Technician Residencia It is also available for immediate download and adjustment. So, changes can be made in the color, design, graphics or any other component to create a unique layout.
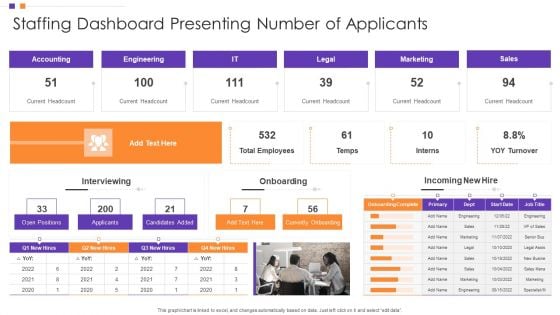
Staffing Dashboard Presenting Number Of Applicants Template PDF
Pitch your topic with ease and precision using this Staffing Dashboard Presenting Number Of Applicants Template PDF This layout presents information on Currently Onboarding, Current Headcount, Open Positions It is also available for immediate download and adjustment. So, changes can be made in the color, design, graphics or any other component to create a unique layout.

 Home
Home