Data Analysis Icon
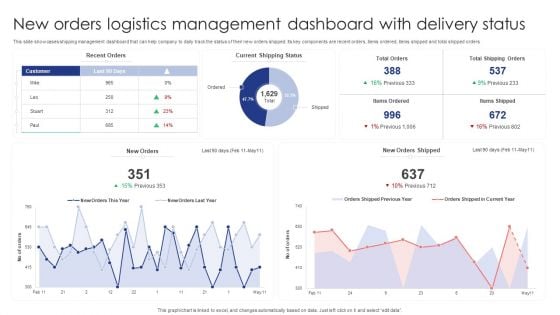
New Orders Logistics Management Dashboard With Delivery Status Designs PDF
This slide showcases shipping management dashboard that can help company to daily track the status of their new orders shipped. Its key components are recent orders, items ordered, items shipped and total shipped orders. Pitch your topic with ease and precision using this New Orders Logistics Management Dashboard With Delivery Status Designs PDF. This layout presents information on Recent Orders, Current Shipping Status, New Orders. It is also available for immediate download and adjustment. So, changes can be made in the color, design, graphics or any other component to create a unique layout.
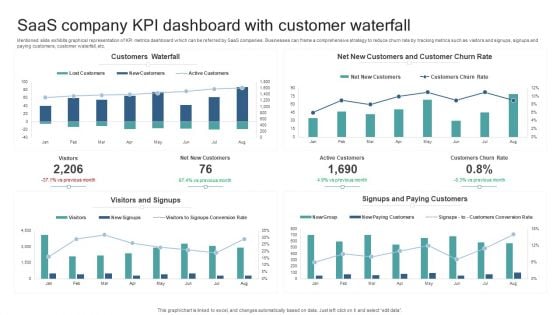
Saas Company KPI Dashboard With Customer Waterfall Slides PDF
Mentioned slide exhibits graphical representation of KPI metrics dashboard which can be referred by SaaS companies. Businesses can frame a comprehensive strategy to reduce churn rate by tracking metrics such as visitors and signups, signups and paying customers, customer waterfall, etc. Pitch your topic with ease and precision using this Saas Company KPI Dashboard With Customer Waterfall Slides PDF. This layout presents information on Customers Waterfall, Visitors And Signups, Signups And Paying Customers. It is also available for immediate download and adjustment. So, changes can be made in the color, design, graphics or any other component to create a unique layout.
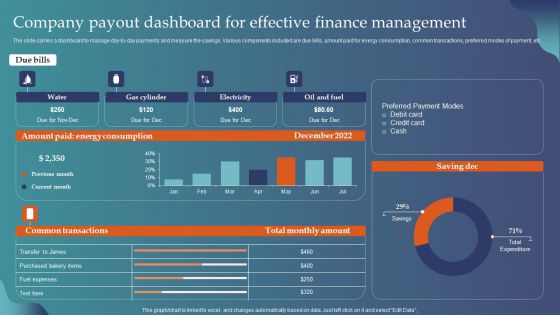
Company Payout Dashboard For Effective Finance Management Introduction PDF
The slide carries a dashboard to manage day-to-day payments and measure the savings. Various components included are due bills, amount paid for energy consumption, common transactions, preferred modes of payment, etc. Pitch your topic with ease and precision using this Company Payout Dashboard For Effective Finance Management Introduction PDF. This layout presents information on Electricity, Oil And Fuel, Gas Cylinder. It is also available for immediate download and adjustment. So, changes can be made in the color, design, graphics or any other component to create a unique layout.

Automated Supplier Relationship Management Risk Assessment Dashboard Showing Template PDF
This slide delineates risk assessment dashboard which can help vendor managers in assessing procurement contract status. It includes information about suppliers, renewals, actions, assessment status, concentration, etc. Slidegeeks is one of the best resources for PowerPoint templates. You can download easily and regulate Automated Supplier Relationship Management Risk Assessment Dashboard Showing Template PDF for your personal presentations from our wonderful collection. A few clicks is all it takes to discover and get the most relevant and appropriate templates. Use our Templates to add a unique zing and appeal to your presentation and meetings. All the slides are easy to edit and you can use them even for advertisement purposes.
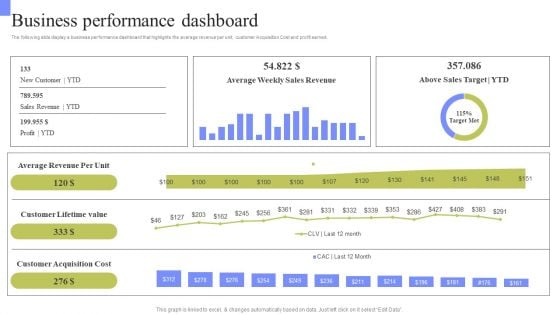
Periodic Revenue Model Business Performance Dashboard Rules PDF
The following slide display a business performance dashboard that highlights the average revenue per unit, customer Acquisition Cost and profit earned. This Periodic Revenue Model Business Performance Dashboard Rules PDF from Slidegeeks makes it easy to present information on your topic with precision. It provides customization options, so you can make changes to the colors, design, graphics, or any other component to create a unique layout. It is also available for immediate download, so you can begin using it right away. Slidegeeks has done good research to ensure that you have everything you need to make your presentation stand out. Make a name out there for a brilliant performance.
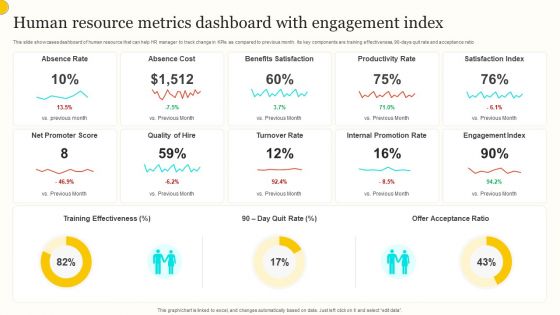
Human Resource Metrics Dashboard With Engagement Index Guidelines PDF
This slide showcases dashboard of human resource that can help HR manager to track change in KPIs as compared to previous month. Its key components are training effectiveness, 90 days quit rate and acceptance ratio. Pitch your topic with ease and precision using this Human Resource Metrics Dashboard With Engagement Index Guidelines PDF. This layout presents information on Absence Rate, Absence Cost, Benefits Satisfaction. It is also available for immediate download and adjustment. So, changes can be made in the color, design, graphics or any other component to create a unique layout.

Enterprise Recruitment Dashboard With Cost Per Hire Graphics PDF
The following slide showcases KPI dashboard to get real- time insights about efficiency of corporate staffing process in the organization. It includes elements such as hired, days to fill, sources contribution, etc. Pitch your topic with ease and precision using this Enterprise Recruitment Dashboard With Cost Per Hire Graphics PDF. This layout presents information on Enterprise, Contribution, Cost. It is also available for immediate download and adjustment. So, changes can be made in the color, design, graphics or any other component to create a unique layout.
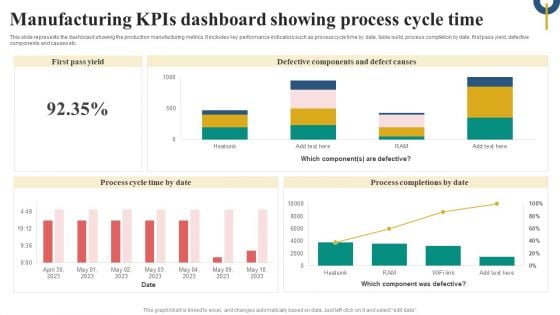
Manufacturing Kpis Dashboard Showing Process Cycle Time Microsoft PDF
This slide represents the dashboard showing the production manufacturing metrics. It includes key performance indicators such as process cycle time by date, table build, process completion by date, first pass yield, defective components and causes etc. Pitch your topic with ease and precision using this Manufacturing Kpis Dashboard Showing Process Cycle Time Microsoft PDF. This layout presents information on Defective Components Defect Causes, Process Cycle, Time By Date, Process Completions By Date. It is also available for immediate download and adjustment. So, changes can be made in the color, design, graphics or any other component to create a unique layout.
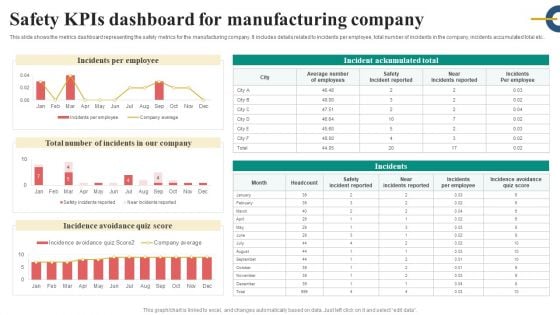
Safety Kpis Dashboard For Manufacturing Company Slides PDF
This slide shows the metrics dashboard representing the safety metrics for the manufacturing company. It includes details related to incidents per employee, total number of incidents in the company, incidents accumulated total etc.. Pitch your topic with ease and precision using this Safety Kpis Dashboard For Manufacturing Company Slides PDF. This layout presents information on Incidents Per Employee, Safety Incident Reported, Incidence Avoidance Quiz Score. It is also available for immediate download and adjustment. So, changes can be made in the color, design, graphics or any other component to create a unique layout.
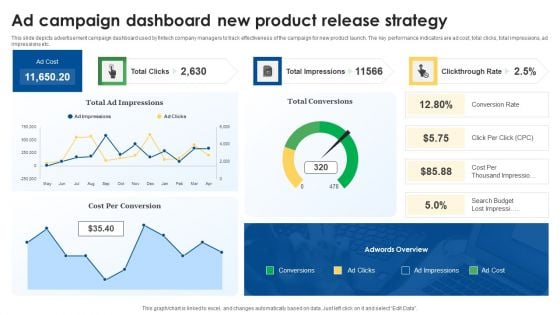
Ad Campaign Dashboard New Product Release Strategy Guidelines PDF
This slide depicts advertisement campaign dashboard used by fintech company managers to track effectiveness of the campaign for new product launch. The key performance indicators are ad cost, total clicks, total impressions, ad impressions etc. Pitch your topic with ease and precision using this Ad Campaign Dashboard New Product Release Strategy Guidelines PDF. This layout presents information on Impressions, Conversion, Strategy. It is also available for immediate download and adjustment. So, changes can be made in the color, design, graphics or any other component to create a unique layout.
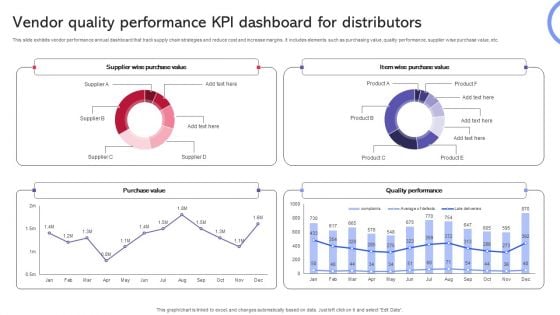
Vendor Quality Performance KPI Dashboard For Distributors Template PDF
This slide exhibits vendor performance annual dashboard that track supply chain strategies and reduce cost and increase margins. It includes elements such as purchasing value, quality performance, supplier wise purchase value, etc. Pitch your topic with ease and precision using this Vendor Quality Performance KPI Dashboard For Distributors Template PDF. This layout presents information on Purchase Value, Quality Performance, Supplier Wise Purchase Value. It is also available for immediate download and adjustment. So, changes can be made in the color, design, graphics or any other component to create a unique layout.
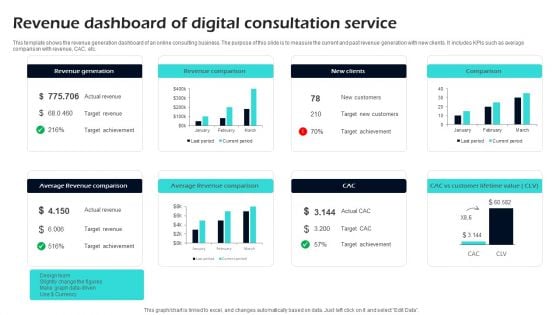
Revenue Dashboard Of Digital Consultation Service Ppt Designs
This template shows the revenue generation dashboard of an online consulting business. The purpose of this slide is to measure the current and past revenue generation with new clients. It includes KPIs such as average comparison with revenue, CAC, etc. Pitch your topic with ease and precision using this Revenue Dashboard Of Digital Consultation Service Ppt Designs. This layout presents information on Revenue, Digital, Consultation. It is also available for immediate download and adjustment. So, changes can be made in the color, design, graphics or any other component to create a unique layout.
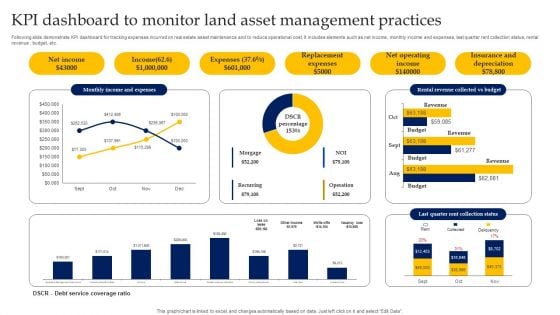
KPI Dashboard To Monitor Land Asset Management Practices Clipart PDF
Following slide demonstrate KPI dashboard for tracking expenses incurred on real estate asset maintenance and to reduce operational cost. It includes elements such as net income, monthly income and expenses, last quarter rent collection status, rental revenue , budget, etc. Pitch your topic with ease and precision using this KPI Dashboard To Monitor Land Asset Management Practices Clipart PDF. This layout presents information on Revenue, Budget, Income. It is also available for immediate download and adjustment. So, changes can be made in the color, design, graphics or any other component to create a unique layout.
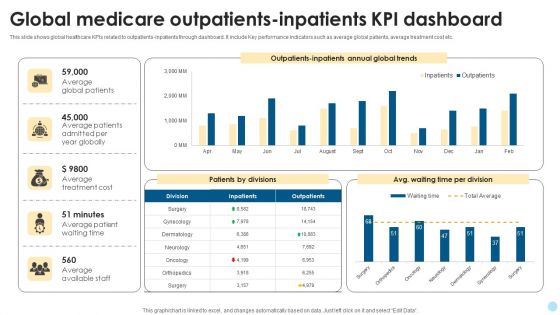
Global Medicare Outpatients Inpatients Kpi Dashboard Template PDF
This slide shows global healthcare KPIs related to outpatients-inpatients through dashboard. It include Key performance indicators such as average global patients, average treatment cost etc. Pitch your topic with ease and precision using this Global Medicare Outpatients Inpatients Kpi Dashboard Template PDF. This layout presents information on Average Treatment Cost, Average Global Patients, Average Available Staff. It is also available for immediate download and adjustment. So, changes can be made in the color, design, graphics or any other component to create a unique layout.
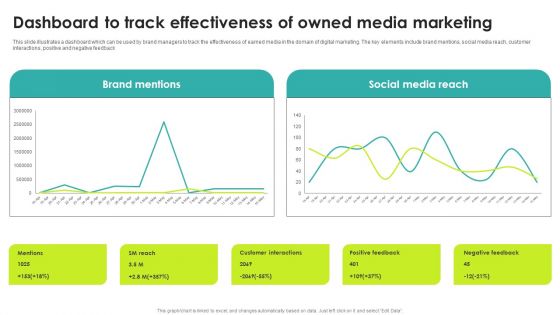
Dashboard To Track Effectiveness Of Owned Media Marketing Structure PDF
This slide illustrates a dashboard which can be used by brand managers to track the effectiveness of earned media in the domain of digital marketing. The key elements include brand mentions, social media reach, customer interactions, positive and negative feedback Pitch your topic with ease and precision using this Dashboard To Track Effectiveness Of Owned Media Marketing Structure PDF. This layout presents information on Brand Mentions, Social Media, Marketing. It is also available for immediate download and adjustment. So, changes can be made in the color, design, graphics or any other component to create a unique layout.
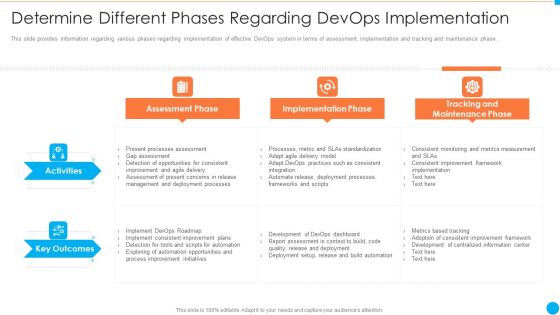
Determine Different Phases Regarding Devops Implementation IT Infrastructure By Executing Devops Approach Rules PDF
This slide provides information regarding various phases regarding implementation of effective DevOps system in terms of assessment, implementation and tracking and maintenance phase. This is a determine different phases regarding devops implementation it infrastructure by executing devops approach rules pdf template with various stages. Focus and dispense information on three stages using this creative set, that comes with editable features. It contains large content boxes to add your information on topics like assessment phase, implementation phase, tracking and maintenance phase. You can also showcase facts, figures, and other relevant content using this PPT layout. Grab it now.
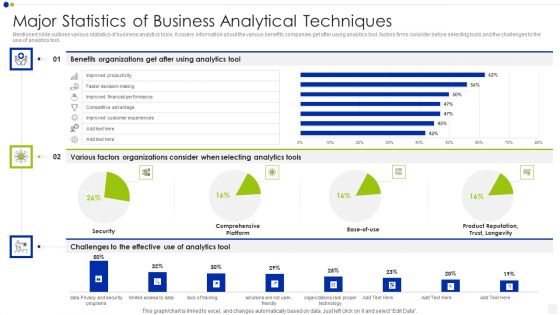
Major Statistics Of Business Analytical Techniques Infographics PDF
Mentioned slide outlines various statistics of business analytics tools. It covers information about the various benefits companies get after using analytics tool, factors firms consider before selecting tools and the challenges to the use of analytics tool. Showcasing this set of slides titled major statistics of business analytical techniques infographics pdf. The topics addressed in these templates are security, analytics, organizations. All the content presented in this PPT design is completely editable. Download it and make adjustments in color, background, font etc. as per your unique business setting.
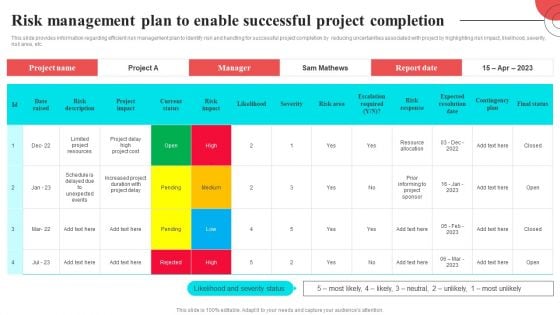
Risk Management Plan To Enable Successful Project Completion Diagrams PDF
This slide provides information regarding efficient risk management plan to identify risk and handling for successful project completion by reducing uncertainties associated with project by highlighting risk impact, likelihood, severity, risk area, etc. Slidegeeks is here to make your presentations a breeze with Risk Management Plan To Enable Successful Project Completion Diagrams PDF With our easy to use and customizable templates, you can focus on delivering your ideas rather than worrying about formatting. With a variety of designs to choose from, you are sure to find one that suits your needs. And with animations and unique photos, illustrations, and fonts, you can make your presentation pop. So whether you are giving a sales pitch or presenting to the board, make sure to check out Slidegeeks first.
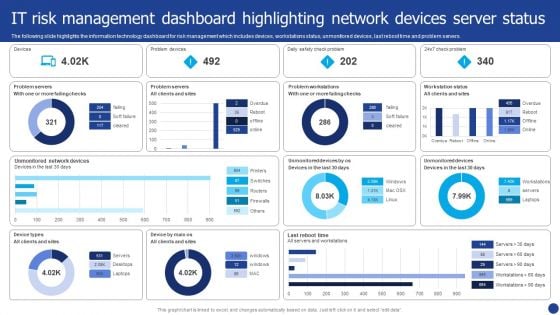
IT Risk Management Dashboard Highlighting Network Devices Server Status Rules PDF
The following slide highlights the information technology dashboard for risk management which includes devices, workstations status, unmonitored devices, last reboot time and problem servers. Deliver and pitch your topic in the best possible manner with this IT Risk Management Dashboard Highlighting Network Devices Server Status Rules PDF. Use them to share invaluable insights on IT Risk Management, Dashboard Highlighting Network, Devices Server Status and impress your audience. This template can be altered and modified as per your expectations. So, grab it now.
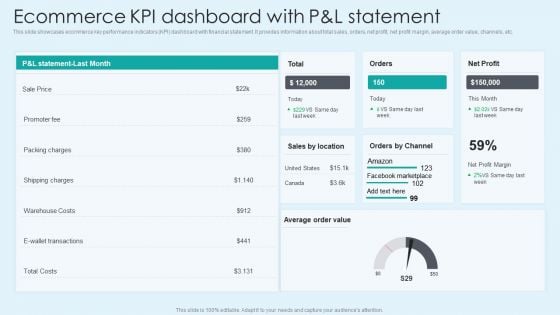
Ecommerce KPI Dashboard With Pand L Statement Download PDF
This slide showcases ecommerce key performance indicators KPI dashboard with financial statement. It provides information about total sales, orders, net profit, net profit margin, average order value, channels, etc. This Ecommerce KPI Dashboard With Pand L Statement Download PDF from Slidegeeks makes it easy to present information on your topic with precision. It provides customization options, so you can make changes to the colors, design, graphics, or any other component to create a unique layout. It is also available for immediate download, so you can begin using it right away. Slidegeeks has done good research to ensure that you have everything you need to make your presentation stand out. Make a name out there for a brilliant performance.
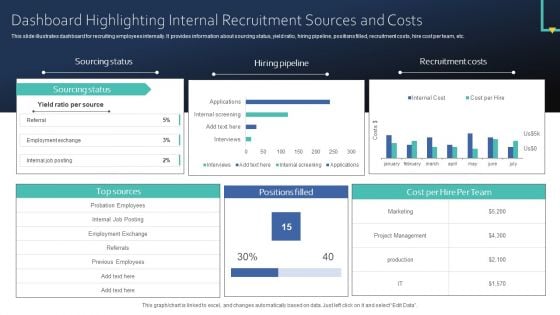
Dashboard Highlighting Internal Recruitment Sources And Costs Portrait PDF
This slide illustrates dashboard for recruiting employees internally. It provides information about sourcing status, yield ratio, hiring pipeline, positions filled, recruitment costs, hire cost per team, etc. This Dashboard Highlighting Internal Recruitment Sources And Costs Portrait PDF from Slidegeeks makes it easy to present information on your topic with precision. It provides customization options, so you can make changes to the colors, design, graphics, or any other component to create a unique layout. It is also available for immediate download, so you can begin using it right away. Slidegeeks has done good research to ensure that you have everything you need to make your presentation stand out. Make a name out there for a brilliant performance.
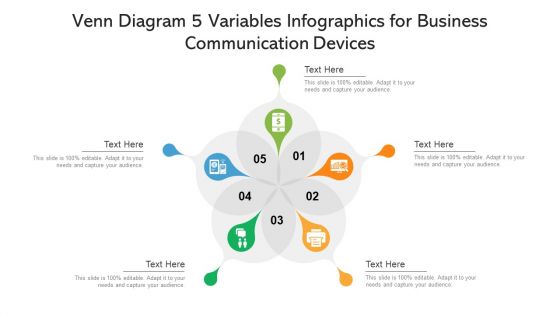
Venn Diagram 5 Variables Infographics For Business Communication Devices Ppt PowerPoint Presentation Gallery Information PDF
Presenting venn diagram 5 variables infographics for business communication devices ppt powerpoint presentation gallery information pdf to dispense important information. This template comprises five stages. It also presents valuable insights into the topics including venn diagram 5 variables infographics for business communication devices. This is a completely customizable PowerPoint theme that can be put to use immediately. So, download it and address the topic impactfully.
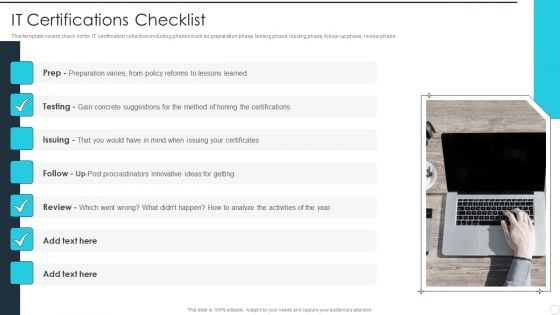
IT Career Certifications IT Certifications Checklist Ppt PowerPoint Presentation File Example Introduction PDF
This template covers check list for IT certification collection including phases such as preparation phase, testing phase, issuing phase, follow-up phase, review phase . This is a IT Career Certifications IT Certifications Checklist Ppt PowerPoint Presentation File Example Introduction PDF template with various stages. Focus and dispense information on one stages using this creative set, that comes with editable features. It contains large content boxes to add your information on topics like Preparation Varies, Gain Concrete Suggestions, Analyze Activities. You can also showcase facts, figures, and other relevant content using this PPT layout. Grab it now.
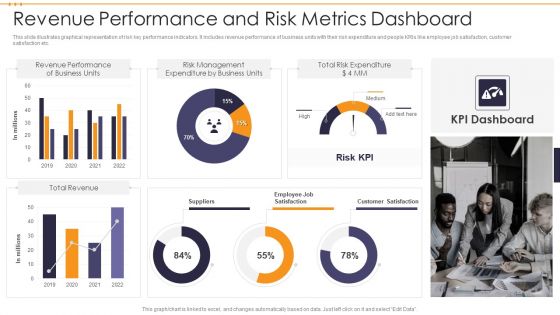
Revenue Performance And Risk Metrics Dashboard Demonstration PDF
This slide illustrates graphical representation of risk key performance indicators. It includes revenue performance of business units with their risk expenditure and people KRIs like employee job satisfaction, customer satisfaction etc. Showcasing this set of slides titled Revenue Performance And Risk Metrics Dashboard Demonstration PDF. The topics addressed in these templates are Total Risk Expenditure, Risk Management, Revenue Performance . All the content presented in this PPT design is completely editable. Download it and make adjustments in color, background, font etc. as per your unique business setting.
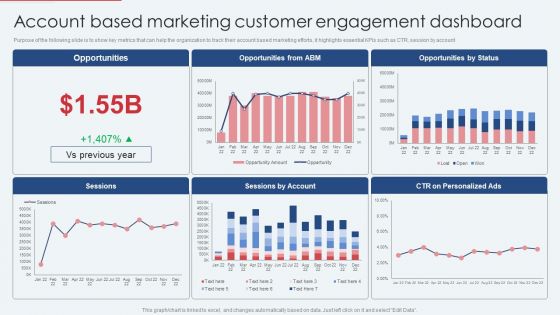
Account Based Marketing Customer Engagement Dashboard Infographics PDF
Purpose of the following slide is to show key metrics that can help the organization to track their account based marketing efforts, it highlights essential KPIs such as CTR, session by account. Boost your pitch with our creative Account Based Marketing Customer Engagement Dashboard Infographics PDF. Deliver an awe inspiring pitch that will mesmerize everyone. Using these presentation templates you will surely catch everyones attention. You can browse the ppts collection on our website. We have researchers who are experts at creating the right content for the templates. So you do not have to invest time in any additional work. Just grab the template now and use them.
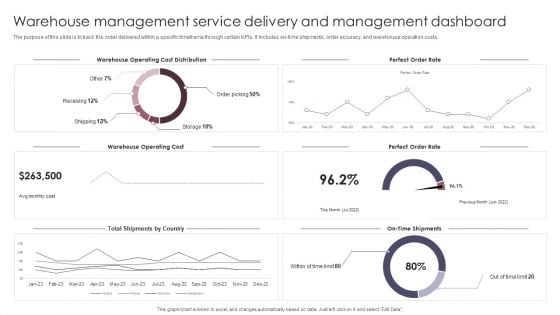
Warehouse Management Service Delivery And Management Dashboard Slides PDF
The purpose of this slide is to track the order delivered within a specific timeframe through certain KPIs. It includes on time shipments, order accuracy, and warehouse operation costs. Showcasing this set of slides titled Warehouse Management Service Delivery And Management Dashboard Slides PDF. The topics addressed in these templates are Warehouse Operating Cost, Warehouse Operating Cost Distribution. All the content presented in this PPT design is completely editable. Download it and make adjustments in color, background, font etc. as per your unique business setting.
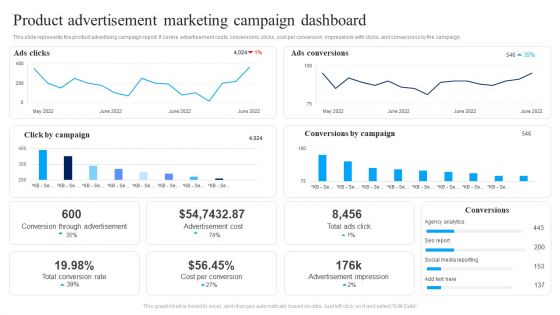
Product Advertisement Marketing Campaign Dashboard Ppt Infographic Template Show PDF
This slide represents the product advertising campaign report. It covers advertisement costs, conversions, clicks, cost per conversion, impressions with clicks, and conversions by the campaign. Showcasing this set of slides titled Product Advertisement Marketing Campaign Dashboard Ppt Infographic Template Show PDF. The topics addressed in these templates are Ads Clicks, Ads Conversions, Conversion Through Advertisement, Advertisement Cost. All the content presented in this PPT design is completely editable. Download it and make adjustments in color, background, font etc. as per your unique business setting.
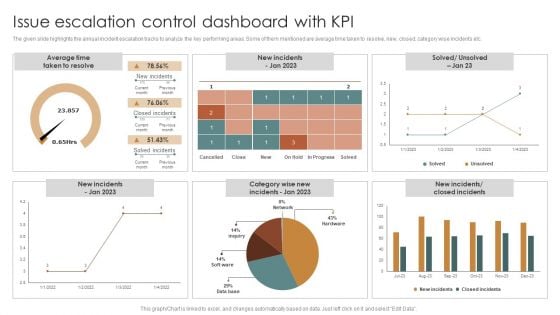
Issue Escalation Control Dashboard With KPI Clipart PDF
The given slide highlights the annual incident escalation tracks to analyze the key performing areas. Some of them mentioned are average time taken to resolve, new, closed, category wise incidents etc. Showcasing this set of slides titled Issue Escalation Control Dashboard With KPI Clipart PDF. The topics addressed in these templates are Average Time, Taken To Resolve. All the content presented in this PPT design is completely editable. Download it and make adjustments in color, background, font etc. as per your unique business setting.
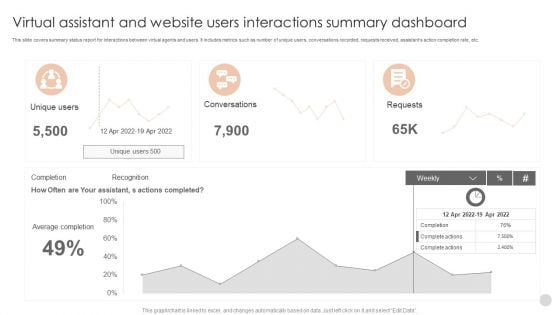
Virtual Assistant And Website Users Interactions Summary Dashboard Formats PDF
This slide covers summary status report for interactions between virtual agents and users. It includes metrics such as number of unique users, conversations recorded, requests received, assistants action completion rate, etc.Showcasing this set of slides titled Virtual Assistant And Website Users Interactions Summary Dashboard Formats PDF. The topics addressed in these templates are Actions Completed, Conversations, Complete Actions. All the content presented in this PPT design is completely editable. Download it and make adjustments in color, background, font etc. as per your unique business setting.
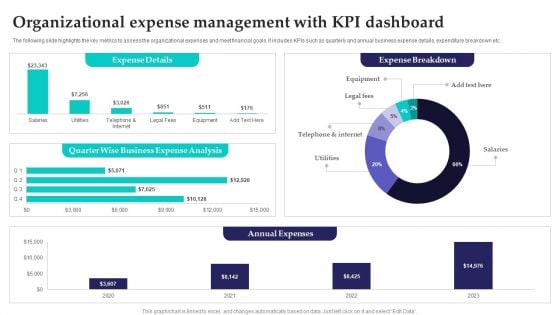
Organizational Expense Management With Kpi Dashboard Slides PDF
The following slide highlights the key metrics to assess the organizational expenses and meet financial goals. It includes KPIs such as quarterly and annual business expense details, expenditure breakdown etc. Showcasing this set of slides titled Organizational Expense Management With Kpi Dashboard Slides PDF. The topics addressed in these templates are Annual Expenses, Expense Details, Expense Breakdown. All the content presented in this PPT design is completely editable. Download it and make adjustments in color, background, font etc. as per your unique business setting.
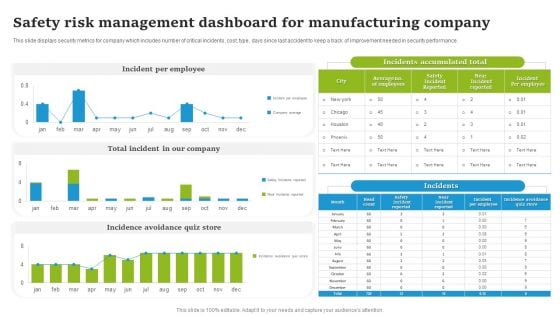
Safety Risk Management Dashboard For Manufacturing Company Introduction PDF
This slide displays security metrics for company which includes number of critical incidents, cost, type, days since last accident to keep a track of Improvement needed in security performance. Showcasing this set of slides titled Safety Risk Management Dashboard For Manufacturing Company Introduction PDF. The topics addressed in these templates are Incident Per Employee, Total Incident Our Company, Incidence Avoidance Quiz Store. All the content presented in this PPT design is completely editable. Download it and make adjustments in color, background, font etc. as per your unique business setting.
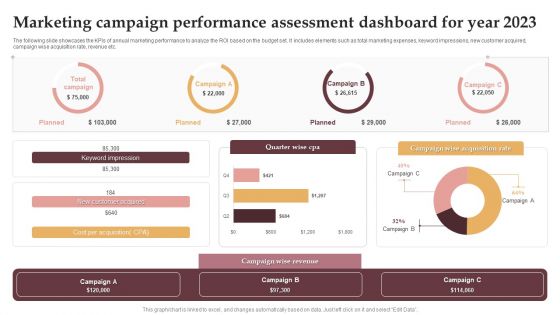
Marketing Campaign Performance Assessment Dashboard For Year 2023 Download PDF
The following slide showcases the KPIs of annual marketing performance to analyze the ROI based on the budget set. It includes elements such as total marketing expenses, keyword impressions, new customer acquired, campaign wise acquisition rate, revenue etc. Showcasing this set of slides titled Marketing Campaign Performance Assessment Dashboard For Year 2023 Download PDF. The topics addressed in these templates are Keyword Impression, New Customer Acquired, Campaign Wise Revenue. All the content presented in this PPT design is completely editable. Download it and make adjustments in color, background, font etc. as per your unique business setting.
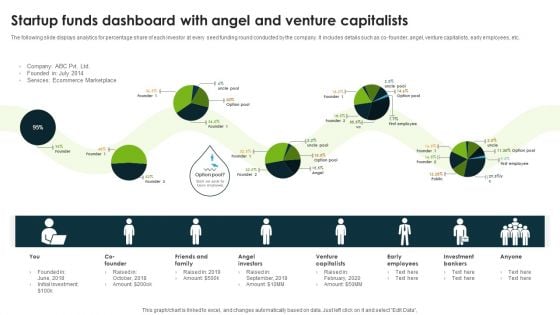
Startup Funds Dashboard With Angel And Venture Capitalists Infographics PDF
The following slide displays analytics for percentage share of each investor at every seed funding round conducted by the company. It includes details such as co founder, angel, venture capitalists, early employees, etc. Showcasing this set of slides titled Startup Funds Dashboard With Angel And Venture Capitalists Infographics PDF. The topics addressed in these templates are Angel Investors, Venture Capitalists, Early Employees. All the content presented in this PPT design is completely editable. Download it and make adjustments in color, background, font etc. as per your unique business setting.

Call Center Process Key Performance Indicator Dashboard Mockup PDF
This slide showcases call center process measurements and key performance indicators so managers and teams can keep track of and improve performance . It includes received calls, calculating speed of answering calls , ended calls before starting conversations , average calls per minute etc. Showcasing this set of slides titled Call Center Process Key Performance Indicator Dashboard Mockup PDF. The topics addressed in these templates are Received Calls, Conversation, Abandon Rate. All the content presented in this PPT design is completely editable. Download it and make adjustments in color, background, font etc. as per your unique business setting.
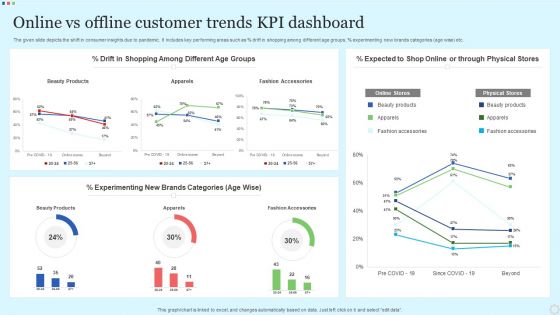
Online Vs Offline Customer Trends Kpi Dashboard Rules PDF
The given slide depicts the shift in consumer insights due to pandemic. It includes key performing areas such as percent drift in shopping among different age groups, percent experimenting new brands categories age wise etc. Showcasing this set of slides titled Online Vs Offline Customer Trends Kpi Dashboard Rules PDF. The topics addressed in these templates are Beauty Products, Apparels, Fashion Accessories. All the content presented in this PPT design is completely editable. Download it and make adjustments in color, background, font etc. as per your unique business setting.
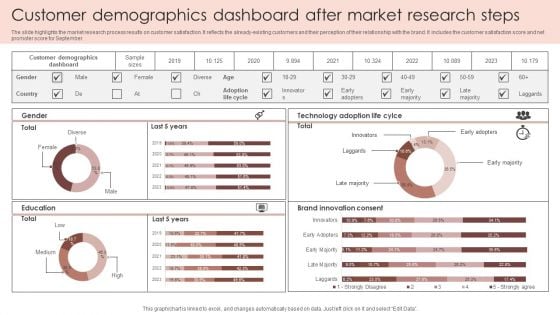
Customer Demographics Dashboard After Market Research Steps Structure PDF
The slide highlights the market research process results on customer satisfaction. It reflects the already-existing customers and their perception of their relationship with the brand. It includes the customer satisfaction score and net promoter score for September. Showcasing this set of slides titled Customer Demographics Dashboard After Market Research Steps Structure PDF. The topics addressed in these templates are Total, Consent, Education. All the content presented in this PPT design is completely editable. Download it and make adjustments in color, background, font etc. as per your unique business setting.

Ethical Hacking Phase 5 Clearing Tracks Ppt Layouts Files PDF
This slide depicts the clearing tracks phase of ethical hacking and how experienced hackers remove their traces from the system so that no one can follow them. Presenting ethical hacking phase 5 clearing tracks ppt layouts files pdf to provide visual cues and insights. Share and navigate important information on four stages that need your due attention. This template can be used to pitch topics like ethical hacking phase 5 clearing tracks. In addtion, this PPT design contains high resolution images, graphics, etc, that are easily editable and available for immediate download.
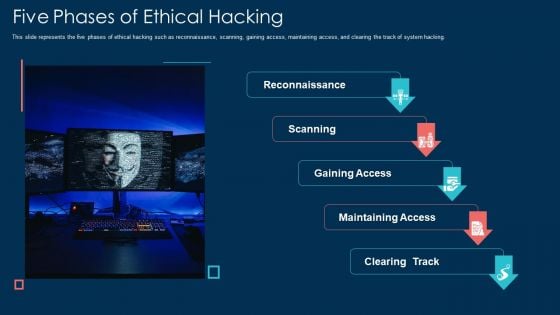
Five Phases Of Ethical Hacking Ppt Show Smartart PDF
This slide represents the five phases of ethical hacking such as reconnaissance, scanning, gaining access, maintaining access, and clearing the track of system hacking. Presenting five phases of ethical hacking ppt show smartart pdf to provide visual cues and insights. Share and navigate important information on five stages that need your due attention. This template can be used to pitch topics like five phases of ethical hacking. In addtion, this PPT design contains high resolution images, graphics, etc, that are easily editable and available for immediate download.
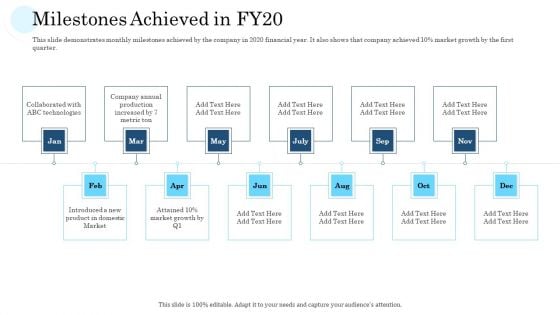
Mass Producing Firm Performance Assessment Milestones Achieved In FY20 Diagrams PDF
This slide demonstrates monthly milestones achieved by the company in 2020 financial year. It also shows that company achieved 10 persent market growth by the first quarter. Presenting mass producing firm performance assessment milestones achieved in fy20 diagrams pdf. to provide visual cues and insights. Share and navigate important information on twevel stages that need your due attention. This template can be used to pitch topics like introduced a new product in domestic market, collaborated with abc technologies. In addtion, this PPT design contains high resolution images, graphics, etc, that are easily editable and available for immediate download.
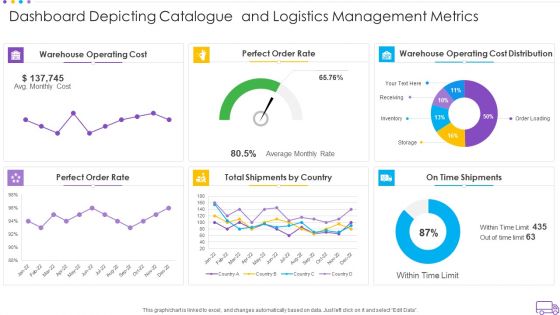
Dashboard Depicting Catalogue And Logistics Management Metrics Pictures PDF
Pitch your topic with ease and precision using this dashboard depicting catalogue and logistics management metrics pictures pdf. This layout presents information on warehouse operating cost, perfect order rate, warehouse operating cost distribution, perfect order rate, total shipments by country. It is also available for immediate download and adjustment. So, changes can be made in the color, design, graphics or any other component to create a unique layout.
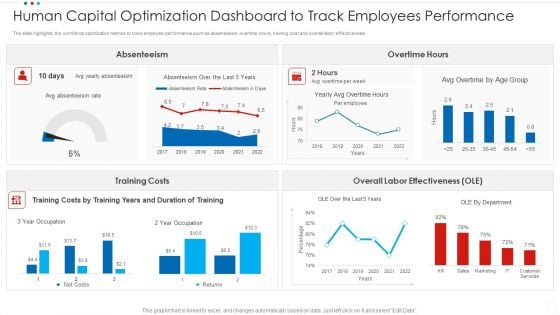
Human Capital Optimization Dashboard To Track Employees Performance Inspiration PDF
The slide highlights the workforce optimization metrics to track employee performance such as absenteeism, overtime hours, training cost and overall labor effectiveness. Pitch your topic with ease and precision using this human capital optimization dashboard to track employees performance inspiration pdf. This layout presents information on training costs, overtime hours, absenteeism. It is also available for immediate download and adjustment. So, changes can be made in the color, design, graphics or any other component to create a unique layout.
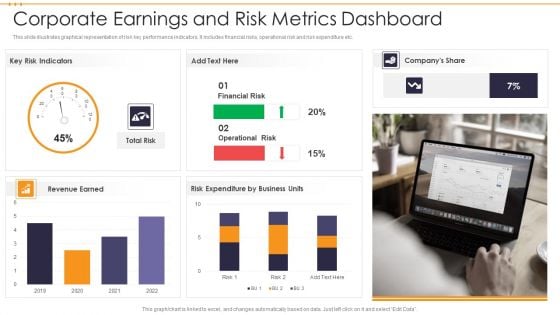
Corporate Earnings And Risk Metrics Dashboard Guidelines PDF
This slide illustrates graphical representation of risk key performance indicators. It includes financial risks, operational risk and risk expenditure etc. Pitch your topic with ease and precision using this Corporate Earnings And Risk Metrics Dashboard Guidelines PDF. This layout presents information on Financial Risk, Operational Risk Expenditure. It is also available for immediate download and adjustment. So, changes can be made in the color, design, graphics or any other component to create a unique layout.
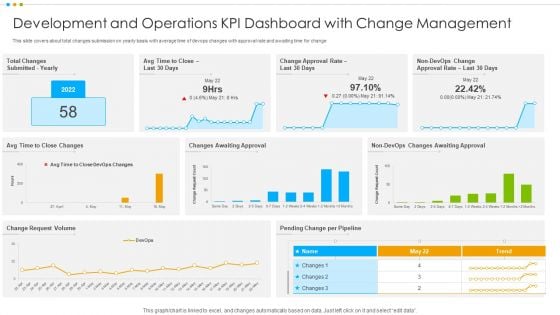
Development And Operations KPI Dashboard With Change Management Elements PDF
This slide covers about total changes submission on yearly basis with average time of devops changes with approval rate and awaiting time for change.Pitch your topic with ease and precision using this Development And Operations KPI Dashboard With Change Management Elements PDF This layout presents information on Awaiting Approval, Change Approval, Total Changes It is also available for immediate download and adjustment. So, changes can be made in the color, design, graphics or any other component to create a unique layout.
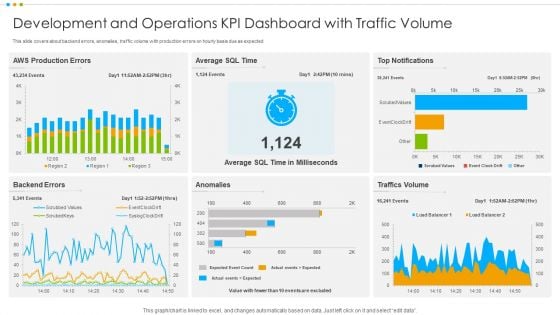
Development And Operations KPI Dashboard With Traffic Volume Professional PDF
This slide covers about backend errors, anomalies, traffic volume with production errors on hourly basis due as expected.Pitch your topic with ease and precision using this Development And Operations KPI Dashboard With Traffic Volume Professional PDF This layout presents information on Anomalies, Traffics Volume, Production Errors It is also available for immediate download and adjustment. So, changes can be made in the color, design, graphics or any other component to create a unique layout.
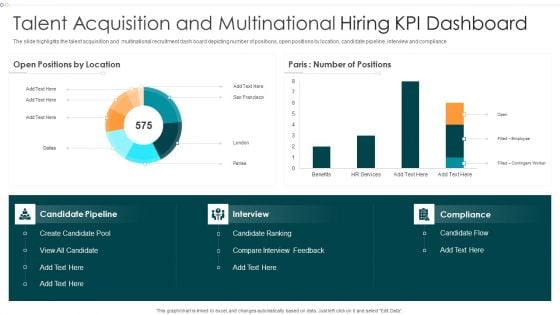
Talent Acquisition And Multinational Hiring KPI Dashboard Mockup PDF
The slide highlights the talent acquisition and multinational recruitment dash board depicting number of positions, open positions by location, candidate pipeline, interview and compliance.Pitch your topic with ease and precision using this Talent Acquisition And Multinational Hiring KPI Dashboard Mockup PDF This layout presents information on Candidate Ranking, Positions, Contingent It is also available for immediate download and adjustment. So, changes can be made in the color, design, graphics or any other component to create a unique layout.
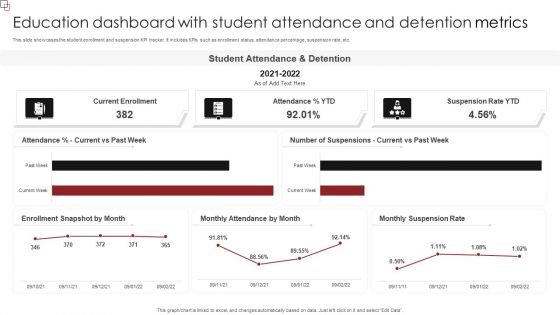
Education Dashboard With Student Attendance And Detention Metrics Inspiration PDF
This slide showcases the student enrollment and suspension KPI tracker. It includes KPIs such as enrollment status, attendance percentage, suspension rate, etc. Pitch your topic with ease and precision using this Education Dashboard With Student Attendance And Detention Metrics Inspiration PDF. This layout presents information on Student Attendance, Suspension Rate YTD, Current Enrollment. It is also available for immediate download and adjustment. So, changes can be made in the color, design, graphics or any other component to create a unique layout.
Tracking Customer Sales Funnel Dashboard Improving Distribution Channel Mockup PDF
This slide covers information regarding the customer sales funnel tracking with sales volume and total market. Deliver and pitch your topic in the best possible manner with this Tracking Customer Sales Funnel Dashboard Improving Distribution Channel Mockup PDF. Use them to share invaluable insights on Tracking Customer, Sales Funnel, Sales Volume and impress your audience. This template can be altered and modified as per your expectations. So, grab it now.
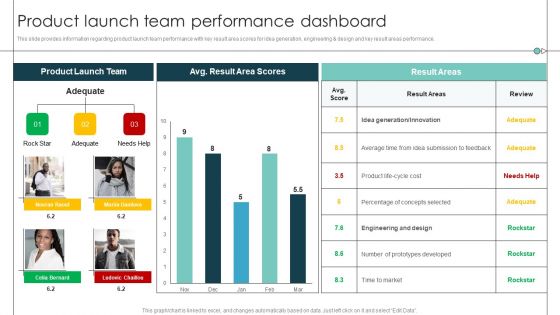
Product Launch Team Performance Dashboard Product Release Commencement Structure PDF
This slide provides information regarding product launch team performance with key result area scores for idea generation, engineering and design and key result areas performance. Deliver and pitch your topic in the best possible manner with this Product Launch Team Performance Dashboard Product Release Commencement Structure PDF. Use them to share invaluable insights on Average Time, Prototypes Developed, Percentage Concepts and impress your audience. This template can be altered and modified as per your expectations. So, grab it now.
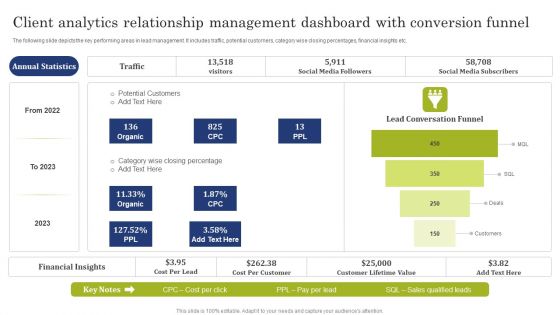
Client Analytics Relationship Management Dashboard With Conversion Funnel Demonstration PDF
The following slide depicts the key performing areas in lead management. It includes traffic, potential customers, category wise closing percentages, financial insights etc. Pitch your topic with ease and precision using this Client Analytics Relationship Management Dashboard With Conversion Funnel Demonstration PDF. This layout presents information on Potential Customers, Social Media Followers, Social Media Subscribers. It is also available for immediate download and adjustment. So, changes can be made in the color, design, graphics or any other component to create a unique layout.
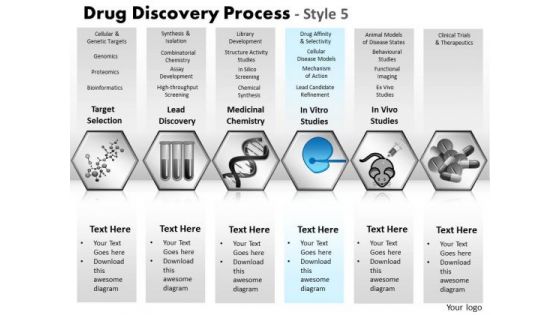
PowerPoint Presentation Diagram Drug Discovery Ppt Design
PowerPoint Presentation Diagram Drug Discovery PPT Design-These high quality powerpoint pre-designed slides and powerpoint templates have been carefully created by our professional team to help you impress your audience. All slides have been created and are 100% editable in powerpoint. Each and every property of any graphic - color, size, orientation, shading, outline etc. can be modified to help you build an effective powerpoint presentation. Any text can be entered at any point in the powerpoint template or slide. Simply DOWNLOAD, TYPE and PRESENT! Jump over obstacles with our PowerPoint Presentation Diagram Drug Discovery Ppt Design. Make sure your presentation gets the attention it deserves.
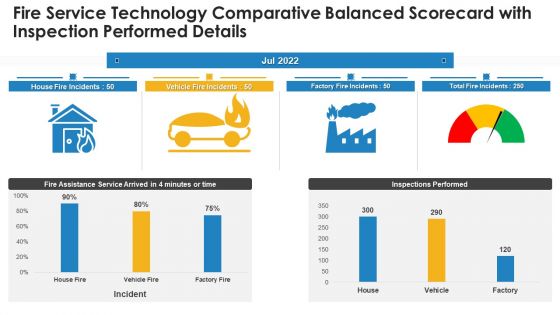
Fire Service Technology Comparative Balanced Scorecard With Inspection Performed Details Formats PDF
Deliver an awe inspiring pitch with this creative fire service technology comparative balanced scorecard with inspection performed details formats pdf bundle. Topics like fire service technology comparative balanced scorecard with inspection performed details can be discussed with this completely editable template. It is available for immediate download depending on the needs and requirements of the user.
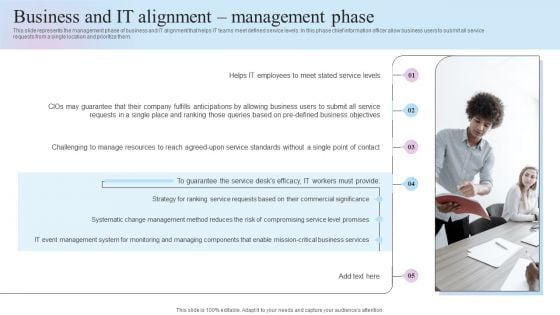
IT Business Alignment Framework Business And IT Alignment Management Phase Themes PDF
This slide represents the management phase of business and IT alignment that helps IT teams meet defined service levels. In this phase chief information officer allow business users to submit all service requests from a single location and prioritize them.Explore a selection of the finest IT Business Alignment Framework Business And IT Alignment Management Phase Themes PDF here. With a plethora of professionally designed and pre-made slide templates, you can quickly and easily find the right one for your upcoming presentation. You can use our IT Business Alignment Framework Business And IT Alignment Management Phase Themes PDF to effectively convey your message to a wider audience. Slidegeeks has done a lot of research before preparing these presentation templates. The content can be personalized and the slides are highly editable. Grab templates today from Slidegeeks.
ATS Administration To Improve Integrating Barcode Scanning Asset Tracking System Information PDF
This slide covers optimizing barcode scanning technique for effective asset management. It involves working and key components of barcode scanning such as labels, tags, receivers and tracking software. Retrieve professionally designed ATS Administration To Improve Integrating Barcode Scanning Asset Tracking System Information PDF to effectively convey your message and captivate your listeners. Save time by selecting pre-made slideshows that are appropriate for various topics, from business to educational purposes. These themes come in many different styles, from creative to corporate, and all of them are easily adjustable and can be edited quickly. Access them as PowerPoint templates or as Google Slides themes. You dont have to go on a hunt for the perfect presentation because Slidegeeks got you covered from everywhere.

Internal Inspection Plan Strategic Planning Ppt PowerPoint Presentation Complete Deck With Slides
Share a great deal of information on the topic by deploying this internal inspection plan strategic planning ppt powerpoint presentation complete deck with slides. Support your ideas and thought process with this prefabricated set. It includes a set of twelve slides, all fully modifiable and editable. Each slide can be restructured and induced with the information and content of your choice. You can add or remove large content boxes as well, to make this PPT slideshow more personalized. Its high-quality graphics and visuals help in presenting a well-coordinated pitch. This PPT template is also a resourceful tool to take visual cues from and implement the best ideas to help your business grow and expand. The main attraction of this well-formulated deck is that everything is editable, giving you the freedom to adjust it to your liking and choice. Changes can be made in the background and theme as well to deliver an outstanding pitch. Therefore, click on the download button now to gain full access to this multifunctional set.
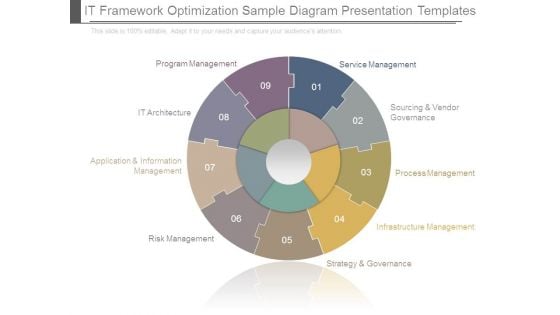
It Framework Optimization Sample Diagram Presentation Templates
This is a It Framework Optimization Sample Diagram Presentation Templates. This is a nine stage process. The stages in this process are program management, it architecture, application and information management, risk management, service management, sourcing and vendor governance, process management, infrastructure management, strategy and governance.
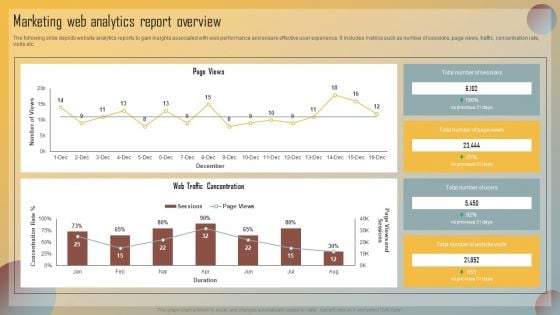
Guide For Marketing Analytics To Improve Decisions Marketing Web Analytics Report Overview Microsoft PDF
The following slide depicts website analytics reports to gain insights associated with web performance and ensure effective user experience. It includes metrics such as number of sessions, page views, traffic, concentration rate, visits etc. Want to ace your presentation in front of a live audience Our Guide For Marketing Analytics To Improve Decisions Marketing Web Analytics Report Overview Microsoft PDF can help you do that by engaging all the users towards you. Slidegeeks experts have put their efforts and expertise into creating these impeccable powerpoint presentations so that you can communicate your ideas clearly. Moreover, all the templates are customizable, and easy to edit and downloadable. Use these for both personal and commercial use.
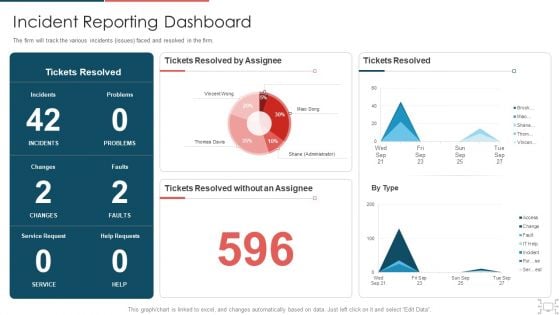
Cyber Security Administration In Organization Incident Reporting Dashboard Diagrams PDF
The firm will track the various incidents issues faced and resolved in the firm. Deliver an awe inspiring pitch with this creative cyber security administration in organization incident reporting dashboard diagrams pdf bundle. Topics like incident reporting dashboard can be discussed with this completely editable template. It is available for immediate download depending on the needs and requirements of the user.
Elastic NLB Network Load Balancers Performance Tracker Dashboard Background PDF
This slide shows the dashboard for tracking the network load balancers performance by covering details of balancer status, balancer session, balancer throughput, etc. Coming up with a presentation necessitates that the majority of the effort goes into the content and the message you intend to convey. The visuals of a PowerPoint presentation can only be effective if it supplements and supports the story that is being told. Keeping this in mind our experts created Elastic NLB Network Load Balancers Performance Tracker Dashboard Background PDF to reduce the time that goes into designing the presentation. This way, you can concentrate on the message while our designers take care of providing you with the right template for the situation.
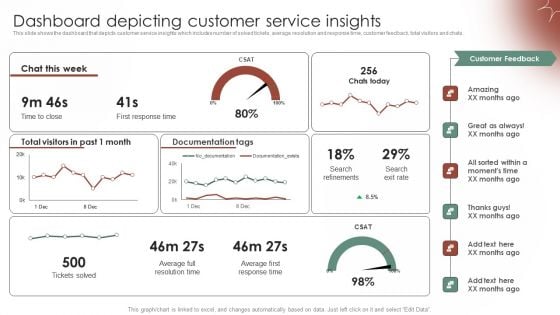
Tactical Communication Plan Dashboard Depicting Customer Service Insights Graphics PDF
This slide shows the dashboard that depicts customer service insights which includes number of solved tickets, average resolution and response time, customer feedback, total visitors and chats. Coming up with a presentation necessitates that the majority of the effort goes into the content and the message you intend to convey. The visuals of a PowerPoint presentation can only be effective if it supplements and supports the story that is being told. Keeping this in mind our experts created Tactical Communication Plan Dashboard Depicting Customer Service Insights Graphics PDF to reduce the time that goes into designing the presentation. This way, you can concentrate on the message while our designers take care of providing you with the right template for the situation.
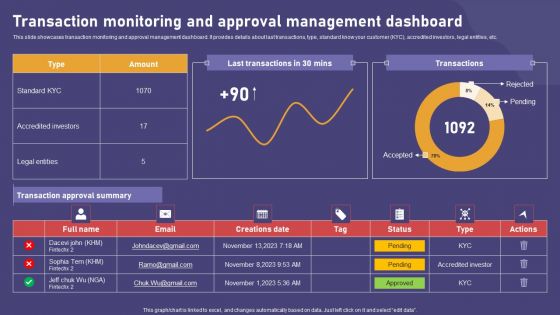
Transaction Monitoring And Approval Management Dashboard Ideas PDF
This slide showcases transaction monitoring and approval management dashboard. It provides details about last transactions, type, standard know your customer KYC, accredited investors, legal entities, etc. Coming up with a presentation necessitates that the majority of the effort goes into the content and the message you intend to convey. The visuals of a PowerPoint presentation can only be effective if it supplements and supports the story that is being told. Keeping this in mind our experts created Transaction Monitoring And Approval Management Dashboard Ideas PDF to reduce the time that goes into designing the presentation. This way, you can concentrate on the message while our designers take care of providing you with the right template for the situation.
Tiktok Marketing Campaign Performance Tracking Dashboard Background PDF
This slide represents the KPI dashboard to effective track and monitor TikTok marketing campaign conducted by the organization. It includes KPIs such as total cost, impressions, reach, clicks etc. Coming up with a presentation necessitates that the majority of the effort goes into the content and the message you intend to convey. The visuals of a PowerPoint presentation can only be effective if it supplements and supports the story that is being told. Keeping this in mind our experts created Tiktok Marketing Campaign Performance Tracking Dashboard Background PDF to reduce the time that goes into designing the presentation. This way, you can concentrate on the message while our designers take care of providing you with the right template for the situation.
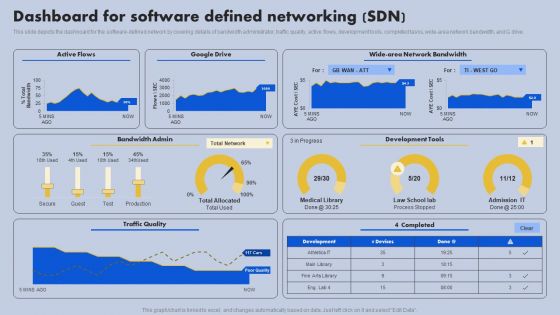
Dashboard For Software Defined Networking SDN Ppt Slides Images PDF
This slide depicts the dashboard for the software-defined network by covering details of bandwidth administrator, traffic quality, active flows, development tools, completed tasks, wide-area network bandwidth, and G drive. Coming up with a presentation necessitates that the majority of the effort goes into the content and the message you intend to convey. The visuals of a PowerPoint presentation can only be effective if it supplements and supports the story that is being told. Keeping this in mind our experts created Dashboard For Software Defined Networking SDN Ppt Slides Images PDF to reduce the time that goes into designing the presentation. This way, you can concentrate on the message while our designers take care of providing you with the right template for the situation.
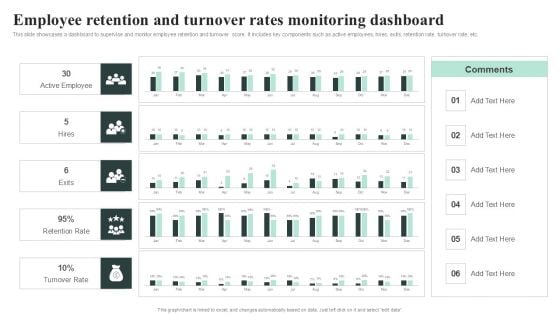
Employee Retention And Turnover Rates Monitoring Dashboard Professional PDF
SMS Marketing Automated Campaigns Performance Tracking Dashboard Demonstration PDF
This slide represents the key metrics dashboard to track, monitor and analyze the performance of SMS marketing automated campaign. It includes details related to KPIs such as new subscribers, responses received, total earned and top live automations etc. Boost your pitch with our creative SMS Marketing Automated Campaigns Performance Tracking Dashboard Demonstration PDF. Deliver an awe inspiring pitch that will mesmerize everyone. Using these presentation templates you will surely catch everyones attention. You can browse the ppts collection on our website. We have researchers who are experts at creating the right content for the templates. So you do not have to invest time in any additional work. Just grab the template now and use them.
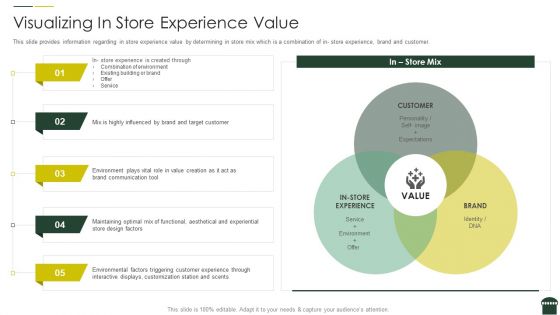
Transforming Physical Retail Outlet Visualizing In Store Experience Value Structure PDF
This slide provides information regarding in store experience value by determining in store mix which is a combination of in store experience, brand and customer. This is a transforming physical retail outlet visualizing in store experience value structure pdf template with various stages. Focus and dispense information on three stages using this creative set, that comes with editable features. It contains large content boxes to add your information on topics like customer, brand, in-store experience, in store mix . You can also showcase facts, figures, and other relevant content using this PPT layout. Grab it now.
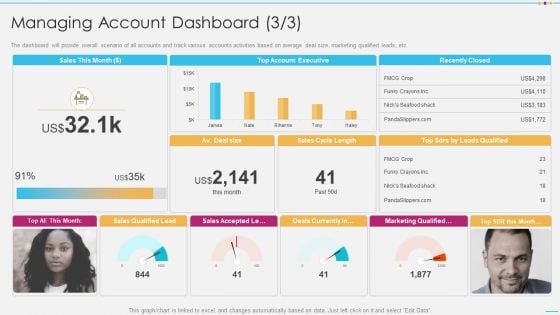
Strategic Account Management By Selling And Advertisement Managing Account Dashboard Summary PDF
The dashboard will provide overall scenario of all accounts and track various accounts activities based on average deal size, marketing qualified leads, etc. Deliver and pitch your topic in the best possible manner with this strategic account management by selling and advertisement managing account dashboard summary pdf. Use them to share invaluable insights on account executive, sales and impress your audience. This template can be altered and modified as per your expectations. So, grab it now.
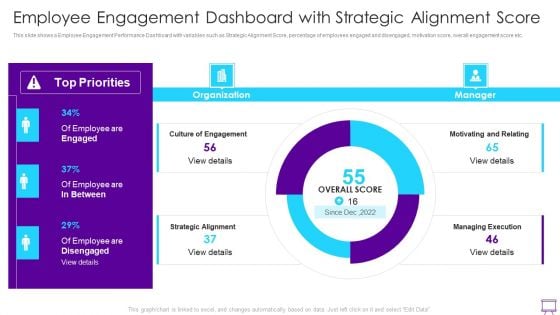
Strategies To Enhance Employee Engagement Employee Engagement Dashboard With Strategic Alignment Ideas PDF
This slide shows a Employee Engagement Performance Dashboard with variables such as Strategic Alignment Score, percentage of employees engaged and disengaged, motivation score, overall engagement score etc.Deliver and pitch your topic in the best possible manner with this Strategies To Enhance Employee Engagement Employee Engagement Dashboard With Strategic Alignment Ideas PDF. Use them to share invaluable insights on Culture Engagement, Motivating Relating, Managing Execution and impress your audience. This template can be altered and modified as per your expectations. So, grab it now.
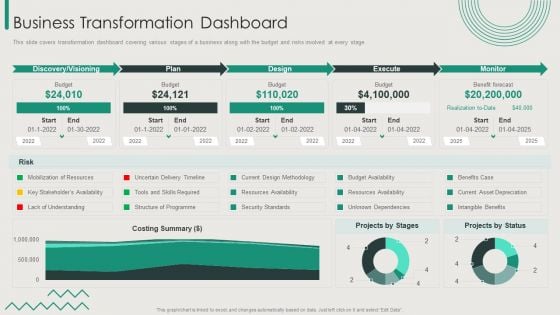
Organization Transition Business Transformation Dashboard Ppt PowerPoint Presentation Gallery Slide PDF
This slide covers transformation dashboard covering various stages of a business along with the budget and risks involved at every stage. Deliver an awe inspiring pitch with this creative Organization Transition Business Transformation Dashboard Ppt PowerPoint Presentation Gallery Slide PDF bundle. Topics like Plan, Design, Execute, Monitor can be discussed with this completely editable template. It is available for immediate download depending on the needs and requirements of the user.

PowerPoint Slide Process World Of Web Ppt Design Slides
PowerPoint Slide Process World Of Web PPT Design Slides-These high quality powerpoint pre-designed slides and powerpoint templates have been carefully created by our professional team to help you impress your audience. All slides have been created and are 100% editable in powerpoint. Each and every property of any graphic - color, size, orientation, shading, outline etc. can be modified to help you build an effective powerpoint presentation. Any text can be entered at any point in the powerpoint template or slide. Simply DOWNLOAD, TYPE and PRESENT! Your customer is the center of it all. Our PowerPoint Slide Process World Of Web Ppt Design Slides will concentrate on him.
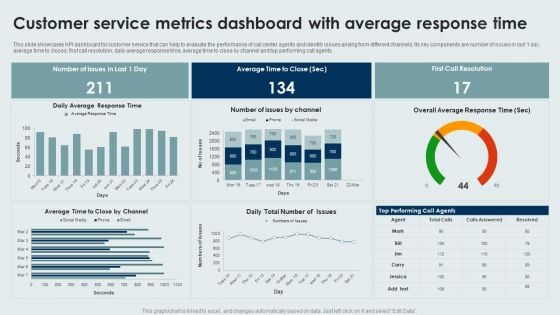
Customer Service Metrics Dashboard With Average Response Time Formats PDF
This slide showcases KPI dashboard for customer service that can help to evaluate the performance of call center agents and identify issues arising from different channels. Its key components are number of issues in last 1 day, average time to closes, first call resolution, daily average response time, average time to close by channel and top performing call agents. Pitch your topic with ease and precision using this Customer Service Metrics Dashboard With Average Response Time Formats PDF. This layout presents information on Customer Service, Metrics Dashboard, Average Response Time. It is also available for immediate download and adjustment. So, changes can be made in the color, design, graphics or any other component to create a unique layout.
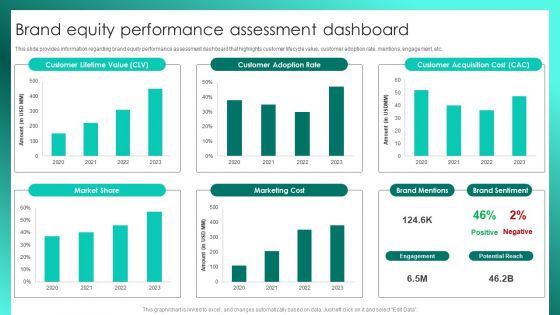
Successful Brand Management Brand Equity Performance Assessment Dashboard Slides PDF
This slide provides information regarding brand equity performance assessment dashboard that highlights customer lifecycle value, customer adoption rate, mentions, engagement, etc. Do you have an important presentation coming up Are you looking for something that will make your presentation stand out from the rest Look no further than Successful Brand Management Brand Equity Performance Assessment Dashboard Slides PDF. With our professional designs, you can trust that your presentation will pop and make delivering it a smooth process. And with Slidegeeks, you can trust that your presentation will be unique and memorable. So why wait Grab Successful Brand Management Brand Equity Performance Assessment Dashboard Slides PDF today and make your presentation stand out from the rest.
Product And Customer Performance Tracking Dashboard Portrait PDF
This slide provides information regarding dashboard utilized by firm to monitor performance of products offered and customer associated. The performance is tracked through revenues generated, new customer acquired, customer satisfaction, sales comparison, etc. Do you have an important presentation coming up Are you looking for something that will make your presentation stand out from the rest Look no further than Product And Customer Performance Tracking Dashboard Portrait PDF. With our professional designs, you can trust that your presentation will pop and make delivering it a smooth process. And with Slidegeeks, you can trust that your presentation will be unique and memorable. So why wait Grab Product And Customer Performance Tracking Dashboard Portrait PDF today and make your presentation stand out from the rest.
Brand Recognition Overview Different Brands Performance Tracking Dashboard Brochure PDF
This slide provides information regarding different brands performance tracking dashboard in terms of brand metric, brand commitment, advertising metrics, and purchase metrics. Do you have to make sure that everyone on your team knows about any specific topic I yes, then you should give Brand Recognition Overview Different Brands Performance Tracking Dashboard Brochure PDF a try. Our experts have put a lot of knowledge and effort into creating this impeccable Brand Recognition Overview Different Brands Performance Tracking Dashboard Brochure PDF. You can use this template for your upcoming presentations, as the slides are perfect to represent even the tiniest detail. You can download these templates from the Slidegeeks website and these are easy to edit. So grab these today
Employee Performance Tracking And Management Dashboard Ideas PDF
This slide showcases a dashboard presenting various metrics to measure and analyze employee overall performance. It outlines information about average absenteeism rate, yearly average overtime hours, training costs and overall labor effectiveness. Do you have an important presentation coming up Are you looking for something that will make your presentation stand out from the rest Look no further than Employee Performance Tracking And Management Dashboard Ideas PDF. With our professional designs, you can trust that your presentation will pop and make delivering it a smooth process. And with Slidegeeks, you can trust that your presentation will be unique and memorable. So why wait Grab Employee Performance Tracking And Management Dashboard Ideas PDF today and make your presentation stand out from the rest.
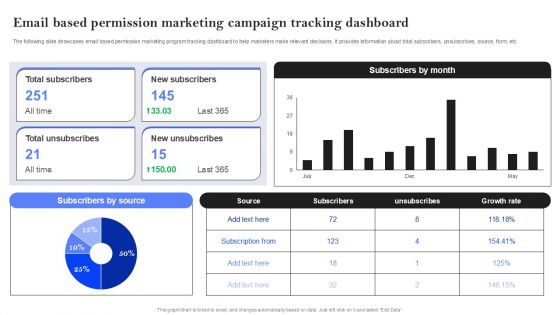
Email Based Permission Marketing Campaign Tracking Dashboard Portrait PDF
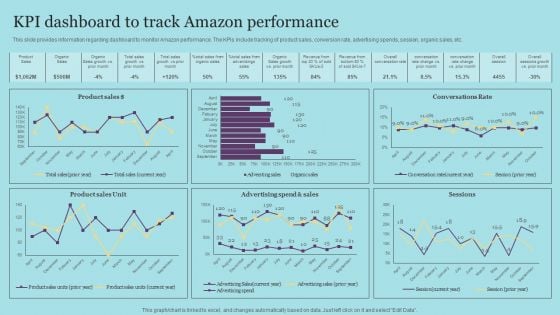
KPI Dashboard To Track Amazon Performance Designs PDF
This slide provides information regarding dashboard to monitor Amazon performance. The KPIs include tracking of product sales, conversion rate, advertising spends, session, organic sales, etc. Do you have to make sure that everyone on your team knows about any specific topic I yes, then you should give KPI Dashboard To Track Amazon Performance Designs PDF a try. Our experts have put a lot of knowledge and effort into creating this impeccable KPI Dashboard To Track Amazon Performance Designs PDF. You can use this template for your upcoming presentations, as the slides are perfect to represent even the tiniest detail. You can download these templates from the Slidegeeks website and these are easy to edit. So grab these today
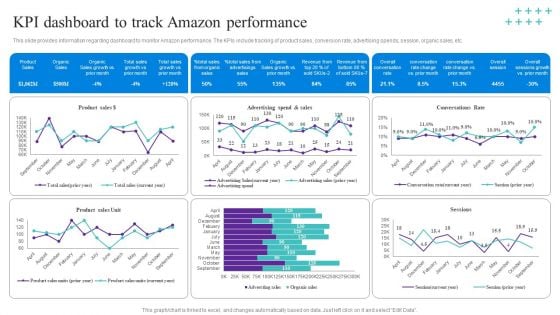
KPI Dashboard To Track Amazon Performance Template PDF
This slide provides information regarding dashboard to monitor Amazon performance. The KPIs include tracking of product sales, conversion rate, advertising spends, session, organic sales, etc. Do you have to make sure that everyone on your team knows about any specific topic I yes, then you should give KPI Dashboard To Track Amazon Performance Template PDF a try. Our experts have put a lot of knowledge and effort into creating this impeccable KPI Dashboard To Track Amazon Performance Template PDF. You can use this template for your upcoming presentations, as the slides are perfect to represent even the tiniest detail. You can download these templates from the Slidegeeks website and these are easy to edit. So grab these today
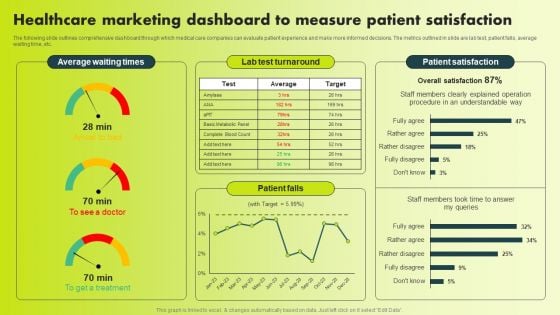
Healthcare Marketing Dashboard To Measure Patient Satisfaction Professional PDF
The following slide outlines comprehensive dashboard through which medical care companies can evaluate patient experience and make more informed decisions. The metrics outlined in slide are lab test, patient falls, average waiting time, etc. Create an editable Healthcare Marketing Dashboard To Measure Patient Satisfaction Professional PDF that communicates your idea and engages your audience. Whether you are presenting a business or an educational presentation, pre-designed presentation templates help save time. Healthcare Marketing Dashboard To Measure Patient Satisfaction Professional PDF is highly customizable and very easy to edit, covering many different styles from creative to business presentations. Slidegeeks has creative team members who have crafted amazing templates. So, go and get them without any delay.
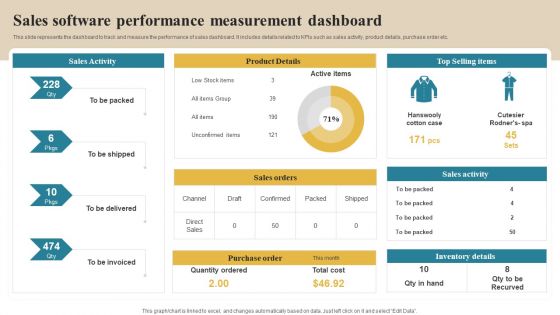
Software Implementation Technique Sales Software Performance Measurement Dashboard Slides PDF
This slide represents the dashboard to track and measure the performance of sales dashboard. It includes details related to KPIs such as sales activity, product details, purchase order etc. This modern and well arranged Software Implementation Technique Sales Software Performance Measurement Dashboard Slides PDF provides lots of creative possibilities. It is very simple to customize and edit with the Powerpoint Software. Just drag and drop your pictures into the shapes. All facets of this template can be edited with Powerpoint no extra software is necessary. Add your own material, put your images in the places assigned for them, adjust the colors, and then you can show your slides to the world, with an animated slide included.
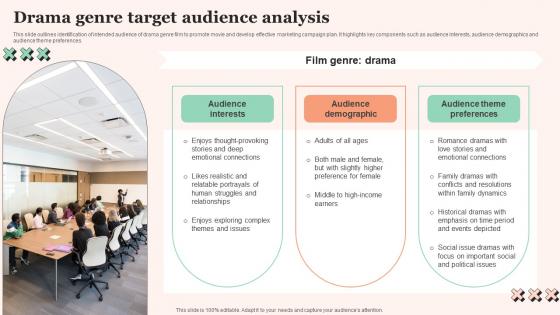
Drama Genre Target Audience Film Promotional Techniques To Increase Box Office Collection Diagrams Pdf
This slide outlines identification of intended audience of drama genre film to promote movie and develop effective marketing campaign plan. It highlights key components such as audience interests, audience demographics and audience theme preferences. Are you searching for a Drama Genre Target Audience Film Promotional Techniques To Increase Box Office Collection Diagrams Pdf that is uncluttered, straightforward, and original Its easy to edit, and you can change the colors to suit your personal or business branding. For a presentation that expresses how much effort you have put in, this template is ideal With all of its features, including tables, diagrams, statistics, and lists, its perfect for a business plan presentation. Make your ideas more appealing with these professional slides. Download Drama Genre Target Audience Film Promotional Techniques To Increase Box Office Collection Diagrams Pdf from Slidegeeks today. This slide outlines identification of intended audience of drama genre film to promote movie and develop effective marketing campaign plan. It highlights key components such as audience interests, audience demographics and audience theme preferences.
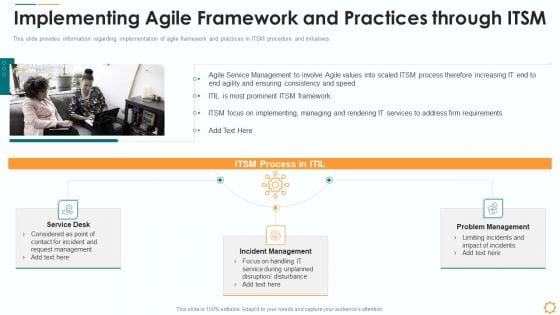
Implementing Agile Framework And Practices Through ITSM Themes PDF
This slide provides information regarding implementation of agile framework and practices in ITSM procedure and initiatives.
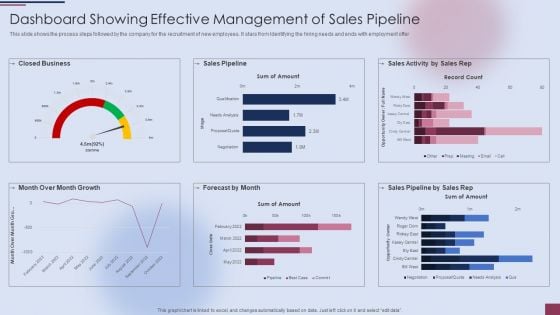
Dashboard Showing Effective Management Of Sales Pipeline Template PDF
This slide shows the process steps followed by the company for the recruitment of new employees. It stars from Identifying the hiring needs and ends with employment offer.Deliver and pitch your topic in the best possible manner with this Dashboard Showing Effective Management Of Sales Pipeline Template PDF. Use them to share invaluable insights on Closed Business, Sales Pipeline, Sales Activity and impress your audience. This template can be altered and modified as per your expectations. So, grab it now.
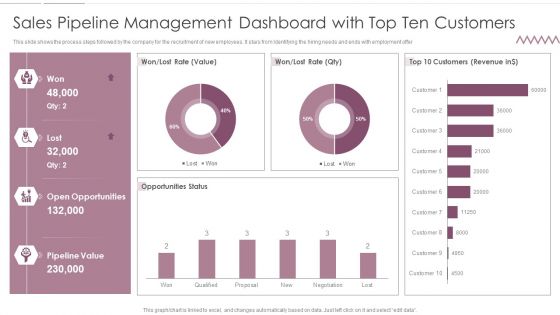
Sales Pipeline Management Dashboard With Top Ten Customers Formats PDF
This slide shows the process steps followed by the company for the recruitment of new employees. It stars from Identifying the hiring needs and ends with employment offer. Deliver an awe inspiring pitch with this creative Sales Pipeline Management Dashboard With Top Ten Customers Formats PDF bundle. Topics like Opportunities, Value, Customers can be discussed with this completely editable template. It is available for immediate download depending on the needs and requirements of the user.

Sales Pipeline Management Dashboard With Top Ten Customers Graphics PDF
This slide shows the process steps followed by the company for the recruitment of new employees. It stars from Identifying the hiring needs and ends with employment offer. Deliver and pitch your topic in the best possible manner with this Sales Pipeline Management Dashboard With Top Ten Customers Graphics PDF. Use them to share invaluable insights on Open Opportunities, Pipeline Value, Customers Revenue and impress your audience. This template can be altered and modified as per your expectations. So, grab it now.
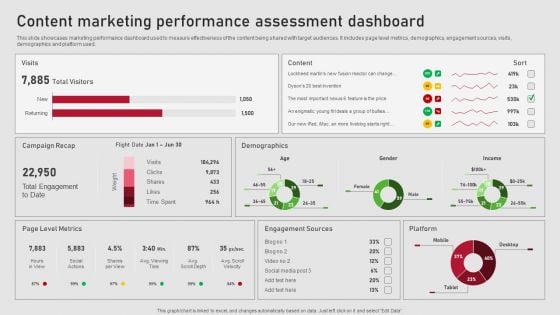
Creating Content Marketing Technique For Brand Promotions Content Marketing Performance Assessment Graphics PDF
This slide showcases marketing performance dashboard used to measure effectiveness of the content being shared with target audiences. It includes page level metrics, demographics, engagement sources, visits, demographics and platform used. Slidegeeks is here to make your presentations a breeze with Creating Content Marketing Technique For Brand Promotions Content Marketing Performance Assessment Graphics PDF With our easy-to-use and customizable templates, you can focus on delivering your ideas rather than worrying about formatting. With a variety of designs to choose from, you are sure to find one that suits your needs. And with animations and unique photos, illustrations, and fonts, you can make your presentation pop. So whether you are giving a sales pitch or presenting to the board, make sure to check out Slidegeeks first
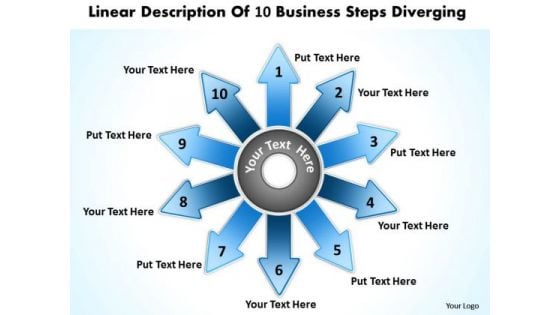
Of 6 Key Steps Marketing Diverging Processes Circular Layout Diagram PowerPoint Templates
We present our of 6 key steps marketing diverging processes Circular Layout Diagram PowerPoint templates.Download and present our Arrows PowerPoint Templates because your findings are here to help arrive at an accurate diagnosis. Use our Circle Charts PowerPoint Templates because Our PowerPoint Templates and Slides will fulfill your every need. Use them and effectively satisfy the desires of your audience. Use our Shapes PowerPoint Templates because forward thinking is the way to go. Present our Business PowerPoint Templates because the majestic tiger lord of all it surveys.It exudes power even when it is in repose. Download and present our Flow Charts PowerPoint Templates because our cleverly selected background hues are guaranteed to achieve this aim.Use these PowerPoint slides for presentations relating to achievement, aim, around, arrow, blue, center, chart, circle, circular, connection, cursor, cycle, cyclic, decisions, direction, flow, graph, graphic, group, icon, illustration, isolated, loop, motion, movement, point, pointer, recycle, recycling, reuse, ring, rotation, round, sign, spin, symbol, target, team, teamwork, technology, turn, wheel, white. The prominent colors used in the PowerPoint template are Blue, Blue navy, Gray. Presenters tell us our of 6 key steps marketing diverging processes Circular Layout Diagram PowerPoint templates are Great. You can be sure our circle PowerPoint templates and PPT Slides are Magnificent. Professionals tell us our of 6 key steps marketing diverging processes Circular Layout Diagram PowerPoint templates are Ritzy. People tell us our arrow PowerPoint templates and PPT Slides are Stylish. People tell us our of 6 key steps marketing diverging processes Circular Layout Diagram PowerPoint templates are Wonderful. Professionals tell us our arrow PowerPoint templates and PPT Slides will impress their bosses and teams. Give your audience whatever they fancy. Our Of 6 Key Steps Marketing Diverging Processes Circular Layout Diagram PowerPoint Templates cater for many a delight.
3d Gears Chart 6 Stages Process Flow Ppt Business Continuity Plan Software PowerPoint Slides
We present our 3d gears chart 6 stages process flow ppt business continuity plan software PowerPoint Slides.Present our Industrial PowerPoint Templates because You have gained great respect for your brilliant ideas. Use our PowerPoint Templates and Slides to strengthen and enhance your reputation. Download our Gear Wheels PowerPoint Templates because Our PowerPoint Templates and Slides are conceived by a dedicated team. Use them and give form to your wondrous ideas. Use our Technology PowerPoint Templates because They will bring a lot to the table. Their alluring flavours will make your audience salivate. Present our Shapes PowerPoint Templates because Our PowerPoint Templates and Slides will Embellish your thoughts. They will help you illustrate the brilliance of your ideas. Present our Business PowerPoint Templates because You are an avid believer in ethical practices. Highlight the benefits that accrue with our PowerPoint Templates and Slides.Use these PowerPoint slides for presentations relating to gear, engineering, concept, green, vector, technical, steel, machinery, bio, sign, glossy, teamwork, symbol, circle, mechanical, ecology, cooperation, element, spin, engine, technology, wheel, modern, mechanism, illustration, icon, round, collection, industrial, reflection, design, mechanics, transparent, motion, machine, set, factory, progress, transmission, background, work, industry, clock, editable, communication, cogwheel. The prominent colors used in the PowerPoint template are White, Gray, Green. Our 3d Gears Chart 6 Stages Process Flow Ppt Business Continuity Plan Software PowerPoint Slides make a great bait. Your ideas will hook them all.
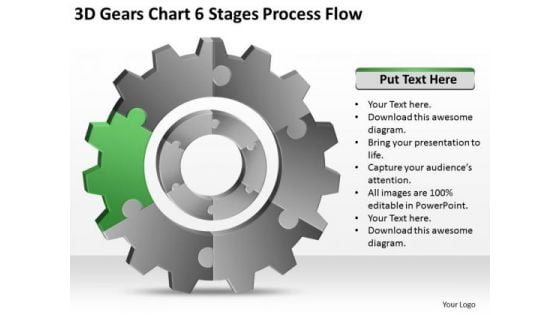
3d Gears Chart 6 Stages Process Flow Ppt Business Development Plan PowerPoint Slides
We present our 3d gears chart 6 stages process flow ppt business development plan PowerPoint Slides.Use our Industrial PowerPoint Templates because You have the co-ordinates for your destination of success. Let our PowerPoint Templates and Slides map out your journey. Download our Gear Wheels PowerPoint Templates because Our PowerPoint Templates and Slides will let you Illuminate the road ahead to Pinpoint the important landmarks along the way. Download our Technology PowerPoint Templates because Our PowerPoint Templates and Slides are innately eco-friendly. Their high recall value negate the need for paper handouts. Download and present our Shapes PowerPoint Templates because Our PowerPoint Templates and Slides will steer your racing mind. Hit the right buttons and spur on your audience. Download and present our Business PowerPoint Templates because Watching this your Audience will Grab their eyeballs, they wont even blink.Use these PowerPoint slides for presentations relating to gear, engineering, concept, green, vector, technical, steel, machinery, bio, sign, glossy, teamwork, symbol, circle, mechanical, ecology, cooperation, element, spin, engine, technology, wheel, modern, mechanism, illustration, icon, round, collection, industrial, reflection, design, mechanics, transparent, motion, machine, set, factory, progress, transmission, background, work, industry, clock, editable, communication, cogwheel. The prominent colors used in the PowerPoint template are White, Gray, Green. Achieve consensus with our 3d Gears Chart 6 Stages Process Flow Ppt Business Development Plan PowerPoint Slides. They have the ability to get people to agree.
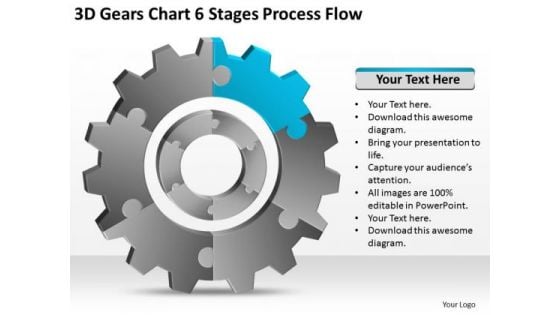
3d Gears Chart 6 Stages Process Flow Ppt Business Plan Basics PowerPoint Templates
We present our 3d gears chart 6 stages process flow ppt business plan basics PowerPoint templates.Present our Industrial PowerPoint Templates because Our PowerPoint Templates and Slides will definately Enhance the stature of your presentation. Adorn the beauty of your thoughts with their colourful backgrounds. Download and present our Gear Wheels PowerPoint Templates because Our PowerPoint Templates and Slides will let you Leave a lasting impression to your audiences. They possess an inherent longstanding recall factor. Use our Technology PowerPoint Templates because They will Put the wind in your sails. Skim smoothly over the choppy waters of the market. Download and present our Shapes PowerPoint Templates because Our PowerPoint Templates and Slides will let you Illuminate the road ahead to Pinpoint the important landmarks along the way. Download and present our Business PowerPoint Templates because Our PowerPoint Templates and Slides has conjured up a web of all you need with the help of our great team. Use them to string together your glistening ideas.Use these PowerPoint slides for presentations relating to gear, engineering, concept, green, vector, technical, steel, machinery, bio, sign, glossy, teamwork, symbol, circle, mechanical, ecology, cooperation, element, spin, engine, technology, wheel, modern, mechanism, illustration, icon, round, collection, industrial, reflection, design, mechanics, transparent, motion, machine, set, factory, progress, transmission, background, work, industry, clock, editable, communication, cogwheel. The prominent colors used in the PowerPoint template are Blue, White, Gray. Make your presentations quickly with our 3d Gears Chart 6 Stages Process Flow Ppt Business Plan Basics PowerPoint Templates. You'll always stay ahead of the game.
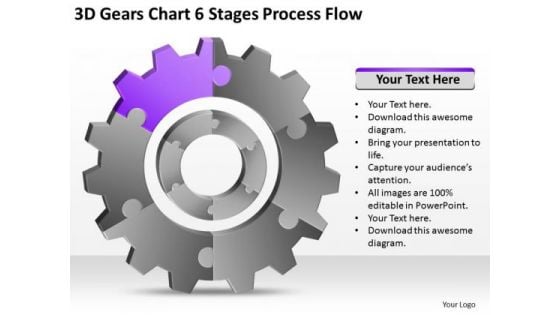
3d Gears Chart 6 Stages Process Flow Ppt Business Plan Company Description PowerPoint Templates
We present our 3d gears chart 6 stages process flow ppt business plan company description PowerPoint templates.Use our Industrial PowerPoint Templates because Our PowerPoint Templates and Slides are topically designed to provide an attractive backdrop to any subject. Use our Gear Wheels PowerPoint Templates because You can Be the puppeteer with our PowerPoint Templates and Slides as your strings. Lead your team through the steps of your script. Download and present our Technology PowerPoint Templates because You can Create a matrix with our PowerPoint Templates and Slides. Feel the strength of your ideas click into place. Download and present our Shapes PowerPoint Templates because you can Add colour to your speech with our PowerPoint Templates and Slides. Your presentation will leave your audience speechless. Download and present our Business PowerPoint Templates because You have gained great respect for your brilliant ideas. Use our PowerPoint Templates and Slides to strengthen and enhance your reputation.Use these PowerPoint slides for presentations relating to gear, engineering, concept, green, vector, technical, steel, machinery, bio, sign, glossy, teamwork, symbol, circle, mechanical, ecology, cooperation, element, spin, engine, technology, wheel, modern, mechanism, illustration, icon, round, collection, industrial, reflection, design, mechanics, transparent, motion, machine, set, factory, progress, transmission, background, work, industry, clock, editable, communication, cogwheel. The prominent colors used in the PowerPoint template are Purple, Gray, White. Festoon your address with our 3d Gears Chart 6 Stages Process Flow Ppt Business Plan Company Description PowerPoint Templates. You will come up with a festival of ideas.
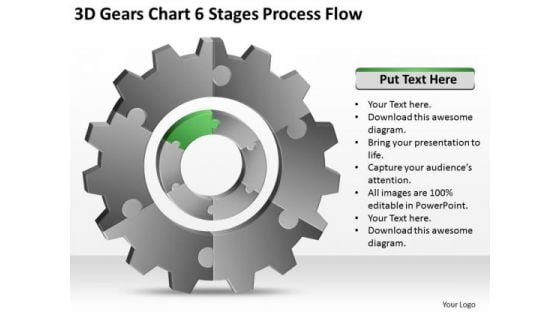
3d Gears Chart 6 Stages Process Flow Ppt Business Plan Example Free PowerPoint Templates
We present our 3d gears chart 6 stages process flow ppt business plan example free PowerPoint templates.Download our Industrial PowerPoint Templates because you should once Tap the ingenuity of our PowerPoint Templates and Slides. They are programmed to succeed. Download and present our Gear Wheels PowerPoint Templates because You can Score a slam dunk with our PowerPoint Templates and Slides. Watch your audience hang onto your every word. Present our Technology PowerPoint Templates because Our PowerPoint Templates and Slides are created with admirable insight. Use them and give your group a sense of your logical mind. Download our Shapes PowerPoint Templates because You can Hit the nail on the head with our PowerPoint Templates and Slides. Embed your ideas in the minds of your audience. Download our Business PowerPoint Templates because You can safely bank on our PowerPoint Templates and Slides. They will provide a growth factor to your valuable thoughts.Use these PowerPoint slides for presentations relating to gear, engineering, concept, green, vector, technical, steel, machinery, bio, sign, glossy, teamwork, symbol, circle, mechanical, ecology, cooperation, element, spin, engine, technology, wheel, modern, mechanism, illustration, icon, round, collection, industrial, reflection, design, mechanics, transparent, motion, machine, set, factory, progress, transmission, background, work, industry, clock, editable, communication, cogwheel. The prominent colors used in the PowerPoint template are Green, White, Gray. Whet their appetite with our 3d Gears Chart 6 Stages Process Flow Ppt Business Plan Example Free PowerPoint Templates. Build up desire with your thoughts.
3d Gears Chart 6 Stages Process Flow Ppt Business Plan Sample PowerPoint Slides
We present our 3d gears chart 6 stages process flow ppt business plan sample PowerPoint Slides.Use our Industrial PowerPoint Templates because You have the co-ordinates for your destination of success. Let our PowerPoint Templates and Slides map out your journey. Use our Gear Wheels PowerPoint Templates because Our PowerPoint Templates and Slides will provide weight to your words. They will bring out the depth of your thought process. Use our Technology PowerPoint Templates because You canTake a leap off the starting blocks with our PowerPoint Templates and Slides. They will put you ahead of the competition in quick time. Download and present our Shapes PowerPoint Templates because Our PowerPoint Templates and Slides will let you Leave a lasting impression to your audiences. They possess an inherent longstanding recall factor. Present our Business PowerPoint Templates because Our PowerPoint Templates and Slides will let you Illuminate the road ahead to Pinpoint the important landmarks along the way.Use these PowerPoint slides for presentations relating to gear, engineering, concept, green, vector, technical, steel, machinery, bio, sign, glossy, teamwork, symbol, circle, mechanical, ecology, cooperation, element, spin, engine, technology, wheel, modern, mechanism, illustration, icon, round, collection, industrial, reflection, design, mechanics, transparent, motion, machine, set, factory, progress, transmission, background, work, industry, clock, editable, communication, cogwheel. The prominent colors used in the PowerPoint template are Gray, White, Blue. Let your thoughts exert some pressure. Our 3d Gears Chart 6 Stages Process Flow Ppt Business Plan Sample PowerPoint Slides will do the deed.
3d Gears Chart 6 Stages Process Flow Ppt Business Plan Template PowerPoint Templates
We present our 3d gears chart 6 stages process flow ppt business plan template PowerPoint templates.Download and present our Industrial PowerPoint Templates because Our PowerPoint Templates and Slides ensures Effective communication. They help you put across your views with precision and clarity. Download and present our Gear Wheels PowerPoint Templates because Our PowerPoint Templates and Slides ensures Effective communication. They help you put across your views with precision and clarity. Download and present our Technology PowerPoint Templates because It will Strengthen your hand with your thoughts. They have all the aces you need to win the day. Download our Shapes PowerPoint Templates because You can Double your output with our PowerPoint Templates and Slides. They make beating deadlines a piece of cake. Download our Business PowerPoint Templates because Your ideas provide food for thought. Our PowerPoint Templates and Slides will help you create a dish to tickle the most discerning palate.Use these PowerPoint slides for presentations relating to gear, engineering, concept, green, vector, technical, steel, machinery, bio, sign, glossy, teamwork, symbol, circle, mechanical, ecology, cooperation, element, spin, engine, technology, wheel, modern, mechanism, illustration, icon, round, collection, industrial, reflection, design, mechanics, transparent, motion, machine, set, factory, progress, transmission, background, work, industry, clock, editable, communication, cogwheel. The prominent colors used in the PowerPoint template are Green, Gray, White. Dont re-invent the wheel. Save time with our 3d Gears Chart 6 Stages Process Flow Ppt Business Plan Template PowerPoint Templates. Make sure your presentation gets the attention it deserves.
3d Gears Chart 6 Stages Process Flow Ppt Making Business Plan Template PowerPoint Templates
We present our 3d gears chart 6 stages process flow ppt making business plan template PowerPoint templates.Download and present our Industrial PowerPoint Templates because Our PowerPoint Templates and Slides are a sure bet. Gauranteed to win against all odds. Download and present our Gear Wheels PowerPoint Templates because Our PowerPoint Templates and Slides will bullet point your ideas. See them fall into place one by one. Download our Technology PowerPoint Templates because You can Rise to the occasion with our PowerPoint Templates and Slides. You will bring your audience on their feet in no time. Use our Shapes PowerPoint Templates because Our PowerPoint Templates and Slides are conceived by a dedicated team. Use them and give form to your wondrous ideas. Present our Business PowerPoint Templates because Our PowerPoint Templates and Slides are endowed to endure. Ideas conveyed through them will pass the test of time.Use these PowerPoint slides for presentations relating to gear, engineering, concept, green, vector, technical, steel, machinery, bio, sign, glossy, teamwork, symbol, circle, mechanical, ecology, cooperation, element, spin, engine, technology, wheel, modern, mechanism, illustration, icon, round, collection, industrial, reflection, design, mechanics, transparent, motion, machine, set, factory, progress, transmission, background, work, industry, clock, editable, communication, cogwheel. The prominent colors used in the PowerPoint template are Purple, White, Gray. Be the early bird with our 3d Gears Chart 6 Stages Process Flow Ppt Making Business Plan Template PowerPoint Templates. Be the first on the block with your thoughts.
3d Gears Chart 6 Stages Process Flow Ppt Planning Business PowerPoint Templates
We present our 3d gears chart 6 stages process flow ppt planning business PowerPoint templates.Use our Industrial PowerPoint Templates because You should Bet on your luck with our PowerPoint Templates and Slides. Be assured that you will hit the jackpot. Download our Gear Wheels PowerPoint Templates because you should once Tap the ingenuity of our PowerPoint Templates and Slides. They are programmed to succeed. Present our Technology PowerPoint Templates because You should Press the right buttons with our PowerPoint Templates and Slides. They will take your ideas down the perfect channel. Present our Shapes PowerPoint Templates because It will Give impetus to the hopes of your colleagues. Our PowerPoint Templates and Slides will aid you in winning their trust. Download and present our Business PowerPoint Templates because you should Whip up a frenzy with our PowerPoint Templates and Slides. They will fuel the excitement of your team.Use these PowerPoint slides for presentations relating to gear, engineering, concept, green, vector, technical, steel, machinery, bio, sign, glossy, teamwork, symbol, circle, mechanical, ecology, cooperation, element, spin, engine, technology, wheel, modern, mechanism, illustration, icon, round, collection, industrial, reflection, design, mechanics, transparent, motion, machine, set, factory, progress, transmission, background, work, industry, clock, editable, communication, cogwheel. The prominent colors used in the PowerPoint template are Gray, White, Blue. Make your audience feel exclusive with our 3d Gears Chart 6 Stages Process Flow Ppt Planning Business PowerPoint Templates. Give them special attention with your thoughts.
3d Gears Chart 6 Stages Process Flow Ppt Strategic Business Plans PowerPoint Templates
We present our 3d gears chart 6 stages process flow ppt strategic business plans PowerPoint templates.Download and present our Industrial PowerPoint Templates because Watching this your Audience will Grab their eyeballs, they wont even blink. Use our Gear Wheels PowerPoint Templates because Our PowerPoint Templates and Slides are Clear and concise. Use them and dispel any doubts your team may have. Use our Technology PowerPoint Templates because You can Channelise the thoughts of your team with our PowerPoint Templates and Slides. Urge them to focus on the goals you have set. Download our Shapes PowerPoint Templates because It can Conjure up grand ideas with our magical PowerPoint Templates and Slides. Leave everyone awestruck by the end of your presentation. Download and present our Business PowerPoint Templates because It will let you Set new benchmarks with our PowerPoint Templates and Slides. They will keep your prospects well above par.Use these PowerPoint slides for presentations relating to gear, engineering, concept, green, vector, technical, steel, machinery, bio, sign, glossy, teamwork, symbol, circle, mechanical, ecology, cooperation, element, spin, engine, technology, wheel, modern, mechanism, illustration, icon, round, collection, industrial, reflection, design, mechanics, transparent, motion, machine, set, factory, progress, transmission, background, work, industry, clock, editable, communication, cogwheel. The prominent colors used in the PowerPoint template are Purple, White, Gray. Allay any fears that may crop up. Apply the balm with our 3d Gears Chart 6 Stages Process Flow Ppt Strategic Business Plans PowerPoint Templates.
3d Gears Chart 6 Stages Process Flow Ppt Template Of Business Plan PowerPoint Templates
We present our 3d gears chart 6 stages process flow ppt template of business plan PowerPoint templates.Download and present our Industrial PowerPoint Templates because They will Put the wind in your sails. Skim smoothly over the choppy waters of the market. Use our Gear Wheels PowerPoint Templates because Our PowerPoint Templates and Slides will bullet point your ideas. See them fall into place one by one. Use our Technology PowerPoint Templates because Our PowerPoint Templates and Slides will let your words and thoughts hit bullseye everytime. Download and present our Shapes PowerPoint Templates because Our PowerPoint Templates and Slides are the chords of your song. String them along and provide the lilt to your views. Download our Business PowerPoint Templates because They will Put your wonderful verbal artistry on display. Our PowerPoint Templates and Slides will provide you the necessary glam and glitter.Use these PowerPoint slides for presentations relating to gear, engineering, concept, green, vector, technical, steel, machinery, bio, sign, glossy, teamwork, symbol, circle, mechanical, ecology, cooperation, element, spin, engine, technology, wheel, modern, mechanism, illustration, icon, round, collection, industrial, reflection, design, mechanics, transparent, motion, machine, set, factory, progress, transmission, background, work, industry, clock, editable, communication, cogwheel. The prominent colors used in the PowerPoint template are Purple, Gray, White. Teach your team with our 3d Gears Chart 6 Stages Process Flow Ppt Template Of Business Plan PowerPoint Templates. Download without worries with our money back guaranteee.
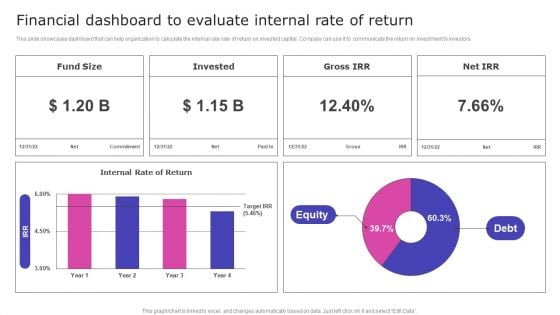
Financial Dashboard To Evaluate Internal Rate Of Return Diagrams PDF
This slide showcases dashboard that can help organization to calculate the internal rate rate of return on invested capital. Company can use it to communicate the return on investment to investors. Create an editable Financial Dashboard To Evaluate Internal Rate Of Return Diagrams PDF that communicates your idea and engages your audience. Whether youre presenting a business or an educational presentation, pre designed presentation templates help save time. Financial Dashboard To Evaluate Internal Rate Of Return Diagrams PDF is highly customizable and very easy to edit, covering many different styles from creative to business presentations. Slidegeeks has creative team members who have crafted amazing templates. So, go and get them without any delay.
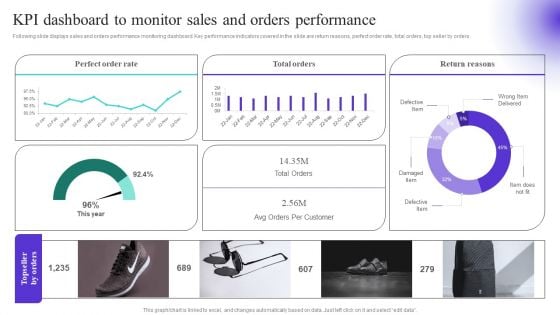
KPI Dashboard To Monitor Sales And Orders Performance Diagrams PDF
Following slide displays sales and orders performance monitoring dashboard. Key performance indicators covered in the slide are return reasons, perfect order rate, total orders, top seller by orders. Create an editable KPI Dashboard To Monitor Sales And Orders Performance Diagrams PDF that communicates your idea and engages your audience. Whether you are presenting a business or an educational presentation, pre designed presentation templates help save time. KPI Dashboard To Monitor Sales And Orders Performance Diagrams PDF is highly customizable and very easy to edit, covering many different styles from creative to business presentations. Slidegeeks has creative team members who have crafted amazing templates. So, go and get them without any delay.
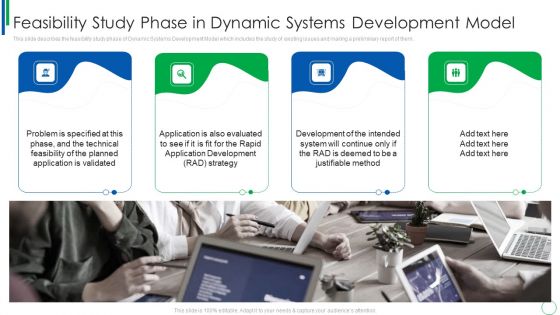
Feasibility Study Phase In Dynamic Systems Development Model Professional PDF
This slide describes the feasibility study phase of Dynamic Systems Development Model which includes the study of existing issues and making a preliminary report of them. Presenting feasibility study phase in dynamic systems development model professional pdf to provide visual cues and insights. Share and navigate important information on four stages that need your due attention. This template can be used to pitch topics like development, strategy, application, evaluated, system. In addtion, this PPT design contains high resolution images, graphics, etc, that are easily editable and available for immediate download.
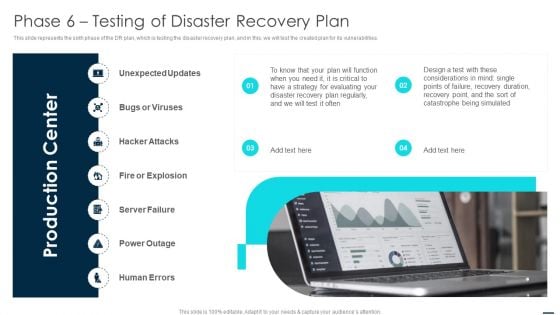
Phase 6 Testing Of Disaster Recovery Plan Professional PDF
This slide represents the sixth phase of the DR plan, which is testing the disaster recovery plan, and in this, we will test the created plan for its vulnerabilities. Presenting Phase 6 Testing Of Disaster Recovery Plan Professional PDF to provide visual cues and insights. Share and navigate important information on four stages that need your due attention. This template can be used to pitch topics like Design, Plan, Strategy. In addtion, this PPT design contains high resolution images, graphics, etc, that are easily editable and available for immediate download.
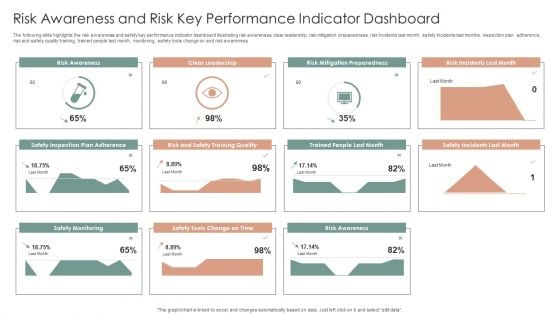
Risk Awareness And Risk Key Performance Indicator Dashboard Ppt Inspiration Ideas PDF
The following slide highlights the risk awareness and safety key performance indicator dashboard illustrating risk awareness, clear leadership, risk mitigation preparedness, risk incidents last month, safety incidents last months, inspection plan adherence, risk and safety quality training, trained people last month, monitoring, safety tools change on and risk awareness. Showcasing this set of slides titled Risk Awareness And Risk Key Performance Indicator Dashboard Ppt Inspiration Ideas PDF. The topics addressed in these templates are Safety Incident Avoided, Safety Incidents, Safety Incident, Accumulated Total. All the content presented in this PPT design is completely editable. Download it and make adjustments in color, background, font etc. as per your unique business setting.
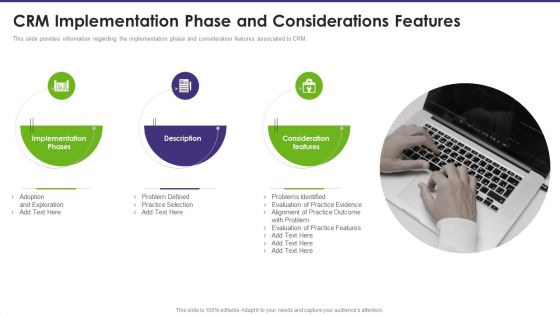
Customer Relationship Management CRM Implementation Phase And Considerations Sample PDF
This slide provides information regarding the implementation phase and consideration features associated to CRM. Make sure to capture your audiences attention in your business displays with our gratis customizable Customer Relationship Management CRM Implementation Phase And Considerations Sample PDF. These are great for business strategies, office conferences, capital raising or task suggestions. If you desire to acquire more customers for your tech business and ensure they stay satisfied, create your own sales presentation with these plain slides.
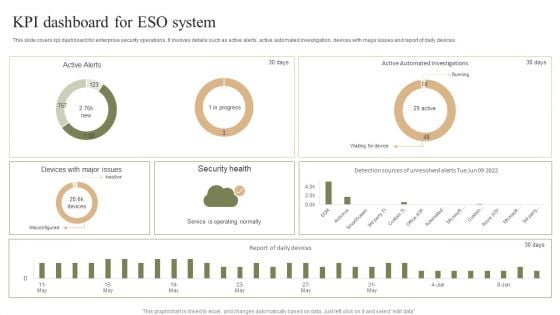
KPI Dashboard For ESO System Ppt PowerPoint Presentation File Template PDF
This slide covers kpi dashboard for enterprise security operations. It involves details such as active alerts, active automated investigation, devices with major issues and report of daily devices. Pitch your topic with ease and precision using this KPI Dashboard For ESO System Ppt PowerPoint Presentation File Template PDF. This layout presents information on Security Health, Misconfigured, Service Operating Normally. It is also available for immediate download and adjustment. So, changes can be made in the color, design, graphics or any other component to create a unique layout.
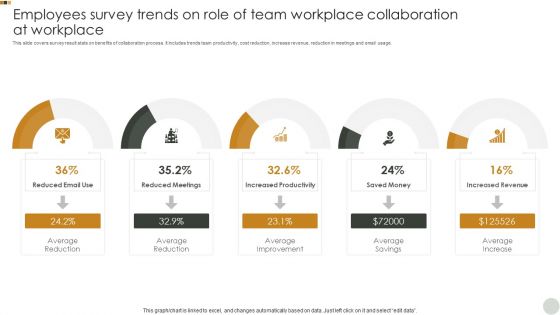
Employees Survey Trends On Role Of Team Workplace Collaboration At Workplace Introduction PDF
This slide covers survey result stats on benefits of collaboration process. It includes trends team productivity, cost reduction, increase revenue, reduction in meetings and email usage. Showcasing this set of slides titled Employees Survey Trends On Role Of Team Workplace Collaboration At Workplace Introduction PDF. The topics addressed in these templates are Average Reduction, Average Improvement, Average Savings. All the content presented in this PPT design is completely editable. Download it and make adjustments in color, background, font etc. as per your unique business setting.
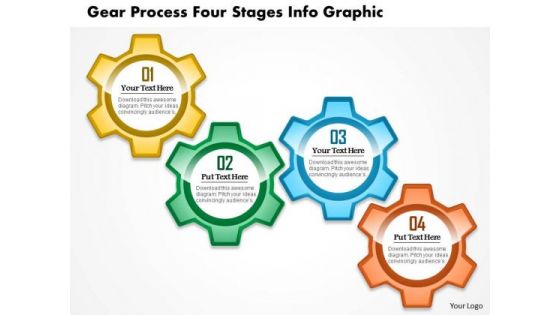
Business Diagram Gear Process Four Stages Info Graphic Presentation Template
This business diagram provides gears process with four stages. It contains four level of strategic planning. Use this diagram to exhibit business process and work flow. Download this awesome diagram to capture your audiences attention.
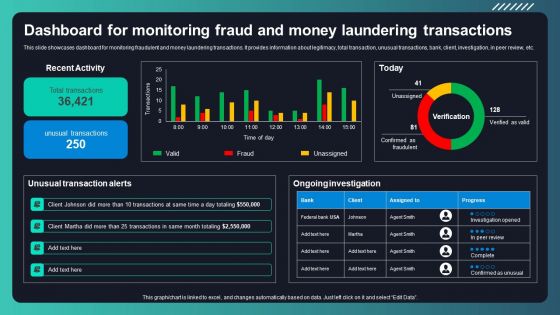
Deploying AML Transaction Monitoring Dashboard For Monitoring Fraud And Money Rules PDF
This slide showcases dashboard for monitoring fraudulent and money laundering transactions. It provides information about legitimacy, total transaction, unusual transactions, bank, client, investigation, in peer review, etc. Do you have an important presentation coming up Are you looking for something that will make your presentation stand out from the rest Look no further than Deploying AML Transaction Monitoring Dashboard For Monitoring Fraud And Money Rules PDF. With our professional designs, you can trust that your presentation will pop and make delivering it a smooth process. And with Slidegeeks, you can trust that your presentation will be unique and memorable. So why wait Grab Deploying AML Transaction Monitoring Dashboard For Monitoring Fraud And Money Rules PDF today and make your presentation stand out from the rest.

Three Stages Venn Diagram For Controlling Phases Ppt PowerPoint Presentation Professional Demonstration PDF
Presenting three stages venn diagram for controlling phases ppt powerpoint presentation professional demonstration pdf to dispense important information. This template comprises three stages. It also presents valuable insights into the topics including planning, monitoring, execution. This is a completely customizable PowerPoint theme that can be put to use immediately. So, download it and address the topic impactfully.
Business People Clipart 3d Traffic Police Man PowerPoint Slides
We present our business people clipart 3d traffic police man PowerPoint Slides.Use our Cones PowerPoint Templates because Our PowerPoint Templates and Slides has conjured up a web of all you need with the help of our great team. Use them to string together your glistening ideas. Present our Security PowerPoint Templates because It will let you Set new benchmarks with our PowerPoint Templates and Slides. They will keep your prospects well above par. Download and present our Signs PowerPoint Templates because Our PowerPoint Templates and Slides will let your team Walk through your plans. See their energy levels rise as you show them the way. Download our Shapes PowerPoint Templates because Our PowerPoint Templates and Slides will help you be quick off the draw. Just enter your specific text and see your points hit home. Download and present our Technology PowerPoint Templates because Our PowerPoint Templates and Slides will let you Hit the right notes. Watch your audience start singing to your tune.Use these PowerPoint slides for presentations relating to 3d, Alert, Attention, Background, Barrier, Boundary, Caution, Character, Cone, Construct, Construction, Danger, Design, Equipment, Forbidden, Guy, Helmet, Highway, Human, Icon, Idea, Illustration, Marking, Men, Obstacle, Orange, People, Person, Puppets, Reflection, Repair, Road, Safety, Security, Set, Shape, Sign, Signal, Stop, Street, Striped, Symbol, Traffic, Traffic-Coins, Traffic , Transportation, Warning, White, Work, Yellow. The prominent colors used in the PowerPoint template are Green, White, Orange. Our Business People Clipart 3d Traffic Police Man PowerPoint Slides encourage a creative environment. Allow diverse ideas to gain acceptance.
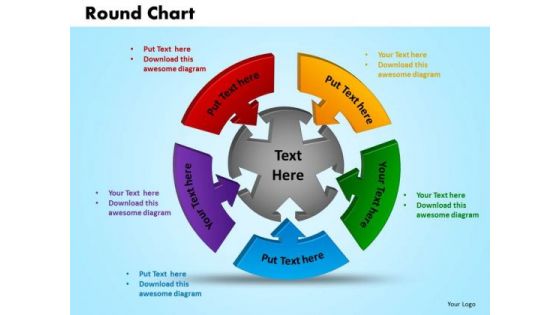
PowerPoint Theme Round Chart Business Ppt Slide
PowerPoint Theme Round Chart Business PPT Slide-This Five Way Round chart Diagram is an effective way of displaying Interconnected information. You can edit text, color, shade and style as per you need.-PowerPoint Theme Round Chart Business PPT Slide Let your audience experience the enticement of our PowerPoint Theme Round Chart Business Ppt Slide. Captivate them with your erudition.
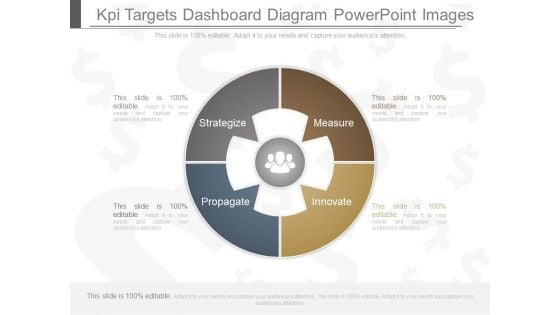
Kpi Targets Dashboard Diagram Powerpoint Images
This is a kpi targets dashboard diagram powerpoint images. This is a four stage process. The stages in this process are strategize, measure, propagate, innovate.
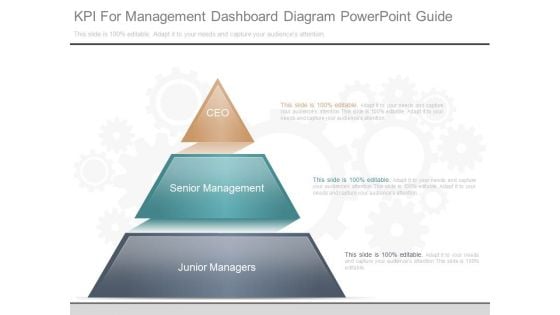
Kpi For Management Dashboard Diagram Powerpoint Guide
This is a kpi for management dashboard diagram powerpoint guide. This is a three stage process. The stages in this process are ceo, senior management, junior managers.
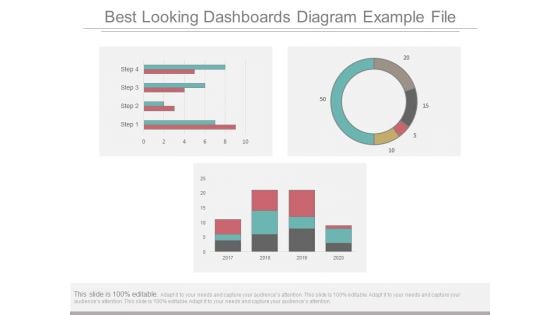
Best Looking Dashboards Diagram Example File
This is a best looking dashboards diagram example file. This is a three stage process. The stages in this process are business, marketing, finance, presentation, management.
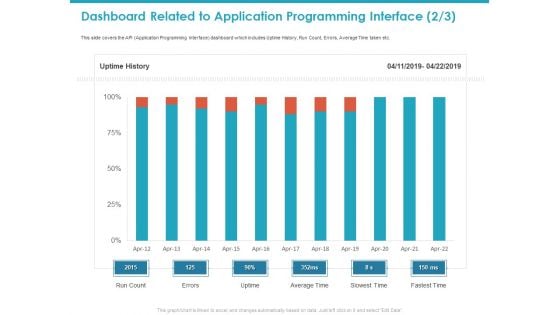
Dashboard Related To Application Programming Interface Fastest Diagrams PDF
This slide covers the API Application Programming Interface dashboard which includes Uptime History, Run Count, Errors, Average Time taken etc. Deliver an awe-inspiring pitch with this creative dashboard related to application programming interface fastest diagrams pdf bundle. Topics like run count, average time, slowest time, fastest time, uptime can be discussed with this completely editable template. It is available for immediate download depending on the needs and requirements of the user.
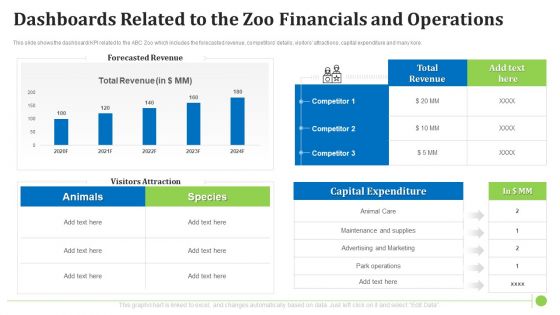
Dashboards Related To The Zoo Financials And Operations Diagrams PDF
This slide shows the dashboard or KPI related to the ABC Zoo which includes the forecasted revenue, competitors details, visitors attractions, capital expenditure and many kore. Deliver and pitch your topic in the best possible manner with this dashboards related to the zoo financials and operations diagrams pdf. Use them to share invaluable insights on capital expenditure, revenue and impress your audience. This template can be altered and modified as per your expectations. So, grab it now.
Online Customer Interaction Dashboard For Tracking Website Performance Diagrams PDF
This slide covers the KPI dashboard for analyzing the company website. It includes metrics such as conversions, conversion rate, sessions, stickiness, bounce rate, engagement, etc. Deliver an awe inspiring pitch with this creative Online Customer Interaction Dashboard For Tracking Website Performance Diagrams PDF bundle. Topics like Conversions Rate, Conversions, Engagement can be discussed with this completely editable template. It is available for immediate download depending on the needs and requirements of the user.
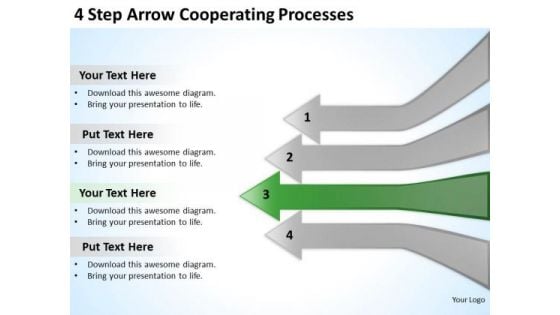
4 Step Arrow Cooperating Processes Business Strategy PowerPoint Slides
We present our 4 step arrow cooperating processes business strategy PowerPoint Slides.Download and present our Arrows PowerPoint Templates because Our PowerPoint Templates and Slides are effectively colour coded to prioritise your plans They automatically highlight the sequence of events you desire. Download our Marketing PowerPoint Templates because Our PowerPoint Templates and Slides will generate and maintain the level of interest you desire. They will create the impression you want to imprint on your audience. Download our Finance PowerPoint Templates because Our PowerPoint Templates and Slides are created by a hardworking bunch of busybees. Always flitting around with solutions gauranteed to please. Download and present our Business PowerPoint Templates because Our PowerPoint Templates and Slides are conceived by a dedicated team. Use them and give form to your wondrous ideas. Present our Shapes PowerPoint Templates because Our PowerPoint Templates and Slides are truly out of this world. Even the MIB duo has been keeping tabs on our team.Use these PowerPoint slides for presentations relating to 3d, Abstract, Accounting, Arrow, Background, Bank, Bar, Benefit, Business, Calculation, Capital, Chart, Company, Connection, Corporate, Data, Design, Diagram, Directive, Earnings, Economy, Enterprise, Finance, Forecast, Graph, Growth, Illustration, Income, Increase, Information, Interest, Internet, Investment, Investor, Management, Market, Measure, Network, Office, Perspective, Plan, Price, Profit, Progress, Rise, Statistics, Technology, Vector, Wealth, World. The prominent colors used in the PowerPoint template are Green, Gray, Black. People tell us our 4 step arrow cooperating processes business strategy PowerPoint Slides will make the presenter successul in his career/life. Customers tell us our Business PowerPoint templates and PPT Slides effectively help you save your valuable time. You can be sure our 4 step arrow cooperating processes business strategy PowerPoint Slides will help them to explain complicated concepts. You can be sure our Accounting PowerPoint templates and PPT Slides help you meet deadlines which are an element of today's workplace. Just browse and pick the slides that appeal to your intuitive senses. Presenters tell us our 4 step arrow cooperating processes business strategy PowerPoint Slides provide great value for your money. Be assured of finding the best projection to highlight your words. People tell us our Background PowerPoint templates and PPT Slides will make the presenter successul in his career/life. Throw a curveballwith our 4 Step Arrow Cooperating Processes Business Strategy PowerPoint Slides. You'll deliver your best presentation yet.
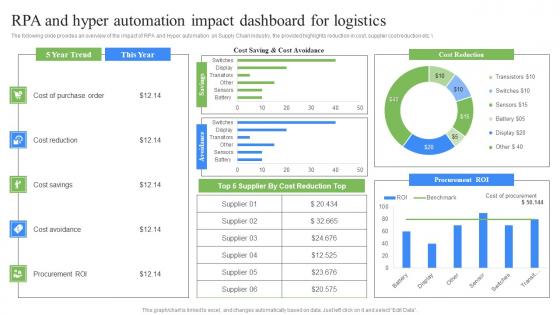
RPA Influence On Industries RPA And Hyper Automation Impact Dashboard Microsoft Pdf
The following slide provides an overview of the impact of RPA and Hyper automation on Supply Chain Industry, the provided highlights reduction in cost, supplier cost reduction etc. Slidegeeks has constructed RPA Influence On Industries RPA And Hyper Automation Impact Dashboard Microsoft Pdf after conducting extensive research and examination. These presentation templates are constantly being generated and modified based on user preferences and critiques from editors. Here, you will find the most attractive templates for a range of purposes while taking into account ratings and remarks from users regarding the content. This is an excellent jumping-off point to explore our content and will give new users an insight into our top-notch PowerPoint Templates. The following slide provides an overview of the impact of RPA and Hyper automation on Supply Chain Industry, the provided highlights reduction in cost, supplier cost reduction etc.
Information Slide Of Customer Support Service Powerpoint Slides
Create dynamic presentations with our professional template containing customer care information slide. This diagram may be used to display concepts of customer support and technology concepts. Download this template to leave permanent impression on your audience.
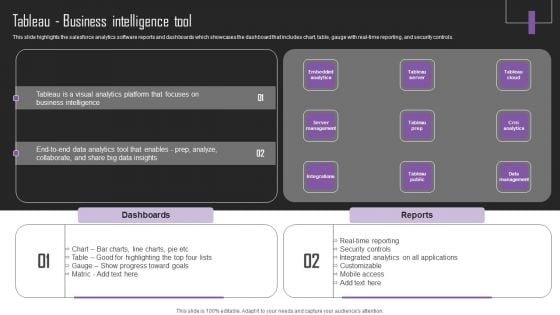
Web Hosting Software Company Outline Tableau Business Intelligence Tool Sample PDF
This slide highlights the salesforce analytics software reports and dashboards which showcases the dashboard that includes chart, table, gauge with real-time reporting, and security controls. This Web Hosting Software Company Outline Tableau Business Intelligence Tool Sample PDF from Slidegeeks makes it easy to present information on your topic with precision. It provides customization options, so you can make changes to the colors, design, graphics, or any other component to create a unique layout. It is also available for immediate download, so you can begin using it right away. Slidegeeks has done good research to ensure that you have everything you need to make your presentation stand out. Make a name out there for a brilliant performance.

 Home
Home