Data Analytics Icons
E Mail Performance Analytics Metrics Tracking Report Analysis Demonstration PDF
The purpose of this slide is to showcase an e-mail analytics mechanism in order to track the performance of certain e-mail marketing based on various metrics. Certain KPIs include open rate, click rate, unsubscribe rate etc. Pitch your topic with ease and precision using this E Mail Performance Analytics Metrics Tracking Report Analysis Demonstration PDF. This layout presents information on E Mail Performance Analytics, Metrics Tracking Report Analysis. It is also available for immediate download and adjustment. So, changes can be made in the color, design, graphics or any other component to create a unique layout.
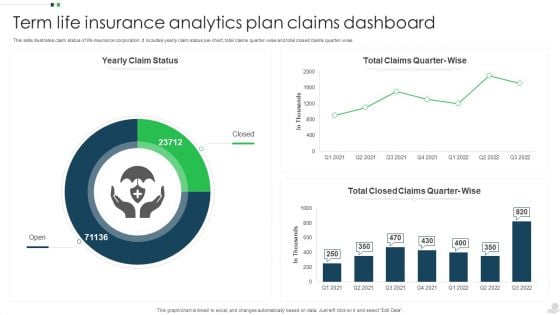
Term Life Insurance Analytics Plan Claims Dashboard Structure PDF
This slide illustrates claim status of life insurance corporation. It includes yearly claim status pie chart, total claims quarter-wise and total closed claims quarter wise. Pitch your topic with ease and precision using this Term Life Insurance Analytics Plan Claims Dashboard Structure PDF. This layout presents information on Insurance Analytics, Plan Claims Dashboard. It is also available for immediate download and adjustment. So, changes can be made in the color, design, graphics or any other component to create a unique layout.
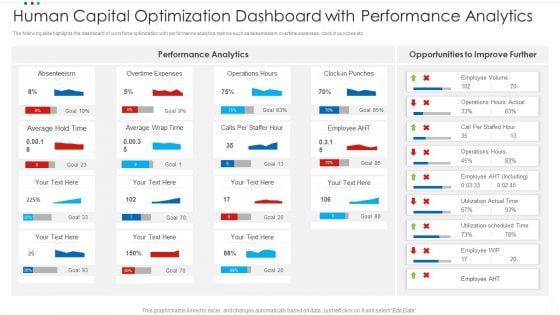
Human Capital Optimization Dashboard With Performance Analytics Infographics PDF
The following slide highlights the dashboard of workforce optimization with performance analytics metrics such as absenteeism, overtime expenses, clock in punches etc. Showcasing this set of slides titled human capital optimization dashboard with performance analytics infographics pdf. The topics addressed in these templates are average, overtime expenses, absenteeism. All the content presented in this PPT design is completely editable. Download it and make adjustments in color, background, font etc. as per your unique business setting.
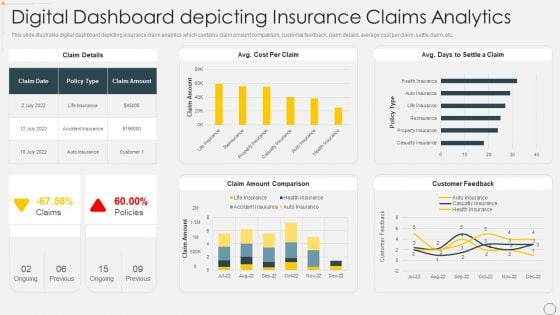
Digital Dashboard Depicting Insurance Claims Analytics Pictures PDF
This slide illustrates digital dashboard depicting insurance claim analytics which contains claim amount comparison, customer feedback, claim details, average cost per claim, settle claim, etc. Showcasing this set of slides titled Digital Dashboard Depicting Insurance Claims Analytics Pictures PDF. The topics addressed in these templates are Policy, Cost, Comparison. All the content presented in this PPT design is completely editable. Download it and make adjustments in color, background, font etc. as per your unique business setting.
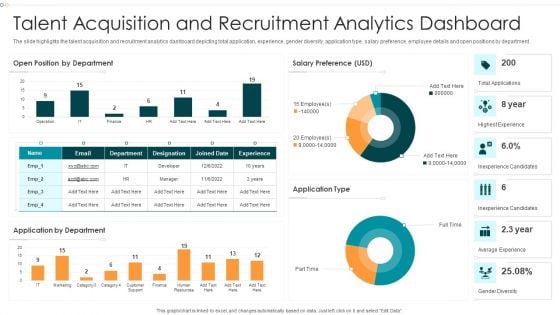
Talent Acquisition And Recruitment Analytics Dashboard Microsoft PDF
The slide highlights the talent acquisition and recruitment analytics dashboard depicting total application, experience, gender diversity, application type, salary preference, employee details and open positions by department.Showcasing this set of slides titled Talent Acquisition And Recruitment Analytics Dashboard Microsoft PDF The topics addressed in these templates are Highest Experience, Inexperience Candidates, Inexperience Candidates All the content presented in this PPT design is completely editable. Download it and make adjustments in color, background, font etc. as per your unique business setting.
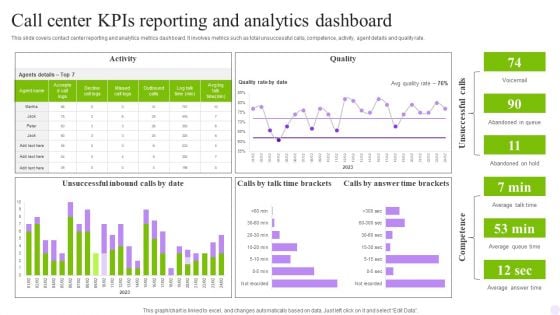
Call Center Kpis Reporting And Analytics Dashboard Download PDF
This slide covers contact center reporting and analytics metrics dashboard. It involves metrics such as total unsuccessful calls, competence, activity, agent details and quality rate. Pitch your topic with ease and precision using this Call Center Kpis Reporting And Analytics Dashboard Download PDF. This layout presents information on Activity, Quality, Dashboard. It is also available for immediate download and adjustment. So, changes can be made in the color, design, graphics or any other component to create a unique layout.
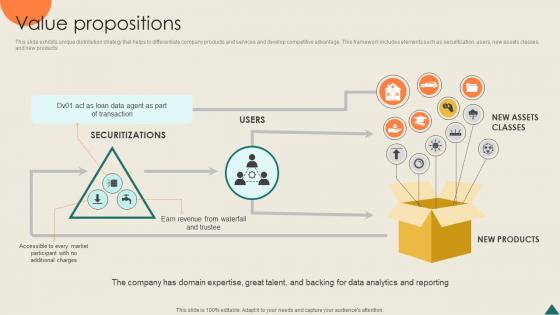
Value Propositions Financial Analytics Platform Investor Elevator Pitch Deck
This slide exhibits unique distribution strategy that helps to differentiate company products and services and develop competitive advantage. This framework includes elements such as securitization, users, new assets classes, and new products. If you are looking for a format to display your unique thoughts, then the professionally designed Value Propositions Financial Analytics Platform Investor Elevator Pitch Deck is the one for you. You can use it as a Google Slides template or a PowerPoint template. Incorporate impressive visuals, symbols, images, and other charts. Modify or reorganize the text boxes as you desire. Experiment with shade schemes and font pairings. Alter, share or cooperate with other people on your work. Download Value Propositions Financial Analytics Platform Investor Elevator Pitch Deck and find out how to give a successful presentation. Present a perfect display to your team and make your presentation unforgettable. This slide exhibits unique distribution strategy that helps to differentiate company products and services and develop competitive advantage. This framework includes elements such as securitization, users, new assets classes, and new products.
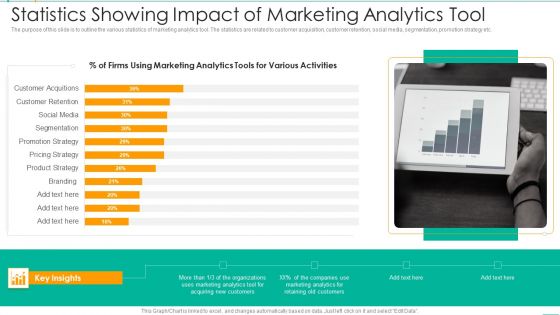
Statistics Showing Impact Of Marketing Analytics Tool Background PDF
The purpose of this slide is to outline the various statistics of marketing analytics tool. The statistics are related to customer acquisition, customer retention, social media, segmentation, promotion strategy etc. Showcasing this set of slides titled Statistics Showing Impact Of Marketing Analytics Tool Background PDF. The topics addressed in these templates are Marketing, Organizations, Customers. All the content presented in this PPT design is completely editable. Download it and make adjustments in color, background, font etc. as per your unique business setting.

Market Potential Cloud Based Predictive Analytics Software Pitch Deck
This slide showcases market share and growth driver of biotechnology market in which Cyclica operates. It showcases the market potential of Alfred camera through SOM, SAM and TAM value of global biotechnology market. If you are looking for a format to display your unique thoughts, then the professionally designed Market Potential Cloud Based Predictive Analytics Software Pitch Deck is the one for you. You can use it as a Google Slides template or a PowerPoint template. Incorporate impressive visuals, symbols, images, and other charts. Modify or reorganize the text boxes as you desire. Experiment with shade schemes and font pairings. Alter, share or cooperate with other people on your work. Download Market Potential Cloud Based Predictive Analytics Software Pitch Deck and find out how to give a successful presentation. Present a perfect display to your team and make your presentation unforgettable. This slide showcases market share and growth driver of biotechnology market in which Cyclica operates. It showcases the market potential of Alfred camera through SOM, SAM and TAM value of global biotechnology market.
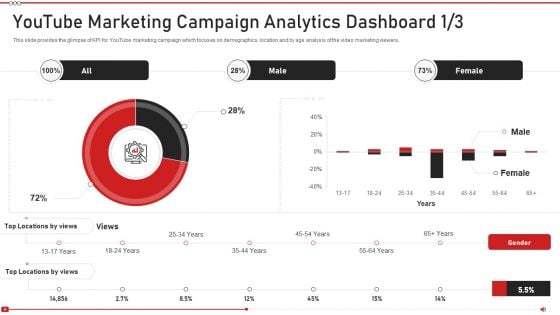
Advertising On Youtube Platform Youtube Marketing Campaign Analytics Ideas PDF
This slide provides the glimpse of KPI for YouTube marketing campaign which focuses on demographics, location and by age analysis of the video marketing viewers. Deliver an awe inspiring pitch with this creative advertising on youtube platform youtube marketing campaign analytics ideas pdf bundle. Topics like youtube marketing campaign analytics dashboard can be discussed with this completely editable template. It is available for immediate download depending on the needs and requirements of the user.
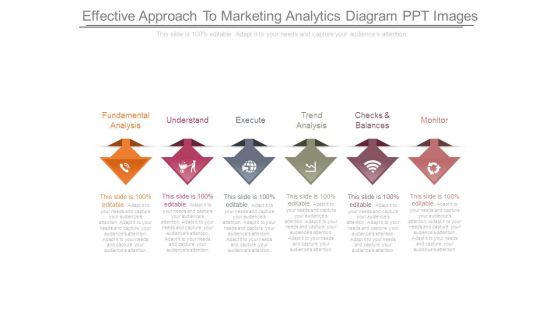
Effective Approach To Marketing Analytics Diagram Ppt Images
This is a effective approach to marketing analytics diagram ppt images. This is a six stage process. The stages in this process are fundamental analysis, understand, execute, trend analysis, checks and balances, monitor.
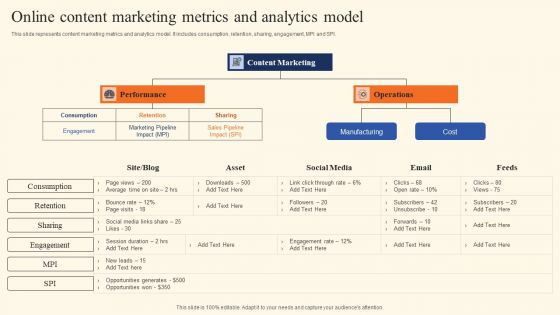
Online Content Marketing Metrics And Analytics Model Download PDF
This slide represents content marketing metrics and analytics model. It includes consumption, retention, sharing, engagement, MPI and SPI. Presenting Online Content Marketing Metrics And Analytics Model Download PDF to dispense important information. This template comprises two stages. It also presents valuable insights into the topics including Performance, Operations, Manufacturing. This is a completely customizable PowerPoint theme that can be put to use immediately. So, download it and address the topic impactfully.
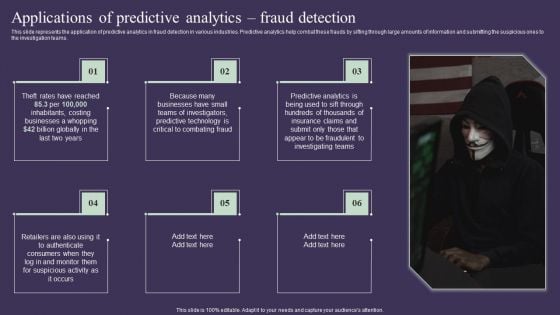
Projection Model Applications Of Predictive Analytics Fraud Detection Information PDF
This slide represents the application of predictive analytics in fraud detection in various industries. Predictive analytics help combat these frauds by sifting through large amounts of information and submitting the suspicious ones to the investigation teams. Whether you have daily or monthly meetings, a brilliant presentation is necessary. Projection Model Applications Of Predictive Analytics Fraud Detection Information PDF can be your best option for delivering a presentation. Represent everything in detail using Projection Model Applications Of Predictive Analytics Fraud Detection Information PDF and make yourself stand out in meetings. The template is versatile and follows a structure that will cater to your requirements. All the templates prepared by Slidegeeks are easy to download and edit. Our research experts have taken care of the corporate themes as well. So, give it a try and see the results.
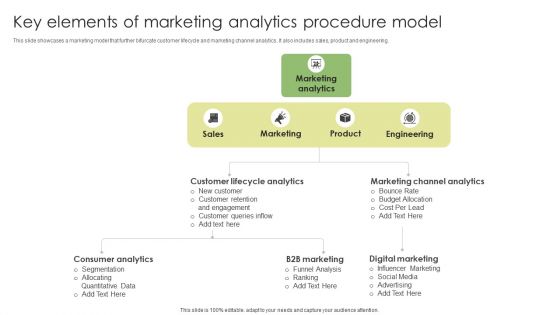
Key Elements Of Marketing Analytics Procedure Model Clipart PDF
This slide showcases a marketing model that further bifurcate customer lifecycle and marketing channel analytics. It also includes sales, product and engineering. Presenting Key Elements Of Marketing Analytics Procedure Model Clipart PDF to dispense important information. This template comprises three stages. It also presents valuable insights into the topics including Sales, Marketing, Engineering. This is a completely customizable PowerPoint theme that can be put to use immediately. So, download it and address the topic impactfully.
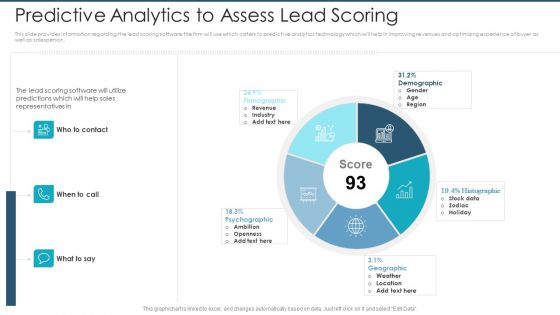
Predictive Analytics To Assess Lead Scoring Structure PDF
This slide provides information regarding the lead scoring software the firm will use which caters to predictive analytics technology which will help in improving revenues and optimizing experience of buyer as well as salesperson. Deliver an awe-inspiring pitch with this creative predictive analytics to assess lead scoring structure pdf. bundle. Topics like revenue, openness, demographic, psychographic, geographic can be discussed with this completely editable template. It is available for immediate download depending on the needs and requirements of the user.
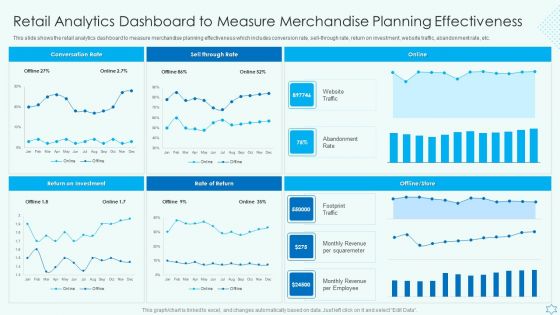
Retail Analytics Dashboard To Measure Merchandise Planning Effectiveness Diagrams PDF
This slide shows the retail analytics dashboard to measure merchandise planning effectiveness which includes conversion rate, sell through rate, return on investment, website traffic, abandonment rate, etc. Are you searching for a Retail Analytics Dashboard To Measure Merchandise Planning Effectiveness Diagrams PDF that is uncluttered, straightforward, and original Its easy to edit, and you can change the colors to suit your personal or business branding. For a presentation that expresses how much effort you have put in, this template is ideal With all of its features, including tables, diagrams, statistics, and lists, its perfect for a business plan presentation. Make your ideas more appealing with these professional slides. Download Retail Analytics Dashboard To Measure Merchandise Planning Effectiveness Diagrams PDF from Slidegeeks today.
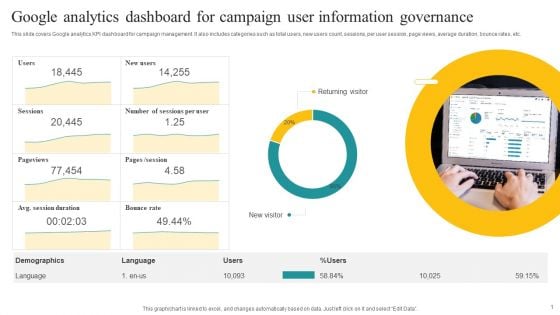
Google Analytics Dashboard For Campaign User Information Governance Demonstration PDF
This slide covers Google analytics KPI dashboard for campaign management. It also includes categories such as total users, new users count, sessions, per user session, page views, average duration, bounce rates, etc. Showcasing this set of slides titled Google Analytics Dashboard For Campaign User Information Governance Demonstration PDF. The topics addressed in these templates are Returning Visitor, New Visitor, Demographics. All the content presented in this PPT design is completely editable. Download it and make adjustments in color, background, font etc. as per your unique business setting.
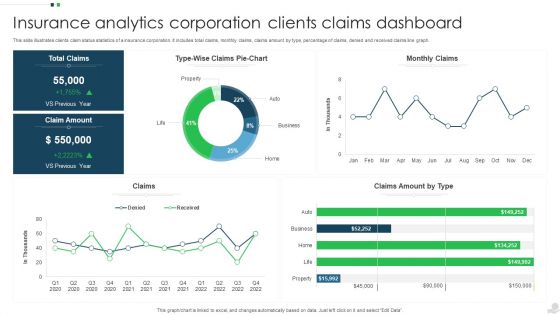
Insurance Analytics Corporation Clients Claims Dashboard Summary PDF
This slide illustrates clients claim status statistics of a insurance corporation. It includes total claims, monthly claims, claims amount by type, percentage of claims, denied and received claims line graph. Showcasing this set of slides titled Insurance Analytics Corporation Clients Claims Dashboard Summary PDF. The topics addressed in these templates are Insurance Analytics Corporation, Clients Claims Dashboard. All the content presented in this PPT design is completely editable. Download it and make adjustments in color, background, font etc. as per your unique business setting.
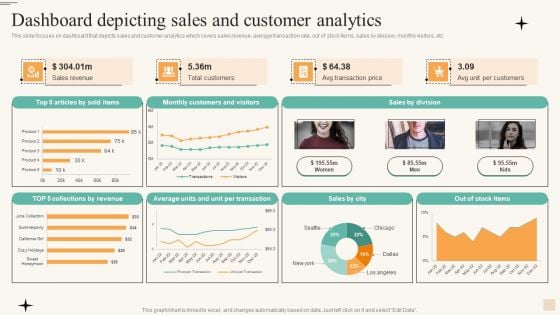
Dashboard Depicting Sales And Customer Analytics Infographics PDF
This slide focuses on dashboard that depicts sales and customer analytics which covers sales revenue, average transaction rate, out of stock items, sales by division, monthly visitors, etc. If you are looking for a format to display your unique thoughts, then the professionally designed Dashboard Depicting Sales And Customer Analytics Infographics PDF is the one for you. You can use it as a Google Slides template or a PowerPoint template. Incorporate impressive visuals, symbols, images, and other charts. Modify or reorganize the text boxes as you desire. Experiment with shade schemes and font pairings. Alter, share or cooperate with other people on your work. Download Dashboard Depicting Sales And Customer Analytics Infographics PDF and find out how to give a successful presentation. Present a perfect display to your team and make your presentation unforgettable.
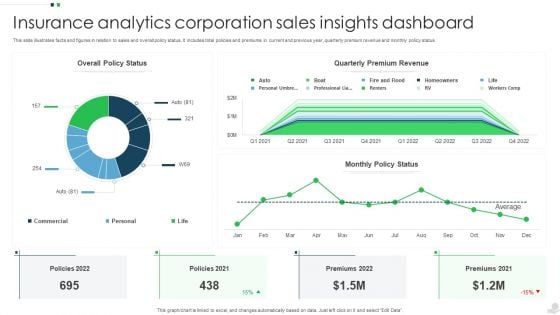
Insurance Analytics Corporation Sales Insights Dashboard Structure PDF
This slide illustrates facts and figures in relation to sales and overall policy status. It includes total policies and premiums in current and previous year, quarterly premium revenue and monthly policy status. Pitch your topic with ease and precision using this Insurance Analytics Corporation Sales Insights Dashboard Structure PDF. This layout presents information on Quarterly Premium Revenue, Sales Insights Dashboard, Insurance Analytics Corporation. It is also available for immediate download and adjustment. So, changes can be made in the color, design, graphics or any other component to create a unique layout.
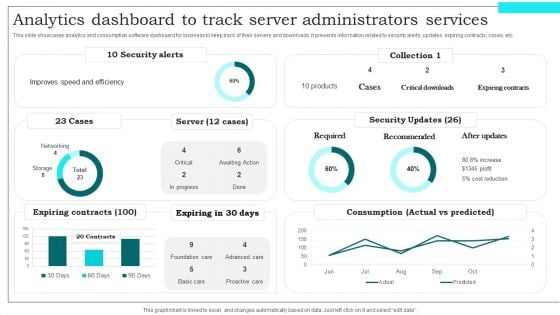
Analytics Dashboard To Track Server Administrators Services Demonstration PDF
This slide showcases analytics and consumption software dashboard for business to keep track of their servers and downloads. It presents information related to security alerts, updates, expiring contracts, cases, etc. Showcasing this set of slides titled Analytics Dashboard To Track Server Administrators Services Demonstration PDF. The topics addressed in these templates are Expiring Contracts, Security Updates, Required. All the content presented in this PPT design is completely editable. Download it and make adjustments in color, background, font etc. as per your unique business setting.
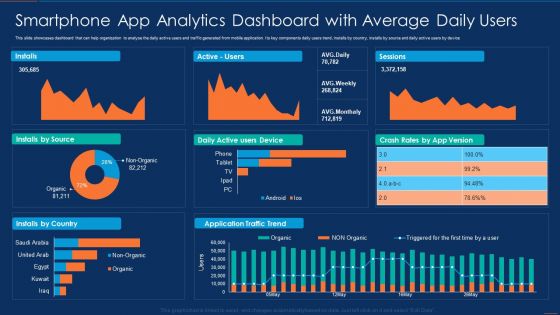
Smartphone App Analytics Dashboard With Average Daily Users Microsoft PDF
This slide showcases dashboard that can help organization to analyse the daily active users and traffic generated from mobile application. Its key components daily users trend, installs by country, installs by source and daily active users by device. Showcasing this set of slides titled Smartphone App Analytics Dashboard With Average Daily Users Microsoft PDF. The topics addressed in these templates are Smartphone App Analytics Dashboard With Average Daily Users. All the content presented in this PPT design is completely editable. Download it and make adjustments in color, background, font etc. as per your unique business setting.
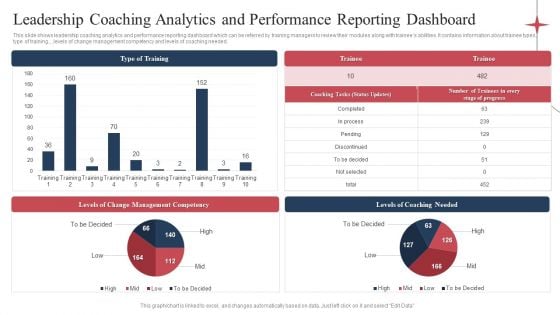
Leadership Coaching Analytics And Performance Reporting Dashboard Demonstration PDF
This slide shows leadership coaching analytics and performance reporting dashboard which can be referred by training managers to review their modules along with trainees abilities. It contains information about trainee types, type of training., ,levels of change management competency and levels of coaching needed. Pitch your topic with ease and precision using this Leadership Coaching Analytics And Performance Reporting Dashboard Demonstration PDF. This layout presents information on Levels Coaching Needed, Levels Change Management, Type Training. It is also available for immediate download and adjustment. So, changes can be made in the color, design, graphics or any other component to create a unique layout.
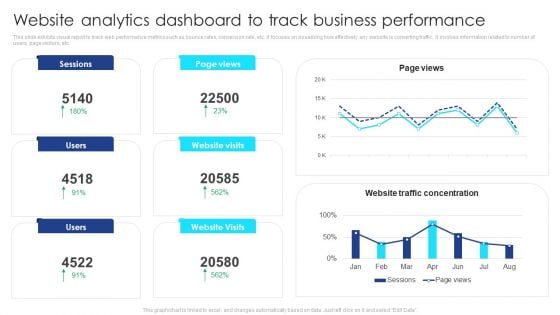
Website Analytics Dashboard To Track Business Performance Guidelines PDF
This slide exhibits visual report to track web performance metrics such as bounce rates, conversion rate, etc. It focuses on visualizing how effectively any website is converting traffic. It involves information related to number of users, page visitors, etc. Pitch your topic with ease and precision using this Website Analytics Dashboard To Track Business Performance Guidelines PDF. This layout presents information on Website Analytics, Dashboard To Track, Business Performance. It is also available for immediate download and adjustment. So, changes can be made in the color, design, graphics or any other component to create a unique layout.
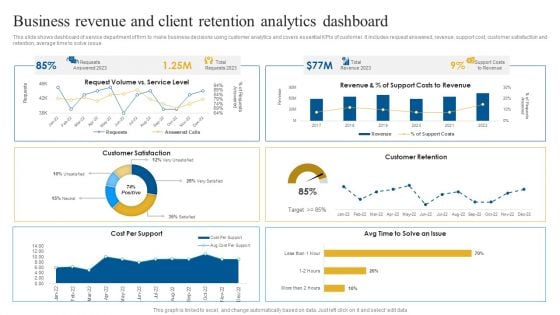
Business Revenue And Client Retention Analytics Dashboard Brochure PDF
This slide shows dashboard of service department of firm to make business decisions using customer analytics and covers essential KPIs of customer. It includes request answered, revenue, support cost, customer satisfaction and retention, average time to solve issue. Showcasing this set of slides titled Business Revenue And Client Retention Analytics Dashboard Brochure PDF. The topics addressed in these templates are Customer Satisfaction, Customer Retention, Revenue. All the content presented in this PPT design is completely editable. Download it and make adjustments in color, background, font etc. as per your unique business setting.
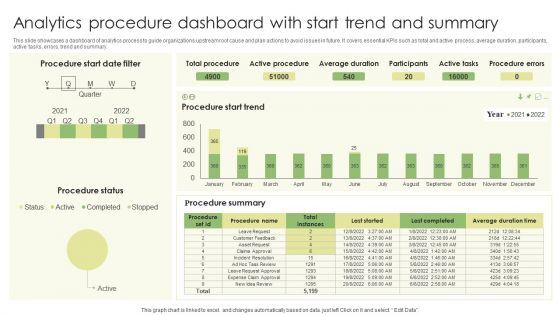
Analytics Procedure Dashboard With Start Trend And Summary Infographics PDF
This slide showcases a dashboard of analytics process to guide organizations upstream root cause and plan actions to avoid issues in future. It covers essential KPIs such as total and active process, average duration, participants, active tasks, errors, trend and summary. Showcasing this set of slides titled Analytics Procedure Dashboard With Start Trend And Summary Infographics PDF. The topics addressed in these templates are Procedure Status, Average Duration, Active Tasks. All the content presented in this PPT design is completely editable. Download it and make adjustments in color, background, font etc. as per your unique business setting.
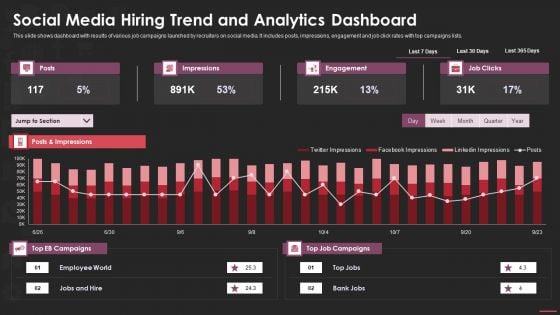
Social Media Hiring Trend And Analytics Dashboard Microsoft PDF
This slide shows dashboard with results of various job campaigns launched by recruiters on social media. It includes posts, impressions, engagement and job click rates with top campaigns lists. Pitch your topic with ease and precision using this social media hiring trend and analytics dashboard microsoft pdf. This layout presents information on social media hiring trend and analytics dashboard. It is also available for immediate download and adjustment. So, changes can be made in the color, design, graphics or any other component to create a unique layout.
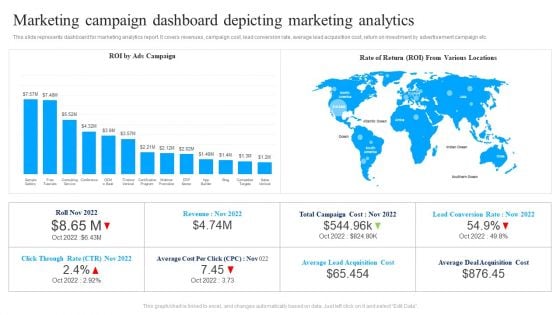
Marketing Campaign Dashboard Depicting Marketing Analytics Ppt Summary Infographics PDF
This slide represents dashboard for marketing analytics report. It covers revenues, campaign cost, lead conversion rate, average lead acquisition cost, return on investment by advertisement campaign etc. Pitch your topic with ease and precision using this Marketing Campaign Dashboard Depicting Marketing Analytics Ppt Summary Infographics PDF. This layout presents information on ROI Ads Campaign, Rate Of Return, Various Locations. It is also available for immediate download and adjustment. So, changes can be made in the color, design, graphics or any other component to create a unique layout.
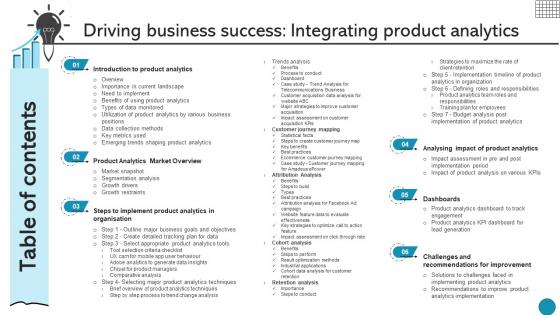
Table Of Contents Driving Business Success Integrating Product Analytics
Are you searching for a Table Of Contents Driving Business Success Integrating Product Analytics that is uncluttered, straightforward, and original Its easy to edit, and you can change the colors to suit your personal or business branding. For a presentation that expresses how much effort you have put in, this template is ideal With all of its features, including tables, diagrams, statistics, and lists, its perfect for a business plan presentation. Make your ideas more appealing with these professional slides. Download Table Of Contents Driving Business Success Integrating Product Analytics from Slidegeeks today. Our Table Of Contents Driving Business Success Integrating Product Analytics are topically designed to provide an attractive backdrop to any subject. Use them to look like a presentation pro.
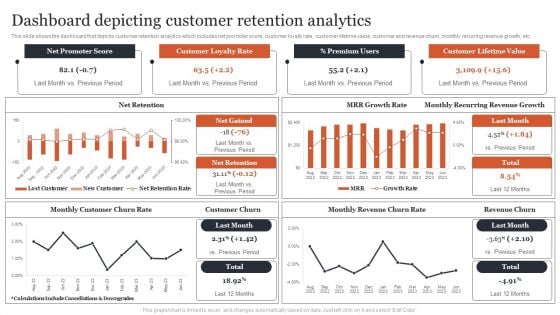
Managing Customer Attrition Dashboard Depicting Customer Retention Analytics Formats PDF
This slide shows the dashboard that depicts customer retention analytics which includes net promoter score, customer loyalty rate, customer lifetime value, customer and revenue churn, monthly recurring revenue growth, etc. Get a simple yet stunning designed Managing Customer Attrition Dashboard Depicting Customer Retention Analytics Formats PDF. It is the best one to establish the tone in your meetings. It is an excellent way to make your presentations highly effective. So, download this PPT today from Slidegeeks and see the positive impacts. Our easy-to-edit Managing Customer Attrition Dashboard Depicting Customer Retention Analytics Formats PDF can be your go-to option for all upcoming conferences and meetings. So, what are you waiting for Grab this template today.
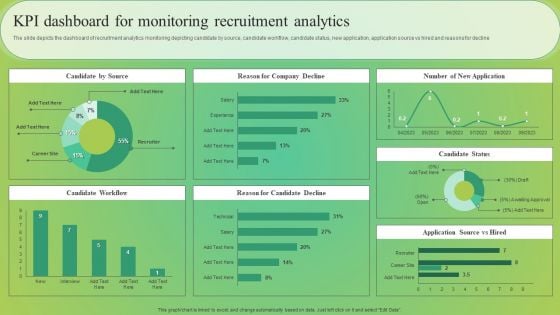
KPI Dashboard For Monitoring Recruitment Analytics Professional PDF
The slide depicts the dashboard of recruitment analytics monitoring depicting candidate by source, candidate workflow, candidate status, new application, application source vs hired and reasons for decline. Do you have to make sure that everyone on your team knows about any specific topic I yes, then you should give KPI Dashboard For Monitoring Recruitment Analytics Professional PDF a try. Our experts have put a lot of knowledge and effort into creating this impeccable KPI Dashboard For Monitoring Recruitment Analytics Professional PDF. You can use this template for your upcoming presentations, as the slides are perfect to represent even the tiniest detail. You can download these templates from the Slidegeeks website and these are easy to edit. So grab these today.
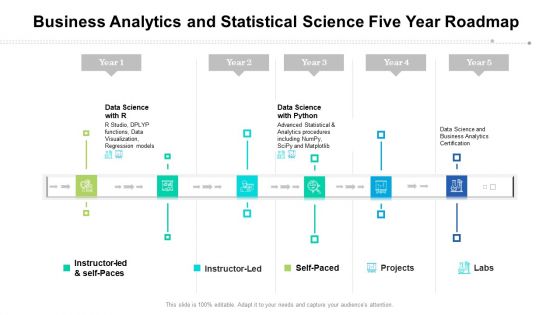
Business Analytics And Statistical Science Five Year Roadmap Rules
We present our business analytics and statistical science five year roadmap rules. This PowerPoint layout is easy to edit so you can change the font size, font type, color, and shape conveniently. In addition to this, the PowerPoint layout is Google Slides compatible, so you can share it with your audience and give them access to edit it. Therefore, download and save this well researched business analytics and statistical science five year roadmap rules in different formats like PDF, PNG, and JPG to smoothly execute your business plan.
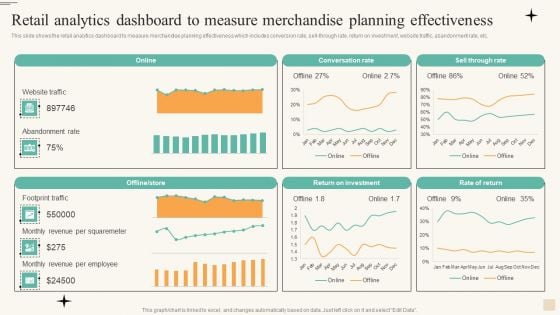
Retail Analytics Dashboard To Measure Merchandise Planning Effectiveness Microsoft PDF
This slide shows the retail analytics dashboard to measure merchandise planning effectiveness which includes conversion rate, sell through rate, return on investment, website traffic, abandonment rate, etc. Make sure to capture your audiences attention in your business displays with our gratis customizable Retail Analytics Dashboard To Measure Merchandise Planning Effectiveness Microsoft PDF. These are great for business strategies, office conferences, capital raising or task suggestions. If you desire to acquire more customers for your tech business and ensure they stay satisfied, create your own sales presentation with these plain slides.
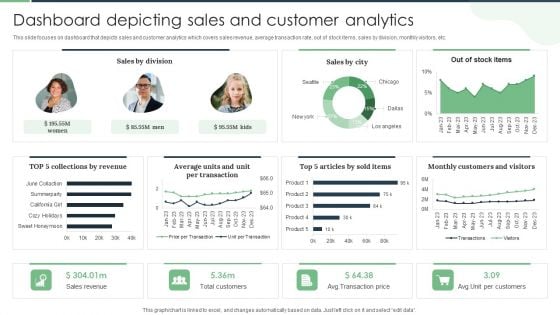
Dashboard Depicting Sales And Customer Analytics Professional PDF
This slide focuses on dashboard that depicts sales and customer analytics which covers sales revenue, average transaction rate, out of stock items, sales by division, monthly visitors, etc. Make sure to capture your audiences attention in your business displays with our gratis customizable Dashboard Depicting Sales And Customer Analytics Professional PDF. These are great for business strategies, office conferences, capital raising or task suggestions. If you desire to acquire more customers for your tech business and ensure they stay satisfied, create your own sales presentation with these plain slides.
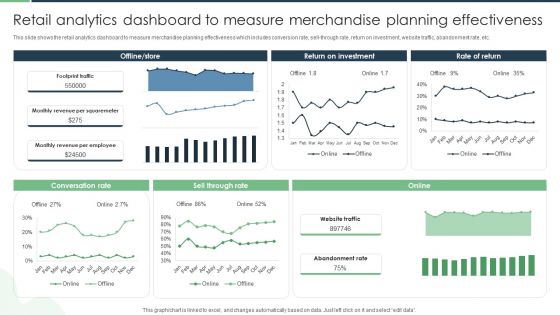
Retail Analytics Dashboard To Measure Merchandise Planning Effectiveness Designs PDF
Do you have to make sure that everyone on your team knows about any specific topic I yes, then you should give Retail Analytics Dashboard To Measure Merchandise Planning Effectiveness Designs PDF a try. Our experts have put a lot of knowledge and effort into creating this impeccable Retail Analytics Dashboard To Measure Merchandise Planning Effectiveness Designs PDF. You can use this template for your upcoming presentations, as the slides are perfect to represent even the tiniest detail. You can download these templates from the Slidegeeks website and these are easy to edit. So grab these today.
Projection Model Predictive Analytics Model Performance Tracking Dashboard Microsoft PDF
This slide represents the predictive analytics model performance tracking dashboard, and it covers the details of total visitors, total buyers, total products added to the cart, filters by date and category, visitors to clients conversion rate, and so on. Find a pre-designed and impeccable Projection Model Predictive Analytics Model Performance Tracking Dashboard Microsoft PDF. The templates can ace your presentation without additional effort. You can download these easy-to-edit presentation templates to make your presentation stand out from others. So, what are you waiting for Download the template from Slidegeeks today and give a unique touch to your presentation.
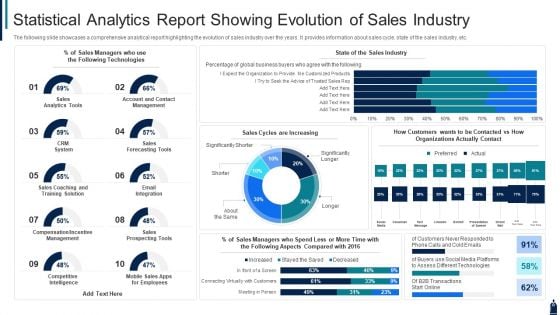
Statistical Analytics Report Showing Evolution Of Sales Industry Diagrams PDF
The following slide showcases a comprehensive analytical report highlighting the evolution of sales industry over the years. It provides information about sales cycle, state of the sales industry, etc. Showcasing this set of slides titled statistical analytics report showing evolution of sales industry diagrams pdf. The topics addressed in these templates are sales, technologies, system. All the content presented in this PPT design is completely editable. Download it and make adjustments in color, background, font etc. as per your unique business setting.
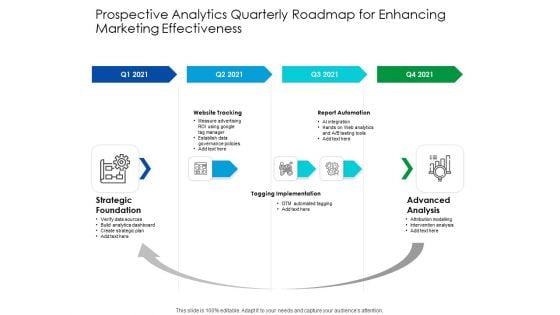
Predictive Analytics Quarterly Roadmap For Enhancing Marketing Effectiveness Inspiration
We present our predictive analytics quarterly roadmap for enhancing marketing effectiveness inspiration. This PowerPoint layout is easy to edit so you can change the font size, font type, color, and shape conveniently. In addition to this, the PowerPoint layout is Google Slides compatible, so you can share it with your audience and give them access to edit it. Therefore, download and save this well researched predictive analytics quarterly roadmap for enhancing marketing effectiveness inspiration in different formats like PDF, PNG, and JPG to smoothly execute your business plan.
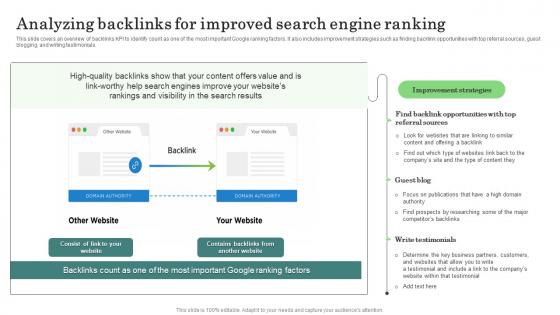
Analyzing Backlinks Improved Major Promotional Analytics Future Trends Sample Pdf
This slide covers an overview of backlinks KPI to identify count as one of the most important Google ranking factors. It also includes improvement strategies such as finding backlink opportunities with top referral sources, guest blogging, and writing testimonials. Do you know about Slidesgeeks Analyzing Backlinks Improved Major Promotional Analytics Future Trends Sample Pdf These are perfect for delivering any kind od presentation. Using it, create PowerPoint presentations that communicate your ideas and engage audiences. Save time and effort by using our pre designed presentation templates that are perfect for a wide range of topic. Our vast selection of designs covers a range of styles, from creative to business, and are all highly customizable and easy to edit. Download as a PowerPoint template or use them as Google Slides themes. This slide covers an overview of backlinks KPI to identify count as one of the most important Google ranking factors. It also includes improvement strategies such as finding backlink opportunities with top referral sources, guest blogging, and writing testimonials.
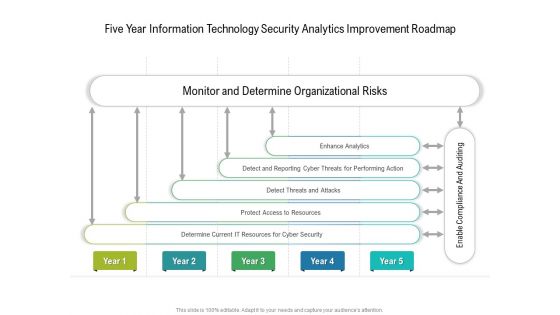
Five Year Information Technology Security Analytics Improvement Roadmap Infographics
We present our five year information technology security analytics improvement roadmap infographics. This PowerPoint layout is easy to edit so you can change the font size, font type, color, and shape conveniently. In addition to this, the PowerPoint layout is Google Slides compatible, so you can share it with your audience and give them access to edit it. Therefore, download and save this well researched five year information technology security analytics improvement roadmap infographics in different formats like PDF, PNG, and JPG to smoothly execute your business plan.
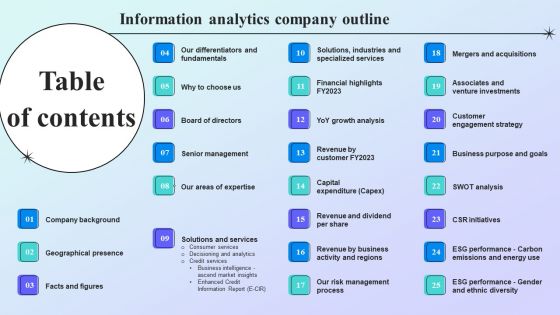
Information Analytics Company Outline Tables Of Content Template PDF
Whether you have daily or monthly meetings, a brilliant presentation is necessary. Information Analytics Company Outline Tables Of Content Template PDF can be your best option for delivering a presentation. Represent everything in detail using Information Analytics Company Outline Tables Of Content Template PDF and make yourself stand out in meetings. The template is versatile and follows a structure that will cater to your requirements. All the templates prepared by Slidegeeks are easy to download and edit. Our research experts have taken care of the corporate themes as well. So, give it a try and see the results.
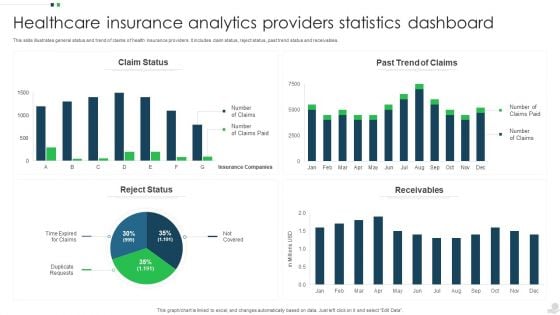
Healthcare Insurance Analytics Providers Statistics Dashboard Mockup PDF
This slide illustrates general status and trend of claims of health insurance providers. It includes claim status, reject status, past trend status and receivables. Showcasing this set of slides titled Healthcare Insurance Analytics Providers Statistics Dashboard Mockup PDF. The topics addressed in these templates are Claim Status, Past Trend Claims, Receivables. All the content presented in this PPT design is completely editable. Download it and make adjustments in color, background, font etc. as per your unique business setting.

Projection Model Predictive Analytics Classification Model Introduction Rules PDF
This slide describes the overview of the classification model used in predictive analytics, including the questions it answers. It also contains algorithms used in this model, such as random forest, gradient boosted model, convolution neural network, bagging, and stacking.Are you searching for a Projection Model Predictive Analytics Classification Model Introduction Rules PDF that is uncluttered, straightforward, and original Its easy to edit, and you can change the colors to suit your personal or business branding. For a presentation that expresses how much effort you have put in, this template is ideal With all of its features, including tables, diagrams, statistics, and lists, its perfect for a business plan presentation. Make your ideas more appealing with these professional slides. Download Projection Model Predictive Analytics Classification Model Introduction Rules PDF from Slidegeeks today.
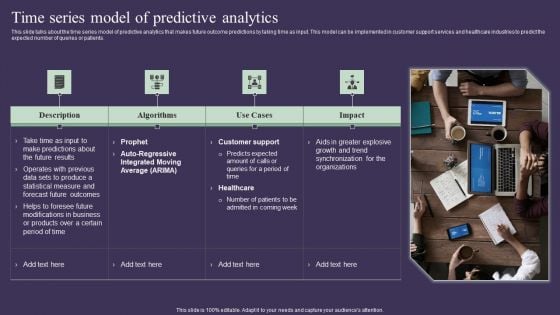
Projection Model Time Series Model Of Predictive Analytics Designs PDF
This slide talks about the time series model of predictive analytics that makes future outcome predictions by taking time as input. This model can be implemented in customer support services and healthcare industries to predict the expected number of queries or patients. Whether you have daily or monthly meetings, a brilliant presentation is necessary. Projection Model Time Series Model Of Predictive Analytics Designs PDF can be your best option for delivering a presentation. Represent everything in detail using Projection Model Time Series Model Of Predictive Analytics Designs PDF and make yourself stand out in meetings. The template is versatile and follows a structure that will cater to your requirements. All the templates prepared by Slidegeeks are easy to download and edit. Our research experts have taken care of the corporate themes as well. So, give it a try and see the results.
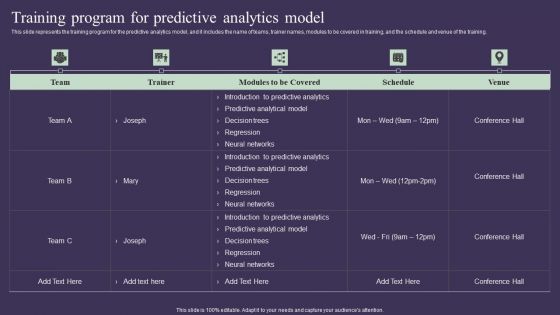
Projection Model Training Program For Predictive Analytics Model Sample PDF
This slide represents the training program for the predictive analytics model, and it includes the name of teams, trainer names, modules to be covered in training, and the schedule and venue of the training. If you are looking for a format to display your unique thoughts, then the professionally designed Projection Model Training Program For Predictive Analytics Model Sample PDF is the one for you. You can use it as a Google Slides template or a PowerPoint template. Incorporate impressive visuals, symbols, images, and other charts. Modify or reorganize the text boxes as you desire. Experiment with shade schemes and font pairings. Alter, share or cooperate with other people on your work. Download Projection Model Training Program For Predictive Analytics Model Sample PDF and find out how to give a successful presentation. Present a perfect display to your team and make your presentation unforgettable.
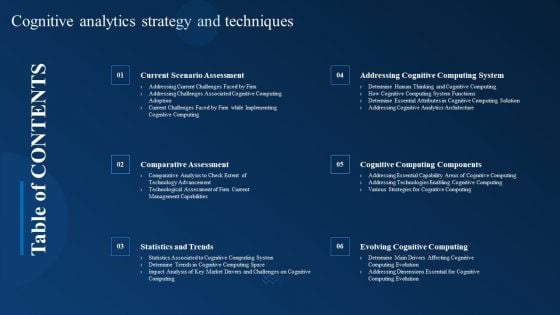
Table Of Contents Cognitive Analytics Strategy And Techniques Introduction PDF
Whether you have daily or monthly meetings, a brilliant presentation is necessary. Table Of Contents Cognitive Analytics Strategy And Techniques Introduction PDF can be your best option for delivering a presentation. Represent everything in detail using Table Of Contents Cognitive Analytics Strategy And Techniques Introduction PDF and make yourself stand out in meetings. The template is versatile and follows a structure that will cater to your requirements. All the templates prepared by Slidegeeks are easy to download and edit. Our research experts have taken care of the corporate themes as well. So, give it a try and see the results.
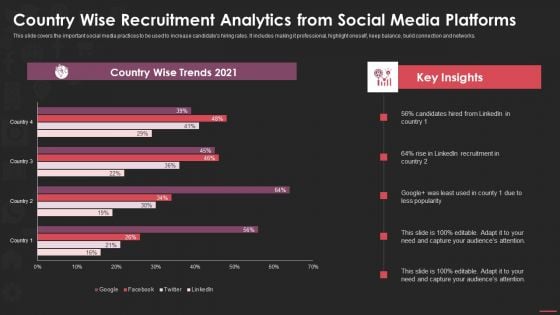
Country Wise Recruitment Analytics From Social Media Platforms Clipart PDF
This slide covers the important social media practices to be used to increase candidates hiring rates. It includes making it professional, highlight oneself, keep balance, build connection and networks. Showcasing this set of slides titled country wise recruitment analytics from social media platforms clipart pdf. The topics addressed in these templates are country wise recruitment analytics from social media platforms. All the content presented in this PPT design is completely editable. Download it and make adjustments in color, background, font etc. as per your unique business setting.
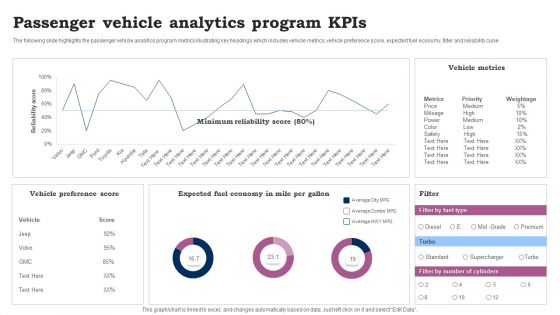
Passenger Vehicle Analytics Program Kpis Ppt Pictures Demonstration PDF
The following slide highlights the passenger vehicle analytics program metrics illustrating key headings which includes vehicle metrics, vehicle preference score, expected fuel economy, filter and reliability curve. Showcasing this set of slides titled Passenger Vehicle Analytics Program Kpis Ppt Pictures Demonstration PDF. The topics addressed in these templates are Vehicle Preference Score, Vehicle Metrics, Expected Fuel Economy. All the content presented in this PPT design is completely editable. Download it and make adjustments in color, background, font etc. as per your unique business setting.

Sap Analytics Cloud Training Plan For Organization Employees Slides PDF
The purpose of this slide is to showcase the training plan for SAP Analytics Cloud coaching. It contains information regarding the basic perquisite, trainer name and number of attendees. It also contains details of training modules along with hours allocated, expected completion date. Whether you have daily or monthly meetings, a brilliant presentation is necessary. Sap Analytics Cloud Training Plan For Organization Employees Slides PDF can be your best option for delivering a presentation. Represent everything in detail using Sap Analytics Cloud Training Plan For Organization Employees Slides PDF and make yourself stand out in meetings. The template is versatile and follows a structure that will cater to your requirements. All the templates prepared by Slidegeeks are easy to download and edit. Our research experts have taken care of the corporate themes as well. So, give it a try and see the results.
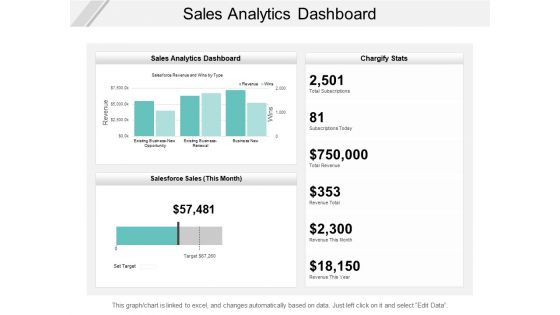
Sales Analytics Dashboard Ppt PowerPoint Presentation Outline Diagrams
Presenting this set of slides with name sales analytics dashboard ppt powerpoint presentation outline diagrams. The topics discussed in these slides are buzz marketing, process, strategy. This is a completely editable PowerPoint presentation and is available for immediate download. Download now and impress your audience.
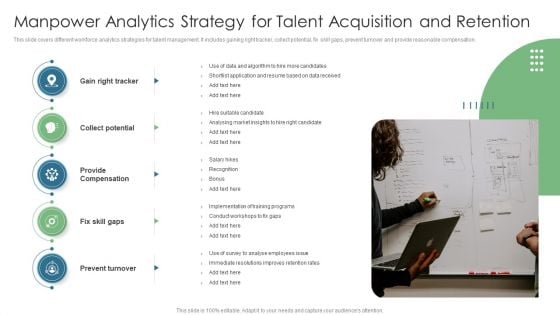
Manpower Analytics Strategy For Talent Acquisition And Retention Summary PDF
This slide covers different workforce analytics strategies for talent management. It includes gaining right tracker, collect potential, fix skill gaps, prevent turnover and provide reasonable compensation. Presenting Manpower Analytics Strategy For Talent Acquisition And Retention Summary PDF to dispense important information. This template comprises five stages. It also presents valuable insights into the topics including Gain Right Tracker, Collect Potential, Provide Compensation, Fix Skill Gaps. This is a completely customizable PowerPoint theme that can be put to use immediately. So, download it and address the topic impactfully.
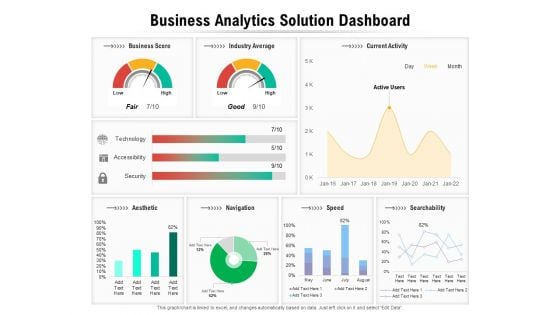
Business Analytics Solution Dashboard Ppt PowerPoint Presentation File Clipart PDF
Presenting this set of slides with name business analytics solution dashboard ppt powerpoint presentation file clipart pdf. The topics discussed in these slides are aesthetic, navigation, searchability. This is a completely editable PowerPoint presentation and is available for immediate download. Download now and impress your audience.
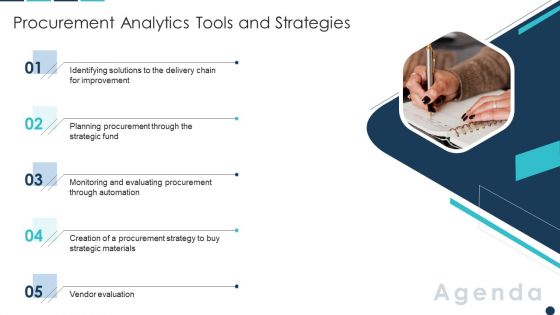
Agenda Procurement Analytics Tools And Strategies Diagrams PDF
This is a Agenda Procurement Analytics Tools And Strategies Diagrams PDF template with various stages. Focus and dispense information on five stages using this creative set, that comes with editable features. It contains large content boxes to add your information on topics like Agenda. You can also showcase facts, figures, and other relevant content using this PPT layout. Grab it now.
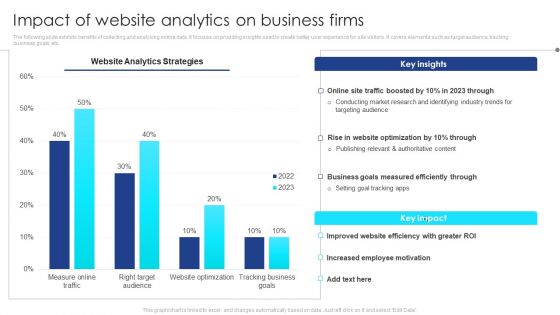
Impact Of Website Analytics On Business Firms Ideas PDF
The following slide exhibits benefits of collecting and analysing online data. It focuses on providing insights used to create better user experience for site visitors. It covers elements such as target audience, tracking business goals, etc. Showcasing this set of slides titled Impact Of Website Analytics On Business Firms Ideas PDF. The topics addressed in these templates are Business Goals, Employee Motivation, Website Efficiency, Website Optimization, Online Site Traffic. All the content presented in this PPT design is completely editable. Download it and make adjustments in color, background, font etc. as per your unique business setting.
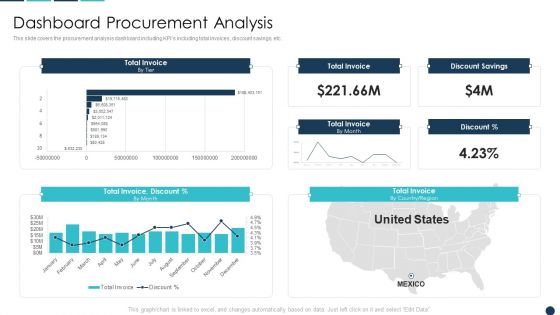
Procurement Analytics Tools And Strategies Dashboard Procurement Analysis Inspiration PDF
This slide covers the procurement analysis dashboard including KPIs including total invoices, discount savings, etc. Deliver and pitch your topic in the best possible manner with this Procurement Analytics Tools And Strategies Dashboard Procurement Analysis Inspiration PDF. Use them to share invaluable insights on Total Invoice, Discount Savings, Invoice Discount and impress your audience. This template can be altered and modified as per your expectations. So, grab it now.
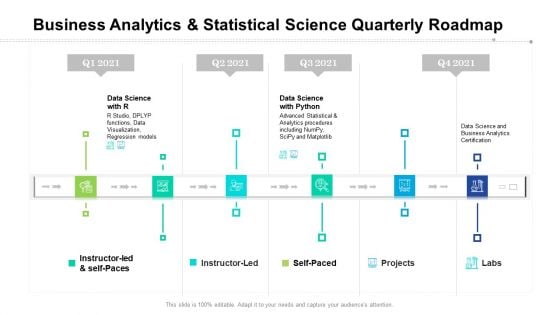
Business Analytics And Statistical Science Quarterly Roadmap Demonstration
Introducing our business analytics and statistical science quarterly roadmap demonstration. This PPT presentation is Google Slides compatible, therefore, you can share it easily with the collaborators for measuring the progress. Also, the presentation is available in both standard screen and widescreen aspect ratios. So edit the template design by modifying the font size, font type, color, and shapes as per your requirements. As this PPT design is fully editable it can be presented in PDF, JPG and PNG formats.

Home Insurance Analytics Statistics With Settlement Time Dashboard Ideas PDF
This slide illustrates home insurance facts and figures of the organization. It includes monthly claim volume, claim status, average notification time, acknowledged time, decision time etc. Pitch your topic with ease and precision using this Home Insurance Analytics Statistics With Settlement Time Dashboard Ideas PDF. This layout presents information on Average Acknowledged Time, Average Decision Time, Average Lead Time. It is also available for immediate download and adjustment. So, changes can be made in the color, design, graphics or any other component to create a unique layout.
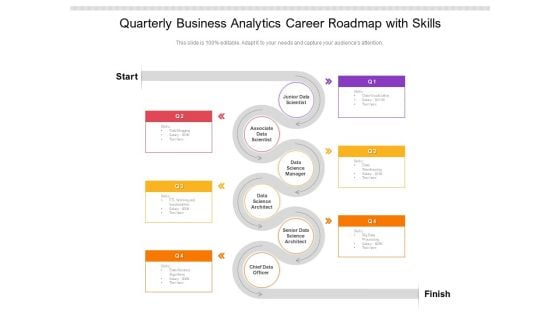
Quarterly Business Analytics Career Roadmap With Skills Themes
Introducing our quarterly business analytics career roadmap with skills themes. This PPT presentation is Google Slides compatible, therefore, you can share it easily with the collaborators for measuring the progress. Also, the presentation is available in both standard screen and widescreen aspect ratios. So edit the template design by modifying the font size, font type, color, and shapes as per your requirements. As this PPT design is fully editable it can be presented in PDF, JPG and PNG formats.
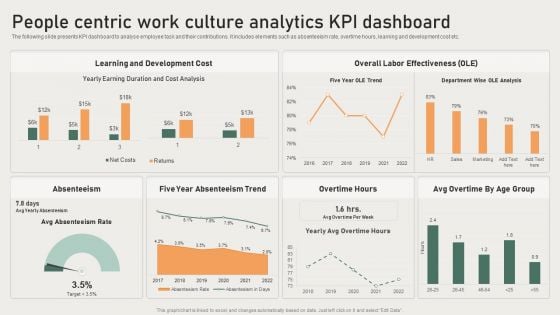
People Centric Work Cuture Analytics Kpi Dashboard Brochure PDF
The following slide presents KPI dashboard to analyse employee task and their contributions. It includes elements such as absenteeism rate, overtime hours, learning and development cost etc. Showcasing this set of slides titled People Centric Work Cuture Analytics Kpi Dashboard Brochure PDF. The topics addressed in these templates are Development Cost, Overall Labor Effectiveness, Absenteeism. All the content presented in this PPT design is completely editable. Download it and make adjustments in color, background, font etc. as per your unique business setting.
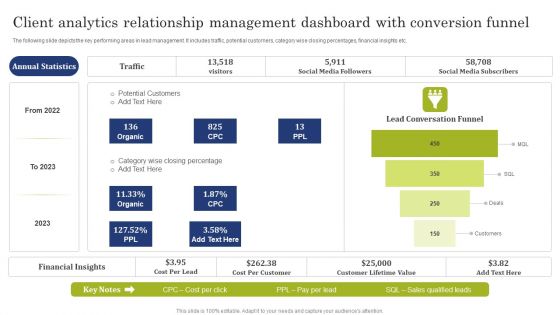
Client Analytics Relationship Management Dashboard With Conversion Funnel Demonstration PDF
The following slide depicts the key performing areas in lead management. It includes traffic, potential customers, category wise closing percentages, financial insights etc. Pitch your topic with ease and precision using this Client Analytics Relationship Management Dashboard With Conversion Funnel Demonstration PDF. This layout presents information on Potential Customers, Social Media Followers, Social Media Subscribers. It is also available for immediate download and adjustment. So, changes can be made in the color, design, graphics or any other component to create a unique layout.

Quarterly Information Technology Security Analytics Improvement Roadmap Template
Presenting our innovatively structured quarterly information technology security analytics improvement roadmap template Template. Showcase your roadmap process in different formats like PDF, PNG, and JPG by clicking the download button below. This PPT design is available in both Standard Screen and Widescreen aspect ratios. It can also be easily personalized and presented with modified font size, font type, color, and shapes to measure your progress in a clear way.

Information Technology Security Team Analytics Dashboard With KPI Themes PDF
This slide elaborates about the number of incidents that have taken place in cyber security and the malware types with per incident. It also includes the number of open and resolved ticked. Showcasing this set of slides titled Information Technology Security Team Analytics Dashboard With KPI Themes PDF. The topics addressed in these templates are Open Incidents, Resolved Incidents, Open Tickets, Resolved Tickets. All the content presented in this PPT design is completely editable. Download it and make adjustments in color, background, font etc. as per your unique business setting.

Procurement Analytics Tools And Strategies Procurement Spend Analysis Graphics PDF
This slide covers procurement spend analysis dashboard including KPIs such as invoice count, invoices information, due dates, spend by payment terms, supplier payment terms, spend by entity, spend by category, spend by country.Deliver an awe inspiring pitch with this creative Procurement Analytics Tools And Strategies Procurement Spend Analysis Graphics PDF bundle. Topics like Transactions, Invoice Count, Spend Category can be discussed with this completely editable template. It is available for immediate download depending on the needs and requirements of the user.
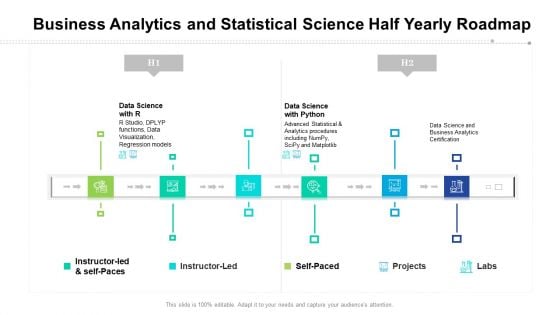
Business Analytics And Statistical Science Half Yearly Roadmap Summary
Presenting our innovatively structured business analytics and statistical science half yearly roadmap summary Template. Showcase your roadmap process in different formats like PDF, PNG, and JPG by clicking the download button below. This PPT design is available in both Standard Screen and Widescreen aspect ratios. It can also be easily personalized and presented with modified font size, font type, color, and shapes to measure your progress in a clear way.
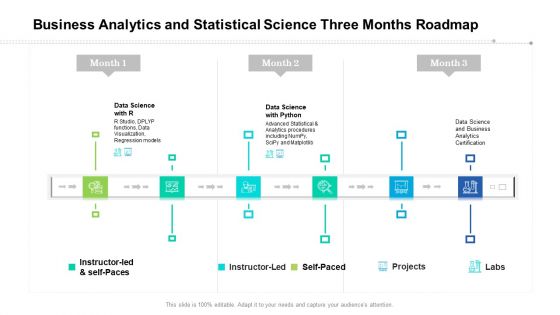
Business Analytics And Statistical Science Three Months Roadmap Demonstration
Presenting our jaw dropping business analytics and statistical science three months roadmap demonstration. You can alternate the color, font size, font type, and shapes of this PPT layout according to your strategic process. This PPT presentation is compatible with Google Slides and is available in both standard screen and widescreen aspect ratios. You can also download this well researched PowerPoint template design in different formats like PDF, JPG, and PNG. So utilize this visually appealing design by clicking the download button given below.
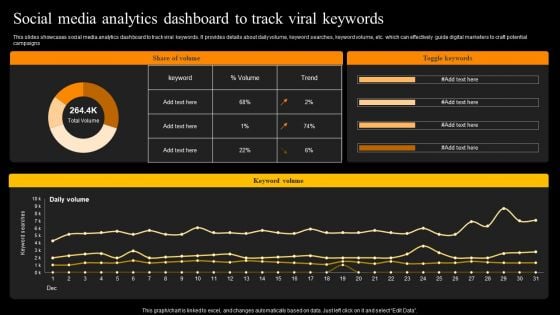
Social Media Analytics Dashboard To Track Viral Keywords Structure PDF
This slides showcases social media analytics dashboard to track viral keywords. It provides details about daily volume, keyword searches, keyword volume, etc. which can effectively guide digital marketers to craft potential campaigns. Slidegeeks is one of the best resources for PowerPoint templates. You can download easily and regulate Social Media Analytics Dashboard To Track Viral Keywords Structure PDF for your personal presentations from our wonderful collection. A few clicks is all it takes to discover and get the most relevant and appropriate templates. Use our Templates to add a unique zing and appeal to your presentation and meetings. All the slides are easy to edit and you can use them even for advertisement purposes.
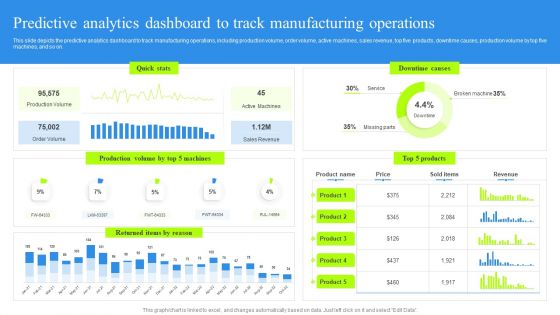
Predictive Analytics Dashboard To Track Manufacturing Operations Rules PDF
This slide depicts the predictive analytics dashboard to track manufacturing operations, including production volume, order volume, active machines, sales revenue, top five products, downtime causes, production volume by top five machines, and so on. Present like a pro with Predictive Analytics Dashboard To Track Manufacturing Operations Rules PDF Create beautiful presentations together with your team, using our easy-to-use presentation slides. Share your ideas in real-time and make changes on the fly by downloading our templates. So whether you are in the office, on the go, or in a remote location, you can stay in sync with your team and present your ideas with confidence. With Slidegeeks presentation got a whole lot easier. Grab these presentations today.
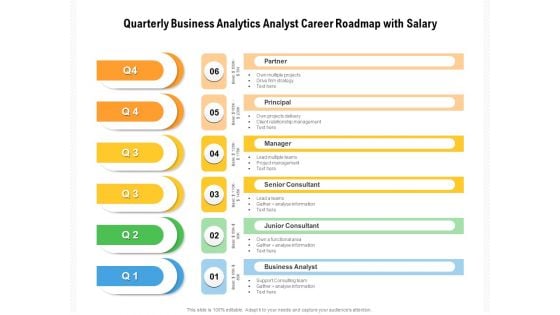
Quarterly Business Analytics Analyst Career Roadmap With Salary Formats
Presenting our innovatively-structured quarterly business analytics analyst career roadmap with salary formats Template. Showcase your roadmap process in different formats like PDF, PNG, and JPG by clicking the download button below. This PPT design is available in both Standard Screen and Widescreen aspect ratios. It can also be easily personalized and presented with modified font size, font type, color, and shapes to measure your progress in a clear way.
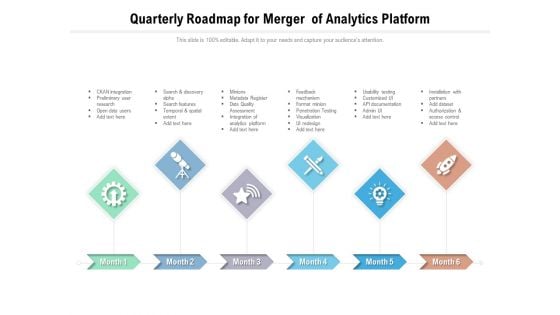
Quarterly Roadmap For Merger Of Analytics Platform Background
Presenting our innovatively-structured quarterly roadmap for merger of analytics platform background Template. Showcase your roadmap process in different formats like PDF, PNG, and JPG by clicking the download button below. This PPT design is available in both Standard Screen and Widescreen aspect ratios. It can also be easily personalized and presented with modified font size, font type, color, and shapes to measure your progress in a clear way.

Medical Services Market Intelligence Analytics Reporting Four Quarter Roadmap Inspiration
Presenting our innovatively structured medical services market intelligence analytics reporting four quarter roadmap inspiration Template. Showcase your roadmap process in different formats like PDF, PNG, and JPG by clicking the download button below. This PPT design is available in both Standard Screen and Widescreen aspect ratios. It can also be easily personalized and presented with modified font size, font type, color, and shapes to measure your progress in a clear way.
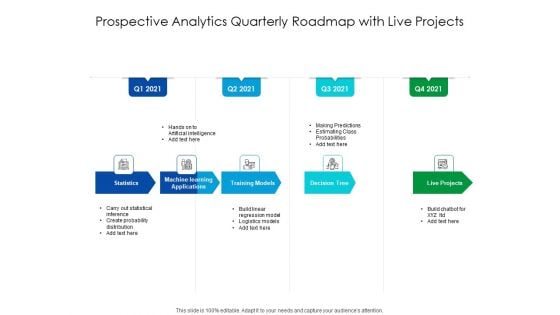
Predictive Analytics Quarterly Roadmap With Live Projects Microsoft
Presenting our innovatively structured predictive analytics quarterly roadmap with live projects microsoft Template. Showcase your roadmap process in different formats like PDF, PNG, and JPG by clicking the download button below. This PPT design is available in both Standard Screen and Widescreen aspect ratios. It can also be easily personalized and presented with modified font size, font type, color, and shapes to measure your progress in a clear way.
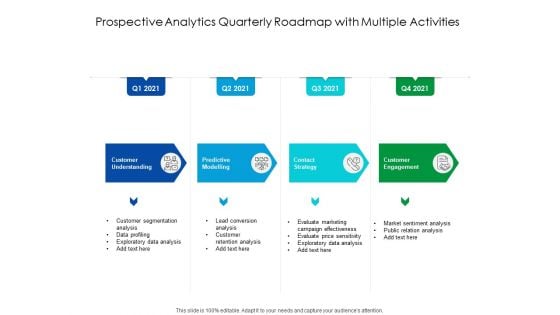
Predictive Analytics Quarterly Roadmap With Multiple Activities Ideas
Introducing our predictive analytics quarterly roadmap with multiple activities ideas. This PPT presentation is Google Slides compatible, therefore, you can share it easily with the collaborators for measuring the progress. Also, the presentation is available in both standard screen and widescreen aspect ratios. So edit the template design by modifying the font size, font type, color, and shapes as per your requirements. As this PPT design is fully editable it can be presented in PDF, JPG and PNG formats.
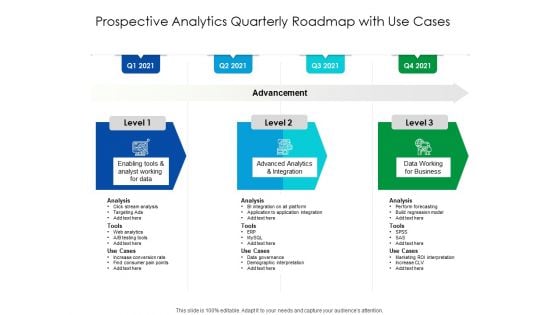
Predictive Analytics Quarterly Roadmap With Use Cases Designs
Presenting our jaw dropping predictive analytics quarterly roadmap with use cases designs. You can alternate the color, font size, font type, and shapes of this PPT layout according to your strategic process. This PPT presentation is compatible with Google Slides and is available in both standard screen and widescreen aspect ratios. You can also download this well researched PowerPoint template design in different formats like PDF, JPG, and PNG. So utilize this visually appealing design by clicking the download button given below.
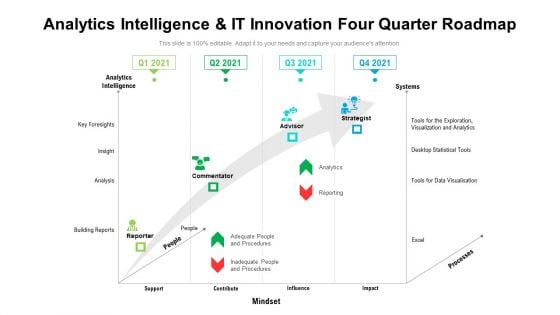
Analytics Intelligence And IT Innovation Four Quarter Roadmap Pictures
Presenting our innovatively structured analytics intelligence and it innovation four quarter roadmap pictures Template. Showcase your roadmap process in different formats like PDF, PNG, and JPG by clicking the download button below. This PPT design is available in both Standard Screen and Widescreen aspect ratios. It can also be easily personalized and presented with modified font size, font type, color, and shapes to measure your progress in a clear way.
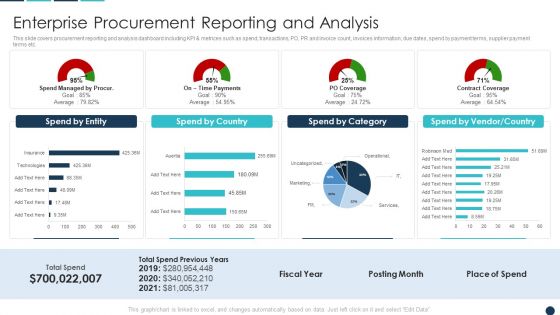
Procurement Analytics Tools And Strategies Enterprise Procurement Reporting Infographics PDF
This slide covers procurement reporting and analysis dashboard including KPI metrices such as spend, transactions, PO, PR and invoice count, invoices information, due dates, spend by payment terms, supplier payment terms etc. Deliver an awe inspiring pitch with this creative Procurement Analytics Tools And Strategies Enterprise Procurement Reporting Infographics PDF bundle. Topics like Spend By Country, Spend Category, Vendor Country can be discussed with this completely editable template. It is available for immediate download depending on the needs and requirements of the user.
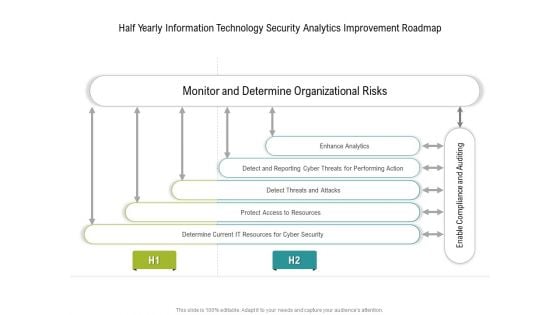
Half Yearly Information Technology Security Analytics Improvement Roadmap Slides
Presenting our innovatively structured half yearly information technology security analytics improvement roadmap slides Template. Showcase your roadmap process in different formats like PDF, PNG, and JPG by clicking the download button below. This PPT design is available in both Standard Screen and Widescreen aspect ratios. It can also be easily personalized and presented with modified font size, font type, color, and shapes to measure your progress in a clear way.
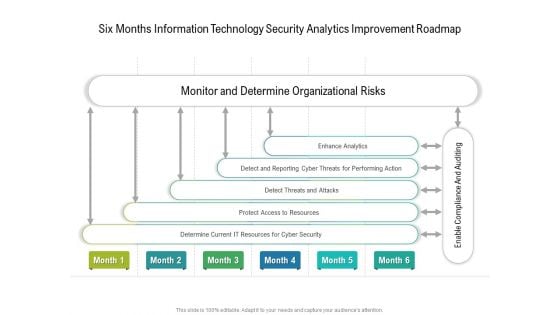
Six Months Information Technology Security Analytics Improvement Roadmap Background
Presenting our innovatively structured six months information technology security analytics improvement roadmap background Template. Showcase your roadmap process in different formats like PDF, PNG, and JPG by clicking the download button below. This PPT design is available in both Standard Screen and Widescreen aspect ratios. It can also be easily personalized and presented with modified font size, font type, color, and shapes to measure your progress in a clear way.
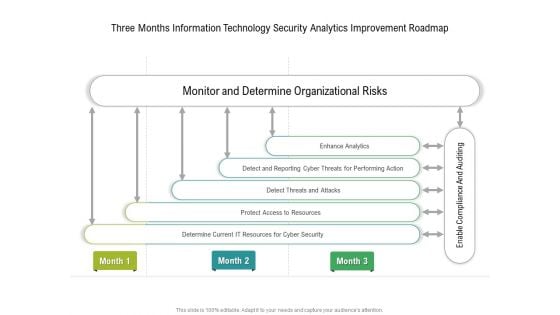
Three Months Information Technology Security Analytics Improvement Roadmap Inspiration
Presenting our innovatively structured three months information technology security analytics improvement roadmap inspiration Template. Showcase your roadmap process in different formats like PDF, PNG, and JPG by clicking the download button below. This PPT design is available in both Standard Screen and Widescreen aspect ratios. It can also be easily personalized and presented with modified font size, font type, color, and shapes to measure your progress in a clear way.
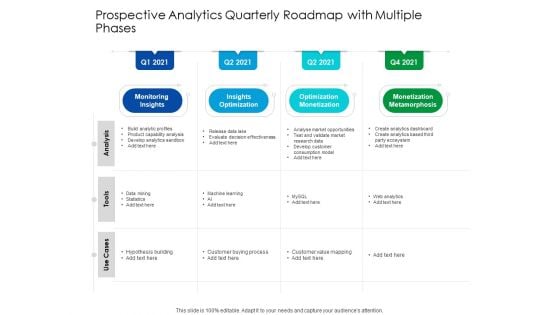
Predictive Analytics Quarterly Roadmap With Multiple Phases Topics
Presenting the predictive analytics quarterly roadmap with multiple phases topics. The template includes a roadmap that can be used to initiate a strategic plan. Not only this, the PowerPoint slideshow is completely editable and you can effortlessly modify the font size, font type, and shapes according to your needs. This PPT slide can be easily reached in standard screen and widescreen aspect ratios. The set is also available in various formats like PDF, PNG, and JPG. So download and use it multiple times as per your knowledge.
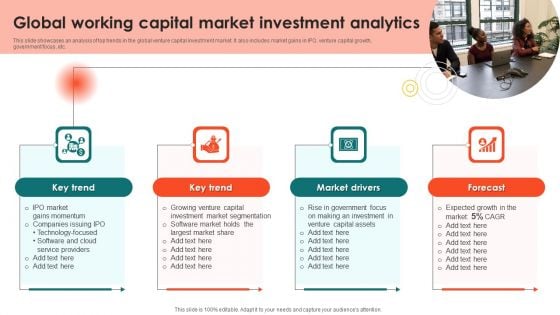
Global Working Capital Market Investment Analytics Diagrams PDF
This slide showcases an analysis of top trends in the global venture capital investment market. It also includes market gains in IPO, venture capital growth, government focus, etc. Presenting Global Working Capital Market Investment Analytics Diagrams PDF to dispense important information. This template comprises four stages. It also presents valuable insights into the topics including Key Trend, Key Trend, Market Drivers This is a completely customizable PowerPoint theme that can be put to use immediately. So, download it and address the topic impactfully.
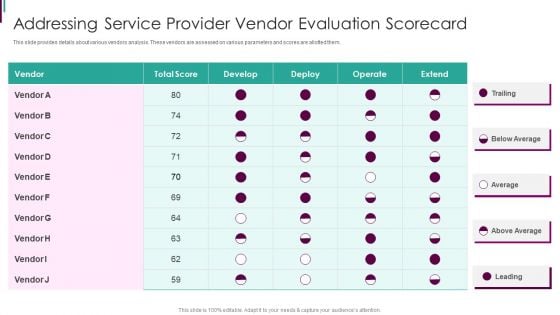
Developing Business Analytics Framework Addressing Service Provider Vendor Themes PDF
This slide provides details about various vendors analysis. These vendors are assessed on various parameters and scores are allotted them. Deliver an awe inspiring pitch with this creative Developing Business Analytics Framework Addressing Service Provider Vendor Themes PDF bundle. Topics like Addressing Service, Provider Vendor, Evaluation Scorecard can be discussed with this completely editable template. It is available for immediate download depending on the needs and requirements of the user.
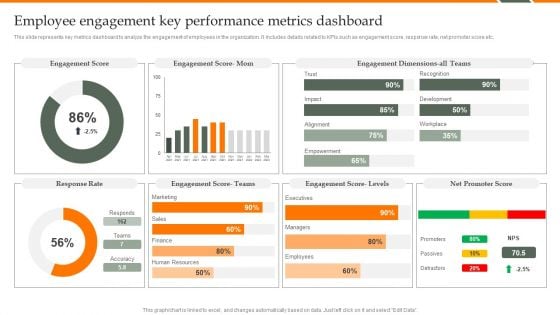
Human Resource Analytics Employee Engagement Key Performance Metrics Inspiration PDF
This slide represents key metrics dashboard to analyze the engagement of employees in the organization. It includes details related to KPIs such as engagement score, response rate, net promoter score etc. Crafting an eye-catching presentation has never been more straightforward. Let your presentation shine with this tasteful yet straightforward Human Resource Analytics Employee Engagement Key Performance Metrics Inspiration PDF template. It offers a minimalistic and classy look that is great for making a statement. The colors have been employed intelligently to add a bit of playfulness while still remaining professional. Construct the ideal Human Resource Analytics Employee Engagement Key Performance Metrics Inspiration PDF that effortlessly grabs the attention of your audience Begin now and be certain to wow your customers.
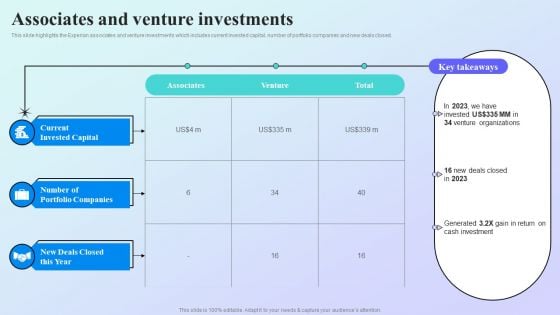
Information Analytics Company Outline Associates And Venture Investments Summary PDF
This slide highlights the Experian associates and venture investments which includes current invested capital, number of portfolio companies and new deals closed. If you are looking for a format to display your unique thoughts, then the professionally designed Information Analytics Company Outline Associates And Venture Investments Summary PDF is the one for you. You can use it as a Google Slides template or a PowerPoint template. Incorporate impressive visuals, symbols, images, and other charts. Modify or reorganize the text boxes as you desire. Experiment with shade schemes and font pairings. Alter, share or cooperate with other people on your work. Download Information Analytics Company Outline Associates And Venture Investments Summary PDF and find out how to give a successful presentation. Present a perfect display to your team and make your presentation unforgettable.
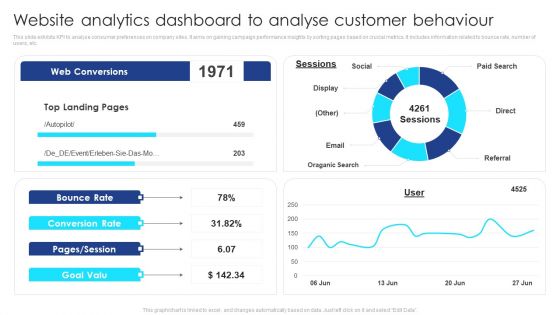
Website Analytics Dashboard To Analyse Customer Behaviour Themes PDF
This slide exhibits KPI to analyse consumer preferences on company sites. It aims on gaining campaign performance insights by sorting pages based on crucial metrics. It includes information related to bounce rate, number of users, etc. Showcasing this set of slides titled Website Analytics Dashboard To Analyse Customer Behaviour Themes PDF. The topics addressed in these templates are Social, Paid Search, Referral, Email, Oraganic Search. All the content presented in this PPT design is completely editable. Download it and make adjustments in color, background, font etc. as per your unique business setting.
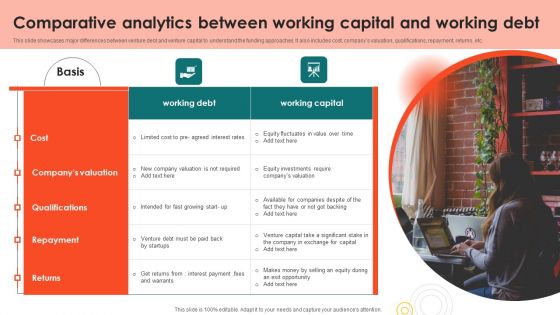
Comparative Analytics Between Working Capital And Working Debt Download PDF
This slide showcases major differences between venture debt and venture capital to understand the funding approaches. It also includes cost, companys valuation, qualifications, repayment, returns, etc. Presenting Comparative Analytics Between Working Capital And Working Debt Download PDF to dispense important information. This template comprises one stages. It also presents valuable insights into the topics including Cost, Qualifications, Repayment This is a completely customizable PowerPoint theme that can be put to use immediately. So, download it and address the topic impactfully.
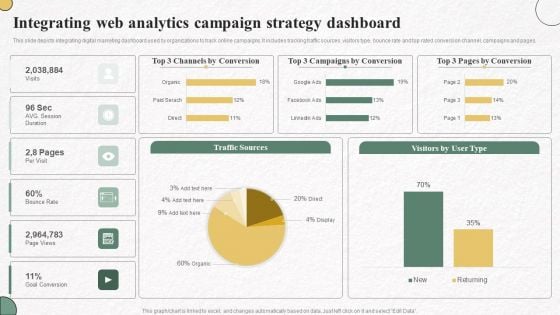
Integrating Web Analytics Campaign Strategy Dashboard Information PDF
This slide depicts integrating digital marketing dashboard used by organizations to track online campaigns. It includes tracking traffic sources, visitors type, bounce rate and top rated conversion channel, campaigns and pages. Showcasing this set of slides titled Integrating Web Analytics Campaign Strategy Dashboard Information PDF. The topics addressed in these templates are Channels By Conversion, Campaigns By Conversion, Pages By Conversion. All the content presented in this PPT design is completely editable. Download it and make adjustments in color, background, font etc. as per your unique business setting.
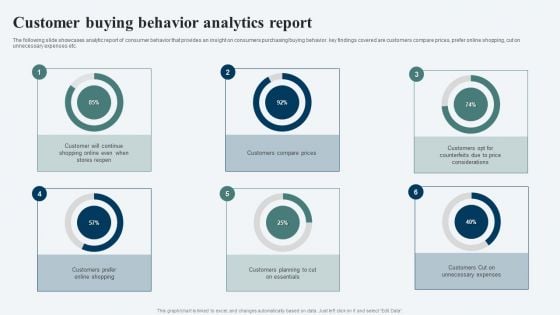
Customer Buying Behavior Analytics Report Ppt Inspiration Elements PDF
The following slide showcases analytic report of consumer behavior that provides an insight on consumers purchasing or buying behavior. key findings covered are customers compare prices, prefer online shopping, cut on unnecessary expenses etc. Pitch your topic with ease and precision using this Customer Buying Behavior Analytics Report Ppt Inspiration Elements PDF. This layout presents information on Customer Will, Continue Shopping, Stores Reopen, Customers Compare Prices. It is also available for immediate download and adjustment. So, changes can be made in the color, design, graphics or any other component to create a unique layout.
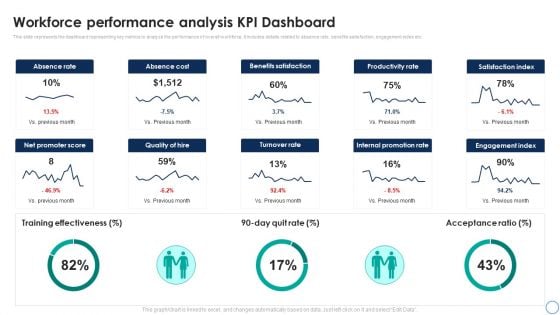
Business Analytics Application Workforce Performance Analysis KPI Dashboard Template PDF
This slide represents the dashboard representing key metrics to analyze the performance of overall workforce. It includes details related to absence rate, benefits satisfaction, engagement index etc. Take your projects to the next level with our ultimate collection of Business Analytics Application Workforce Performance Analysis KPI Dashboard Template PDF. Slidegeeks has designed a range of layouts that are perfect for representing task or activity duration, keeping track of all your deadlines at a glance. Tailor these designs to your exact needs and give them a truly corporate look with your own brand colors theyll make your projects stand out from the rest.
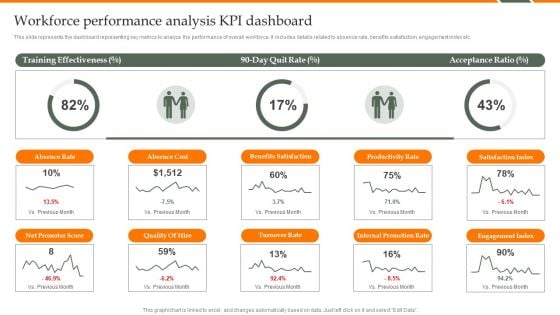
Human Resource Analytics Workforce Performance Analysis KPI Dashboard Structure PDF
This slide represents the dashboard representing key metrics to analyze the performance of overall workforce. It includes details related to absence rate, benefits satisfaction, engagement index etc. Find a pre-designed and impeccable Human Resource Analytics Workforce Performance Analysis KPI Dashboard Structure PDF. The templates can ace your presentation without additional effort. You can download these easy-to-edit presentation templates to make your presentation stand out from others. So, what are you waiting for Download the template from Slidegeeks today and give a unique touch to your presentation.
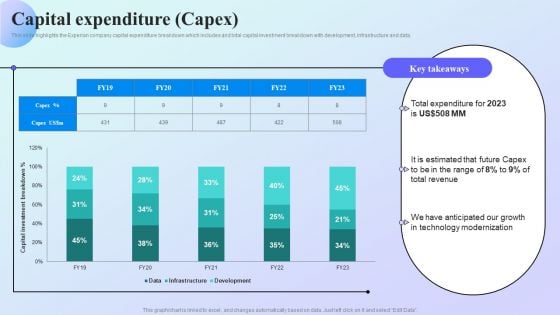
Information Analytics Company Outline Capital Expenditure Capex Information PDF
This slide highlights the Experian company capital expenditure breakdown which includes and total capital investment breakdown with development, infrastructure and data. Are you in need of a template that can accommodate all of your creative concepts This one is crafted professionally and can be altered to fit any style. Use it with Google Slides or PowerPoint. Include striking photographs, symbols, depictions, and other visuals. Fill, move around, or remove text boxes as desired. Test out color palettes and font mixtures. Edit and save your work, or work with colleagues. Download Information Analytics Company Outline Capital Expenditure Capex Information PDF and observe how to make your presentation outstanding. Give an impeccable presentation to your group and make your presentation unforgettable.
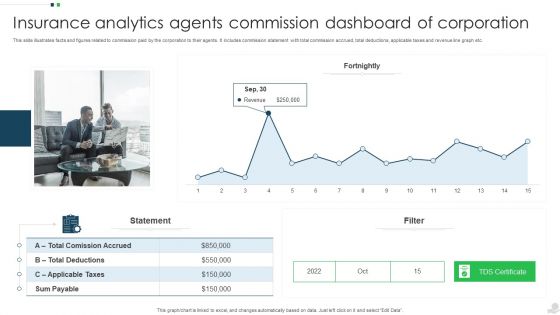
Insurance Analytics Agents Commission Dashboard Of Corporation Introduction PDF
This slide illustrates facts and figures related to commission paid by the corporation to their agents. It includes commission statement with total commission accrued, total deductions, applicable taxes and revenue line graph etc. Pitch your topic with ease and precision using this Insurance Analytics Agents Commission Dashboard Of Corporation Introduction PDF. This layout presents information on Applicable Taxes, Sum Payable, Revenue. It is also available for immediate download and adjustment. So, changes can be made in the color, design, graphics or any other component to create a unique layout.
Facebook Analytics Pixel Marketing Plan Dashboard Professional PDF
This slide exhibits dashboard which offers free point of view for optimization and in-depth analysis of visitors. This template helps in tracking social media and campaigns performance. It involves information related to revenue, age factor, etc. Showcasing this set of slides titled Facebook Analytics Pixel Marketing Plan Dashboard Professional PDF Graphics. The topics addressed in these templates are People Metrics, Lifetime Value, Purchases Repeated. All the content presented in this PPT design is completely editable. Download it and make adjustments in color, background, font etc. as per your unique business setting.
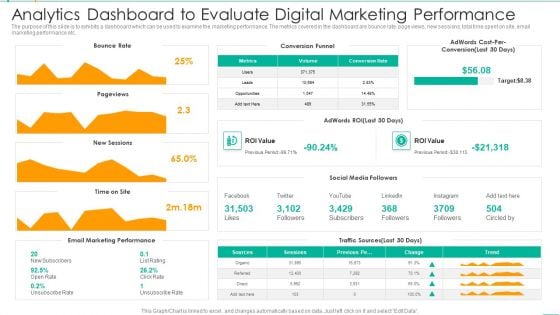
Analytics Dashboard To Evaluate Digital Marketing Performance Mockup PDF
The purpose of this slide is to exhibits a dashboard which can be used to examine the marketing performance. The metrics covered in the dashboard are bounce rate, page views, new sessions, total time spent on site, email marketing performance etc. Showcasing this set of slides titled Analytics Dashboard To Evaluate Digital Marketing Performance Mockup PDF. The topics addressed in these templates are Conversion Funnel, Target, Marketing Performance. All the content presented in this PPT design is completely editable. Download it and make adjustments in color, background, font etc. as per your unique business setting.
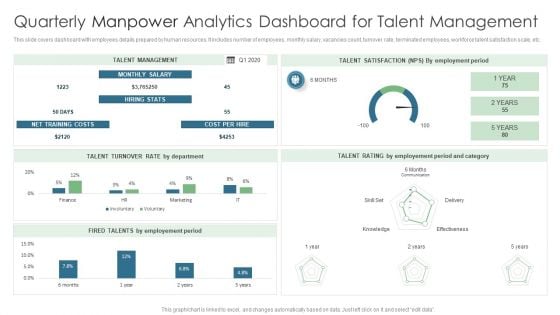
Quarterly Manpower Analytics Dashboard For Talent Management Infographics PDF
This slide covers dashboard with employees details prepared by human resources. It includes number of employees, monthly salary, vacancies count, turnover rate, terminated employees, workforce talent satisfaction scale, etc. Showcasing this set of slides titled Quarterly Manpower Analytics Dashboard For Talent Management Infographics PDF. The topics addressed in these templates are Talent Management, Cost Per Hire, Net Training Costs. All the content presented in this PPT design is completely editable. Download it and make adjustments in color, background, font etc. as per your unique business setting.
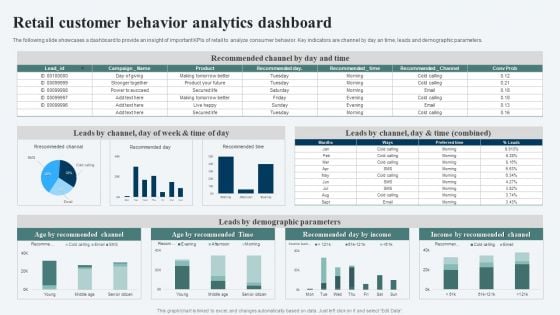
Retail Customer Behavior Analytics Dashboard Ppt Ideas Templates PDF
The following slide showcases a dashboard to provide an insight of important KPIs of retail to analyze consumer behavior. Key indicators are channel by day an time, leads and demographic parameters. Showcasing this set of slides titled Retail Customer Behavior Analytics Dashboard Ppt Ideas Templates PDF. The topics addressed in these templates are Recommended Channel, Leads Demographic Parameters, Income Recommended Channel. All the content presented in this PPT design is completely editable. Download it and make adjustments in color, background, font etc. as per your unique business setting.
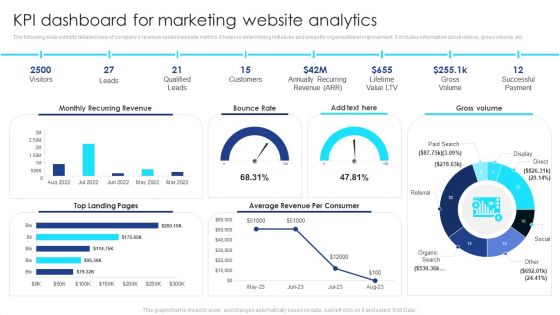
KPI Dashboard For Marketing Website Analytics Summary PDF
The following slide exhibits detailed view of companys revenue-related website metrics. It helps in determining initiatives and areas for organisational improvement. It includes information about visitors, gross volume, etc. Pitch your topic with ease and precision using this KPI Dashboard For Marketing Website Analytics Summary PDF. This layout presents information on Visitors, Leads, Qualified Leads, Customers, Gross Volume, Successful Payment. It is also available for immediate download and adjustment. So, changes can be made in the color, design, graphics or any other component to create a unique layout.
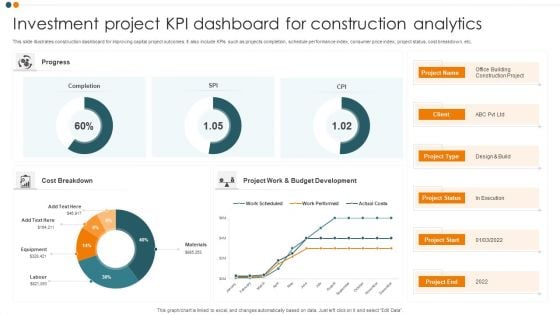
Investment Project KPI Dashboard For Construction Analytics Background PDF
This slide illustrates construction dashboard for improving capital project outcomes. It also include KPIs such as projects completion, schedule performance index, consumer price index, project status, cost breakdown, etc. Pitch your topic with ease and precision using this Investment Project KPI Dashboard For Construction Analytics Background PDF. This layout presents information on Cost Breakdown, Completion, Progress. It is also available for immediate download and adjustment. So, changes can be made in the color, design, graphics or any other component to create a unique layout.
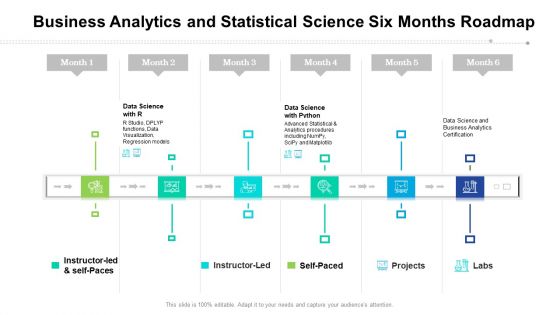
Business Analytics And Statistical Science Six Months Roadmap Designs
Presenting the business analytics and statistical science six months roadmap designs. The template includes a roadmap that can be used to initiate a strategic plan. Not only this, the PowerPoint slideshow is completely editable and you can effortlessly modify the font size, font type, and shapes according to your needs. This PPT slide can be easily reached in standard screen and widescreen aspect ratios. The set is also available in various formats like PDF, PNG, and JPG. So download and use it multiple times as per your knowledge.
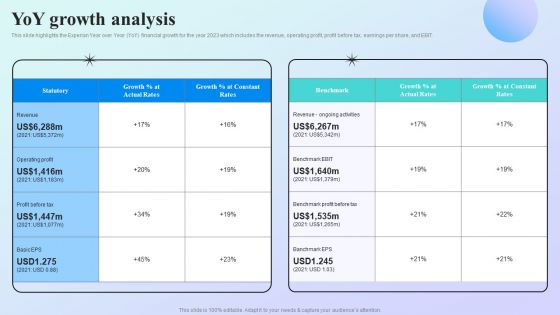
Information Analytics Company Outline Yoy Growth Analysis Themes PDF
This slide highlights the Experian Year over Year YoY financial growth for the year 2023 which includes the revenue, operating profit, profit before tax, earnings per share, and EBIT. Slidegeeks has constructed Information Analytics Company Outline Yoy Growth Analysis Themes PDF after conducting extensive research and examination. These presentation templates are constantly being generated and modified based on user preferences and critiques from editors. Here, you will find the most attractive templates for a range of purposes while taking into account ratings and remarks from users regarding the content. This is an excellent jumping off point to explore our content and will give new users an insight into our top notch PowerPoint Templates.
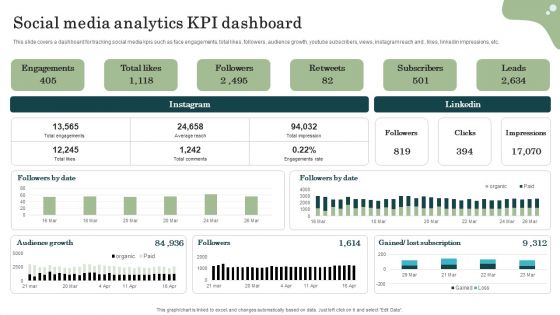
Marketing Success Metrics Social Media Analytics KPI Dashboard Elements PDF
This slide covers a dashboard for tracking social media kpis such as face engagements, total likes, followers, audience growth, youtube subscribers, views, instagram reach and , likes, linkedin impressions, etc. Find a pre-designed and impeccable Marketing Success Metrics Social Media Analytics KPI Dashboard Elements PDF. The templates can ace your presentation without additional effort. You can download these easy-to-edit presentation templates to make your presentation stand out from others. So, what are you waiting for Download the template from Slidegeeks today and give a unique touch to your presentation.
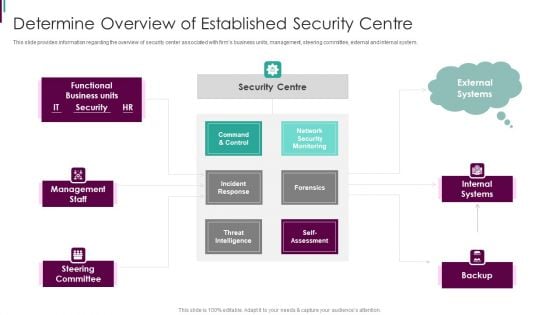
Developing Business Analytics Framework Determine Overview Of Established Themes PDF
This slide provides information regarding the overview of security center associated with firms business units, management, steering committee, external and internal system. This is a Developing Business Analytics Framework Determine Overview Of Established Themes PDF template with various stages. Focus and dispense information on three stages using this creative set, that comes with editable features. It contains large content boxes to add your information on topics like Command And Control, Incident Response, Threat Intelligence You can also showcase facts, figures, and other relevant content using this PPT layout. Grab it now.
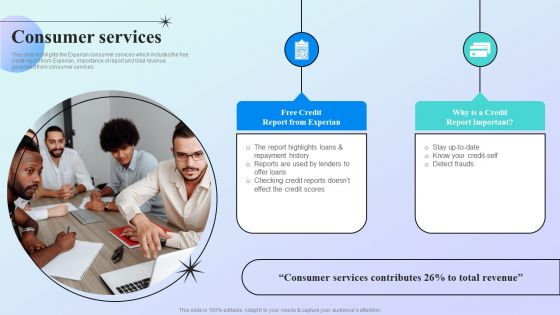
Information Analytics Company Outline Consumer Services Themes PDF
This slide highlights the Experian consumer services which includes the free credit report from Experian, importance of report and total revenue generated from consumer services. Slidegeeks is one of the best resources for PowerPoint templates. You can download easily and regulate Information Analytics Company Outline Consumer Services Themes PDF for your personal presentations from our wonderful collection. A few clicks is all it takes to discover and get the most relevant and appropriate templates. Use our Templates to add a unique zing and appeal to your presentation and meetings. All the slides are easy to edit and you can use them even for advertisement purposes.

Building Material And Expenses Analytics For Construction Site Designs PDF
This slide shows statistics for cash outflow in first six months of project and material requirement with rate per unit for build up area of 1000 SQFT. It includes details about fittings, cement, finishers, sand, steel, etc. Showcasing this set of slides titled Building Material And Expenses Analytics For Construction Site Designs PDF. The topics addressed in these templates are Building Material, Material Quantity, Construction Site. All the content presented in this PPT design is completely editable. Download it and make adjustments in color, background, font etc. as per your unique business setting.
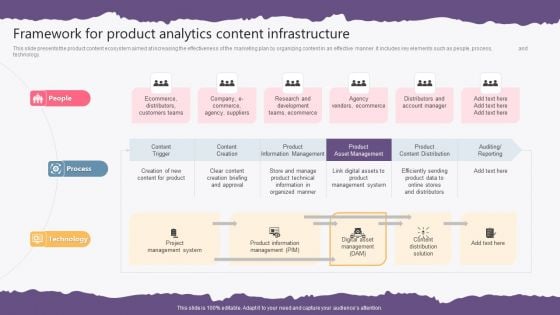
Framework For Product Analytics Content Infrastructure Ideas PDF
This slide presents the product content ecosystem aimed at increasing the effectiveness of the marketing plan by organizing content in an effective manner. It includes key elements such as people, process, and technology. Presenting Framework For Product Analytics Content Infrastructure Ideas PDF to dispense important information. This template comprises three stages. It also presents valuable insights into the topics including People, Process, Technology. This is a completely customizable PowerPoint theme that can be put to use immediately. So, download it and address the topic impactfully.
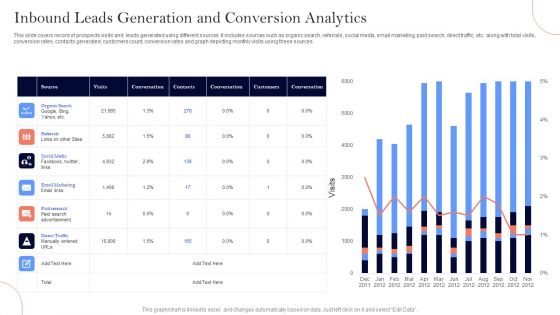
Inbound Leads Generation And Conversion Analytics Ppt Summary Show PDF
This slide covers record of prospects visits and leads generated using different sources. It includes sources such as organic search, referrals, social media, email marketing, paid search, direct traffic, etc. along with total visits, conversion rates, contacts generated, customers count, conversion rates and graph depicting monthly visits using these sources. Showcasing this set of slides titled Inbound Leads Generation And Conversion Analytics Ppt Summary Show PDF. The topics addressed in these templates are Organic Search, Referrals, Social Media. All the content presented in this PPT design is completely editable. Download it and make adjustments in color, background, font etc. as per your unique business setting.
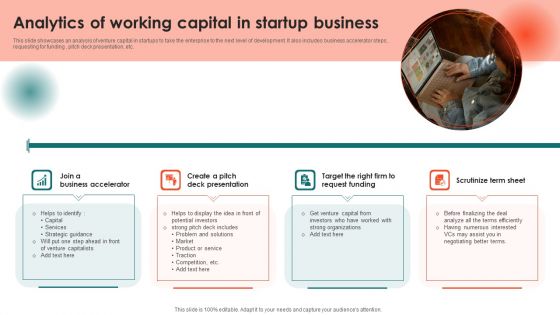
Analytics Of Working Capital In Startup Business Topics PDF
This slide showcases an analysis of venture capital in startups to take the enterprise to the next level of development. It also includes business accelerator steps, requesting for funding , pitch deck presentation, etc. Presenting Analytics Of Working Capital In Startup Business Topics PDF to dispense important information. This template comprises four stages. It also presents valuable insights into the topics including Business Accelerator, Deck Presentation, Scrutinize Term Sheet This is a completely customizable PowerPoint theme that can be put to use immediately. So, download it and address the topic impactfully.
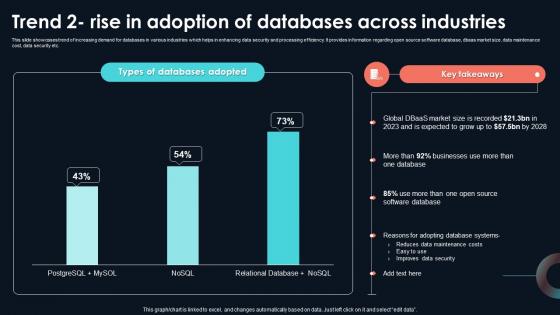
Trend 2 Rise In Adoption Of Databases Across Developing Strategic Insights Using Big Data Analytics SS V
This slide showcases trend of increasing demand for databases in various industries which helps in enhancing data security and processing efficiency. It provides information regarding open source software database, dbaas market size, data maintenance cost, data security etc. This Trend 2 Rise In Adoption Of Databases Across Developing Strategic Insights Using Big Data Analytics SS V from Slidegeeks makes it easy to present information on your topic with precision. It provides customization options, so you can make changes to the colors, design, graphics, or any other component to create a unique layout. It is also available for immediate download, so you can begin using it right away. Slidegeeks has done good research to ensure that you have everything you need to make your presentation stand out. Make a name out there for a brilliant performance. This slide showcases trend of increasing demand for databases in various industries which helps in enhancing data security and processing efficiency. It provides information regarding open source software database, dbaas market size, data maintenance cost, data security etc.
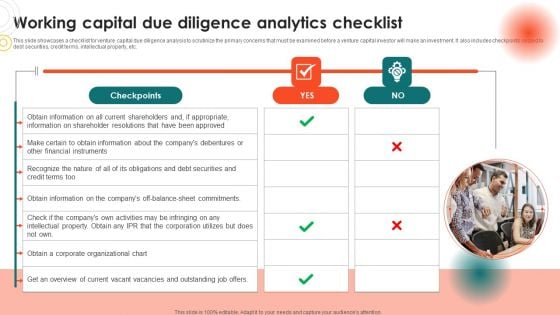
Working Capital Due Diligence Analytics Checklist Inspiration PDF
This slide showcases a checklist for venture capital due diligence analysis to scrutinize the primary concerns that must be examined before a venture capital investor will make an investment. It also includes checkpoints related to debt securities, credit terms, intellectual property, etc. Persuade your audience using this Working Capital Due Diligence Analytics Checklist Inspiration PDF. This PPT design covers one stages, thus making it a great tool to use. It also caters to a variety of topics including Information, Checkpoints, Organizational Chart. Download this PPT design now to present a convincing pitch that not only emphasizes the topic but also showcases your presentation skills.

Conceptual Framework For Optimizing Website Analytics Sample PDF
The following slide exhibits online Google analysis structure. It helps in promoting specific products to customers who are most likely to buy them. It covers information related to business impact, strategy, etc. Presenting Conceptual Framework For Optimizing Website Analytics Sample PDF to dispense important information. This template comprises seven stages. It also presents valuable insights into the topics including Business Impact, Optimization, Analysis, Reporting, Implementation, Strategy. This is a completely customizable PowerPoint theme that can be put to use immediately. So, download it and address the topic impactfully.
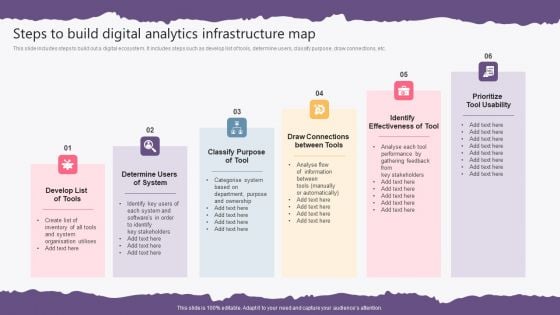
Steps To Build Digital Analytics Infrastructure Map Professional PDF
This slide includes steps to build out a digital ecosystem. It includes steps such as develop list of tools, determine users, classify purpose, draw connections, etc. Presenting Steps To Build Digital Analytics Infrastructure Map Professional PDF to dispense important information. This template comprises six stages. It also presents valuable insights into the topics including Develop List Of Tools, Determine Users Of System, Classify Purpose Of Tool, Identify Effectiveness Of Tool. This is a completely customizable PowerPoint theme that can be put to use immediately. So, download it and address the topic impactfully.
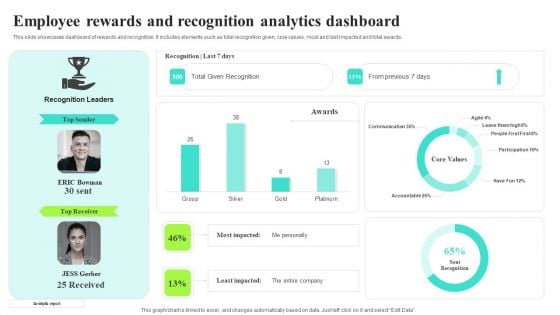
Employee Rewards And Recognition Analytics Dashboard Rules PDF
This slide showcases dashboard of rewards and recognition. It includes elements such as total recognition given, core values, most and last impacted and total awards. Are you in need of a template that can accommodate all of your creative concepts This one is crafted professionally and can be altered to fit any style. Use it with Google Slides or PowerPoint. Include striking photographs, symbols, depictions, and other visuals. Fill, move around, or remove text boxes as desired. Test out color palettes and font mixtures. Edit and save your work, or work with colleagues. Download Employee Rewards And Recognition Analytics Dashboard Rules PDF and observe how to make your presentation outstanding. Give an impeccable presentation to your group and make your presentation unforgettable.
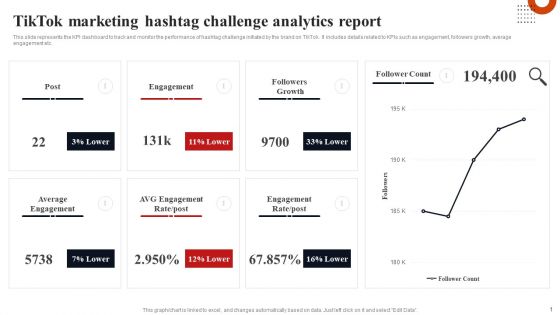
Tiktok Marketing Hashtag Challenge Analytics Report Diagrams PDF
This slide represents the KPI dashboard to track and monitor the performance of hashtag challenge initiated by the brand on TikTok. It includes details related to KPIs such as engagement, followers growth, average engagement etc. This modern and well arranged Tiktok Marketing Hashtag Challenge Analytics Report Diagrams PDF provides lots of creative possibilities. It is very simple to customize and edit with the Powerpoint Software. Just drag and drop your pictures into the shapes. All facets of this template can be edited with Powerpoint no extra software is necessary. Add your own material, put your images in the places assigned for them, adjust the colors, and then you can show your slides to the world, with an animated slide included.
Bar Chart Analytics Vector Icon With Text Holders Ppt Powerpoint Presentation File Background Designs
This is a bar chart analytics vector icon with text holders ppt powerpoint presentation file background designs. The topics discussed in this diagram are data management icon, big data icon. This is a completely editable PowerPoint presentation, and is available for immediate download.
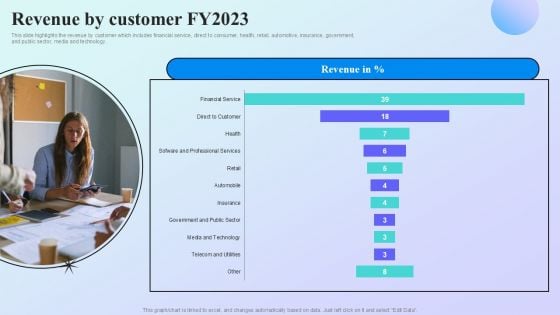
Information Analytics Company Outline Revenue By Customer Fy2023 Topics PDF
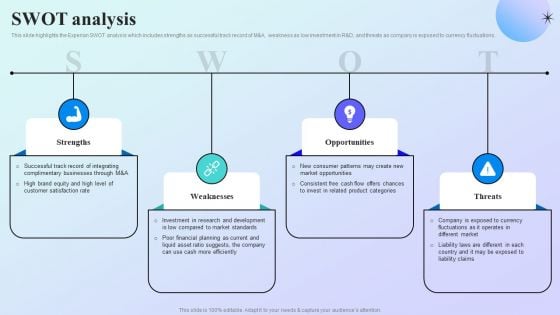
Information Analytics Company Outline SWOT Analysis Demonstration PDF
This slide highlights the Experian SWOT analysis which includes strengths as successful track record of M and A, weakness as low investment in R and D, and threats as company is exposed to currency fluctuations. Retrieve professionally designed Information Analytics Company Outline SWOT Analysis Demonstration PDF to effectively convey your message and captivate your listeners. Save time by selecting pre made slideshows that are appropriate for various topics, from business to educational purposes. These themes come in many different styles, from creative to corporate, and all of them are easily adjustable and can be edited quickly. Access them as PowerPoint templates or as Google Slides themes. You do not have to go on a hunt for the perfect presentation because Slidegeeks got you covered from everywhere.
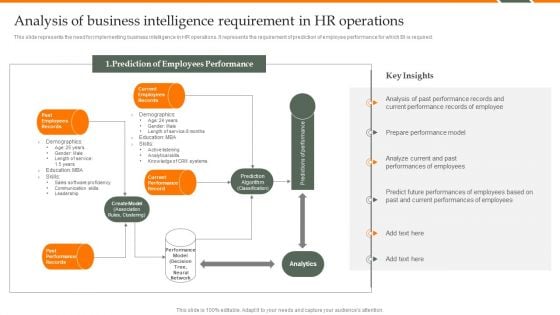
Human Resource Analytics Analysis Of Business Intelligence Requirement Template PDF
This slide represents the need for implementing business intelligence in HR operations. It represents the requirement of prediction of employee performance for which BI is required. Do you know about Slidesgeeks Human Resource Analytics Analysis Of Business Intelligence Requirement Template PDF These are perfect for delivering any kind od presentation. Using it, create PowerPoint presentations that communicate your ideas and engage audiences. Save time and effort by using our pre-designed presentation templates that are perfect for a wide range of topic. Our vast selection of designs covers a range of styles, from creative to business, and are all highly customizable and easy to edit. Download as a PowerPoint template or use them as Google Slides themes.

Weak Points Analytics Ppt PowerPoint Presentation Complete Deck With Slides
If designing a presentation takes a lot of your time and resources and you are looking for a better alternative, then this Weak Points Analytics Ppt PowerPoint Presentation Complete Deck With Slides is the right fit for you. This is a prefabricated set that can help you deliver a great presentation on the topic. All the twelve slides included in this sample template can be used to present a birds eye view of the topic. These slides are also fully editable, giving you enough freedom to add specific details to make this layout more suited to your business setting. Apart from the content, all other elements like color, design, theme are also replaceable and editable. This helps in designing a variety of presentations with a single layout. Not only this, you can use this PPT design in formats like PDF, PNG, and JPG once downloaded. Therefore, without any further ado, download and utilize this sample presentation as per your liking.

Social Media Analytics Ppt PowerPoint Presentation Complete Deck With Slides
If designing a presentation takes a lot of your time and resources and you are looking for a better alternative, then this Social Media Analytics Ppt PowerPoint Presentation Complete Deck With Slides is the right fit for you. This is a prefabricated set that can help you deliver a great presentation on the topic. All the twenty slides included in this sample template can be used to present a birds-eye view of the topic. These slides are also fully editable, giving you enough freedom to add specific details to make this layout more suited to your business setting. Apart from the content, all other elements like color, design, theme are also replaceable and editable. This helps in designing a variety of presentations with a single layout. Not only this, you can use this PPT design in formats like PDF, PNG, and JPG once downloaded. Therefore, without any further ado, download and utilize this sample presentation as per your liking.

Manpower Analytics Ppt PowerPoint Presentation Complete Deck With Slides
Share a great deal of information on the topic by deploying this Manpower Analytics Ppt PowerPoint Presentation Complete Deck With Slides. Support your ideas and thought process with this prefabricated set. It includes a set of twelve slides, all fully modifiable and editable. Each slide can be restructured and induced with the information and content of your choice. You can add or remove large content boxes as well, to make this PPT slideshow more personalized. Its high-quality graphics and visuals help in presenting a well-coordinated pitch. This PPT template is also a resourceful tool to take visual cues from and implement the best ideas to help your business grow and expand. The main attraction of this well-formulated deck is that everything is editable, giving you the freedom to adjust it to your liking and choice. Changes can be made in the background and theme as well to deliver an outstanding pitch. Therefore, click on the download button now to gain full access to this multifunctional set.
Data Warehouse Implementation Data Warehouse Architecture With Staging Area And Data Marts Icons PDF
This slide depicts a data warehouse architecture with a staging area and data marts and how it can be used for different groups within an organization.Deliver and pitch your topic in the best possible manner with this Data Warehouse Implementation Data Warehouse Architecture With Staging Area And Data Marts Icons PDF. Use them to share invaluable insights on Operational System, Warehouse Different, Specific Business and impress your audience. This template can be altered and modified as per your expectations. So, grab it now.
You Tube Advertising Campaign Performance Analytics Dashboard Ppt Icon Diagrams PDF
This slide represents dashboard showing analytics of performance of you tube marketing campaign. It includes data related to no. of visitors, qualified leads, customers and annual recurring revenue, lifetime value, gross volume etc generated through the campaign. Showcasing this set of slides titled You Tube Advertising Campaign Performance Analytics Dashboard Ppt Icon Diagrams PDF. The topics addressed in these templates are Monthly Recurring Revenue, Bounce Rate, Customer Churn Rate. All the content presented in this PPT design is completely editable. Download it and make adjustments in color, background, font etc. as per your unique business setting.
Bar Graph Analytics Vector Icon Ppt PowerPoint Presentation Slides Information PDF
Presenting this set of slides with name bar graph analytics vector icon ppt powerpoint presentation slides information pdf. This is a three stage process. The stages in this process are bar graph analytics vector icon. This is a completely editable PowerPoint presentation and is available for immediate download. Download now and impress your audience.
Business Analytics Dashboard Vector Icon Ppt PowerPoint Presentation File Templates PDF
Presenting this set of slides with name business analytics dashboard vector icon ppt powerpoint presentation file templates pdf. This is a one stage process. The stages in this process is business analytics dashboard vector icon. This is a completely editable PowerPoint presentation and is available for immediate download. Download now and impress your audience.
Icon Showing Strategy Planning For Capability Analytics Ppt Infographics Aids PDF
Showcasing this set of slides titled Icon Showing Strategy Planning For Capability Analytics Ppt Infographics Aids PDF. The topics addressed in these templates are Icon Showing, Strategy Planning, Capability Analytics. All the content presented in this PPT design is completely editable. Download it and make adjustments in color, background, font etc. as per your unique business setting. Our Icon Showing Strategy Planning For Capability Analytics Ppt Infographics Aids PDF are topically designed to provide an attractive backdrop to any subject. Use them to look like a presentation pro.
Website Analytics Trends Facts And Information Vector Icon Ppt PowerPoint Presentation Gallery Clipart PDF
Showcasing this set of slides titled website analytics trends facts and information vector icon ppt powerpoint presentation gallery clipart pdf. The topics addressed in these templates are website analytics trends facts and information vector icon. All the content presented in this PPT design is completely editable. Download it and make adjustments in color, background, font etc. as per your unique business setting.
Dashboard Showing Business Analytics Vector Icon Ppt PowerPoint Presentation Model Templates PDF
Presenting dashboard showing business analytics vector icon ppt powerpoint presentation model templates pdf to dispense important information. This template comprises three stages. It also presents valuable insights into the topics including dashboard showing business analytics vector icon. This is a completely customizable PowerPoint theme that can be put to use immediately. So, download it and address the topic impactfully.
Service Level Agreement KPI Dashboard Icon With Analytics And Interfaces Download PDF
Presenting Service Level Agreement KPI Dashboard Icon With Analytics And Interfaces Download PDF to dispense important information. This template comprises three stages. It also presents valuable insights into the topics including Service Level Agreement, KPI Dashboard Icon, Analytics And Interfaces. This is a completely customizable PowerPoint theme that can be put to use immediately. So, download it and address the topic impactfully.
Web Analytics And Trends Dashboard Vector Icon Ppt PowerPoint Presentation Gallery Graphic Images PDF
Presenting web analytics and trends dashboard vector icon ppt powerpoint presentation gallery graphic images pdf to dispense important information. This template comprises one stages. It also presents valuable insights into the topics including web analytics and trends dashboard vector icon. This is a completely customizable PowerPoint theme that can be put to use immediately. So, download it and address the topic impactfully.
Web Analytics Charts Visits Bounce Rate Page Views Ppt PowerPoint Presentation Icon Layouts
This is a web analytics charts visits bounce rate page views ppt powerpoint presentation icon layouts. This is a six stage process. The stages in this process are digital analytics, digital dashboard, marketing.
HR Services Icon With Analytics Technology And Charts Ppt Outline Demonstration
Showcasing this set of slides titled hr services icon with analytics technology and charts ppt outline demonstration. The topics addressed in these templates are hr services icon with analytics technology and charts. All the content presented in this PPT design is completely editable. Download it and make adjustments in color, background, font etc. as per your unique business setting.
Sales Analytics For Forecasting And Planning Icon Ppt Powerpoint Presentation Show Pdf
Presenting sales analytics for forecasting and planning icon ppt powerpoint presentation show pdf to dispense important information. This template comprises three stages. It also presents valuable insights into the topics including sales analytics for forecasting and planning icon. This is a completely customizable PowerPoint theme that can be put to use immediately. So, download it and address the topic impactfully.
Enterprise Resource Planning Icon With Analytics And Monitoring Ppt PowerPoint Presentation File Images PDF
Presenting enterprise resource planning icon with analytics and monitoring ppt powerpoint presentation file images pdf to dispense important information. This template comprises three stages. It also presents valuable insights into the topics including enterprise resource planning icon with analytics and monitoring. This is a completely customizable PowerPoint theme that can be put to use immediately. So, download it and address the topic impactfully.
New Business Performance Analytics Vector Icon Ppt PowerPoint Presentation Gallery Show PDF
Presenting new business performance analytics vector icon ppt powerpoint presentation gallery show pdf to dispense important information. This template comprises three stages. It also presents valuable insights into the topics including new business performance analytics vector icon. This is a completely customizable PowerPoint theme that can be put to use immediately. So, download it and address the topic impactfully.
Analytics Icon Depicting Marketer Sales Elevator Pitch To Advertise Product Portrait PDF
Presenting analytics icon depicting marketer sales elevator pitch to advertise product portrait pdf to dispense important information. This template comprises four stages. It also presents valuable insights into the topics including analytics icon depicting marketer sales elevator pitch to advertise product. This is a completely customizable PowerPoint theme that can be put to use immediately. So, download it and address the topic impactfully.
Operations Weak Point Analytics Icon With Gear And Question Mark Diagrams PDF
Presenting Operations Weak Point Analytics Icon With Gear And Question Mark Diagrams PDF to dispense important information. This template comprises three stages. It also presents valuable insights into the topics including Operations Weak, Point, Analytics. This is a completely customizable PowerPoint theme that can be put to use immediately. So, download it and address the topic impactfully.
Benefits Offered By Analytics System To Business Ppt PowerPoint Presentation Professional Icon PDF
Presenting benefits offered by analytics system to business ppt powerpoint presentation professional icon pdf to dispense important information. This template comprises four stages. It also presents valuable insights into the topics including predictive modeling, better decision making, more accessible analytics. This is a completely customizable PowerPoint theme that can be put to use immediately. So, download it and address the topic impactfully.
Hiring Analytics Report Overview With Total Candidates Ppt PowerPoint Presentation Icon Example PDF
Showcasing this set of slides titled hiring analytics report overview with total candidates ppt powerpoint presentation icon example pdf. The topics addressed in these templates are hiring analytics report overview with total candidates. All the content presented in this PPT design is completely editable. Download it and make adjustments in color, background, font etc. as per your unique business setting.
Web Marketing Analytics Bounce Rate Goal Conversion Ppt PowerPoint Presentation Inspiration Icon
This is a web marketing analytics bounce rate goal conversion ppt powerpoint presentation inspiration icon. This is a six stage process. The stages in this process are digital analytics, digital dashboard, marketing.
Business Analytics Chart On Screen Vector Icon Ppt PowerPoint Presentation Design Ideas PDF
Presenting this set of slides with name business analytics chart on screen vector icon ppt powerpoint presentation design ideas pdf. This is a one stage process. The stage in this process is business analytics chart on screen vector icon. This is a completely editable PowerPoint presentation and is available for immediate download. Download now and impress your audience.
Fogginess Theme Arrow Inside Cloud Analytics Gear Icon Ppt PowerPoint Presentation Complete Deck
Presenting this set of slides with name fogginess theme arrow inside cloud analytics gear icon ppt powerpoint presentation complete deck. The topics discussed in these slides are arrow inside, cloud analytics, gear icon, magnifying glass, communication. This is a completely editable PowerPoint presentation and is available for immediate download. Download now and impress your audience.
Business Analytics Icon Online Pie Chart Ppt PowerPoint Presentation File Display PDF
Presenting this set of slides with name business analytics icon online pie chart ppt powerpoint presentation file display pdf. This is a three stage process. The stages in this process are business analytics icon online pie chart. This is a completely editable PowerPoint presentation and is available for immediate download. Download now and impress your audience.
Business Analytics And Insights Vector Icon Ppt PowerPoint Presentation Show Picture PDF
Presenting this set of slides with name business analytics and insights vector icon ppt powerpoint presentation show picture pdf. This is a three stage process. The stages in this process are business analytics and insights vector icon. This is a completely editable PowerPoint presentation and is available for immediate download. Download now and impress your audience.
Online Business Promotion Business Analytics Vector Icon Ppt PowerPoint Presentation Outline Example File PDF
Presenting this set of slides with name online business promotion business analytics vector icon ppt powerpoint presentation outline example file pdf. This is a three stage process. The stages in this process are online business promotion business analytics vector icon. This is a completely editable PowerPoint presentation and is available for immediate download. Download now and impress your audience.
Business Analytics On Computer Monitor Vector Icon Ppt PowerPoint Presentation Infographic Template Grid PDF
Presenting this set of slides with name business analytics on computer monitor vector icon ppt powerpoint presentation infographic template grid pdf. This is a three stage process. The stages in this process are business analytics on computer monitor vector icon. This is a completely editable PowerPoint presentation and is available for immediate download. Download now and impress your audience.
HR Services Icon With Analytics Technology And Charts Ppt PowerPoint Presentation Inspiration Format Ideas PDF
Pitch your topic with ease and precision using this hr services icon with analytics technology and charts ppt powerpoint presentation inspiration format ideas pdf. This layout presents information on hr services icon with analytics technology and charts. It is also available for immediate download and adjustment. So, changes can be made in the color, design, graphics or any other component to create a unique layout.
Business Analytics Icon With Computer Screen Ppt PowerPoint Presentation Gallery Pictures PDF
Presenting this set of slides with name business analytics icon with computer screen ppt powerpoint presentation gallery pictures pdf. This is a two stage process. The stages in this process are business analytics icon with computer screen. This is a completely editable PowerPoint presentation and is available for immediate download. Download now and impress your audience.
Controlling Customer Retention Customer Journey Analytics Team Ppt Icon Themes PDF
The firm can also measure churn rate using customer journey analytics tools by mapping entire customer journey by analyzing various touchpoint encountered. This is a controlling customer retention customer journey analytics team ppt icon themes pdf template with various stages. Focus and dispense information on one stages using this creative set, that comes with editable features. It contains large content boxes to add your information on topics like analysis, value, customer, team. You can also showcase facts, figures, and other relevant content using this PPT layout. Grab it now.
Key Findings Of Consumer Intelligence Analytics Ppt PowerPoint Presentation Icon Model PDF
Following slide highlights consumer intelligence analytics findings that can be used by organization to understand individual customer needs and wants. Customer analytics findings include metrics such as customer name, tenure days, transaction usage, NPS, churn probability, churn prediction and required actions to be taken. Pitch your topic with ease and precision using this Key Findings Of Consumer Intelligence Analytics Ppt PowerPoint Presentation Icon Model PDF. This layout presents information on Customer, Tenure days, Transition Usage. It is also available for immediate download and adjustment. So, changes can be made in the color, design, graphics or any other component to create a unique layout.
Social Network Playbook Social Media Kpi Analytics Measurement Ppt Icon Demonstration PDF
This template covers key performance indicator KPI to determine the performance against the company objectives. These Social media KPIs would be focusing on social engagements, content reach, purchase leads and conversions. Deliver an awe inspiring pitch with this creative social network playbook social media kpi analytics measurement ppt icon demonstration pdf bundle. Topics like social media kpi analytics measurement can be discussed with this completely editable template. It is available for immediate download depending on the needs and requirements of the user.
Service Level Agreement KPI Dashboard With Graph And Analytics Icon Inspiration PDF
Persuade your audience using this Service Level Agreement KPI Dashboard With Graph And Analytics Icon Inspiration PDF. This PPT design covers three stages, thus making it a great tool to use. It also caters to a variety of topics including Service Level, Agreement KPI Dashboard, Graph And Analytics, Icon. Download this PPT design now to present a convincing pitch that not only emphasizes the topic but also showcases your presentation skills.
Employee Key Performance Indicators Performance Indicators Analytics And Monitoring Icon Demonstration PDF
Pitch your topic with ease and precision using this Employee Key Performance Indicators Performance Indicators Analytics And Monitoring Icon Demonstration PDF This layout presents information on Employee Key, Performance Indicators, Performance Indicators It is also available for immediate download and adjustment. So, changes can be made in the color, design, graphics or any other component to create a unique layout.
Digital Analytics Roadmap With Business Reporting Ppt PowerPoint Presentation Icon Portfolio PDF
Presenting digital analytics roadmap with business reporting ppt powerpoint presentation icon portfolio pdf to dispense important information. This template comprises four stages. It also presents valuable insights into the topics including analysis, business, customization. This is a completely customizable PowerPoint theme that can be put to use immediately. So, download it and address the topic impactfully.
Human Resource Analytics Report With Kpis Ppt PowerPoint Presentation Icon Files PDF
Showcasing this set of slides titled human resource analytics report with kpis ppt powerpoint presentation icon files pdf. The topics addressed in these templates are target, internal net promoter score, female gender, staff turnover, vacancy rate. All the content presented in this PPT design is completely editable. Download it and make adjustments in color, background, font etc. as per your unique business setting.
business intelligence and analytics dashboard ppt powerpoint presentation icon example topics pdf
Presenting this set of slides with name business intelligence and analytics dashboard ppt powerpoint presentation icon example topics pdf. The topics discussed in these slides are geographic distribution of total revenue, top 5 product by total revenue, measuring running by total revenue, how close are we to tour planned total revenue. This is a completely editable PowerPoint presentation and is available for immediate download. Download now and impress your audience.
Swot Analysis Icon Illustration Of Predictive Analytics Promotions Ppt PowerPoint Presentation File Elements PDF
Persuade your audience using this swot analysis icon illustration of predictive analytics promotions ppt powerpoint presentation file elements pdf. This PPT design covers four stages, thus making it a great tool to use. It also caters to a variety of topics including strengths, weaknesses, opportunities. Download this PPT design now to present a convincing pitch that not only emphasizes the topic but also showcases your presentation skills.
Business To Business Digital Google Data Studio Reports Icons PDF
This template covers tools to measure marketing analytics such as google analytics for all web tracking, google data studio to build real-time reporting dashboards and google data studio reports. Whether you have daily or monthly meetings, a brilliant presentation is necessary. Business To Business Digital Google Data Studio Reports Icons PDF can be your best option for delivering a presentation. Represent everything in detail using Business To Business Digital Google Data Studio Reports Icons PDF and make yourself stand out in meetings. The template is versatile and follows a structure that will cater to your requirements. All the templates prepared by Slidegeeks are easy to download and edit. Our research experts have taken care of the corporate themes as well. So, give it a try and see the results.
Advanced Service Data Analysis Icons Slide Infographics PDF
Download our innovative and attention grabbing advanced service data analysis icons slide infographics pdf template. The set of slides exhibit completely customizable icons. These icons can be incorporated into any business presentation. So download it immediately to clearly communicate with your clientele.
Icons Slide For Data Security In Cloud Computing Ppt Presentation
Download our innovative and attention grabbing Icons Slide For Data Security In Cloud Computing Ppt Presentation template. The set of slides exhibit completely customizable icons. These icons can be incorporated into any business presentation. So download it immediately to clearly communicate with your clientele. Our Icons Slide For Data Security In Cloud Computing Ppt Presentation are topically designed to provide an attractive backdrop to any subject. Use them to look like a presentation pro.
Icons Slide For Effective Data Migration Using Cloud Service Offerings
Slidegeeks is here to make your presentations a breeze with Icons Slide For Effective Data Migration Using Cloud Service Offerings With our easy-to-use and customizable templates, you can focus on delivering your ideas rather than worrying about formatting. With a variety of designs to choose from, you are sure to find one that suits your needs. And with animations and unique photos, illustrations, and fonts, you can make your presentation pop. So whether you are giving a sales pitch or presenting to the board, make sure to check out Slidegeeks first Our Icons Slide For Effective Data Migration Using Cloud Service Offerings are topically designed to provide an attractive backdrop to any subject. Use them to look like a presentation pro.
Data Breach Prevention Recognition Icons Slide Ppt Styles Designs PDF
Download our innovative and attention-grabbing data breach prevention recognition icons slide ppt styles designs pdf template. The set of slides exhibit completely customizable icons. These icons can be incorporated into any business presentation. So download it immediately to clearly communicate with your clientele.
Icons Slide For Data Lineage Techniques Graphics PDF
Introducing our well designed Icons Slide For Data Lineage Techniques Graphics PDF set of slides. The slide displays editable icons to enhance your visual presentation. The icons can be edited easily. So customize according to your business to achieve a creative edge. Download and share it with your audience.
Icons Slide Guide For Data Driven Advertising Campaign Mockup Pdf
Download our innovative and attention grabbing Icons Slide Guide For Data Driven Advertising Campaign Mockup Pdf template. The set of slides exhibit completely customizable icons. These icons can be incorporated into any business presentation. So download it immediately to clearly communicate with your clientele. Our Icons Slide Guide For Data Driven Advertising Campaign Mockup Pdf are topically designed to provide an attractive backdrop to any subject. Use them to look like a presentation pro.
Icons Slide For Data Integration Strategies For Business Success
Download our innovative and attention grabbing Icons Slide For Data Integration Strategies For Business Success template. The set of slides exhibit completely customizable icons. These icons can be incorporated into any business presentation. So download it immediately to clearly communicate with your clientele. Our Icons Slide For Data Integration Strategies For Business Success are topically designed to provide an attractive backdrop to any subject. Use them to look like a presentation pro.
Icons Slide For Analyzing Hr Data For Effective Decision Making
Presenting our innovatively structured Icons Slide For Analyzing Hr Data For Effective Decision Making set of slides. The slides contain a hundred100 percent editable icons. You can replace these icons without any inconvenience. Therefore, pick this set of slides and create a striking presentation. Our Icons Slide For Analyzing Hr Data For Effective Decision Making are topically designed to provide an attractive backdrop to any subject. Use them to look like a presentation pro.
Icons Slide Data Fortification Strengthening Defenses Against Breaches
Download our innovative and attention grabbing Icons Slide Data Fortification Strengthening Defenses Against Breaches template. The set of slides exhibit completely customizable icons. These icons can be incorporated into any business presentation. So download it immediately to clearly communicate with your clientele. Our Icons Slide Data Fortification Strengthening Defenses Against Breaches are topically designed to provide an attractive backdrop to any subject. Use them to look like a presentation pro.
Multi Application Of Data Science Industrial Process Technology Icons PDF
Pitch your topic with ease and precision using this Multi Application Of Data Science Industrial Process Technology Icons PDF. This layout presents information on Data Science Industrial, Process Technology. It is also available for immediate download and adjustment. So, changes can be made in the color, design, graphics or any other component to create a unique layout.
Data Engineering Vector Icons Ppt PowerPoint Presentation Model Graphic Images
This is a data engineering vector icons ppt powerpoint presentation model graphic images. This is a three stage process. The stages in this process are data, analysis, data science, information science.
Data Analysis Vector Icons Ppt Powerpoint Presentation Layouts Gridlines
This is a data analysis vector icons ppt powerpoint presentation layouts gridlines. This is a two stage process. The stages in this process are data presentation, content presentation, information presentation.
Using Data Science Technologies For Business Transformation Icons PDF
This slide describes the tasks performed by the business analyst and how he will be helpful to improve business operations and his skills. Find highly impressive Using Data Science Technologies For Business Transformation Icons PDF on Slidegeeks to deliver a meaningful presentation. You can save an ample amount of time using these presentation templates. No need to worry to prepare everything from scratch because Slidegeeks experts have already done a huge research and work for you. You need to download Using Data Science Technologies For Business Transformation Icons PDF for your upcoming presentation. All the presentation templates are 100 percent editable and you can change the color and personalize the content accordingly. Download now.
Management Information System What Is Cloud Data Warehouse Icons PDF
This slide depicts what a cloud data warehouse is and how it can store data from many data sources and is scalable as per the organizational needs.Deliver an awe inspiring pitch with this creative Management Information System What Is Cloud Data Warehouse Icons PDF bundle. Topics like Warehouse Accept, Data Sources, Quickly Expanded can be discussed with this completely editable template. It is available for immediate download depending on the needs and requirements of the user.
Centralized Repository Data Lake Reporting Dashboard Icons PDF
This slide represents the data lake reporting dashboard by covering the total number of users, total lake size, trusted zone size, conversion rate, and retention. Find a pre designed and impeccable Centralized Repository Data Lake Reporting Dashboard Icons PDF. The templates can ace your presentation without additional effort. You can download these easy to edit presentation templates to make your presentation stand out from others. So, what are you waiting for Download the template from Slidegeeks today and give a unique touch to your presentation.
Various Crowdsourcing Data Applications For Various Industries Icons Pdf
The following slide depicts industry specific crowdsourcing applications. It includes various components of various sectors such as ecommerce, advertising, technology and financial services. Pitch your topic with ease and precision using this Various Crowdsourcing Data Applications For Various Industries Icons Pdf This layout presents information on Ecommerce, Advertising, Technology, Financial Services It is also available for immediate download and adjustment. So, changes can be made in the color, design, graphics or any other component to create a unique layout. The following slide depicts industry specific crowdsourcing applications. It includes various components of various sectors such as ecommerce, advertising, technology and financial services.
Data Science Icons Slide Checklist Ppt PowerPoint Presentation Information
Presenting this set of slides with name data science icons slide checklist ppt powerpoint presentation information. The topics discussed in these slides are business, management, planning, strategy, marketing. This is a completely editable PowerPoint presentation and is available for immediate download. Download now and impress your audience.
KPI Dashboard Showing Warehouse Data And Fleet Status Icons PDF
Pitch your topic with ease and precision using this KPI Dashboard Showing Warehouse Data And Fleet Status Icons PDF This layout presents information on Deliveries By Country, Delivery Status, Profit By Country It is also available for immediate download and adjustment. So, changes can be made in the color, design, graphics or any other component to create a unique layout.
Warehouse Data KPI With Order Performance Dashboard Icons PDF
Pitch your topic with ease and precision using this Warehouse Data KPI With Order Performance Dashboard Icons PDF This layout presents information on Inventory Accuracy, Order Accuracy Europe, Total Accuracy It is also available for immediate download and adjustment. So, changes can be made in the color, design, graphics or any other component to create a unique layout.
Management Information System What Is Data Warehouse Icons PDF
This slide represents what a data warehouse is, including its different data sources and the operations performed on that information, such as OLAP analysis and so on.Deliver an awe inspiring pitch with this creative Management Information System What Is Data Warehouse Icons PDF bundle. Topics like Information Gathered, Uniform Structure, Information Housed can be discussed with this completely editable template. It is available for immediate download depending on the needs and requirements of the user.
Data Mining Dashboard Of Gender And Age Demographics Icons PDF
The following slide highlights the data profiling dashboard of gender and age demographics illustrating gender and age per month, gender and general age, average age per month and individual per age group to find the gender and age composition of area Showcasing this set of slides titled data mining dashboard of gender and age demographics icons pdf . The topics addressed in these templates are data mining dashboard of gender and age demographics . All the content presented in this PPT design is completely editable. Download it and make adjustments in color, background, font etc. as per your unique business setting.
Data Collection Preparation And Preprocessing Through Machine Learning Icons PDF
Once the insights are identified, data collection sources are selected for further predictive modeling. After that, dataset is prepared with a set of attributes representing behavior patterns related to customer engagement level for specific product or service. Presenting this PowerPoint presentation, titled Data Collection Preparation And Preprocessing Through Machine Learning Icons PDF, with topics curated by our researchers after extensive research. This editable presentation is available for immediate download and provides attractive features when used. Download now and captivate your audience. Presenting this Data Collection Preparation And Preprocessing Through Machine Learning Icons PDF. Our researchers have carefully researched and created these slides with all aspects taken into consideration. This is a completely customizable Data Collection Preparation And Preprocessing Through Machine Learning Icons PDF that is available for immediate downloading. Download now and make an impact on your audience. Highlight the attractive features available with our PPTs.
Batch Processing System With Various Data Sources Icons PDF
Mentioned slide highlights batch processing system used for automating various transactions as a single group. It provides information about data sources such as magazines, surveys, interviews, observations, etc. Showcasing this set of slides titled Batch Processing System With Various Data Sources Icons PDF. The topics addressed in these templates are Surveys, Data Sources, Magazines. All the content presented in this PPT design is completely editable. Download it and make adjustments in color, background, font etc. as per your unique business setting.
Business Data Analysis Internet Of Things Icons PDF
This is a business data analysis internet of things icons pdf template with various stages. Focus and dispense information on six stages using this creative set, that comes with editable features. It contains large content boxes to add your information on topics like machine generated content or data created from iot constitute a valuable source of big data, this data is usually generated from the sensors that are connected to electronic devices. You can also showcase facts, figures, and other relevant content using this PPT layout. Grab it now.

 Home
Home