Data Analytics Icons
Key Consideration For Data Analytics Implementation Strategy Business Analysis Modification Toolkit Icons PDF
This slide depicts a holistic data analytics implementation strategy that includes a roadmap with a mix of business and technology imperatives. This is a Key Consideration For Data Analytics Implementation Strategy Business Analysis Modification Toolkit Icons PDF template with various stages. Focus and dispense information on five stages using this creative set, that comes with editable features. It contains large content boxes to add your information on topics like Time Considerations, Technology Resources, Access Process. You can also showcase facts, figures, and other relevant content using this PPT layout. Grab it now.
Executing Advance Data Analytics At Workspace Impact Analysis Of Successful Icons PDF
This slide depicts the impact of successful implementation of infrastructure intelligence in terms improved incident management and customer satisfaction and also depicts that how much the focus area has been improved from the previous state. This is a executing advance data analytics at workspace impact analysis of successful icons pdf template with various stages. Focus and dispense information on four stages using this creative set, that comes with editable features. It contains large content boxes to add your information on topics like impact analysis of successful infrastructure intelligence implementation. You can also showcase facts, figures, and other relevant content using this PPT layout. Grab it now.
Executing Advance Data Analytics At Workspace Determine Sprints Management Timeline Icons PDF
The slide displays information regarding various crucial activities such as release management, configuration management, etc. are transformed into small attainable sprints task by tracking their progress through the timeline associated to them. Deliver and pitch your topic in the best possible manner with this executing advance data analytics at workspace determine sprints management timeline icons pdf. Use them to share invaluable insights on determine sprints management timeline and impress your audience. This template can be altered and modified as per your expectations. So, grab it now.
Executing Advance Data Analytics At Workspace Need Of Appointing Chief Icons PDF
This slide covers details about the requirement of Chief Technology Officer which will be considered as important in technological advancement of firm as he plays vital role in increasing firms infrastructure intelligence capabilities. Deliver and pitch your topic in the best possible manner with this executing advance data analytics at workspace need of appointing chief icons pdf. Use them to share invaluable insights on need of appointing chief technology officer and impress your audience. This template can be altered and modified as per your expectations. So, grab it now.
Icon Slides For Big Data Analytics Investor Funding Elevator Pitch Deck
Whether you have daily or monthly meetings, a brilliant presentation is necessary. Icon Slides For Big Data Analytics Investor Funding Elevator Pitch Deck can be your best option for delivering a presentation. Represent everything in detail using Icon Slides For Big Data Analytics Investor Funding Elevator Pitch Deck and make yourself stand out in meetings. The template is versatile and follows a structure that will cater to your requirements. All the templates prepared by Slidegeeks are easy to download and edit. Our research experts have taken care of the corporate themes as well. So, give it a try and see the results. Our Icon Slides For Big Data Analytics Investor Funding Elevator Pitch Deck are topically designed to provide an attractive backdrop to any subject. Use them to look like a presentation pro.
Big Data Analytics Use Cases For Different Activities Ppt Icon Smartart Pdf
This slide represents the use cases of big data analytics in the operations of various sectors of the market. It further includes accounting, aviation, agriculture , automotive and business and management. Showcasing this set of slides titled Big Data Analytics Use Cases For Different Activities Ppt Icon Smartart pdf. The topics addressed in these templates are Accounting, Aviation, Agriculture. All the content presented in this PPT design is completely editable. Download it and make adjustments in color, background, font etc. as per your unique business setting. This slide represents the use cases of big data analytics in the operations of various sectors of the market. It further includes accounting, aviation, agriculture , automotive and business and management.
Icons Slide For Executing Advance Data Analytics At Workspace Brochure PDF
Presenting our innovatively structured icons slide for executing advance data analytics at workspace brochure pdf set of slides. The slides contain a hundred percent editable icons. You can replace these icons without any inconvenience. Therefore, pick this set of slides and create a striking presentation.
Icons Slide For Oracle Cloud Data Analytics Administration IT Microsoft PDF
Presenting our innovatively structured icons slide for oracle cloud data analytics administration it microsoft pdf set of slides. The slides contain a hundred percent editable icons. You can replace these icons without any inconvenience. Therefore, pick this set of slides and create a striking presentation.
Table Of Contents For Predictive Analytics In The Age Of Big Data Icons PDF
If your project calls for a presentation, then Slidegeeks is your go to partner because we have professionally designed, easy to edit templates that are perfect for any presentation. After downloading, you can easily edit Table Of Contents For Predictive Analytics In The Age Of Big Data Icons PDF and make the changes accordingly. You can rearrange slides or fill them with different images. Check out all the handy templates
Customer Behavioral Data And Analytics Strategies For Higher Conversions Lower Funnel Icons PDF
Based on customer behavior, here are some strategies to ensure purchase from people already interested in buying your products. Presenting customer behavioral data and analytics strategies for higher conversions lower funnel icons pdf to provide visual cues and insights. Share and navigate important information on three stages that need your due attention. This template can be used to pitch topics like single page checkout, item in stock, prominent cta button. In addtion, this PPT design contains high resolution images, graphics, etc, that are easily editable and available for immediate download.
BI Technique For Data Informed Decisions Deployment Options For Sap Analytics Cloud Icons PDF
The purpose of this slide is to provide an information regarding the deployment methods for SAP Analytics Cloud implementation in the business organization. It also contains details of each deployment options key features. Slidegeeks is one of the best resources for PowerPoint templates. You can download easily and regulate BI Technique For Data Informed Decisions Deployment Options For Sap Analytics Cloud Icons PDF for your personal presentations from our wonderful collection. A few clicks is all it takes to discover and get the most relevant and appropriate templates. Use our Templates to add a unique zing and appeal to your presentation and meetings. All the slides are easy to edit and you can use them even for advertisement purposes.
Vendor Performance KPI Analytical Dashboard Icon For Data Management Background PDF
Persuade your audience using this Vendor Performance KPI Analytical Dashboard Icon For Data Management Background PDF. This PPT design covers three stages, thus making it a great tool to use. It also caters to a variety of topics including Vendor Performance, KPI Analytical Dashboard, Icon Data Management. Download this PPT design now to present a convincing pitch that not only emphasizes the topic but also showcases your presentation skills.
Icon For Big Data And Predictive Analytics In Health Industry Demonstration PDF
Presenting Icon For Big Data And Predictive Analytics In Health Industry Demonstration PDF to dispense important information. This template comprises three stages. It also presents valuable insights into the topics including Icon Big Data, Predictive Analytics, Health Industry. This is a completely customizable PowerPoint theme that can be put to use immediately. So, download it and address the topic impactfully.
Data Assimilation Advanced Analytics Final Output Results Mean Ppt Icon Diagrams PDF
Deliver an awe inspiring pitch with this creative data assimilation advanced analytics final output results mean ppt icon diagrams pdf bundle. Topics like outcome, metric, data source, analysis approach, environment can be discussed with this completely editable template. It is available for immediate download depending on the needs and requirements of the user.
Data Driven Plan With Analytics Culture Ppt PowerPoint Presentation Gallery Icons PDF
Presenting data driven plan with analytics culture ppt powerpoint presentation gallery icons pdf to dispense important information. This template comprises seven stages. It also presents valuable insights into the topics including champion analytics from the top, focus your analytics efforts, create a single analytics initiative, establish an analytics culture, empower and educate the team on analytics, use the right analytics technology, enable access to the data. This is a completely customizable PowerPoint theme that can be put to use immediately. So, download it and address the topic impactfully.
Icons Slide For Data Modeling Approaches For Modern Analytics Microsoft Pdf
Introducing our well designed Icons Slide For Data Modeling Approaches For Modern Analytics Microsoft Pdf set of slides. The slide displays editable icons to enhance your visual presentation. The icons can be edited easily. So customize according to your business to achieve a creative edge. Download and share it with your audience. Our Icons Slide For Data Modeling Approaches For Modern Analytics Microsoft Pdf are topically designed to provide an attractive backdrop to any subject. Use them to look like a presentation pro.
Icons Slide For Toolkit For Data Science And Analytics Transition Elements PDF
Presenting our innovatively structured Icons Slide For Toolkit For Data Science And Analytics Transition Elements PDF set of slides. The slides contain a hundred percent editable icons. You can replace these icons without any inconvenience. Therefore, pick this set of slides and create a striking presentation.
Icons Slide For Business Intelligence And Big Data Analytics Transformation Toolkit Slides PDF
Introducing our well designed icons slide for business intelligence and big data analytics transformation toolkit slides pdf set of slides. The slide displays editable icons to enhance your visual presentation. The icons can be edited easily. So customize according to your business to achieve a creative edge. Download and share it with your audience.
Icons Slide For Predictive Analytics For Empowering Data Driven Decision Making Designs Pdf
Download our innovative and attention grabbing Icons Slide For Predictive Analytics For Empowering Data Driven Decision Making Designs Pdf template. The set of slides exhibit completely customizable icons. These icons can be incorporated into any business presentation. So download it immediately to clearly communicate with your clientele. Our Icons Slide For Predictive Analytics For Empowering Data Driven Decision Making Designs Pdf are topically designed to provide an attractive backdrop to any subject. Use them to look like a presentation pro.
Data Analytics Planning With Key Performance Indicators Ppt PowerPoint Presentation Icon Infographic Template PDF
Presenting data analytics planning with key performance indicators ppt powerpoint presentation icon infographic template pdf to dispense important information. This template comprises four stages. It also presents valuable insights into the topics including performance, business, strategy. This is a completely customizable PowerPoint theme that can be put to use immediately. So, download it and address the topic impactfully.
Marketers Guide To Data Analysis Optimization Introduction To Marketing Analytics For Strategic Decision Making Icons PDF
This slide covers a brief overview of data analytics to assess the effectiveness of marketing activities. It also includes focus areas such as product intelligence, customer trends, preferences, customer support, messaging, and media. Explore a selection of the finest Marketers Guide To Data Analysis Optimization Introduction To Marketing Analytics For Strategic Decision Making Icons PDF here. With a plethora of professionally designed and pre made slide templates, you can quickly and easily find the right one for your upcoming presentation. You can use our Marketers Guide To Data Analysis Optimization Introduction To Marketing Analytics For Strategic Decision Making Icons PDF to effectively convey your message to a wider audience. Slidegeeks has done a lot of research before preparing these presentation templates. The content can be personalized and the slides are highly editable. Grab templates today from Slidegeeks.
Iot And Data Analytics Applications For In Agricultural Industry Value Chain Ppt Icon Shapes PDF
This slide covers applications for internet of things and predictive data analytics to improve quality of farming techniques and value chain. It includes elements such as technologies used comprising of big data, IOT, cloud computing, GPS system, remote sensing , etc. along with information required. Pitch your topic with ease and precision using this Iot And Data Analytics Applications For In Agricultural Industry Value Chain Ppt Icon Shapes PDF. This layout presents information on Technologies, Big Data Analytics, Cloud Computing. It is also available for immediate download and adjustment. So, changes can be made in the color, design, graphics or any other component to create a unique layout.
Data Valuation And Monetization Predicting Customer Churn Probability Through Predictive Analytics Icons PDF
After deploying predictive analytics tool, the firm will become capable in predicting churn probability of various customers on basis of various attributes such as NPS, transaction usage, etc. that are retrieved from customer data.Deliver and pitch your topic in the best possible manner with this Data Valuation And Monetization Predicting Customer Churn Probability Through Predictive Analytics Icons PDF. Use them to share invaluable insights on Transaction, Churn Probability, Comments and impress your audience. This template can be altered and modified as per your expectations. So, grab it now.
BI Technique For Data Informed Decisions Global Market Landscape Of Sap Analytics Cloud Suite Icons PDF
The purpose of this slide is to showcase the global market landscape of SAP analytics cloud as BI tool. It also contains information regarding the business intelligence BI software market share and SAP analytics cloud customers by industry. Are you in need of a template that can accommodate all of your creative concepts This one is crafted professionally and can be altered to fit any style. Use it with Google Slides or PowerPoint. Include striking photographs, symbols, depictions, and other visuals. Fill, move around, or remove text boxes as desired. Test out color palettes and font mixtures. Edit and save your work, or work with colleagues. Download BI Technique For Data Informed Decisions Global Market Landscape Of Sap Analytics Cloud Suite Icons PDF and observe how to make your presentation outstanding. Give an impeccable presentation to your group and make your presentation unforgettable.
Icons Slide For Administered Data And Analytic Quality Playbook Microsoft PDF
Introducing our well designed Icons Slide For Administered Data And Analytic Quality Playbook Microsoft PDF set of slides. The slide displays editable icons to enhance your visual presentation. The icons can be edited easily. So customize according to your business to achieve a creative edge. Download and share it with your audience.
Icons Slide For Developing Strategic Insights Using Big Data Analytics Across Business Sectors
Download our innovative and attention grabbing Icons Slide For Developing Strategic Insights Using Big Data Analytics Across Business Sectors template. The set of slides exhibit completely customizable icons. These icons can be incorporated into any business presentation. So download it immediately to clearly communicate with your clientele. Our Icons Slide For Developing Strategic Insights Using Big Data Analytics Across Business Sectors are topically designed to provide an attractive backdrop to any subject. Use them to look like a presentation pro.
Icon For Customer Relation Management Lifecycle Process Data Analytics In CRM Portrait PDF
Pitch your topic with ease and precision using this Icon For Customer Relation Management Lifecycle Process Data Analytics In CRM Portrait PDF. This layout presents information on Icon For Customer Relation Management Lifecycle Process Data Analytics In CRM. It is also available for immediate download and adjustment. So, changes can be made in the color, design, graphics or any other component to create a unique layout.
Administered Data And Analytic Quality Playbook How To Fix The Business Intelligence Problem Icons PDF
This template covers the solution for BI problems such as analytics transformation and business intelligence program. It also depicts that switching to next-generation analytics platform that gives business users data driven insights.This is a Administered Data And Analytic Quality Playbook How To Fix The Business Intelligence Problem Icons PDF template with various stages. Focus and dispense information on six stages using this creative set, that comes with editable features. It contains large content boxes to add your information on topics like Driven Analytics, Automated Discovery, Bridging Business You can also showcase facts, figures, and other relevant content using this PPT layout. Grab it now.
Icons Slide For Optimizing Decision Making The Power Of Prescriptive Analytics Data Analytics SS V
Introducing our well designed Icons Slide For Optimizing Decision Making The Power Of Prescriptive Analytics Data Analytics SS V set of slides. The slide displays editable icons to enhance your visual presentation. The icons can be edited easily. So customize according to your business to achieve a creative edge. Download and share it with your audience. Our Icons Slide For Optimizing Decision Making The Power Of Prescriptive Analytics Data Analytics SS V are topically designed to provide an attractive backdrop to any subject. Use them to look like a presentation pro.
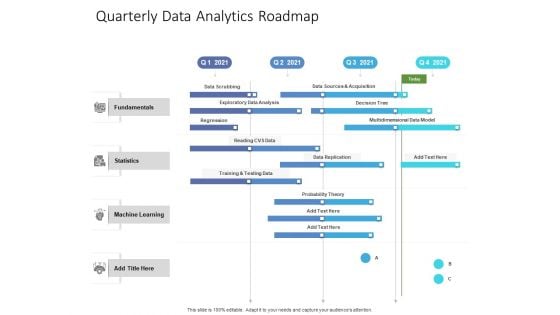
Quarterly Data Analytics Roadmap Pictures
Introducing our quarterly data analytics roadmap pictures. This PPT presentation is Google Slides compatible, therefore, you can share it easily with the collaborators for measuring the progress. Also, the presentation is available in both standard screen and widescreen aspect ratios. So edit the template design by modifying the font size, font type, color, and shapes as per your requirements. As this PPT design is fully editable it can be presented in PDF, JPG and PNG formats.

Types Of Data Monitored In Product Analytics Product Analytics Implementation Data Analytics V
This slide outlines major categories of data tracked using product analytics aimed at improving performance to increase business revenue. It covers categories such as event tracking as well as properties Are you searching for a Types Of Data Monitored In Product Analytics Product Analytics Implementation Data Analytics V that is uncluttered, straightforward, and original Its easy to edit, and you can change the colors to suit your personal or business branding. For a presentation that expresses how much effort you have put in, this template is ideal With all of its features, including tables, diagrams, statistics, and lists, its perfect for a business plan presentation. Make your ideas more appealing with these professional slides. Download Types Of Data Monitored In Product Analytics Product Analytics Implementation Data Analytics V from Slidegeeks today. This slide outlines major categories of data tracked using product analytics aimed at improving performance to increase business revenue. It covers categories such as event tracking as well as properties

Prescriptive Analytics Software Tool Rapidminer Data Analytics SS V
This slide provides overview of RapidMiner as a prescriptive analytics tool to help businesses evaluate its usability. It covers details of RapidMiner regarding description, features and pricing plans.Are you searching for a Prescriptive Analytics Software Tool Rapidminer Data Analytics SS V that is uncluttered, straightforward, and original Its easy to edit, and you can change the colors to suit your personal or business branding. For a presentation that expresses how much effort you have put in, this template is ideal With all of its features, including tables, diagrams, statistics, and lists, its perfect for a business plan presentation. Make your ideas more appealing with these professional slides. Download Prescriptive Analytics Software Tool Rapidminer Data Analytics SS V from Slidegeeks today. This slide provides overview of RapidMiner as a prescriptive analytics tool to help businesses evaluate its usability. It covers details of RapidMiner regarding description, features and pricing plans.

Segmentation Of Global Prescriptive Analytics Market Data Analytics SS V
This slide provides an overview of market segmentation of prescriptive analytics at a global level. It covers segmentation analysis based on region, data type, component and deployment with key takeaways.Take your projects to the next level with our ultimate collection of Segmentation Of Global Prescriptive Analytics Market Data Analytics SS V. Slidegeeks has designed a range of layouts that are perfect for representing task or activity duration, keeping track of all your deadlines at a glance. Tailor these designs to your exact needs and give them a truly corporate look with your own brand colors they will make your projects stand out from the rest This slide provides an overview of market segmentation of prescriptive analytics at a global level. It covers segmentation analysis based on region, data type, component and deployment with key takeaways.

Prescriptive Analytics Software Tool Tableau Data Analytics SS V
This slide provides overview of Tableau as a data analytics tools providing data visualization features. It covers details of Tableau regarding description, features and pricing plans.Retrieve professionally designed Prescriptive Analytics Software Tool Tableau Data Analytics SS V to effectively convey your message and captivate your listeners. Save time by selecting pre-made slideshows that are appropriate for various topics, from business to educational purposes. These themes come in many different styles, from creative to corporate, and all of them are easily adjustable and can be edited quickly. Access them as PowerPoint templates or as Google Slides themes. You do not have to go on a hunt for the perfect presentation because Slidegeeks got you covered from everywhere. This slide provides overview of Tableau as a data analytics tools providing data visualization features. It covers details of Tableau regarding description, features and pricing plans.

Graph Illustrating Impact Of Prescriptive Analytics Data Analytics SS V
This slide showcases graph highlighting impact analysis of prescriptive analytics on businesses via use of major performance indicators. It provides information total revenue, inventory levels and labour costs with key insights.Take your projects to the next level with our ultimate collection of Graph Illustrating Impact Of Prescriptive Analytics Data Analytics SS V. Slidegeeks has designed a range of layouts that are perfect for representing task or activity duration, keeping track of all your deadlines at a glance. Tailor these designs to your exact needs and give them a truly corporate look with your own brand colors they will make your projects stand out from the rest This slide showcases graph highlighting impact analysis of prescriptive analytics on businesses via use of major performance indicators. It provides information total revenue, inventory levels and labour costs with key insights.

Product Analytics Implementation For Enhanced Business Insights Data Analytics V
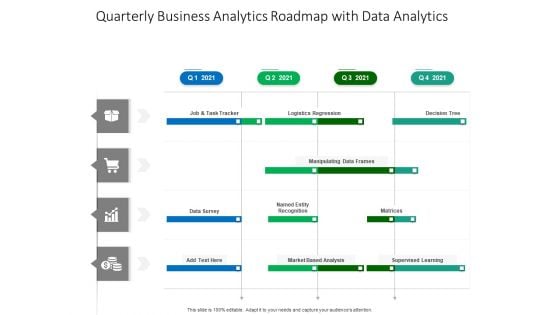
Quarterly Business Analytics Roadmap With Data Analytics Brochure
We present our quarterly business analytics roadmap with data analytics brochure. This PowerPoint layout is easy-to-edit so you can change the font size, font type, color, and shape conveniently. In addition to this, the PowerPoint layout is Google Slides compatible, so you can share it with your audience and give them access to edit it. Therefore, download and save this well-researched quarterly business analytics roadmap with data analytics brochure in different formats like PDF, PNG, and JPG to smoothly execute your business plan.
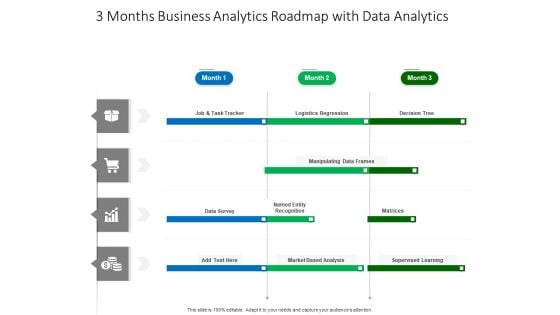
3 Months Business Analytics Roadmap With Data Analytics Structure
We present our 3 months business analytics roadmap with data analytics structure. This PowerPoint layout is easy-to-edit so you can change the font size, font type, color, and shape conveniently. In addition to this, the PowerPoint layout is Google Slides compatible, so you can share it with your audience and give them access to edit it. Therefore, download and save this well-researched 3 months business analytics roadmap with data analytics structure in different formats like PDF, PNG, and JPG to smoothly execute your business plan.
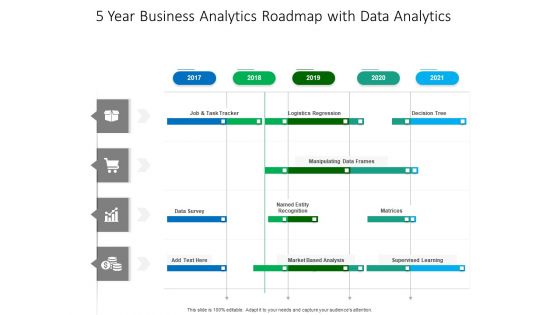
5 Year Business Analytics Roadmap With Data Analytics Sample
We present our 5 year business analytics roadmap with data analytics sample. This PowerPoint layout is easy-to-edit so you can change the font size, font type, color, and shape conveniently. In addition to this, the PowerPoint layout is Google Slides compatible, so you can share it with your audience and give them access to edit it. Therefore, download and save this well-researched 5 year business analytics roadmap with data analytics sample in different formats like PDF, PNG, and JPG to smoothly execute your business plan.
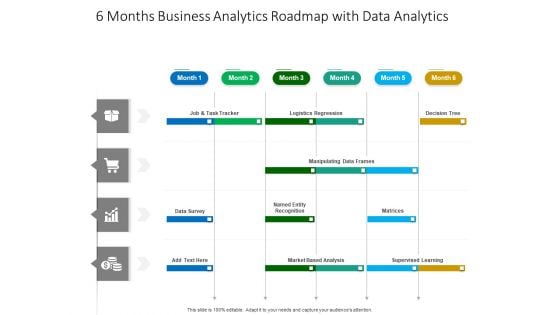
6 Months Business Analytics Roadmap With Data Analytics Brochure
We present our 6 months business analytics roadmap with data analytics brochure. This PowerPoint layout is easy-to-edit so you can change the font size, font type, color, and shape conveniently. In addition to this, the PowerPoint layout is Google Slides compatible, so you can share it with your audience and give them access to edit it. Therefore, download and save this well-researched 6 months business analytics roadmap with data analytics brochure in different formats like PDF, PNG, and JPG to smoothly execute your business plan.
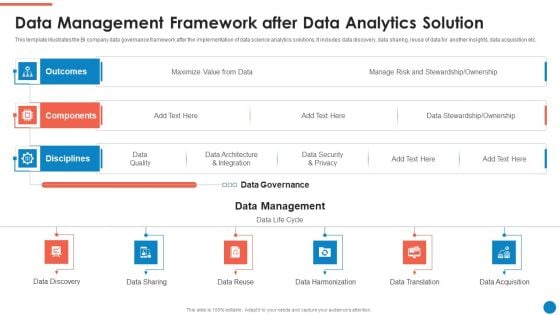
Data And Analytics Playbook Data Management Framework After Data Analytics Solution Designs PDF
This template illustrates the BI company data governance framework after the implementation of data science analytics solutions. It includes data discovery, data sharing, reuse of data for another insights, data acquisition etc. Deliver an awe inspiring pitch with this creative Data And Analytics Playbook Data Management Framework After Data Analytics Solution Designs PDF bundle. Topics like Outcomes, Components, Disciplines, Data Management, Data Governance can be discussed with this completely editable template. It is available for immediate download depending on the needs and requirements of the user.
Analytics Based Marketing Operation Model Icons Pdf
This slide shows operating model for data driven marketing strategy to gather valuable insights and implement same for increasing profit margins. It include steps such as gathering valuable insights, data management and team establishment etc.Showcasing this set of slides titled Analytics Based Marketing Operation Model Icons Pdf The topics addressed in these templates are Gathering Valuable Insights, Systematic Data Management, Team Establishment All the content presented in this PPT design is completely editable. Download it and make adjustments in color, background, font etc. as per your unique business setting. This slide shows operating model for data driven marketing strategy to gather valuable insights and implement same for increasing profit margins. It include steps such as gathering valuable insights, data management and team establishment etc.
Expert Systems Advanced Analytics Techniques Icons PDF
Presenting expert systems advanced analytics techniques icons pdf to provide visual cues and insights. Share and navigate important information on three stages that need your due attention. This template can be used to pitch topics like business intelligence, clickstream, analytics, data mining, planning. In addtion, this PPT design contains high-resolution images, graphics, etc, that are easily editable and available for immediate download.

Global Product Analytics Market Snapshot Product Analytics Implementation Data Analytics V
This slide showcase a graphical representation global product analytics market. It includes present and forecasted values of advanced analytics usage globally with key takeaways on market situationComing up with a presentation necessitates that the majority of the effort goes into the content and the message you intend to convey. The visuals of a PowerPoint presentation can only be effective if it supplements and supports the story that is being told. Keeping this in mind our experts created Global Product Analytics Market Snapshot Product Analytics Implementation Data Analytics V to reduce the time that goes into designing the presentation. This way, you can concentrate on the message while our designers take care of providing you with the right template for the situation. This slide showcase a graphical representation global product analytics market. It includes present and forecasted values of advanced analytics usage globally with key takeaways on market situation

Product Analytics KPI Dashboard For Lead Generation Product Analytics Implementation Data Analytics V
This slide illustrates a dashboard to monitor the lead generation on website page using product analytics aimed at making necessary improvements. It covers insights regarding analysis of lead conversions, event retention rate and page views.Do you have to make sure that everyone on your team knows about any specific topic I yes, then you should give Product Analytics KPI Dashboard For Lead Generation Product Analytics Implementation Data Analytics V a try. Our experts have put a lot of knowledge and effort into creating this impeccable Product Analytics KPI Dashboard For Lead Generation Product Analytics Implementation Data Analytics V. You can use this template for your upcoming presentations, as the slides are perfect to represent even the tiniest detail. You can download these templates from the Slidegeeks website and these are easy to edit. So grab these today This slide illustrates a dashboard to monitor the lead generation on website page using product analytics aimed at making necessary improvements. It covers insights regarding analysis of lead conversions, event retention rate and page views

Product Analytics Training Plan For Employees Product Analytics Implementation Data Analytics V
This slide outlines training plan aimed at helping employees learn the basics of product analytics to streamline its usage in the business enterprises. It covers details on training module, mode of training, training time slots with trainer name.Whether you have daily or monthly meetings, a brilliant presentation is necessary. Product Analytics Training Plan For Employees Product Analytics Implementation Data Analytics V can be your best option for delivering a presentation. Represent everything in detail using Product Analytics Training Plan For Employees Product Analytics Implementation Data Analytics V and make yourself stand out in meetings. The template is versatile and follows a structure that will cater to your requirements. All the templates prepared by Slidegeeks are easy to download and edit. Our research experts have taken care of the corporate themes as well. So, give it a try and see the results. This slide outlines training plan aimed at helping employees learn the basics of product analytics to streamline its usage in the business enterprises. It covers details on training module, mode of training, training time slots with trainer name.

Implementation Timeline Of Product Analytics In Organisation Product Analytics Implementation Data Analytics V
This slide illustrates a weekly timeline of activities undertaken while implementing product analytics in businesses to streamline operations. It covers activities under four heads choose simple use case, implement data governance, democratize product analytics and build expe4rimentataion culture Retrieve professionally designed Implementation Timeline Of Product Analytics In Organisation Product Analytics Implementation Data Analytics V to effectively convey your message and captivate your listeners. Save time by selecting pre-made slideshows that are appropriate for various topics, from business to educational purposes. These themes come in many different styles, from creative to corporate, and all of them are easily adjustable and can be edited quickly. Access them as PowerPoint templates or as Google Slides themes. You do not have to go on a hunt for the perfect presentation because Slidegeeks got you covered from everywhere. This slide illustrates a weekly timeline of activities undertaken while implementing product analytics in businesses to streamline operations. It covers activities under four heads choose simple use case, implement data governance, democratize product analytics and build expe4rimentataion culture

Product Analytics Dashboard To Track Engagement Product Analytics Implementation Data Analytics V
This slide illustrates a dashboard to monitor customer engagement on company website by leveraging product analytics tools aimed at making necessary improvements. It covers insights regarding active monthly users, new users, total completed purchases, screen views, average duration of session, etc Want to ace your presentation in front of a live audience Our Product Analytics Dashboard To Track Engagement Product Analytics Implementation Data Analytics V can help you do that by engaging all the users towards you. Slidegeeks experts have put their efforts and expertise into creating these impeccable powerpoint presentations so that you can communicate your ideas clearly. Moreover, all the templates are customizable, and easy-to-edit and downloadable. Use these for both personal and commercial use. This slide illustrates a dashboard to monitor customer engagement on company website by leveraging product analytics tools aimed at making necessary improvements. It covers insights regarding active monthly users, new users, total completed purchases, screen views, average duration of session, etc

Utilization Of Product Analytics By Various Business Product Analytics Implementation Data Analytics V
This slide provides an overview of business positions leveraging product analytics to improve their business operations. It covers use of product analytics by the following positions product manager, UX designers, marketers, customer success team, executives and business intelligence analyst Retrieve professionally designed Utilization Of Product Analytics By Various Business Product Analytics Implementation Data Analytics V to effectively convey your message and captivate your listeners. Save time by selecting pre-made slideshows that are appropriate for various topics, from business to educational purposes. These themes come in many different styles, from creative to corporate, and all of them are easily adjustable and can be edited quickly. Access them as PowerPoint templates or as Google Slides themes. You do not have to go on a hunt for the perfect presentation because Slidegeeks got you covered from everywhere. This slide provides an overview of business positions leveraging product analytics to improve their business operations. It covers use of product analytics by the following positions product manager, UX designers, marketers, customer success team, executives and business intelligence analyst

Key Metrics Used To Track Product Analytics Product Analytics Implementation Data Analytics V
This slide outlines major metrics used by businesses to analyse product performance aimed at making necessary improvements. It covers key metrics such as engagement, retention, customer lifetime value, number of crashes and feature adoption rate with benefits Do you know about Slidesgeeks Key Metrics Used To Track Product Analytics Product Analytics Implementation Data Analytics V These are perfect for delivering any kind od presentation. Using it, create PowerPoint presentations that communicate your ideas and engage audiences. Save time and effort by using our pre-designed presentation templates that are perfect for a wide range of topic. Our vast selection of designs covers a range of styles, from creative to business, and are all highly customizable and easy to edit. Download as a PowerPoint template or use them as Google Slides themes. This slide outlines major metrics used by businesses to analyse product performance aimed at making necessary improvements. It covers key metrics such as engagement, retention, customer lifetime value, number of crashes and feature adoption rate with benefits
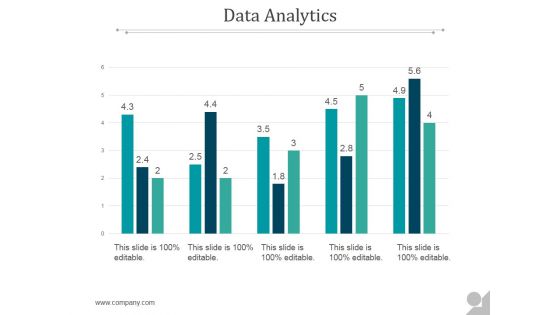
Data Analytics Ppt PowerPoint Presentation Themes
This is a data analytics ppt powerpoint presentation themes. This is a five stage process. The stages in this process are business, marketing, presentation, data analyst, management.
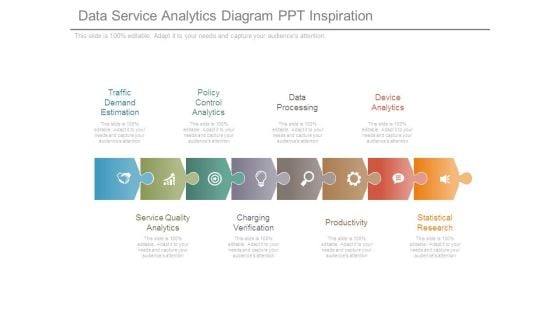
Data Service Analytics Diagram Ppt Inspiration
This is a data service analytics diagram ppt inspiration. This is a eight stage process. The stages in this process are traffic demand estimation, policy control analytics, data processing, device analytics, service quality analytics, charging verification, productivity, statistical research.
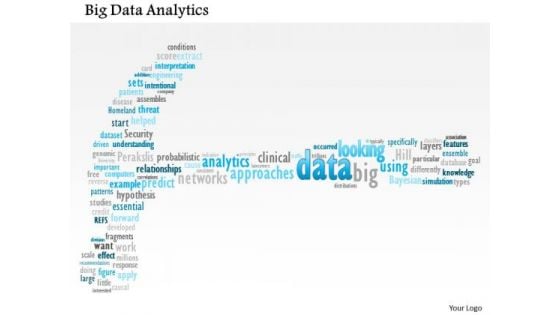
Business Framework Big Data Analytics PowerPoint Presentation
This unique power point diagram slide has been crafted with big data analytics. This data analytics is used to improve predictions and support decision making. Use this image slide for big data analysis related presentations.
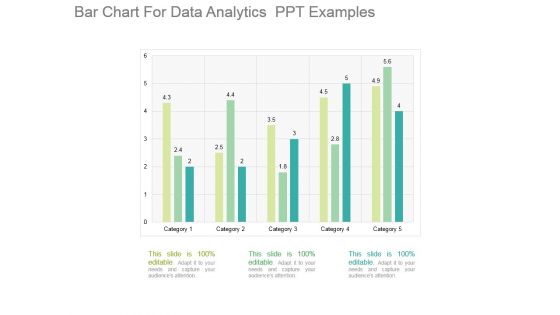
Bar Chart For Data Analytics Ppt Examples
This is a bar chart for data analytics ppt examples. This is a five stage process. The stages in this process are category.
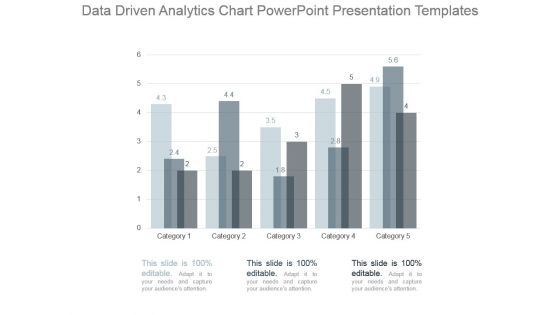
Data Driven Analytics Chart Powerpoint Presentation Templates
This is a data driven analytics chart powerpoint presentation templates. This is a five stage process. The stages in this process are category.
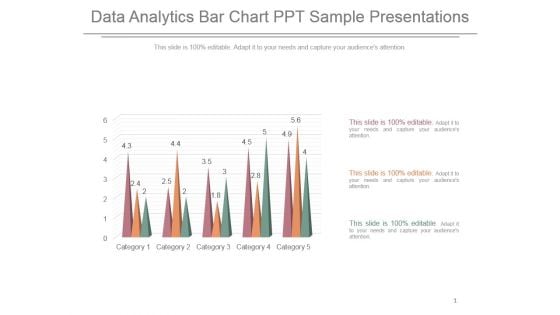
Data Analytics Bar Chart Ppt Sample Presentations
This is a data analytics bar chart ppt sample presentations. This is a five stage process. The stages in this process are category.

Ebitda Data Analytics Company Outline Topics PDF
This slide illustrates a graph of EBITDA for Kantar company showing growth trend in from 2021. It also showcases key insights for EBITDA highlighting estimated EBITDA for 2022 and 2023. Present like a pro with Ebitda Data Analytics Company Outline Topics PDF Create beautiful presentations together with your team, using our easy-to-use presentation slides. Share your ideas in real-time and make changes on the fly by downloading our templates. So whether you are in the office, on the go, or in a remote location, you can stay in sync with your team and present your ideas with confidence. With Slidegeeks presentation got a whole lot easier. Grab these presentations today. This slide illustrates a graph of EBITDA for Kantar company showing growth trend in from 2021. It also showcases key insights for EBITDA highlighting estimated EBITDA for 2022 and 2023
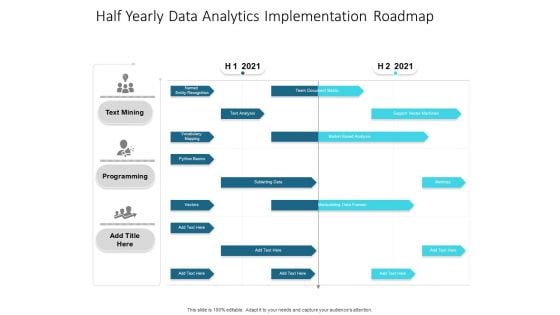
Half Yearly Data Analytics Implementation Roadmap Demonstration
We present our half yearly data analytics implementation roadmap demonstration. This PowerPoint layout is easy-to-edit so you can change the font size, font type, color, and shape conveniently. In addition to this, the PowerPoint layout is Google Slides compatible, so you can share it with your audience and give them access to edit it. Therefore, download and save this well-researched half yearly data analytics implementation roadmap demonstration in different formats like PDF, PNG, and JPG to smoothly execute your business plan.
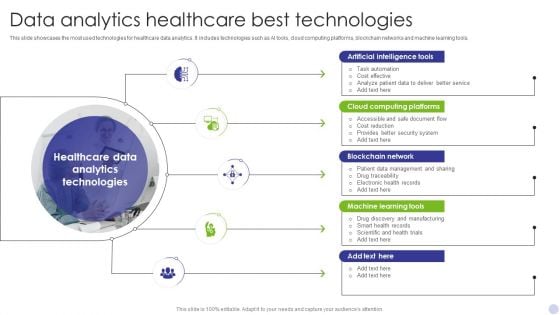
Data Analytics Healthcare Best Technologies Template PDF
This slide showcases the most used technologies for healthcare data analytics. It includes technologies such as AI tools, cloud computing platforms, blockchain networks and machine learning tools. Presenting Data Analytics Healthcare Best Technologies Template PDF to dispense important information. This template comprises Five stages. It also presents valuable insights into the topics including Artificial Intelligence Tools, Cloud Computing Platforms, Blockchain Network. This is a completely customizable PowerPoint theme that can be put to use immediately. So, download it and address the topic impactfully.

Agenda For Data Analytics Management Diagrams PDF
Presenting Agenda For Data Analytics Management Diagrams PDF to provide visual cues and insights. Share and navigate important information on five stages that need your due attention. This template can be used to pitch topics like Agenda. In addtion, this PPT design contains high resolution images, graphics, etc, that are easily editable and available for immediate download.


 Continue with Email

 Home
Home


