Data Analytics Icons
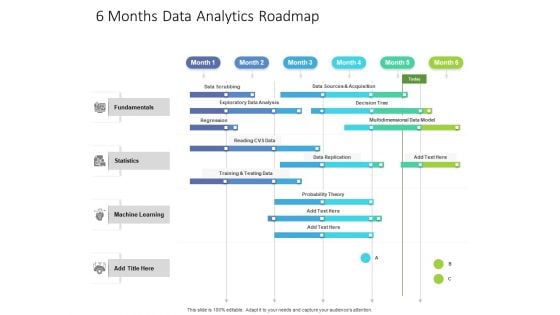
6 Months Data Analytics Roadmap Diagrams
Presenting our innovatively-structured 6 months data analytics roadmap diagrams Template. Showcase your roadmap process in different formats like PDF, PNG, and JPG by clicking the download button below. This PPT design is available in both Standard Screen and Widescreen aspect ratios. It can also be easily personalized and presented with modified font size, font type, color, and shapes to measure your progress in a clear way.
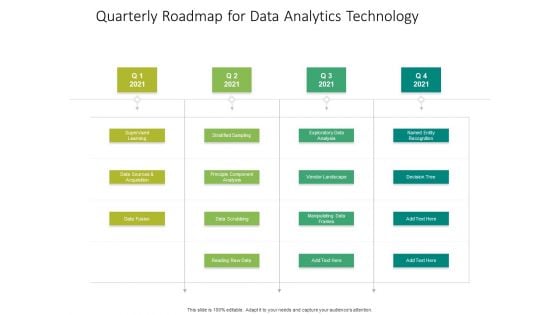
Quarterly Roadmap For Data Analytics Technology Slides
Presenting our jaw-dropping quarterly roadmap for data analytics technology slides. You can alternate the color, font size, font type, and shapes of this PPT layout according to your strategic process. This PPT presentation is compatible with Google Slides and is available in both standard screen and widescreen aspect ratios. You can also download this well-researched PowerPoint template design in different formats like PDF, JPG, and PNG. So utilize this visually-appealing design by clicking the download button given below.
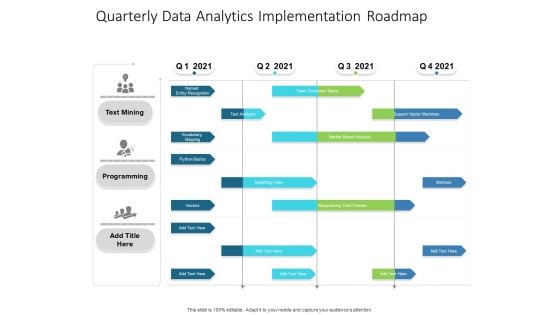
Quarterly Data Analytics Implementation Roadmap Pictures
Presenting our innovatively-structured quarterly data analytics implementation roadmap pictures Template. Showcase your roadmap process in different formats like PDF, PNG, and JPG by clicking the download button below. This PPT design is available in both Standard Screen and Widescreen aspect ratios. It can also be easily personalized and presented with modified font size, font type, color, and shapes to measure your progress in a clear way.
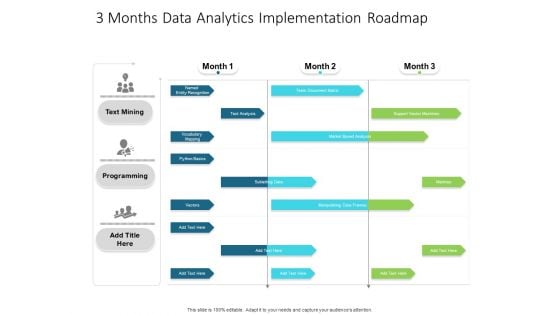
3 Months Data Analytics Implementation Roadmap Elements
Presenting our innovatively-structured 3 months data analytics implementation roadmap elements Template. Showcase your roadmap process in different formats like PDF, PNG, and JPG by clicking the download button below. This PPT design is available in both Standard Screen and Widescreen aspect ratios. It can also be easily personalized and presented with modified font size, font type, color, and shapes to measure your progress in a clear way.

3 Months Data Analytics Roadmap Structure
Introducing our 3 months data analytics roadmap structure. This PPT presentation is Google Slides compatible, therefore, you can share it easily with the collaborators for measuring the progress. Also, the presentation is available in both standard screen and widescreen aspect ratios. So edit the template design by modifying the font size, font type, color, and shapes as per your requirements. As this PPT design is fully editable it can be presented in PDF, JPG and PNG formats.
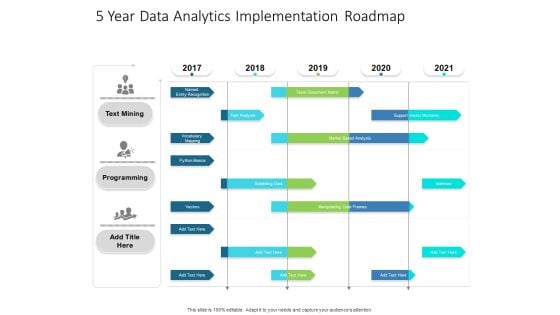
5 Year Data Analytics Implementation Roadmap Topics
Presenting our innovatively-structured 5 year data analytics implementation roadmap topics Template. Showcase your roadmap process in different formats like PDF, PNG, and JPG by clicking the download button below. This PPT design is available in both Standard Screen and Widescreen aspect ratios. It can also be easily personalized and presented with modified font size, font type, color, and shapes to measure your progress in a clear way.

5 Year Data Analytics Roadmap Infographics
Introducing our 5 year data analytics roadmap infographics. This PPT presentation is Google Slides compatible, therefore, you can share it easily with the collaborators for measuring the progress. Also, the presentation is available in both standard screen and widescreen aspect ratios. So edit the template design by modifying the font size, font type, color, and shapes as per your requirements. As this PPT design is fully editable it can be presented in PDF, JPG and PNG formats.
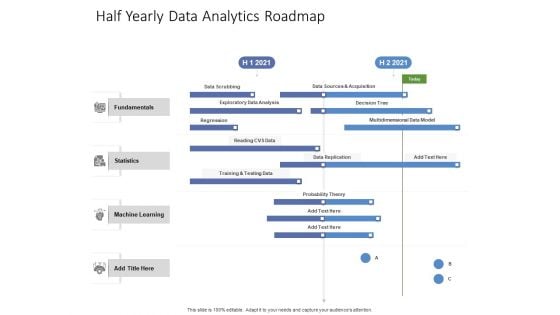
Half Yearly Data Analytics Roadmap Ideas
Presenting our innovatively-structured half yearly data analytics roadmap ideas Template. Showcase your roadmap process in different formats like PDF, PNG, and JPG by clicking the download button below. This PPT design is available in both Standard Screen and Widescreen aspect ratios. It can also be easily personalized and presented with modified font size, font type, color, and shapes to measure your progress in a clear way.
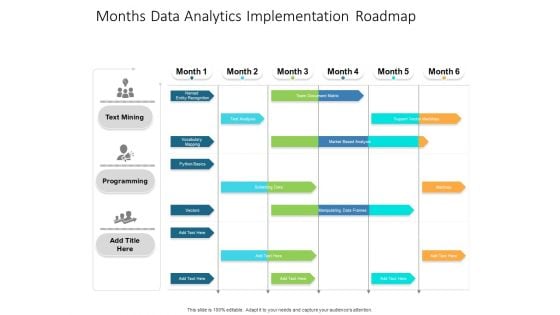
Months Data Analytics Implementation Roadmap Structure
Presenting our jaw-dropping months data analytics implementation roadmap structure. You can alternate the color, font size, font type, and shapes of this PPT layout according to your strategic process. This PPT presentation is compatible with Google Slides and is available in both standard screen and widescreen aspect ratios. You can also download this well-researched PowerPoint template design in different formats like PDF, JPG, and PNG. So utilize this visually-appealing design by clicking the download button given below.
Data Analytics IT Timeline For Data Science Implementation In The Organization Ppt Portfolio Icons PDF
This slide represents the timeline for the data science projects and a list of tasks performed each month, from training to work on projects. This is a data analytics it timeline for data science implementation in the organization ppt portfolio icons pdf template with various stages. Focus and dispense information on four stages using this creative set, that comes with editable features. It contains large content boxes to add your information on topics like exploratory analysis, final analysis, data cleaning, conditioning and transformation, data gathering from different resources. You can also showcase facts, figures, and other relevant content using this PPT layout. Grab it now.
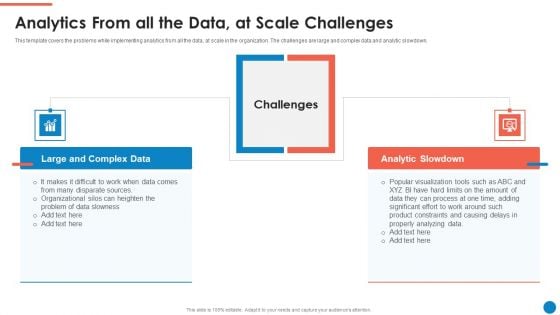
Data And Analytics Playbook Analytics From All The Data At Scale Challenges Summary PDF
This template covers the problems while implementing analytics from all the data, at scale in the organization. The challenges are large and complex data and analytic slowdown. This is a Data And Analytics Playbook Analytics From All The Data At Scale Challenges Summary PDF template with various stages. Focus and dispense information on two stages using this creative set, that comes with editable features. It contains large content boxes to add your information on topics like Large And Complex Data, Analytic Slowdown, Challenges, Data Slowness. You can also showcase facts, figures, and other relevant content using this PPT layout. Grab it now.
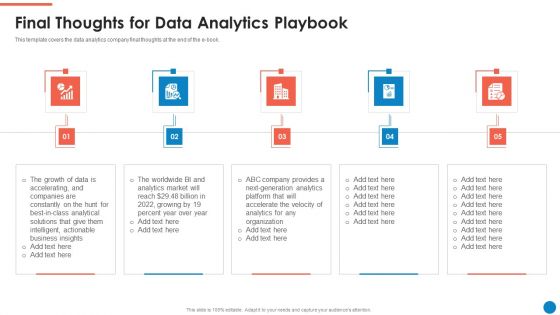
Data And Analytics Playbook Final Thoughts For Data Analytics Playbook Summary PDF
This template covers the data analytics company final thoughts at the end of the e-book. Presenting Data And Analytics Playbook Final Thoughts For Data Analytics Playbook Summary PDF to provide visual cues and insights. Share and navigate important information on five stages that need your due attention. This template can be used to pitch topics like Growth Data, Actionable Business Insights, Market. In addtion, this PPT design contains high resolution images, graphics, etc, that are easily editable and available for immediate download.
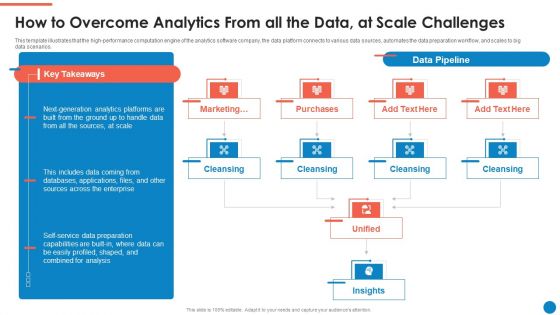
Data And Analytics Playbook How To Overcome Analytics From All The Data At Professional PDF
This template illustrates that the high-performance computation engine of the analytics software company, the data platform connects to various data sources, automates the data preparation workflow, and scales to big data scenarios. Presenting Data And Analytics Playbook How To Overcome Analytics From All The Data At Professional PDF to provide visual cues and insights. Share and navigate important information on ten stages that need your due attention. This template can be used to pitch topics like Marketing, Purchases, Cleansing, Insights, Unified. In addtion, this PPT design contains high resolution images, graphics, etc, that are easily editable and available for immediate download.
Oracle Analytics Cloud Solutions Collaboration And Publishing Icons PDF
This slide depicts the professional edition provided by Oracle Analytics Cloud and its various features that users can use to carry out valuable insights from data. This is a oracle analytics cloud solutions collaboration and publishing icons pdf template with various stages. Focus and dispense information on six stages using this creative set, that comes with editable features. It contains large content boxes to add your information on topics like business, application, collecting, processes, analytics. You can also showcase facts, figures, and other relevant content using this PPT layout. Grab it now.
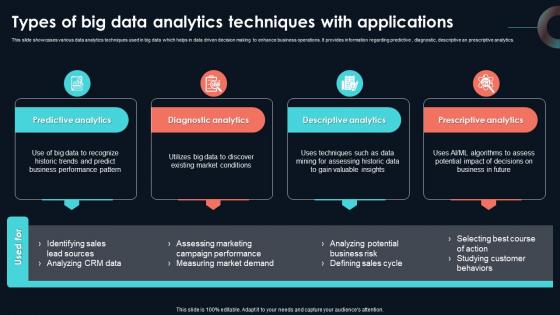
Types Of Big Data Analytics Techniques With Developing Strategic Insights Using Big Data Analytics SS V
This slide showcases various data analytics techniques used in big data which helps in data driven decision making to enhance business operations. It provides information regarding predictive , diagnostic, descriptive an prescriptive analytics. This slide showcases various data analytics techniques used in big data which helps in data driven decision making to enhance business operations. It provides information regarding predictive , diagnostic, descriptive an prescriptive analytics. Do you know about Slidesgeeks Types Of Big Data Analytics Techniques With Developing Strategic Insights Using Big Data Analytics SS V These are perfect for delivering any kind od presentation. Using it, create PowerPoint presentations that communicate your ideas and engage audiences. Save time and effort by using our pre-designed presentation templates that are perfect for a wide range of topic. Our vast selection of designs covers a range of styles, from creative to business, and are all highly customizable and easy to edit. Download as a PowerPoint template or use them as Google Slides themes. This slide showcases various data analytics techniques used in big data which helps in data driven decision making to enhance business operations. It provides information regarding predictive , diagnostic, descriptive an prescriptive analytics.
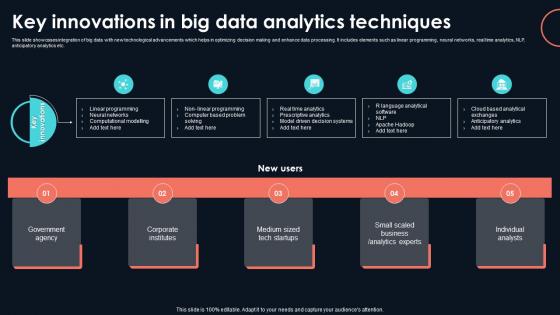
Key Innovations In Big Data Analytics Developing Strategic Insights Using Big Data Analytics SS V
This slide showcases integration of big data with new technological advancements which helps in optimizing decision making and enhance data processing. It includes elements such as linear programming, neural networks, real time analytics, NLP, anticipatory analytics etc. Whether you have daily or monthly meetings, a brilliant presentation is necessary. Key Innovations In Big Data Analytics Developing Strategic Insights Using Big Data Analytics SS V can be your best option for delivering a presentation. Represent everything in detail using Key Innovations In Big Data Analytics Developing Strategic Insights Using Big Data Analytics SS V and make yourself stand out in meetings. The template is versatile and follows a structure that will cater to your requirements. All the templates prepared by Slidegeeks are easy to download and edit. Our research experts have taken care of the corporate themes as well. So, give it a try and see the results. This slide showcases integration of big data with new technological advancements which helps in optimizing decision making and enhance data processing. It includes elements such as linear programming, neural networks, real time analytics, NLP, anticipatory analytics etc.
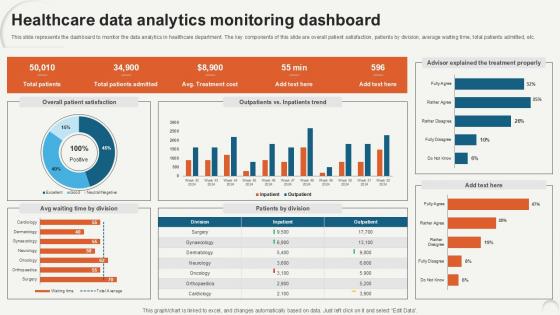
Healthcare Data Analytics Monitoring Data Analytics For Informed Decision Ppt PowerPoint
This slide represents the dashboard to monitor the data analytics in healthcare department. The key components of this slide are overall patient satisfaction, patients by division, average waiting time, total patients admitted, etc. Make sure to capture your audiences attention in your business displays with our gratis customizable Healthcare Data Analytics Monitoring Data Analytics For Informed Decision Ppt PowerPoint. These are great for business strategies, office conferences, capital raising or task suggestions. If you desire to acquire more customers for your tech business and ensure they stay satisfied, create your own sales presentation with these plain slides. This slide represents the dashboard to monitor the data analytics in healthcare department. The key components of this slide are overall patient satisfaction, patients by division, average waiting time, total patients admitted, etc.
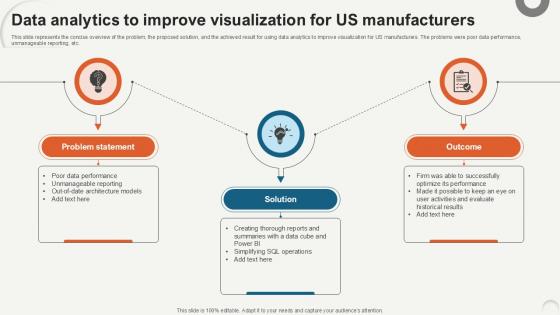
Data Analytics To Improve Visualization Data Analytics For Informed Decision Ppt PowerPoint
This slide represents the concise overview of the problem, the proposed solution, and the achieved result for using data analytics to improve visualization for US manufacturers. The problems were poor data performance, unmanageable reporting, etc. Whether you have daily or monthly meetings, a brilliant presentation is necessary. Data Analytics To Improve Visualization Data Analytics For Informed Decision Ppt PowerPoint can be your best option for delivering a presentation. Represent everything in detail using Data Analytics To Improve Visualization Data Analytics For Informed Decision Ppt PowerPoint and make yourself stand out in meetings. The template is versatile and follows a structure that will cater to your requirements. All the templates prepared by Slidegeeks are easy to download and edit. Our research experts have taken care of the corporate themes as well. So, give it a try and see the results. This slide represents the concise overview of the problem, the proposed solution, and the achieved result for using data analytics to improve visualization for US manufacturers. The problems were poor data performance, unmanageable reporting, etc.
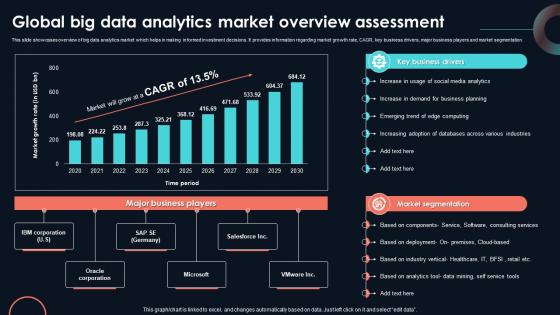
Global Big Data Analytics Market Developing Strategic Insights Using Big Data Analytics SS V
This slide showcases overview of big data analytics market which helps in making informed investment decisions. It provides information regarding market growth rate, CAGR, key business drivers, major business players and market segmentation. Slidegeeks has constructed Global Big Data Analytics Market Developing Strategic Insights Using Big Data Analytics SS V after conducting extensive research and examination. These presentation templates are constantly being generated and modified based on user preferences and critiques from editors. Here, you will find the most attractive templates for a range of purposes while taking into account ratings and remarks from users regarding the content. This is an excellent jumping-off point to explore our content and will give new users an insight into our top-notch PowerPoint Templates. This slide showcases overview of big data analytics market which helps in making informed investment decisions. It provides information regarding market growth rate, CAGR, key business drivers, major business players and market segmentation.
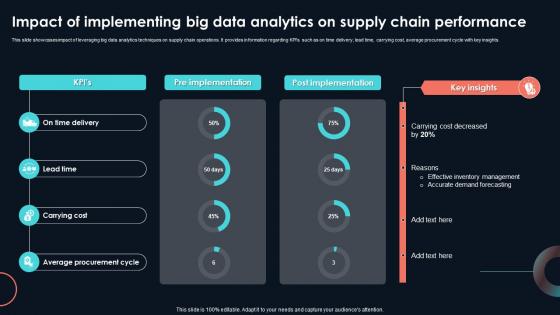
Impact Of Implementing Big Data Analytics On Developing Strategic Insights Using Big Data Analytics SS V
This slide showcases impact of leveraging big data analytics techniques on supply chain operations. It provides information regarding KPIs such as on time delivery, lead time, carrying cost, average procurement cycle with key insights. Boost your pitch with our creative Impact Of Implementing Big Data Analytics On Developing Strategic Insights Using Big Data Analytics SS V. Deliver an awe-inspiring pitch that will mesmerize everyone. Using these presentation templates you will surely catch everyones attention. You can browse the ppts collection on our website. We have researchers who are experts at creating the right content for the templates. So you do not have to invest time in any additional work. Just grab the template now and use them. This slide showcases impact of leveraging big data analytics techniques on supply chain operations. It provides information regarding KPIs such as on time delivery, lead time, carrying cost, average procurement cycle with key insights.
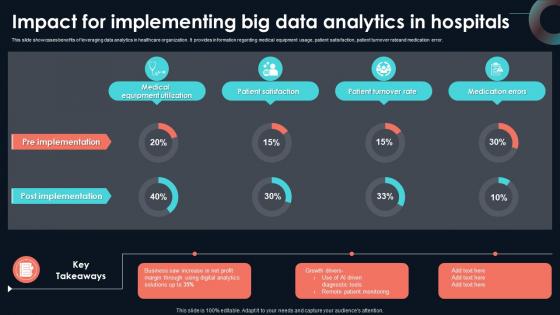
Impact For Implementing Big Data Analytics Developing Strategic Insights Using Big Data Analytics SS V
This slide showcases benefits of leveraging data analytics in healthcare organization. It provides information regarding medical equipment usage, patient satisfaction, patient turnover rateand medication error. Take your projects to the next level with our ultimate collection of Impact For Implementing Big Data Analytics Developing Strategic Insights Using Big Data Analytics SS V. Slidegeeks has designed a range of layouts that are perfect for representing task or activity duration, keeping track of all your deadlines at a glance. Tailor these designs to your exact needs and give them a truly corporate look with your own brand colors they will make your projects stand out from the rest This slide showcases benefits of leveraging data analytics in healthcare organization. It provides information regarding medical equipment usage, patient satisfaction, patient turnover rateand medication error.
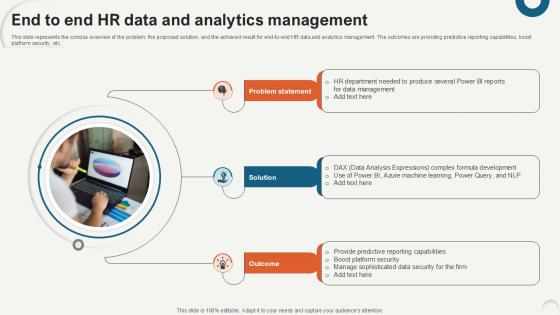
End To End HR Data And Analytics Data Analytics For Informed Decision Ppt Sample
This slide represents the concise overview of the problem, the proposed solution, and the achieved result for end-to-end HR data and analytics management. The outcomes are providing predictive reporting capabilities, boost platform security, etc. If you are looking for a format to display your unique thoughts, then the professionally designed End To End HR Data And Analytics Data Analytics For Informed Decision Ppt Sample is the one for you. You can use it as a Google Slides template or a PowerPoint template. Incorporate impressive visuals, symbols, images, and other charts. Modify or reorganize the text boxes as you desire. Experiment with shade schemes and font pairings. Alter, share or cooperate with other people on your work. Download End To End HR Data And Analytics Data Analytics For Informed Decision Ppt Sample and find out how to give a successful presentation. Present a perfect display to your team and make your presentation unforgettable. This slide represents the concise overview of the problem, the proposed solution, and the achieved result for end-to-end HR data and analytics management. The outcomes are providing predictive reporting capabilities, boost platform security, etc.
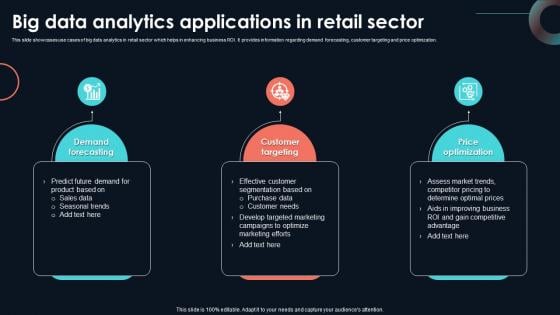
Big Data Analytics Applications In Retail Developing Strategic Insights Using Big Data Analytics SS V
This slide showcases use cases of big data analytics in retail sector which helps in enhancing business ROI. It provides information regarding demand forecasting, customer targeting and price optimization. Whether you have daily or monthly meetings, a brilliant presentation is necessary. Big Data Analytics Applications In Retail Developing Strategic Insights Using Big Data Analytics SS V can be your best option for delivering a presentation. Represent everything in detail using Big Data Analytics Applications In Retail Developing Strategic Insights Using Big Data Analytics SS V and make yourself stand out in meetings. The template is versatile and follows a structure that will cater to your requirements. All the templates prepared by Slidegeeks are easy to download and edit. Our research experts have taken care of the corporate themes as well. So, give it a try and see the results. This slide showcases use cases of big data analytics in retail sector which helps in enhancing business ROI. It provides information regarding demand forecasting, customer targeting and price optimization.
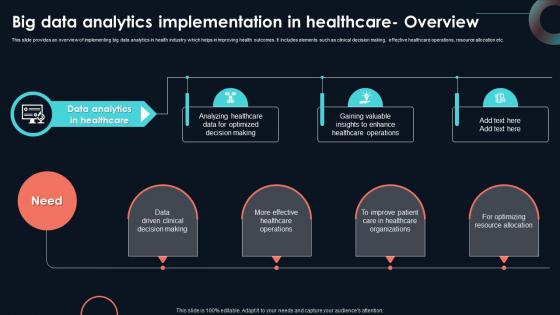
Big Data Analytics Implementation In Developing Strategic Insights Using Big Data Analytics SS V
This slide provides an overview of implementing big data analytics in health industry which helps in improving health outcomes. It includes elements such as clinical decision making, effective healthcare operations, resource allocation etc. If you are looking for a format to display your unique thoughts, then the professionally designed Big Data Analytics Implementation In Developing Strategic Insights Using Big Data Analytics SS V is the one for you. You can use it as a Google Slides template or a PowerPoint template. Incorporate impressive visuals, symbols, images, and other charts. Modify or reorganize the text boxes as you desire. Experiment with shade schemes and font pairings. Alter, share or cooperate with other people on your work. Download Big Data Analytics Implementation In Developing Strategic Insights Using Big Data Analytics SS V and find out how to give a successful presentation. Present a perfect display to your team and make your presentation unforgettable. This slide provides an overview of implementing big data analytics in health industry which helps in improving health outcomes. It includes elements such as clinical decision making, effective healthcare operations, resource allocation etc.
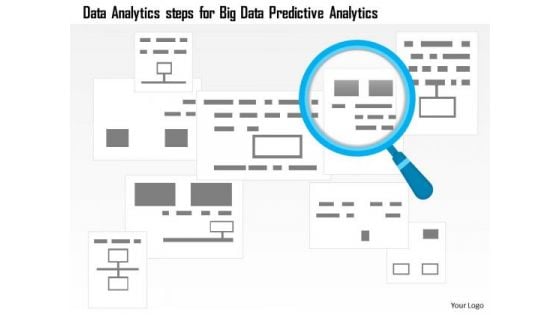
Business Diagram Data Analytics Steps For Big Data Predictive Analytics Ppt Slide
This power point template has been designed with graphic of magnifier over boxes. This slide contains the concept of predictive analytics of big data. This diagram can be used for data analytics related topics in any presentation.
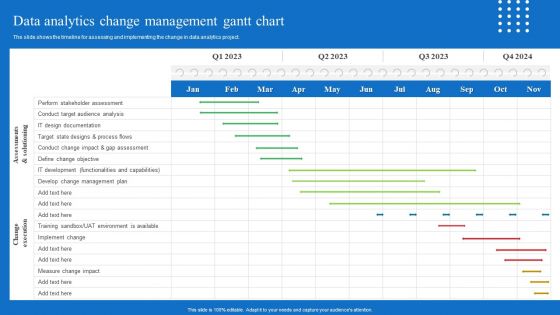
Toolkit For Data Science And Analytics Transition Data Analytics Change Management Gantt Chart Portrait PDF
The slide shows the timeline for assessing and implementing the change in data analytics project. Get a simple yet stunning designed Toolkit For Data Science And Analytics Transition Data Analytics Change Management Gantt Chart Portrait PDF It is the best one to establish the tone in your meetings. It is an excellent way to make your presentations highly effective. So, download this PPT today from Slidegeeks and see the positive impacts. Our easy to edit Toolkit For Data Science And Analytics Transition Data Analytics Change Management Gantt Chart Portrait PDF can be your go to option for all upcoming conferences and meetings. So, what are you waiting for Grab this template today.
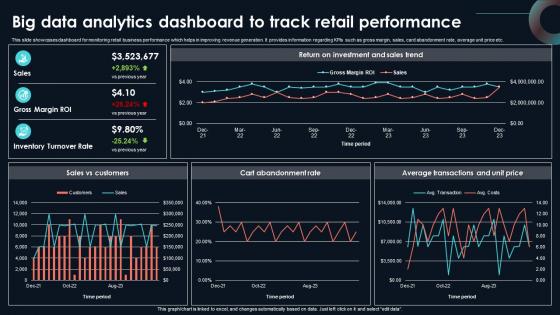
Big Data Analytics Dashboard To Track Developing Strategic Insights Using Big Data Analytics SS V
This slide showcases dashboard for monitoring retail business performance which helps in improving revenue generation. It provides information regarding KPIs such as gross margin, sales, card abandonment rate, average unit price etc. If your project calls for a presentation, then Slidegeeks is your go-to partner because we have professionally designed, easy-to-edit templates that are perfect for any presentation. After downloading, you can easily edit Big Data Analytics Dashboard To Track Developing Strategic Insights Using Big Data Analytics SS V and make the changes accordingly. You can rearrange slides or fill them with different images. Check out all the handy templates This slide showcases dashboard for monitoring retail business performance which helps in improving revenue generation. It provides information regarding KPIs such as gross margin, sales, card abandonment rate, average unit price etc.
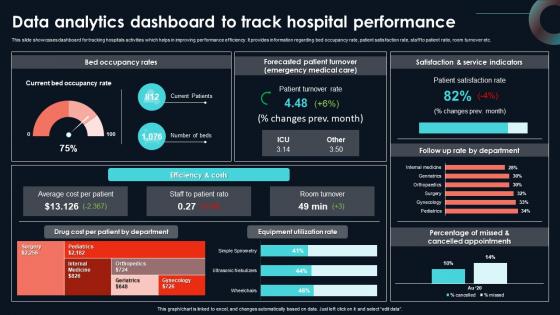
Data Analytics Dashboard To Track Hospital Developing Strategic Insights Using Big Data Analytics SS V
This slide showcases dashboard for tracking hospitals activities which helps in improving performance efficiency. It provides information regarding bed occupancy rate, patient satisfaction rate, staff to patient ratio, room turnover etc. The best PPT templates are a great way to save time, energy, and resources. Slidegeeks have 100 percent editable powerpoint slides making them incredibly versatile. With these quality presentation templates, you can create a captivating and memorable presentation by combining visually appealing slides and effectively communicating your message. Download Data Analytics Dashboard To Track Hospital Developing Strategic Insights Using Big Data Analytics SS V from Slidegeeks and deliver a wonderful presentation. This slide showcases dashboard for tracking hospitals activities which helps in improving performance efficiency. It provides information regarding bed occupancy rate, patient satisfaction rate, staff to patient ratio, room turnover etc.
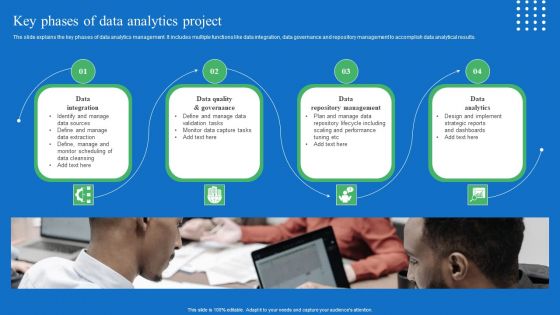
Toolkit For Data Science And Analytics Transition Key Phases Of Data Analytics Project Structure PDF
The slide explains the key phases of data analytics management. It includes multiple functions like data integration, data governance and repository management to accomplish data analytical results. Crafting an eye catching presentation has never been more straightforward. Let your presentation shine with this tasteful yet straightforward Toolkit For Data Science And Analytics Transition Key Phases Of Data Analytics Project Structure PDF template. It offers a minimalistic and classy look that is great for making a statement. The colors have been employed intelligently to add a bit of playfulness while still remaining professional. Construct the ideal Toolkit For Data Science And Analytics Transition Key Phases Of Data Analytics Project Structure PDF that effortlessly grabs the attention of your audience Begin now and be certain to wow your customers.

Toolkit For Data Science And Analytics Transition Data Analytics Value Stream Chain Pictures PDF
This slide illustrates the series of activities required for analyzing the data. It contains information such as data preparation, exploratory analysis, and predictive analytics etc. If you are looking for a format to display your unique thoughts, then the professionally designed Toolkit For Data Science And Analytics Transition Data Analytics Value Stream Chain Pictures PDF is the one for you. You can use it as a Google Slides template or a PowerPoint template. Incorporate impressive visuals, symbols, images, and other charts. Modify or reorganize the text boxes as you desire. Experiment with shade schemes and font pairings. Alter, share or cooperate with other people on your work. Download Toolkit For Data Science And Analytics Transition Data Analytics Value Stream Chain Pictures PDF and find out how to give a successful presentation. Present a perfect display to your team and make your presentation unforgettable.
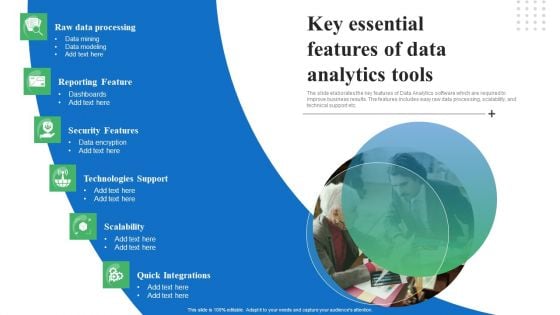
Toolkit For Data Science And Analytics Transition Key Essential Features Of Data Analytics Tools Elements PDF
The slide elaborates the key features of Data Analytics software which are required to improve business results. The features includes easy raw data processing, scalability, and technical support etc. Whether you have daily or monthly meetings, a brilliant presentation is necessary. Toolkit For Data Science And Analytics Transition Key Essential Features Of Data Analytics Tools Elements PDF can be your best option for delivering a presentation. Represent everything in detail using Toolkit For Data Science And Analytics Transition Key Essential Features Of Data Analytics Tools Elements PDF and make yourself stand out in meetings. The template is versatile and follows a structure that will cater to your requirements. All the templates prepared by Slidegeeks are easy to download and edit. Our research experts have taken care of the corporate themes as well. So, give it a try and see the results.
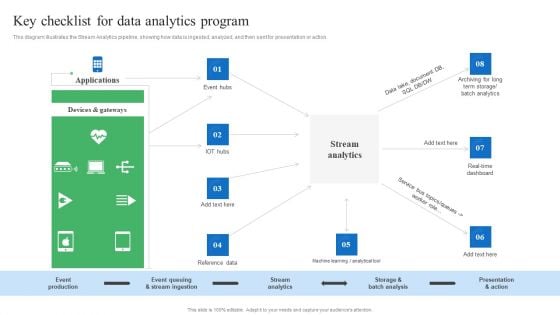
Toolkit For Data Science And Analytics Transition Key Checklist For Data Analytics Program Portrait PDF
This diagram illustrates the Stream Analytics pipeline, showing how data is ingested, analyzed, and then sent for presentation or action. Find highly impressive Toolkit For Data Science And Analytics Transition Key Checklist For Data Analytics Program Portrait PDF on Slidegeeks to deliver a meaningful presentation. You can save an ample amount of time using these presentation templates. No need to worry to prepare everything from scratch because Slidegeeks experts have already done a huge research and work for you. You need to download Toolkit For Data Science And Analytics Transition Key Checklist For Data Analytics Program Portrait PDF for your upcoming presentation. All the presentation templates are 100 percent editable and you can change the color and personalize the content accordingly. Download now.
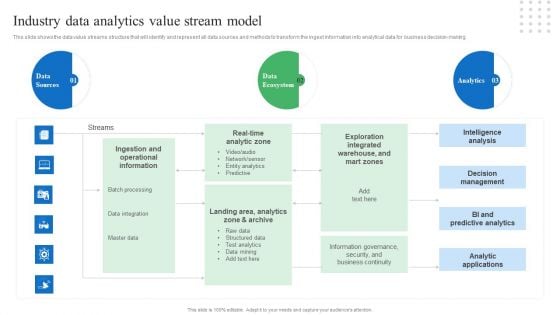
Toolkit For Data Science And Analytics Transition Industry Data Analytics Value Stream Model Brochure PDF
This slide shows the data value streams structure that will identify and represent all data sources and methods to transform the ingest information into analytical data for business decision-making. Whether you have daily or monthly meetings, a brilliant presentation is necessary. Toolkit For Data Science And Analytics Transition Industry Data Analytics Value Stream Model Brochure PDF can be your best option for delivering a presentation. Represent everything in detail using Toolkit For Data Science And Analytics Transition Industry Data Analytics Value Stream Model Brochure PDF and make yourself stand out in meetings. The template is versatile and follows a structure that will cater to your requirements. All the templates prepared by Slidegeeks are easy to download and edit. Our research experts have taken care of the corporate themes as well. So, give it a try and see the results.
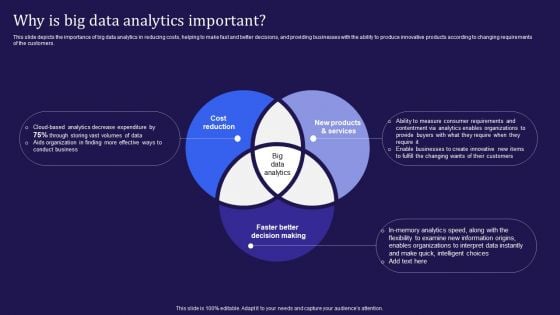
Big Data Analytics Lifecycle Why Is Big Data Analytics Important Ppt Summary Example Topics PDF
This slide depicts the importance of big data analytics in reducing costs, helping to make fast and better decisions, and providing businesses with the ability to produce innovative products according to changing requirements of the customers. Do you have an important presentation coming up Are you looking for something that will make your presentation stand out from the rest Look no further than Big Data Analytics Lifecycle Why Is Big Data Analytics Important Ppt Summary Example Topics PDF. With our professional designs, you can trust that your presentation will pop and make delivering it a smooth process. And with Slidegeeks, you can trust that your presentation will be unique and memorable. So why wait Grab Big Data Analytics Lifecycle Why Is Big Data Analytics Important Ppt Summary Example Topics PDF today and make your presentation stand out from the rest.
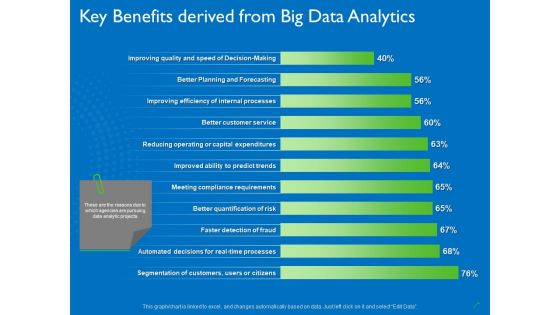
Transforming Big Data Analytics To Knowledge Key Benefits Derived From Big Data Analytics Introduction PDF
Deliver an awe inspiring pitch with this creative transforming big data analytics to knowledge key benefits derived from big data analytics introduction pdf bundle. Topics like service, processes, efficiency, planning, decision making can be discussed with this completely editable template. It is available for immediate download depending on the needs and requirements of the user.
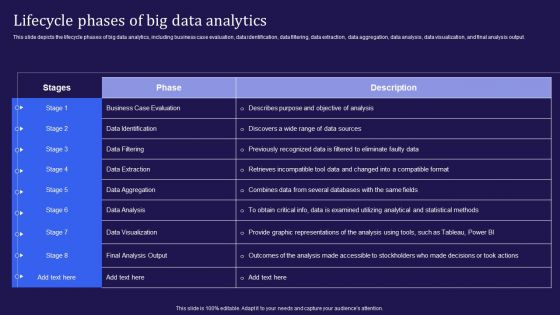
Big Data Analytics Lifecycle Lifecycle Phases Of Big Data Analytics Ppt Gallery Sample PDF
This slide depicts the lifecycle phases of big data analytics, including business case evaluation, data identification, data filtering, data extraction, data aggregation, data analysis, data visualization, and final analysis output. Slidegeeks is one of the best resources for PowerPoint templates. You can download easily and regulate Big Data Analytics Lifecycle Lifecycle Phases Of Big Data Analytics Ppt Gallery Sample PDF for your personal presentations from our wonderful collection. A few clicks is all it takes to discover and get the most relevant and appropriate templates. Use our Templates to add a unique zing and appeal to your presentation and meetings. All the slides are easy to edit and you can use them even for advertisement purposes.
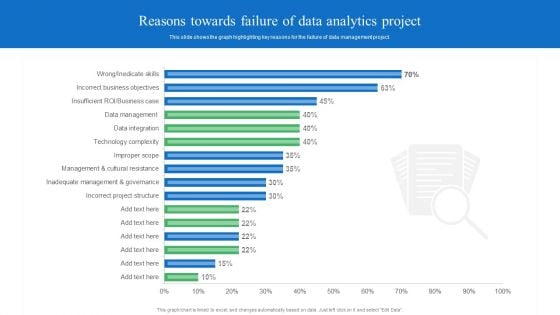
Toolkit For Data Science And Analytics Transition Reasons Towards Failure Of Data Analytics Project Background PDF
This slide shows the graph highlighting key reasons for the failure of data management project. If you are looking for a format to display your unique thoughts, then the professionally designed Toolkit For Data Science And Analytics Transition Reasons Towards Failure Of Data Analytics Project Background PDF is the one for you. You can use it as a Google Slides template or a PowerPoint template. Incorporate impressive visuals, symbols, images, and other charts. Modify or reorganize the text boxes as you desire. Experiment with shade schemes and font pairings. Alter, share or cooperate with other people on your work. Download Toolkit For Data Science And Analytics Transition Reasons Towards Failure Of Data Analytics Project Background PDF and find out how to give a successful presentation. Present a perfect display to your team and make your presentation unforgettable.
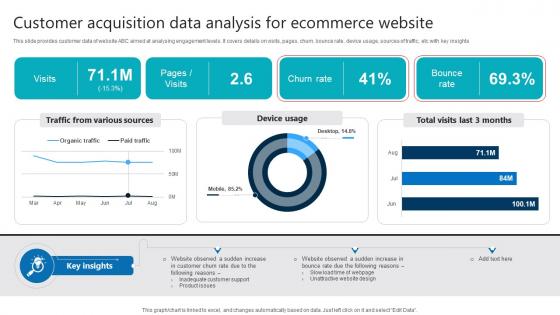
Customer Acquisition Data Analysis For Ecommerce Website Product Analytics Implementation Data Analytics V
This slide provides customer data of website ABC aimed at analysing engagement levels. It covers details on visits, pages, churn, bounce rate, device usage, sources of traffic, etc with key insights If you are looking for a format to display your unique thoughts, then the professionally designed Customer Acquisition Data Analysis For Ecommerce Website Product Analytics Implementation Data Analytics V is the one for you. You can use it as a Google Slides template or a PowerPoint template. Incorporate impressive visuals, symbols, images, and other charts. Modify or reorganize the text boxes as you desire. Experiment with shade schemes and font pairings. Alter, share or cooperate with other people on your work. Download Customer Acquisition Data Analysis For Ecommerce Website Product Analytics Implementation Data Analytics V and find out how to give a successful presentation. Present a perfect display to your team and make your presentation unforgettable. This slide provides customer data of website ABC aimed at analysing engagement levels. It covers details on visits, pages, churn, bounce rate, device usage, sources of traffic, etc with key insights
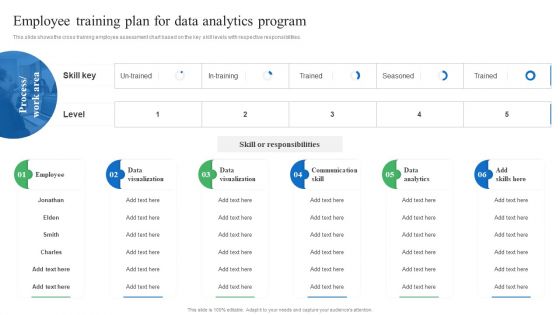
Toolkit For Data Science And Analytics Transition Employee Training Plan For Data Analytics Program Microsoft PDF
This slide shows the cross training employee assessment chart based on the key skill levels with respective responsibilities. Do you have an important presentation coming up Are you looking for something that will make your presentation stand out from the rest Look no further than Toolkit For Data Science And Analytics Transition Employee Training Plan For Data Analytics Program Microsoft PDF. With our professional designs, you can trust that your presentation will pop and make delivering it a smooth process. And with Slidegeeks, you can trust that your presentation will be unique and memorable. So why wait Grab Toolkit For Data Science And Analytics Transition Employee Training Plan For Data Analytics Program Microsoft PDF today and make your presentation stand out from the rest.
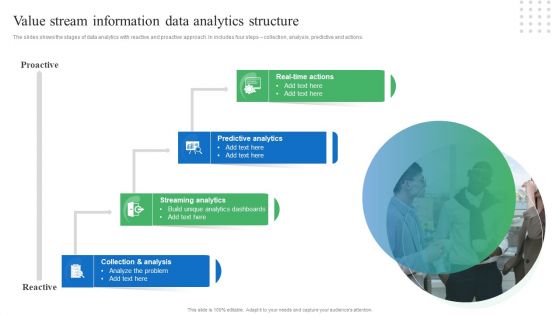
Toolkit For Data Science And Analytics Transition Value Stream Information Data Analytics Structure Sample PDF
The slides shows the stages of data analytics with reactive and proactive approach. In includes four steps collection, analysis, predictive and actions. Retrieve professionally designed Toolkit For Data Science And Analytics Transition Value Stream Information Data Analytics Structure Sample PDF to effectively convey your message and captivate your listeners. Save time by selecting pre made slideshows that are appropriate for various topics, from business to educational purposes. These themes come in many different styles, from creative to corporate, and all of them are easily adjustable and can be edited quickly. Access them as PowerPoint templates or as Google Slides themes. You do not have to go on a hunt for the perfect presentation because Slidegeeks got you covered from everywhere.
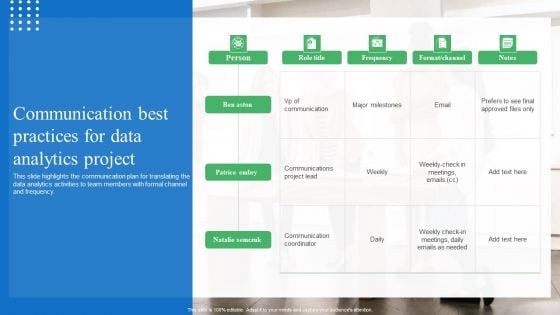
Toolkit For Data Science And Analytics Transition Communication Best Practices For Data Analytics Project Summary PDF
This slide highlights the communication plan for translating the data analytics activities to team members with formal channel and frequency. Do you know about Slidesgeeks Toolkit For Data Science And Analytics Transition Communication Best Practices For Data Analytics Project Summary PDF These are perfect for delivering any kind od presentation. Using it, create PowerPoint presentations that communicate your ideas and engage audiences. Save time and effort by using our pre designed presentation templates that are perfect for a wide range of topic. Our vast selection of designs covers a range of styles, from creative to business, and are all highly customizable and easy to edit. Download as a PowerPoint template or use them as Google Slides themes.
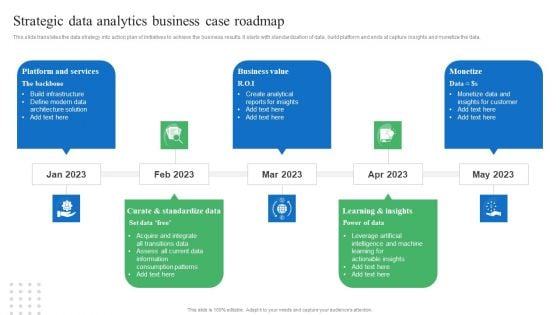
Toolkit For Data Science And Analytics Transition Strategic Data Analytics Business Case Roadmap Themes PDF
This slide translates the data strategy into action plan of initiatives to achieve the business results. It starts with standardization of data, build platform and ends at capture insights and monetize the data. Are you in need of a template that can accommodate all of your creative concepts This one is crafted professionally and can be altered to fit any style. Use it with Google Slides or PowerPoint. Include striking photographs, symbols, depictions, and other visuals. Fill, move around, or remove text boxes as desired. Test out color palettes and font mixtures. Edit and save your work, or work with colleagues. Download Toolkit For Data Science And Analytics Transition Strategic Data Analytics Business Case Roadmap Themes PDF and observe how to make your presentation outstanding. Give an impeccable presentation to your group and make your presentation unforgettable.
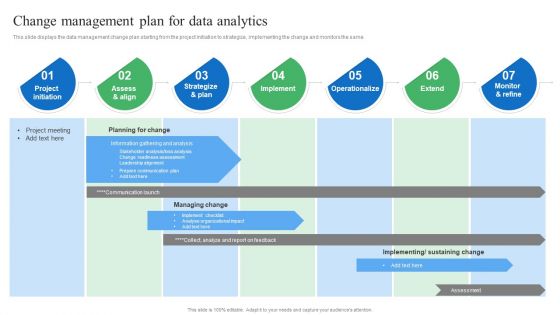
Toolkit For Data Science And Analytics Transition Change Management Plan For Data Analytics Structure PDF
This slide displays the data management change plan starting from the project initiation to strategize, implementing the change and monitors the same. Do you know about Slidesgeeks Toolkit For Data Science And Analytics Transition Change Management Plan For Data Analytics Structure PDF These are perfect for delivering any kind od presentation. Using it, create PowerPoint presentations that communicate your ideas and engage audiences. Save time and effort by using our pre designed presentation templates that are perfect for a wide range of topic. Our vast selection of designs covers a range of styles, from creative to business, and are all highly customizable and easy to edit. Download as a PowerPoint template or use them as Google Slides themes.
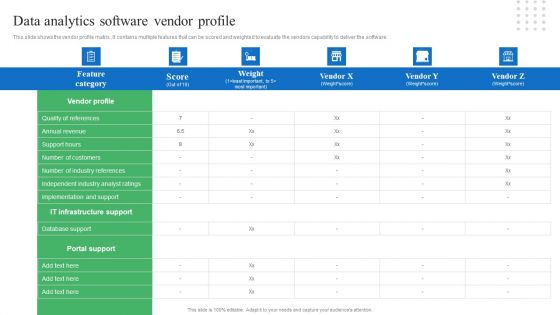
Toolkit For Data Science And Analytics Transition Data Analytics Software Vendor Profile Themes PDF
This slide shows the vendor profile matrix. It contains multiple features that can be scored and weighted to evaluate the vendors capability to deliver the software. Slidegeeks is here to make your presentations a breeze with Toolkit For Data Science And Analytics Transition Data Analytics Software Vendor Profile Themes PDF With our easy to use and customizable templates, you can focus on delivering your ideas rather than worrying about formatting. With a variety of designs to choose from, you are sure to find one that suits your needs. And with animations and unique photos, illustrations, and fonts, you can make your presentation pop. So whether you are giving a sales pitch or presenting to the board, make sure to check out Slidegeeks first.
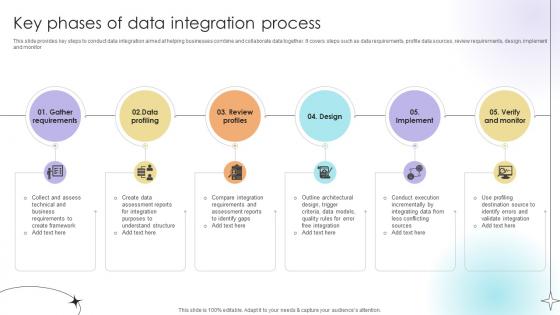
Key Phases Of Data Integration Process Data Analytics SS V
This slide provides key steps to conduct data integration aimed at helping businesses combine and collaborate data together. It covers steps such as data requirements, profile data sources, review requirements, design, implement and monitor.Slidegeeks is here to make your presentations a breeze with Key Phases Of Data Integration Process Data Analytics SS V With our easy-to-use and customizable templates, you can focus on delivering your ideas rather than worrying about formatting. With a variety of designs to choose from, you are sure to find one that suits your needs. And with animations and unique photos, illustrations, and fonts, you can make your presentation pop. So whether you are giving a sales pitch or presenting to the board, make sure to check out Slidegeeks first This slide provides key steps to conduct data integration aimed at helping businesses combine and collaborate data together. It covers steps such as data requirements, profile data sources, review requirements, design, implement and monitor.
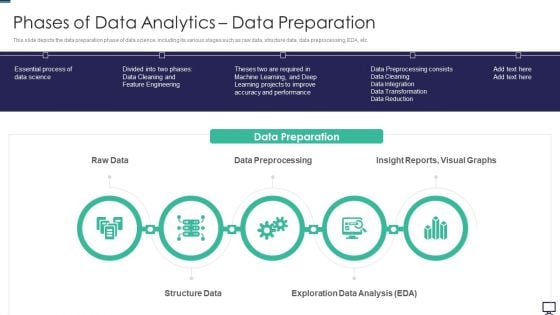
Phases Of Data Analytics Data Preparation Ppt Summary Clipart PDF
This slide depicts the data preparation phase of data science, including its various stages such as raw data, structure data, data preprocessing, EDA, etc. Presenting phases of data analytics data preparation ppt summary clipart pdf to provide visual cues and insights. Share and navigate important information on five stages that need your due attention. This template can be used to pitch topics like data preprocessing, structure data, exploration data analysis. In addtion, this PPT design contains high resolution images, graphics, etc, that are easily editable and available for immediate download.
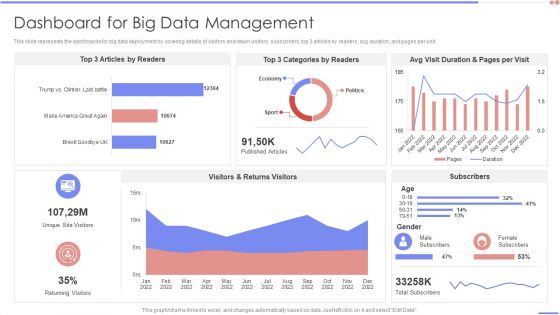
Data Analytics Management Dashboard For Big Data Management Background PDF
This slide represents the dashboards for big data deployment by covering details of visitors and return visitors, subscribers, top 3 articles by readers, avg duration, and pages per visit. Deliver and pitch your topic in the best possible manner with this Data Analytics Management Dashboard For Big Data Management Background PDF. Use them to share invaluable insights on Article Readers, Categories Readers, Duration Pages and impress your audience. This template can be altered and modified as per your expectations. So, grab it now.
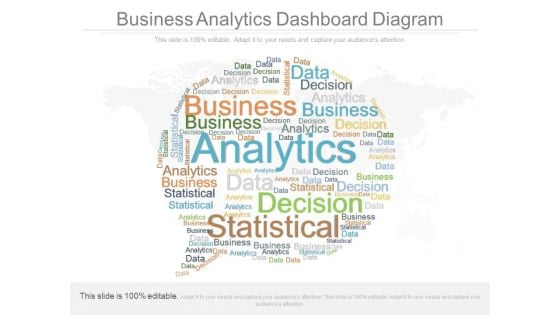
Business Analytics Dashboard Diagram
This is a business analytics dashboard diagram. This is a one stage process. The stages in this process are analytics, decision, data, business, statistics.
Icons Slide For Predictive Analytics In The Age Of Big Data Inspiration PDF
Introducing our well designed Icons Slide For Predictive Analytics In The Age Of Big Data Inspiration PDF set of slides. The slide displays editable icons to enhance your visual presentation. The icons can be edited easily. So customize according to your business to achieve a creative edge. Download and share it with your audience.
Timeline For Predictive Analytics Model Predictive Analytics For Improved Icons Pdf
This slide depicts the roadmap for predictive analytics model development, including describing the project, information collection, information analysis, statistics, modeling, implementation of the model, and model monitoring. Get a simple yet stunning designed Timeline For Predictive Analytics Model Predictive Analytics For Improved Icons Pdf. It is the best one to establish the tone in your meetings. It is an excellent way to make your presentations highly effective. So, download this PPT today from Slidegeeks and see the positive impacts. Our easy-to-edit Timeline For Predictive Analytics Model Predictive Analytics For Improved Icons Pdf can be your go-to option for all upcoming conferences and meetings. So, what are you waiting for Grab this template today. This slide depicts the roadmap for predictive analytics model development, including describing the project, information collection, information analysis, statistics, modeling, implementation of the model, and model monitoring.
Predictive Analytics For Empowering Predictive Analytics Vs Machine Learning Icons Pdf
This slide represents the comparison between predictive analytics and machine learning based on technology used and built on, the functionality of the model, and requirements for the development of the models. Here you can discover an assortment of the finest PowerPoint and Google Slides templates. With these templates, you can create presentations for a variety of purposes while simultaneously providing your audience with an eye-catching visual experience. Download Predictive Analytics For Empowering Predictive Analytics Vs Machine Learning Icons Pdf to deliver an impeccable presentation. These templates will make your job of preparing presentations much quicker, yet still, maintain a high level of quality. Slidegeeks has experienced researchers who prepare these templates and write high-quality content for you. Later on, you can personalize the content by editing the Predictive Analytics For Empowering Predictive Analytics Vs Machine Learning Icons Pdf This slide represents the comparison between predictive analytics and machine learning based on technology used and built on, the functionality of the model, and requirements for the development of the models.
Information Analytics And Ml Strategy Playbook How To Overcome Search Driven Analytics Barriers Icons PDF
This template depicts that intuitive search driven analytics gives users an easy way to ask questions, receive suggestions on what to query, and visualize their data. Deliver and pitch your topic in the best possible manner with this Information Analytics And Ml Strategy Playbook How To Overcome Search Driven Analytics Barriers Icons PDF. Use them to share invaluable insights on Analytics Systems, Revenue and impress your audience. This template can be altered and modified as per your expectations. So, grab it now.
Optimizing Marketing Analytics To Enhance Organizational Growth Introduction To Blogging Analytics Icons PDF
This slide covers an overview of blog analytics to identify key factors for creating successful blogs. It also includes benefits of business blogging analytics such as helping drive traffic to your website, repurposing blog content for social media, converting traffic into leads. This Optimizing Marketing Analytics To Enhance Organizational Growth Introduction To Blogging Analytics Icons PDF is perfect for any presentation, be it in front of clients or colleagues. It is a versatile and stylish solution for organizing your meetings. The Optimizing Marketing Analytics To Enhance Organizational Growth Introduction To Blogging Analytics Icons PDF features a modern design for your presentation meetings. The adjustable and customizable slides provide unlimited possibilities for acing up your presentation. Slidegeeks has done all the homework before launching the product for you. So, do not wait, grab the presentation templates today.
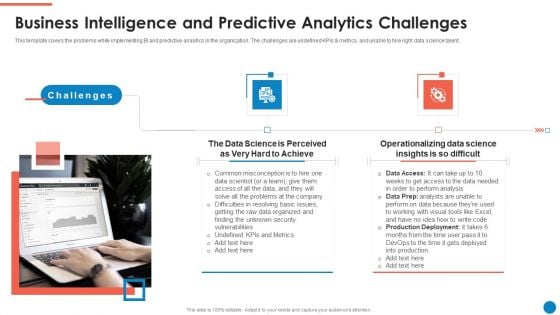
Data And Analytics Playbook Business Intelligence And Predictive Analytics Challenges Template PDF
This template covers the problems while implementing BI and predictive analytics in the organization. The challenges are undefined KPIs and metrics, and unable to hire right data science talent. Presenting Data And Analytics Playbook Business Intelligence And Predictive Analytics Challenges Template PDF to provide visual cues and insights. Share and navigate important information on two stages that need your due attention. This template can be used to pitch topics like Challenges, Data Science, Operationalizing Data Science. In addtion, this PPT design contains high resolution images, graphics, etc, that are easily editable and available for immediate download.
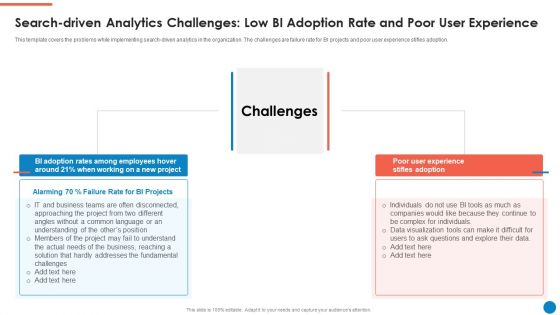
Data And Analytics Playbook Search Driven Analytics Challenges Low Bi Adoption Rate Brochure PDF
This template covers the problems while implementing search-driven analytics in the organization. The challenges are failure rate for BI projects and poor user experience stifles adoption. This is a Data And Analytics Playbook Search Driven Analytics Challenges Low Bi Adoption Rate Brochure PDF template with various stages. Focus and dispense information on two stages using this creative set, that comes with editable features. It contains large content boxes to add your information on topics like Challenges, Poor User Experience, Stifles Adoption, Employees, Project. You can also showcase facts, figures, and other relevant content using this PPT layout. Grab it now.
Comparing Future Analytics Based Marketing With Other Trends Icons Pdf
This slide shows comparison of future data driven marketing size with other trends such as digital marketing and influencer marketing. It include key insights, future market size of various marketing trends etc.Pitch your topic with ease and precision using this Comparing Future Analytics Based Marketing With Other Trends Icons Pdf This layout presents information on Influencer Marketing, Digital Marketing, Data Driven Marketing It is also available for immediate download and adjustment. So, changes can be made in the color, design, graphics or any other component to create a unique layout. This slide shows comparison of future data driven marketing size with other trends such as digital marketing and influencer marketing. It include key insights, future market size of various marketing trends etc.
Icons Slide For Information Analytics Company Outline Rules PDF
Introducing our well designed Icons Slide For Information Analytics Company Outline Rules PDF set of slides. The slide displays editable icons to enhance your visual presentation. The icons can be edited easily. So customize according to your business to achieve a creative edge. Download and share it with your audience.
Strategic Promotion Plan Implementation Analytics Dashboard Icons PDF
This slide illustrates graphical representation of implementation data of promotional strategy. It includes sales revenue, ad expenditure, profit etc. Showcasing this set of slides titled Strategic Promotion Plan Implementation Analytics Dashboard Icons PDF. The topics addressed in these templates are Profit, Sales Revenue, Expenditure. All the content presented in this PPT design is completely editable. Download it and make adjustments in color, background, font etc. as per your unique business setting.
Icons Slide For Predictive Analytics Methods Themes PDF
Presenting our innovatively structured Icons Slide For Predictive Analytics Methods Themes PDF set of slides. The slides contain a hundred percent editable icons. You can replace these icons without any inconvenience. Therefore, pick this set of slides and create a striking presentation.
Projection Model Uses Of Predictive Analytics Credit Icons PDF
This slide describes the usage of predictive analytics in banking and other financial institutions for credit purposes. It is used to calculate the credit score of a person or organization and to ensure that borrower does not fail to return the loan. Crafting an eye-catching presentation has never been more straightforward. Let your presentation shine with this tasteful yet straightforward Projection Model Uses Of Predictive Analytics Credit Icons PDF template. It offers a minimalistic and classy look that is great for making a statement. The colors have been employed intelligently to add a bit of playfulness while still remaining professional. Construct the ideal Projection Model Uses Of Predictive Analytics Credit Icons PDF that effortlessly grabs the attention of your audience Begin now and be certain to wow your customers


 Continue with Email

 Home
Home


