Data Analytics Icons
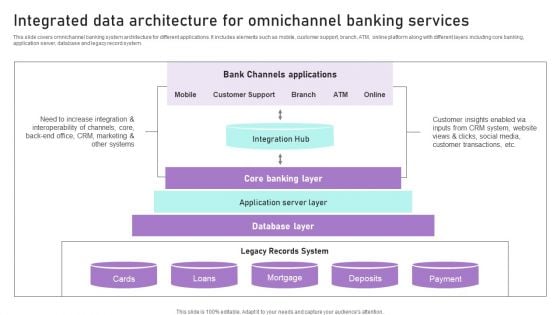
Integrated Data Architecture For Omnichannel Banking Services Ppt Icon Topics PDF
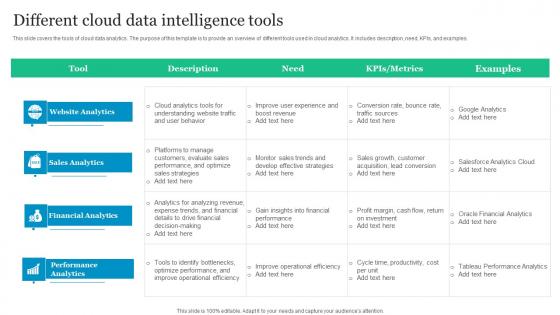
Different Cloud Data Intelligence Tools Themes Pdf
This slide covers the tools of cloud data analytics. The purpose of this template is to provide an overview of different tools used in cloud analytics. It includes description, need, KPIs, and examples. Showcasing this set of slides titled Different Cloud Data Intelligence Tools Themes Pdf. The topics addressed in these templates are Website Analytics, Sales Analytics, Financial Analytics. All the content presented in this PPT design is completely editable. Download it and make adjustments in color, background, font etc. as per your unique business setting. This slide covers the tools of cloud data analytics. The purpose of this template is to provide an overview of different tools used in cloud analytics. It includes description, need, KPIs, and examples.
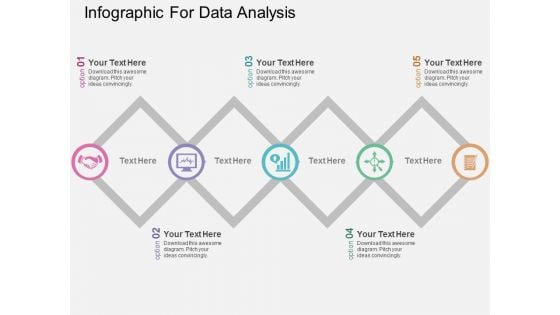
Infographic For Data Analysis Powerpoint Templates
This PowerPoint slide has been designed with process infographic. This PPT diagram may be used to display evaluation of business process. This diagram slide can be used to make impressive presentations.
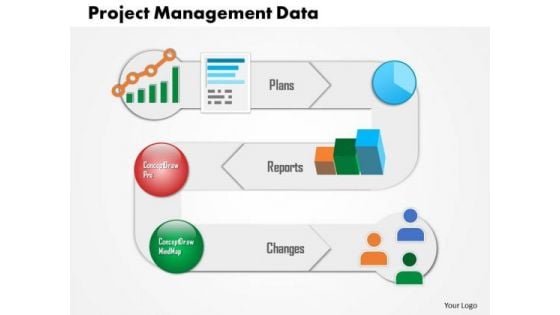
Business Framework Project Management Data PowerPoint Presentation
This diagram displays push pull communication framework. This diagram may used to displays push pull strategy. Use this diagram in business presentations. This diagram will enhance the quality of your presentations.
Business Diagram Globe With Colorful Arrows And Icons Presentation Template
This business diagram has been designed with graphic of globe with arrow and icons. Use our diagram slide to organize data and to display data analysis. This diagram is suitable for global business and marketing related presentations.
Three Text Boxes With Percentage Values And Icons Powerpoint Slides
This PowerPoint template has been designed with text boxes and percentage data. You may download this PPT slide to display data comparison and analysis. Add this slide to your presentation and impress your superiors.
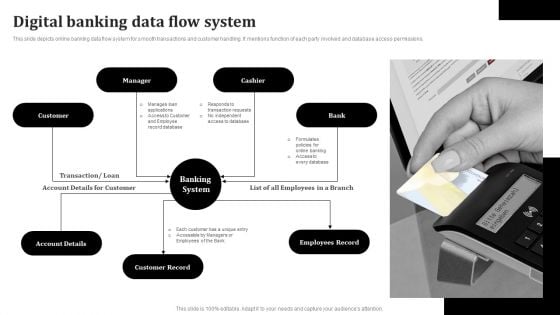
Digital Banking Data Flow System Template PDF
This slide depicts online banking data flow system for smooth transactions and customer handling. It mentions function of each party involved and database access permissions. Persuade your audience using this Digital Banking For Financial Management Icon Information PDF. This PPT design covers Seven stages, thus making it a great tool to use. It also caters to a variety of topics including Manager, Cashier, Banking System, Employees Record. Download this PPT design now to present a convincing pitch that not only emphasizes the topic but also showcases your presentation skills.
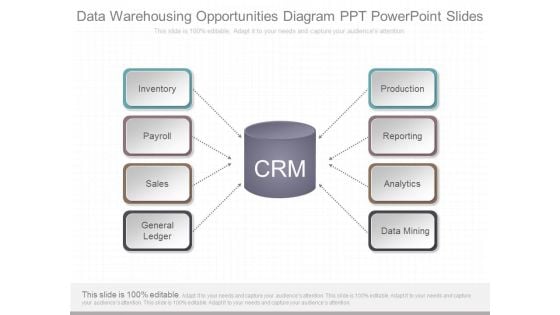
Data Warehousing Opportunities Diagram Ppt Powerpoint Slides
This is a data warehousing opportunities diagram ppt powerpoint slides. This is a eight stage process. The stages in this process are inventory, payroll, sales, ledger general, production, reporting, analytics, data mining.
Magnifying Glass Ppt PowerPoint Presentation Infographic Template Icons
This is a magnifying glass ppt powerpoint presentation infographic template icons. This is a four stage process. The stages in this process are business, marketing, strategy, magnify, technology.
Magnifying Glass Management Ppt PowerPoint Presentation Infographics Icons
This is a magnifying glass management ppt powerpoint presentation infographics icons. This is a three stage process. The stages in this process are magnifying glass, research, marketing, strategy, business.
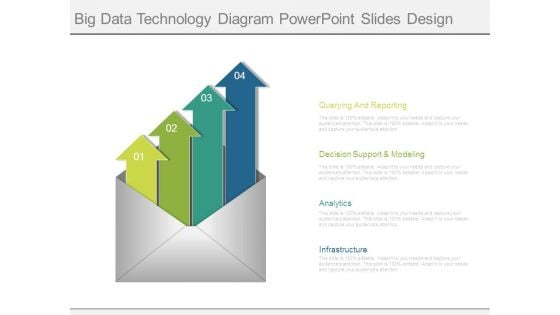
Big Data Technology Diagram Powerpoint Slides Design
This is a big data technology diagram powerpoint slides design. This is a four stage process. The stages in this process are querying and reporting, decision support and modeling, analytics, infrastructure.
Strategies To Improve Stock Inventory Management Icons PDF
This slide covers strategies to improve stock inventory management for optimum utilization of resources with regular auditing of supply chain system. It include strategies supply chain monitoring, data analytics, effective use of technologies, supply chain improvement. Pitch your topic with ease and precision using this Strategies To Improve Stock Inventory Management Icons PDF. This layout presents information on Data Analysis, Supply Chain Monitoring, Supply Chain Improvement. It is also available for immediate download and adjustment. So, changes can be made in the color, design, graphics or any other component to create a unique layout.
Ways To Efficiently Analyse And Gather Survey Analysis Icons PDF
This slide shows the four effective ways through which the insights gathered from the survey could be efficiently analysed. It includes ways like insurance of sufficient sample size, statistical significance, focus on insights rather than data and complement with other data types. Presenting Ways To Efficiently Analyse And Gather Survey Analysis Icons PDF to dispense important information. This template comprises four stages. It also presents valuable insights into the topics including Accuracy Determination, Survey Results, Merely Data. This is a completely customizable PowerPoint theme that can be put to use immediately. So, download it and address the topic impactfully.
Emerging Technology Trends For Business Growth Icons Pdf
The following slide showcases various emerging trends of technology that plays crucial role in business growth and success. It showcases trends such as cloud computing, data analytics, artificial intelligence, internet of things and cyber security. Do you know about Slidesgeeks Emerging Technology Trends For Business Growth Icons Pdf These are perfect for delivering any kind od presentation. Using it, create PowerPoint presentations that communicate your ideas and engage audiences. Save time and effort by using our pre-designed presentation templates that are perfect for a wide range of topic. Our vast selection of designs covers a range of styles, from creative to business, and are all highly customizable and easy to edit. Download as a PowerPoint template or use them as Google Slides themes. The following slide showcases various emerging trends of technology that plays crucial role in business growth and success. It showcases trends such as cloud computing, data analytics, artificial intelligence, internet of things and cyber security.
Technology Enhancements Quantum Computers Ppt PowerPoint Presentation Summary Icons
Presenting this set of slides with name technology enhancements quantum computers ppt powerpoint presentation summary icons. This is a seven stage process. The stages in this process are generation technology, big data analytics, technology. This is a completely editable PowerPoint presentation and is available for immediate download. Download now and impress your audience.
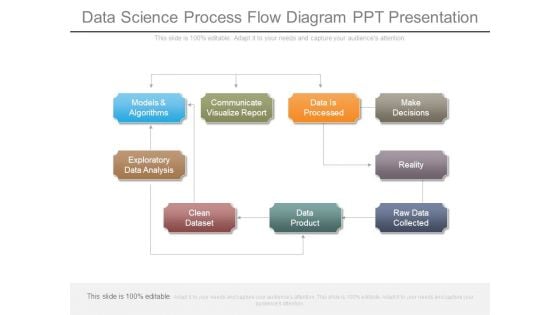
Data Science Process Flow Diagram Ppt Presentation
This is a data science process flow diagram ppt presentation. This is a nine stage process. The stages in this process are models and algorithms, communicate visualize report, data is processed, make decisions, exploratory data analysis, clean dataset, data product, raw data collected, reality.
Offshore Vs Outsourced Call Center Comparative Analysis Icons Pdf
The following slide highlights points like labor cost, service quality, communication, data security, time zone and customer feedback to show offshore vs onshore call center comparative analysis. It helps organization to make informed decision between offshore and onshore call center outsourcing based on important factors. Pitch your topic with ease and precision using this Offshore Vs Outsourced Call Center Comparative Analysis Icons Pdf. This layout presents information on Service Quality, Communication, Data Security, Customer Feedback. It is also available for immediate download and adjustment. So, changes can be made in the color, design, graphics or any other component to create a unique layout. The following slide highlights points like labor cost, service quality, communication, data security, time zone and customer feedback to show offshore vs onshore call center comparative analysis. It helps organization to make informed decision between offshore and onshore call center outsourcing based on important factors.
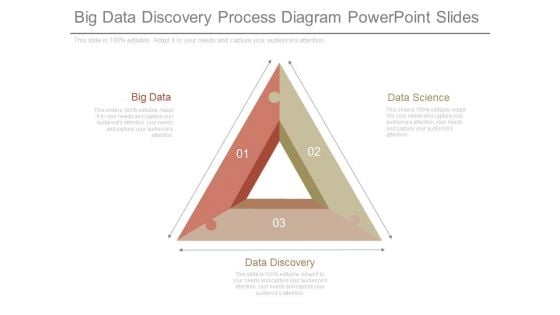
Big Data Discovery Process Diagram Powerpoint Slides
This is a big data discovery process diagram powerpoint slides. This is a three stage process. The stages in this process are big data, data science, data discovery.

Quantitative Data Analysis Methods Diagram Powerpoint Slide
This is a quantitative data analysis methods diagram powerpoint slide. This is a three stage process. The stages in this process are organizing data, presenting data, data analysis.
Business Diagram Icons And Charts For Business Growth Presentation Template
Our above slide contains graphics of business charts and icons. It helps to display business reports and analysis. Use this diagram to impart more clarity to data and to create more sound impact on viewers.
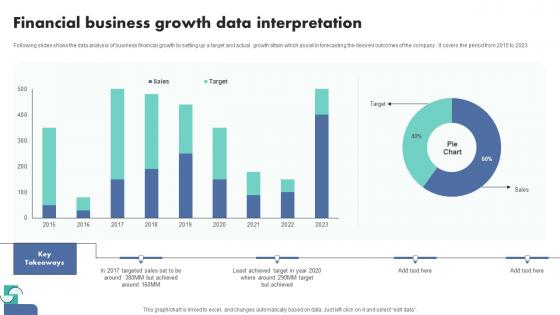
Financial Business Growth Data Interpretation Themes Pdf
Following slides shows the data analysis of business financial growth by setting up a target and actual growth attain which assist in forecasting the desired outcomes of the company . It covers the period from 2015 to 2023.Pitch your topic with ease and precision using this Financial Business Growth Data Interpretation Themes Pdf This layout presents information on Financial Business, Growth Data Interpretation It is also available for immediate download and adjustment. So, changes can be made in the color, design, graphics or any other component to create a unique layout. Following slides shows the data analysis of business financial growth by setting up a target and actual growth attain which assist in forecasting the desired outcomes of the company . It covers the period from 2015 to 2023.
Battery Icons For Business Growth Levels Powerpoint Template
Levels of business growth can be displayed with this diagram. This PowerPoint template contains graphics of seven battery icons. You can use this design for data analysis in business presentations
Four Circles Venn Diagram With Icons Powerpoint Slides
Four circles Venn diagram has been used to design this power point template. This PPT helps to portray the concept of business data analysis. Use this PPT for your business and marketing related presentations.
Two Circles Venn Diagram With Icons Powerpoint Slides
Venn diagram of two circles has been used to design this power point template. This PPT helps to portray the concept of business data analysis. Use this PPT for your business and marketing related presentations.
Six Staged Infographics Square With Business Icons Powerpoint Templates
This business diagram displays circular puzzle infographic. This editable slide is suitable to present global communication. Use this diagram for business and finance related topics and display complete data analysis in your presentation.
Different Techniques To Improve Customer Experience Ppt Inspiration Icons PDF
This slide focuses on techniques to improve customer experience which includes robotic process automation, data analytics, emotion analytics, voice capabilities, augmented reality, etc. Make sure to capture your audiences attention in your business displays with our gratis customizable Different Techniques To Improve Customer Experience Ppt Inspiration Icons PDF. These are great for business strategies, office conferences, capital raising or task suggestions. If you desire to acquire more customers for your tech business and ensure they stay satisfied, create your own sales presentation with these plain slides.
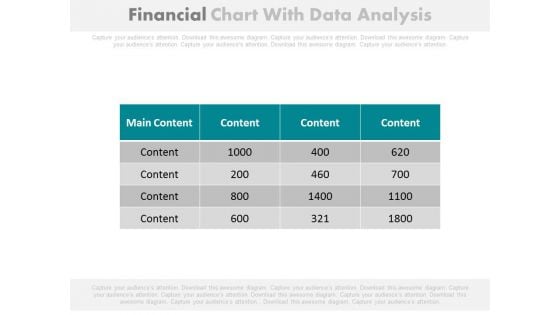
Financial Figures Data Analysis Report Powerpoint Slides
Our above PowerPoint template contains table chart with financial figures. This professional slide may be used to display data analysis report. Enlighten your audience with your breathtaking ideas.
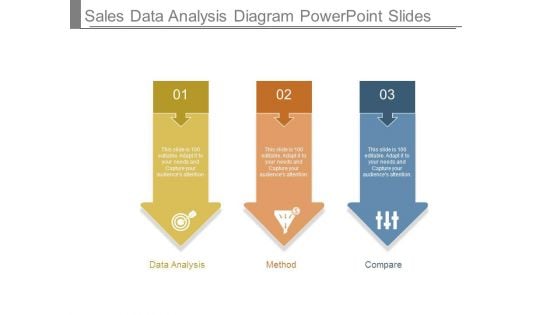
Sales Data Analysis Diagram Powerpoint Slides
This is a sales data analysis diagram powerpoint slides. This is a three stage process. The stages in this process are data analysis, method, compare.
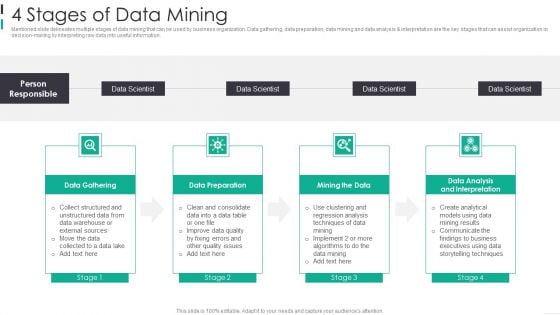
4 Stages Of Data Mining Infographics PDF
Mentioned slide delineates multiple stages of data mining that can be used by business organization. Data gathering, data preparation, data mining and data analysis and interpretation are the key stages that can assist organization in decision-making by interpreting raw data into useful information. Presenting 4 Stages Of Data Mining Infographics PDF to dispense important information. This template comprises four stages. It also presents valuable insights into the topics including Data Gathering, Data Preparation, Mining The Data This is a completely customizable PowerPoint theme that can be put to use immediately. So, download it and address the topic impactfully.
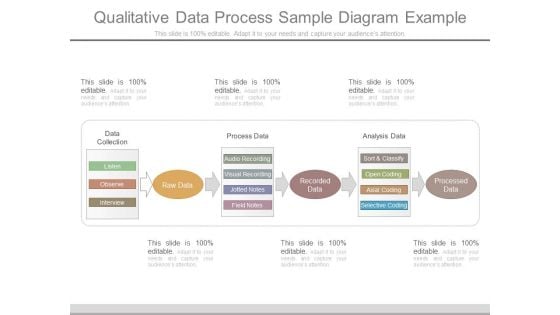
Qualitative Data Process Sample Diagram Example
This is a qualitative data process sample diagram example. This is a three stage process. The stages in this process are data collection, process data, analysis data, listen, observe, interview, audio recording, visual recording, jotted notes, field notes, sort and classify, open coding, axial coding, selective coding, processed data.
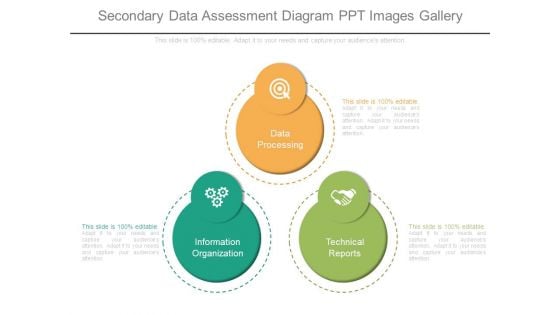
Secondary Data Assessment Diagram Ppt Images Gallery
This is a secondary data assessment diagram ppt images gallery. This is a three stage process. The stages in this process are data processing, information organization, technical reports.
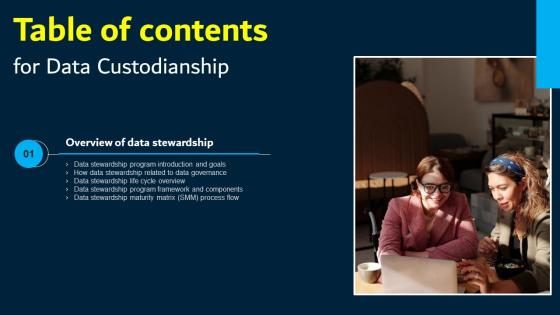
Data Custodianship Table Of Contents Portrait Pdf
Are you searching for a Data Custodianship Table Of Contents Portrait Pdf that is uncluttered, straightforward, and original Its easy to edit, and you can change the colors to suit your personal or business branding. For a presentation that expresses how much effort you have put in, this template is ideal With all of its features, including tables, diagrams, statistics, and lists, its perfect for a business plan presentation. Make your ideas more appealing with these professional slides. Download Data Custodianship Table Of Contents Portrait Pdf from Slidegeeks today. Our Data Custodianship Table Of Contents Portrait Pdf are topically designed to provide an attractive backdrop to any subject. Use them to look like a presentation pro.
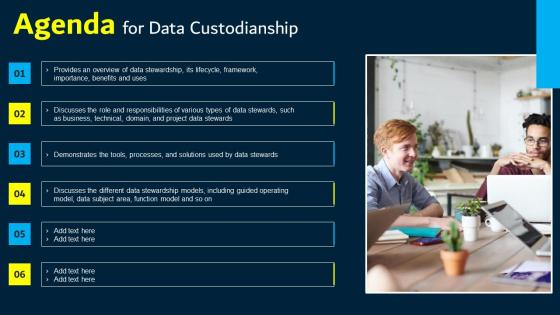
Agenda For Data Custodianship Professional Pdf
Whether you have daily or monthly meetings, a brilliant presentation is necessary. Agenda For Data Custodianship Professional Pdf can be your best option for delivering a presentation. Represent everything in detail using Agenda For Data Custodianship Professional Pdf and make yourself stand out in meetings. The template is versatile and follows a structure that will cater to your requirements. All the templates prepared by Slidegeeks are easy to download and edit. Our research experts have taken care of the corporate themes as well. So, give it a try and see the results. Our Agenda For Data Custodianship Professional Pdf are topically designed to provide an attractive backdrop to any subject. Use them to look like a presentation pro.
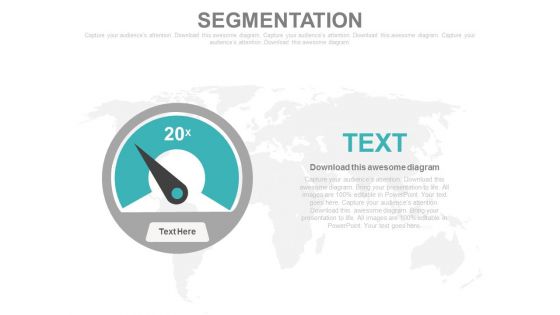
Dashboard Diagram For Data Segmentation Powerpoint Slides
This PowerPoint template has been designed with graphics of dashboard diagram. You may download this slide for data segmentation and representation. Mesmerize your audience with this unique diagram.
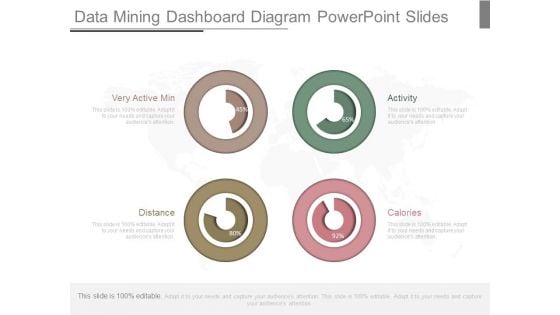
Data Mining Dashboard Diagram Powerpoint Slides
This is a data mining dashboard diagram powerpoint slides. This is a four stage process. The stages in this process are very active min, distance, calories, activity.
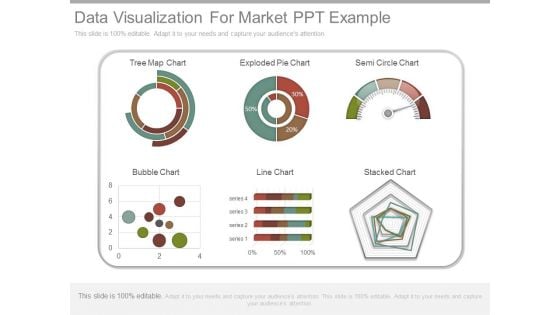
Data Visualization For Market Ppt Example
This is a data visualization for market ppt example. This is a six stage process. The stages in this process are tree map chart, exploded pie chart, semi circle chart, bubble chart, line chart, stacked chart, series.

Big Data Cycle For Analysis Diagram Slides
This is a big data cycle for analysis diagram slides. This is a five stage process. The stages in this process are massive data, new management needs, new final result, new hard and software, new analysis possibilities.
Warehouse Data Storage Reference Diagram Download PDF
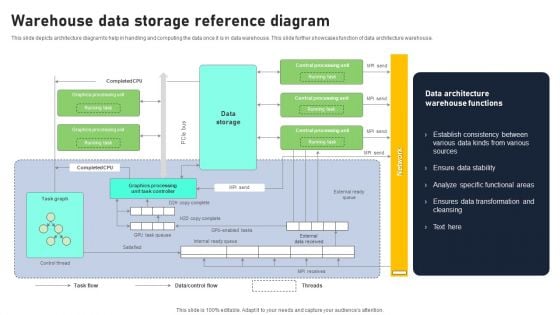
This slide depicts architecture diagram to help in handling and computing the data once it is in data warehouse. This slide further showcases function of data architecture warehouse. Pitch your topic with ease and precision using this Warehouse Data Storage Reference Diagram Download PDF. This layout presents information on Ensure Data Stability, Specific Functional Areas, Data Transformation. It is also available for immediate download and adjustment. So, changes can be made in the color, design, graphics or any other component to create a unique layout.
Various Services Of Business Management Solution Icons PDF
This slide represents various services provided by enterprise software that helps to achieve and focus on business goals. It includes points such as enterprise mobility services, data ,management, software integration and digital transformation services. Presenting Various Services Of Business Management Solution Icons PDF to dispense important information. This template comprises Four stages. It also presents valuable insights into the topics including Mobility Services, Data Management, Digital Transformation . This is a completely customizable PowerPoint theme that can be put to use immediately. So, download it and address the topic impactfully.
Strategies To Future Plans Marketing Trends Icons PDF
This slide illustrates the set of tactics for any organization to implement and compete in the emerging marketing trends. It incorporates virtual reality, voice marketing, data driven decision making and blockchain technology. Persuade your audience using this Strategies To Future Plans Marketing Trends Icons PDF. This PPT design covers four stages, thus making it a great tool to use. It also caters to a variety of topics including Virtual Reality, Voice Marketing, Data Driven Decisions. Download this PPT design now to present a convincing pitch that not only emphasizes the topic but also showcases your presentation skills.
Factors For Successful Project Undertaking Handover Strategy Icons PDF
This slide explains various factors that ensure project handover success in organization. It includes categories such as commercial, process, people, data and knowledge transfer. Persuade your audience using this Factors For Successful Project Undertaking Handover Strategy Icons PDF. This PPT design covers five stages, thus making it a great tool to use. It also caters to a variety of topics including Project Handover Documentation, Process, People, Data Or Knowledge Transfer. Download this PPT design now to present a convincing pitch that not only emphasizes the topic but also showcases your presentation skills.
Data Mining Dashboard Diagram Example Ppt Presentation
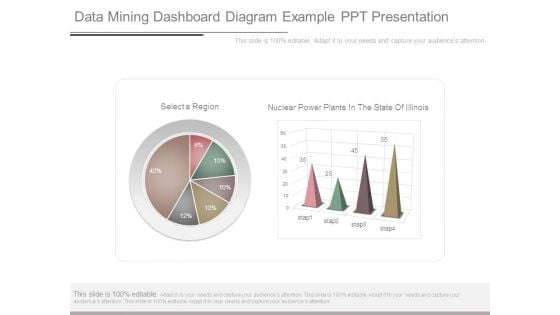
This is a data mining dashboard diagram example ppt presentation. This is a six stage process. The stages in this process are select a region, nuclear power plants in the state of illinois.
Data Quality Elements Management Dashboard Download PDF
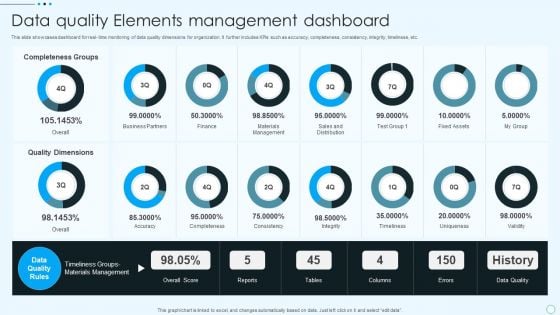
This slide showcases dashboard for real- time monitoring of data quality dimensions for organization. It further includes KPIs such as accuracy, completeness, consistency, integrity, timeliness, etc. Showcasing this set of slides titled Data Quality Elements Management Dashboard Download PDF. The topics addressed in these templates are Quality Dimensions, Accuracy, Completeness, Consistency, Integrity, Timeliness. All the content presented in this PPT design is completely editable. Download it and make adjustments in color, background, font etc. as per your unique business setting.
Big Data Transformation Sample Diagram Powerpoint Slides
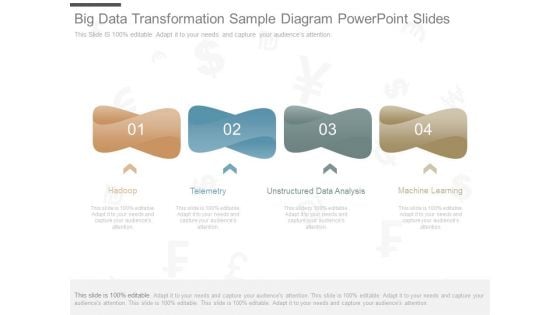
This is a big data transformation sample diagram powerpoint slides. This is a four stage process. The stages in this process are hadoop, telemetry, unstructured data analysis, machine learning.
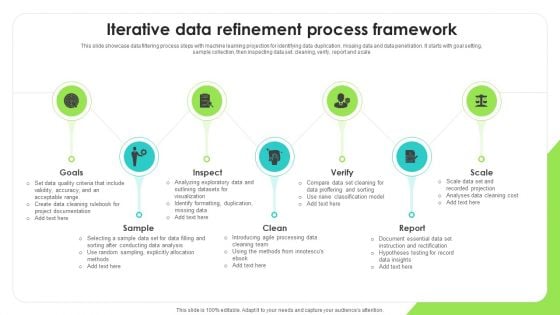
Iterative Data Refinement Process Framework Download PDF
This slide showcase data filtering process steps with machine learning projection for identifying data duplication, missing data and data penetration. It starts with goal setting, sample collection, then inspecting data set, cleaning, verify, report and scale. Presenting Iterative Data Refinement Process Framework Download PDF to dispense important information. This template comprises seven stages. It also presents valuable insights into the topics including Explicitly Allocation, Introducing Processing, Classification Model. This is a completely customizable PowerPoint theme that can be put to use immediately. So, download it and address the topic impactfully.
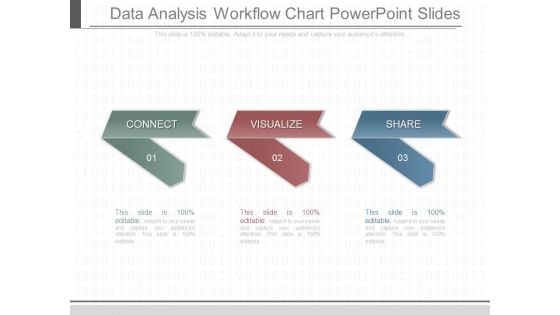
Data Analysis Workflow Chart Powerpoint Slides
This is a data analysis workflow chart powerpoint slides. This is a three stage process. The stages in this process are connect, visualize, share.
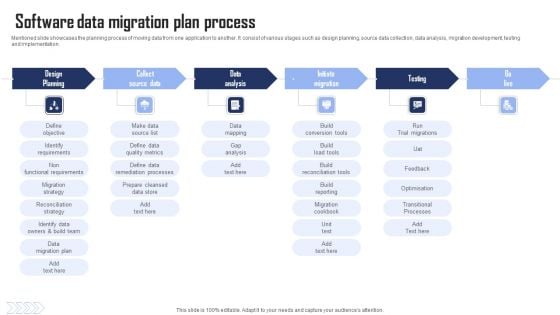
Software Data Migration Plan Process Structure PDF
Mentioned slide showcases the planning process of moving data from one application to another. It consist of various stages such as design planning, source data collection, data analysis, migration development, testing and implementation. Presenting Software Data Migration Plan Process Structure PDF to dispense important information. This template comprises six stages. It also presents valuable insights into the topics including Design Planning, Collect Source Data, Data Analysis . This is a completely customizable PowerPoint theme that can be put to use immediately. So, download it and address the topic impactfully.
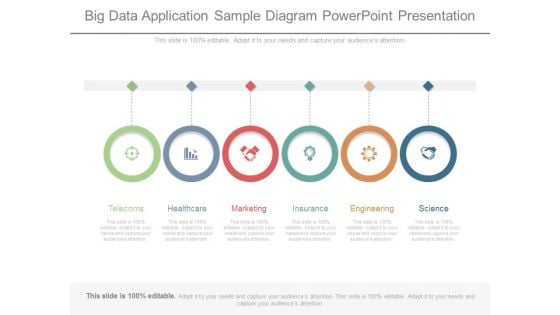
Big Data Application Sample Diagram Powerpoint Presentation
This is a big data application sample diagram powerpoint presentation. This is a six stage process. The stages in this process are telecoms, healthcare, marketing, insurance, engineering, science.
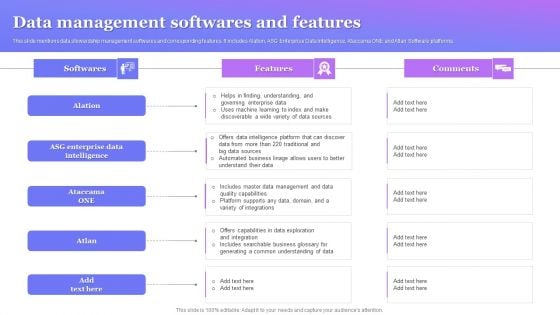
Data Management Softwares And Features Portrait PDF
This slide mentions data stewardship management softwares and corresponding features. It includes Alation, ASG Enterprise Data Intelligence, Ataccama ONE and Atlan Software platforms. Presenting Data Management Softwares And Features Portrait PDF to dispense important information. This template comprises six stages. It also presents valuable insights into the topics including Alation, ASG Enterprise Data Intelligence, Ataccama ONE. This is a completely customizable PowerPoint theme that can be put to use immediately. So, download it and address the topic impactfully.
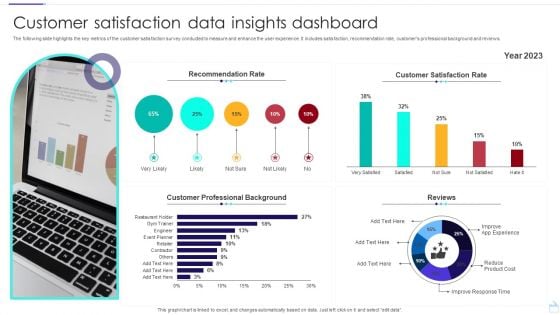
Customer Satisfaction Data Insights Dashboard Ideas PDF
The following slide highlights the key metrics of the customer satisfaction survey conducted to measure and enhance the user experience. It includes satisfaction, recommendation rate, customers professional background and reviews. Showcasing this set of slides titled Customer Satisfaction Data Insights Dashboard Ideas PDF. The topics addressed in these templates are Recommendation Rate, Customer Satisfaction Rate, Customer Professional Background. All the content presented in this PPT design is completely editable. Download it and make adjustments in color, background, font etc. as per your unique business setting.
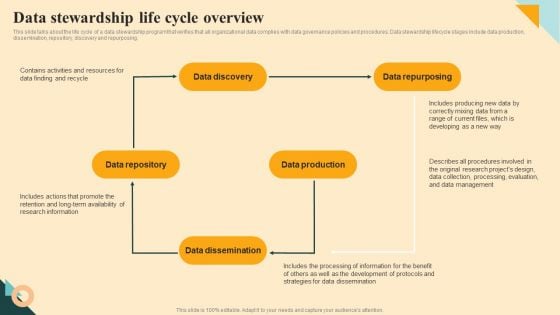
Data Stewardship Life Cycle Overview Demonstration PDF
This slide talks about the life cycle of a data stewardship program that verifies that all organizational data complies with data governance policies and procedures. Data stewardship lifecycle stages include data production, dissemination, repository, discovery and repurposing. If you are looking for a format to display your unique thoughts, then the professionally designed Data Stewardship Life Cycle Overview Demonstration PDF is the one for you. You can use it as a Google Slides template or a PowerPoint template. Incorporate impressive visuals, symbols, images, and other charts. Modify or reorganize the text boxes as you desire. Experiment with shade schemes and font pairings. Alter, share or cooperate with other people on your work. Download Data Stewardship Life Cycle Overview Demonstration PDF and find out how to give a successful presentation. Present a perfect display to your team and make your presentation unforgettable.
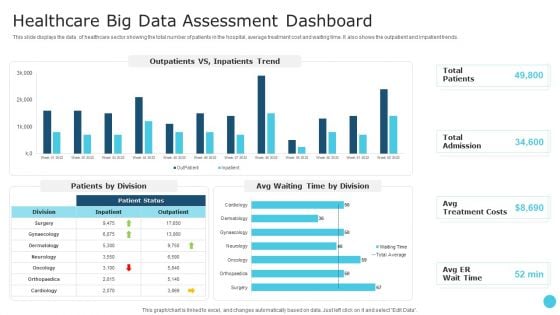
Healthcare Big Data Assessment Dashboard Portrait PDF
This slide displays the data of healthcare sector showing the total number of patients in the hospital, average treatment cost and waiting time. It also shows the outpatient and impatient trends. Pitch your topic with ease and precision using this Healthcare Big Data Assessment Dashboard Portrait PDF. This layout presents information on Patient Status, Treatment Costs. It is also available for immediate download and adjustment. So, changes can be made in the color, design, graphics or any other component to create a unique layout.
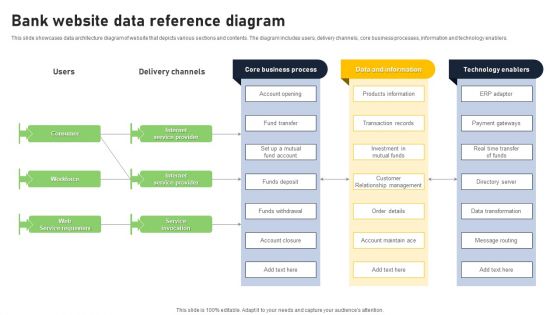
Bank Website Data Reference Diagram Mockup PDF
This slide showcases data architecture diagram of website that depicts various sections and contents. The diagram includes users, delivery channels, core business processes, information and technology enablers. Showcasing this set of slides titled Bank Website Data Reference Diagram Mockup PDF. The topics addressed in these templates are Core Business Process, Data Information, Technology Enablers. All the content presented in this PPT design is completely editable. Download it and make adjustments in color, background, font etc. as per your unique business setting.

Social Application Data Reference Diagram Introduction PDF
This slide depicts architecture diagram depicting data management. The diagram includes core and processing components, users application, core streaming and data management. Showcasing this set of slides titled Social Application Data Reference Diagram Introduction PDF. The topics addressed in these templates are Quality Assessment, Cotent Delivery, Content Enhancement. All the content presented in this PPT design is completely editable. Download it and make adjustments in color, background, font etc. as per your unique business setting.
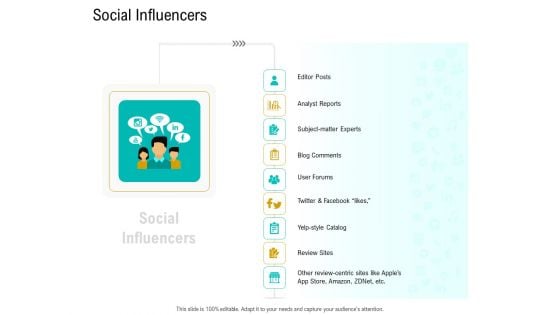
Business Data Analysis Social Influencers Diagrams PDF
Deliver an awe inspiring pitch with this creative business data analysis social influencers diagrams pdf bundle. Topics like analyst reports, subject matter experts, blog comments review sites, user forums can be discussed with this completely editable template. It is available for immediate download depending on the needs and requirements of the user.
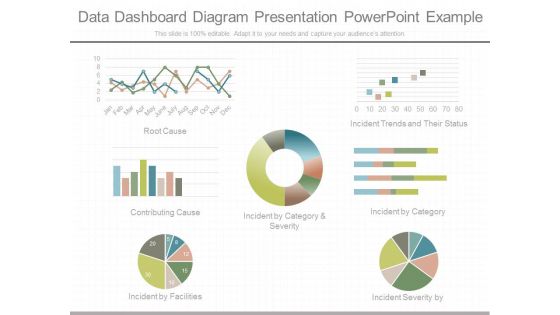
Data Dashboard Diagram Presentation Powerpoint Example
This is a data dashboard diagram presentation powerpoint example. This is a seven stage process. The stages in this process are root cause, incident trends and their status, contributing cause, incident by category and severity, incident by category, incident by facilities, incident severity by.
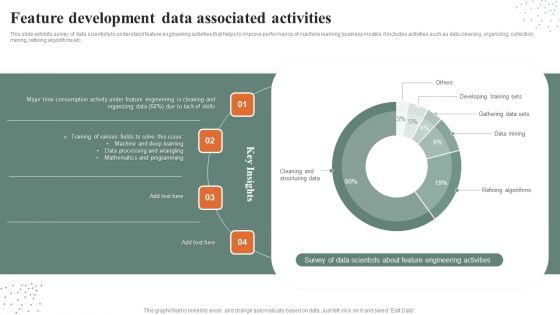
Feature Development Data Associated Activities Guidelines PDF
This slide exhibits survey of data scientists to understand feature engineering activities that helps to improve performance of machine learning business models. It includes activities such as data cleaning, organizing, collection, mining, refining algorithms etc. Pitch your topic with ease and precision using this Feature Development Data Associated Activities Guidelines PDF. This layout presents information on Programming, Developing Training Sets, Gathering Data Sets. It is also available for immediate download and adjustment. So, changes can be made in the color, design, graphics or any other component to create a unique layout.
Data Structure IT Swot Analysis Diagrams PDF
Presenting this PowerPoint presentation, titled Data Structure IT Swot Analysis Diagrams PDF, with topics curated by our researchers after extensive research. This editable presentation is available for immediate download and provides attractive features when used. Download now and captivate your audience. Presenting this Data Structure IT Swot Analysis Diagrams PDF. Our researchers have carefully researched and created these slides with all aspects taken into consideration. This is a completely customizable Data Structure IT Swot Analysis Diagrams PDF that is available for immediate downloading. Download now and make an impact on your audience. Highlight the attractive features available with our PPTs.
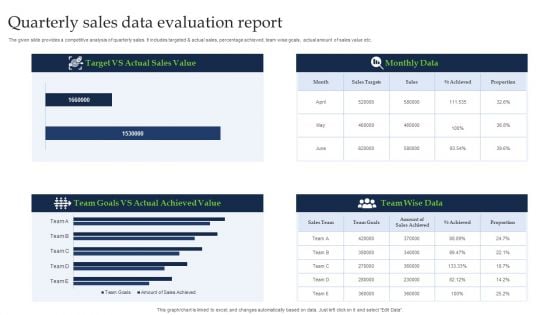
Quarterly Sales Data Evaluation Report Ideas PDF
The given slide provides a competitive analysis of quarterly sales. It includes targeted and actual sales, percentage achieved, team wise goals, actual amount of sales value etc. Showcasing this set of slides titled Quarterly Sales Data Evaluation Report Ideas PDF. The topics addressed in these templates are Actual Sales Value, Target, Actual Achieved Value. All the content presented in this PPT design is completely editable. Download it and make adjustments in color, background, font etc. as per your unique business setting.
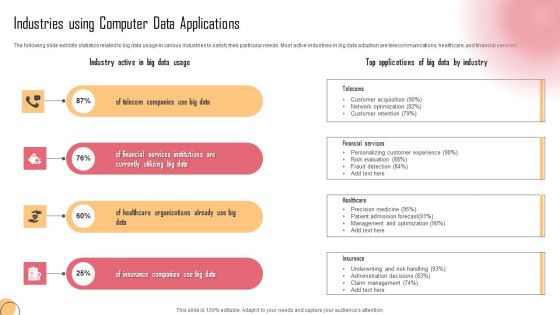
Industries Using Computer Data Applications Professional PDF
The following slide exhibits statistics related to big data usage in various industries to satisfy their particular needs. Most active industries in big data adoption are telecommunications, healthcare, and financial services. Presenting Industries Using Computer Data Applications Professional PDF to dispense important information. This template comprises four stages. It also presents valuable insights into the topics including Telecoms, Financial Services, Healthcare. This is a completely customizable PowerPoint theme that can be put to use immediately. So, download it and address the topic impactfully.


 Continue with Email

 Home
Home


