Data Analytics Icons
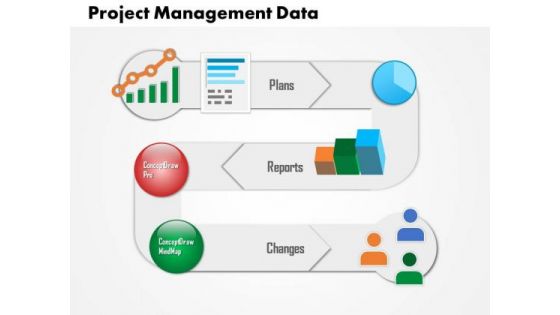
Business Diagram Project Management Data PowerPoint Ppt Presentation
This slide provides diagram for project management data. It contains spiral diagram with icons depicting plans reports and changes. Download this awesome diagram to capture your audiences attention.
O RAN Architecture Introduction To Open Random Access Network Ran Icons PDF
This slide represents the introduction to open RAN standards in telecommunication systems, a partnership between device manufacturers and telecommunications to overcome the interoperability challenge. Slidegeeks is here to make your presentations a breeze with O RAN Architecture Introduction To Open Random Access Network Ran Icons PDF With our easy-to-use and customizable templates, you can focus on delivering your ideas rather than worrying about formatting. With a variety of designs to choose from, youre sure to find one that suits your needs. And with animations and unique photos, illustrations, and fonts, you can make your presentation pop. So whether youre giving a sales pitch or presenting to the board, make sure to check out Slidegeeks first.
Assessment And Market Position Of Competitors Product Product Range Ppt PowerPoint Presentation Pictures Icons
This is a assessment and market position of competitors product product range ppt powerpoint presentation pictures icons. This is a four stage process. The stages in this process are design, price, performance, quality, additional functions.
Service Design And Delivery Template 4 Ppt PowerPoint Presentation Gallery Icons
This is a service design and delivery template 4 ppt powerpoint presentation gallery icons. This is a four stage process. The stages in this process are traditional professional service provision, professionals as sole service deliverers, professionals as sole service planner, no professional input into service planning.

Information Transformation Process Toolkit Data Analysis Project Plan Diagrams PDF
The slide outline the key steps for data analytics methodology. It initiates with defining business objectives to data understanding, modelling and ends at data visualization and presentation. Presenting Information Transformation Process Toolkit Data Analysis Project Plan Diagrams PDF to provide visual cues and insights. Share and navigate important information on six stages that need your due attention. This template can be used to pitch topics like Business Issue Understanding, Data Understanding, Data Preparation. In addtion, this PPT design contains high resolution images, graphics, etc, that are easily editable and available for immediate download.
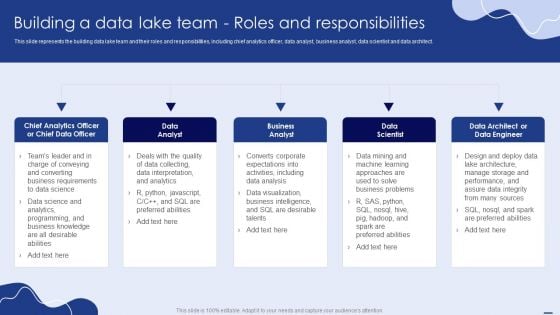
Building A Data Lake Team Roles And Responsibilities Themes PDF
This slide represents the building data lake team and their roles and responsibilities, including chief analytics officer, data analyst, business analyst, data scientist and data architect. Slidegeeks is one of the best resources for PowerPoint templates. You can download easily and regulate Building A Data Lake Team Roles And Responsibilities Themes PDF for your personal presentations from our wonderful collection. A few clicks is all it takes to discover and get the most relevant and appropriate templates. Use our Templates to add a unique zing and appeal to your presentation and meetings. All the slides are easy to edit and you can use them even for advertisement purposes.

Technologies To Ensure Data Protection And Privacy Background PDF
The following slide showcases some technologies to administer organizational data privacy and security concerns. It includes elements such as data encryption, change management and auditing, user and behavior analytics UEBA, backup and recovery etc. Presenting Technologies To Ensure Data Protection And Privacy Background PDF to dispense important information. This template comprises four stages. It also presents valuable insights into the topics including Data Encryption, Change Management And Auditing, Backup And Recovery. This is a completely customizable PowerPoint theme that can be put to use immediately. So, download it and address the topic impactfully.
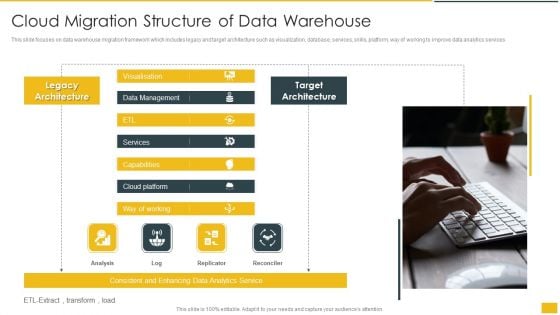
Cloud Migration Structure Of Data Warehouse Rules PDF
This slide focuses on data warehouse migration framework which includes legacy and target architecture such as visualization, database, services, skills, platform, way of working to improve data analytics services. Presenting Cloud Migration Structure Of Data Warehouse Rules PDF to dispense important information. This template comprises one stages. It also presents valuable insights into the topics including Target Architecture, Legacy Architecture, Data Management. This is a completely customizable PowerPoint theme that can be put to use immediately. So, download it and address the topic impactfully.
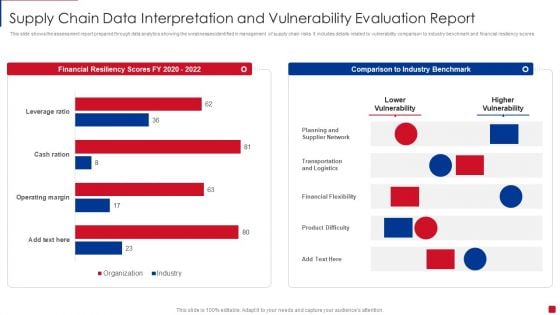
Supply Chain Data Interpretation And Vulnerability Evaluation Report Pictures PDF
This slide shows the assessment report prepared through data analytics showing the weaknesses identified in management of supply chain risks. It includes details related to vulnerability comparison to industry benchmark and financial resiliency scores Showcasing this set of slides titled Supply Chain Data Interpretation And Vulnerability Evaluation Report Pictures PDF. The topics addressed in these templates are Planning And Supplier Network, Transportation And Logistics, Financial Flexibility. All the content presented in this PPT design is completely editable. Download it and make adjustments in color, background, font etc. as per your unique business setting.

Big Data Interpretation Evaluation In Risk Management Lifecycle Designs PDF
This slide demonstrates the four phases of big data analytics assessment in risk management lifecycle. It includes four phases such as risk assessment and measurement, front office and risk operations, risk control, monitoring, reporting and governance. Persuade your audience using this Big Data Interpretation Evaluation In Risk Management Lifecycle Designs PDF. This PPT design covers four stages, thus making it a great tool to use. It also caters to a variety of topics including Risk Assessment And Measurement, Risk Control And Monitoring , Risk Reporting And Governance. Download this PPT design now to present a convincing pitch that not only emphasizes the topic but also showcases your presentation skills.
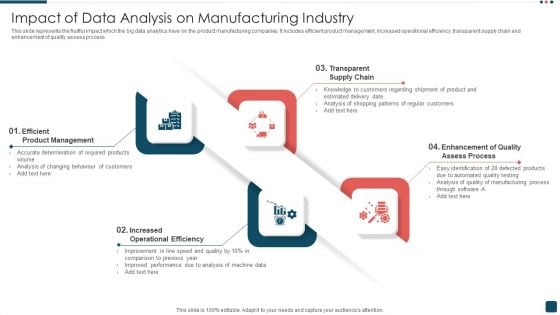
Impact Of Data Analysis On Manufacturing Industry Clipart PDF
This slide represents the fruitful impact which the big data analytics have on the product manufacturing companies. It includes efficient product management, increased operational efficiency, transparent supply chain and enhancement of quality assess process. Presenting Impact Of Data Analysis On Manufacturing Industry Clipart PDF to dispense important information. This template comprises four stages. It also presents valuable insights into the topics including Transparent Supply Chain, Enhancement Of Quality, Increased Operational Efficiency. This is a completely customizable PowerPoint theme that can be put to use immediately. So, download it and address the topic impactfully.
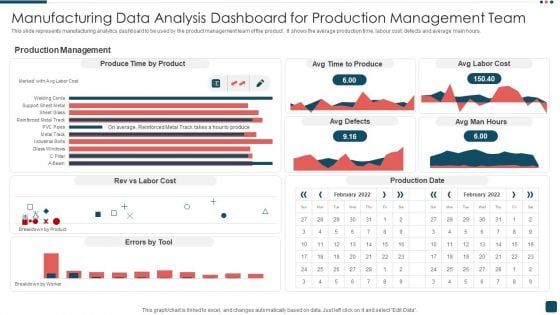
Manufacturing Data Analysis Dashboard For Production Management Team Summary PDF
This slide represents manufacturing analytics dashboard to be used by the product management team of the product . It shows the average production time, labour cost, defects and average main hours. Pitch your topic with ease and precision using this Manufacturing Data Analysis Dashboard For Production Management Team Summary PDF. This layout presents information on Production Management, Product, Cost. It is also available for immediate download and adjustment. So, changes can be made in the color, design, graphics or any other component to create a unique layout.
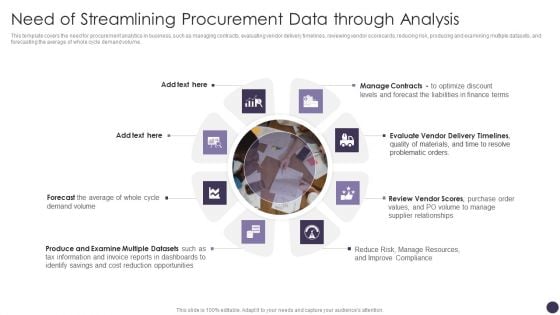
Need Of Streamlining Procurement Data Through Analysis Themes PDF
This template covers the need for procurement analytics in business, such as managing contracts, evaluating vendor delivery timelines, reviewing vendor scorecards, reducing risk, producing and examining multiple datasets, and forecasting the average of whole cycle demand volume. This is a Need Of Streamlining Procurement Data Through Analysis Themes PDF template with various stages. Focus and dispense information on eight stages using this creative set, that comes with editable features. It contains large content boxes to add your information on topics like Manage Contracts, Forecast The Liabilities, Problematic Orders. You can also showcase facts, figures, and other relevant content using this PPT layout. Grab it now.
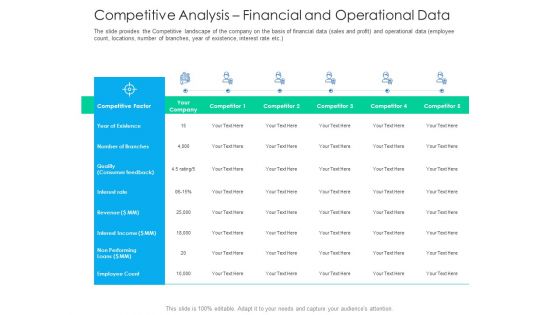
After Hours Trading Competitive Analysis Financial And Operational Data Graphics PDF
Deliver and pitch your topic in the best possible manner with this after hours trading competitive analysis financial and operational data graphics pdf. Use them to share invaluable insights on competitive factor, number of branches, interest rate and impress your audience. This template can be altered and modified as per your expectations. So, grab it now.
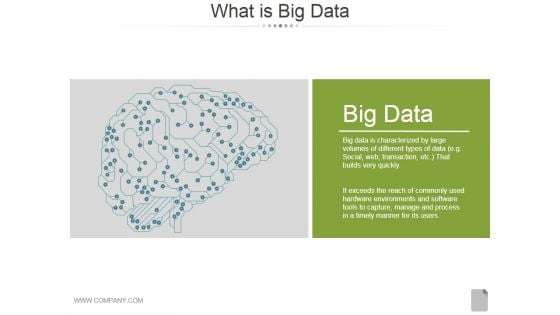
What Is Big Data Ppt PowerPoint Presentation Diagrams
This is a what is big data ppt powerpoint presentation diagrams. This is a one stage process. The stages in this process are big data, business, analysis, management, marketing.
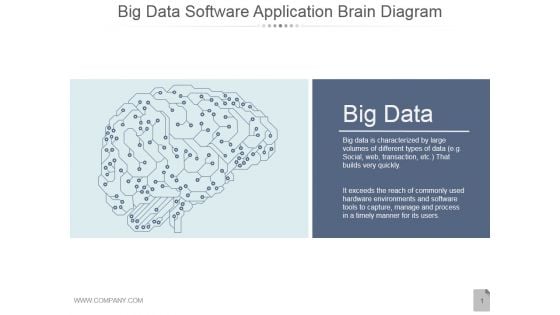
Big Data Software Application Brain Diagram Ppt PowerPoint Presentation Slides
This is a big data software application brain diagram ppt powerpoint presentation slides. This is a one stage process. The stages in this process are big data, communication, business, marketing, idea.
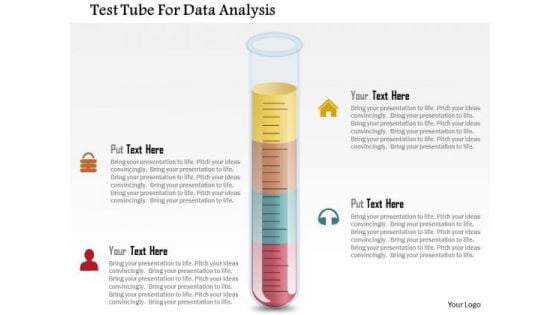
Business Diagram Test Tube For Data Analysis Presentation Template
Graphic of test tube with lock and headphone icons have been used to design this Power Point template. You may use this diagram for data analysis and research. Present your views using our innovative slide and be assured of leaving a lasting impression.
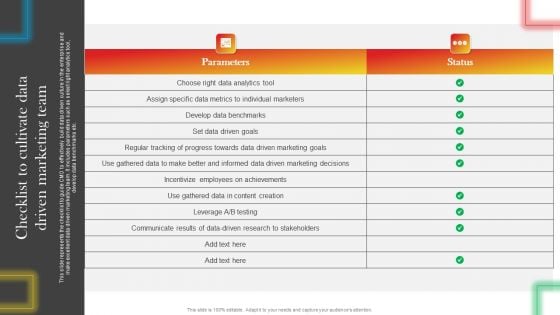
Checklist To Cultivate Data Driven Marketing Team Mockup PDF
This slide represents the checklist to guide CMO to effectively build data driven culture in the enterprise and make excellent data driven marketing team. It includes parameters such as select right analytics tool, develop data benchmarks etc. Do you know about Slidesgeeks Checklist To Cultivate Data Driven Marketing Team Mockup PDF These are perfect for delivering any kind od presentation. Using it, create PowerPoint presentations that communicate your ideas and engage audiences. Save time and effort by using our pre-designed presentation templates that are perfect for a wide range of topic. Our vast selection of designs covers a range of styles, from creative to business, and are all highly customizable and easy to edit. Download as a PowerPoint template or use them as Google Slides themes.
Information Technology In A Supply Chain Analytical Applications Ppt PowerPoint Presentation Icon Graphics Design
This is a information technology in a supply chain analytical applications ppt powerpoint presentation icon graphics design. This is a three stage process. The stages in this process are strategic, planning, operational, supplier apps, dem plan.
Business Cost Savings Analytic Vector Icon Ppt Infographic Template Model PDF
Presenting business cost savings analytic vector icon ppt infographic template model pdf to dispense important information. This template comprises three stages. It also presents valuable insights into the topics including business cost savings analytic vector icon. This is a completely customizable PowerPoint theme that can be put to use immediately. So, download it and address the topic impactfully.
Manager Checking Business Analytical Reports Vector Icon Ppt PowerPoint Presentation File Outfit PDF
Presenting manager checking business analytical reports vector icon ppt powerpoint presentation file outfit pdf to dispense important information. This template comprises three stages. It also presents valuable insights into the topics including manager checking business analytical reports vector icon. This is a completely customizable PowerPoint theme that can be put to use immediately. So, download it and address the topic impactfully.
Vector Illustration Of Analytical Thinking Icon Ppt PowerPoint Presentation File Design Inspiration PDF
Presenting vector illustration of analytical thinking icon ppt powerpoint presentation file design inspiration pdf to dispense important information. This template comprises two stages. It also presents valuable insights into the topics including vector illustration of analytical thinking icon. This is a completely customizable PowerPoint theme that can be put to use immediately. So, download it and address the topic impactfully.
Next Steps For Site Analytic And Audit Proposal Ppt Icon Vector PDF
This is a next steps for site analytic and audit proposal ppt icon vector pdf template with various stages. Focus and dispense information on six stages using this creative set, that comes with editable features. It contains large content boxes to add your information on topics like next steps. You can also showcase facts, figures, and other relevant content using this PPT layout. Grab it now.
Analytical Incrementalism Conducting A Strategic Gap Analysis Ppt Ideas Icon PDF
The purpose of this slide is to provide a glimpse of the companys strategic gap analysis considering the focus areas, current and future state and action plan. This is a analytical incrementalism conducting a strategic gap analysis ppt ideas icon pdf template with various stages. Focus and dispense information on three stages using this creative set, that comes with editable features. It contains large content boxes to add your information on topics like focus areas, current state, identified gap, action plan, desired future state. You can also showcase facts, figures, and other relevant content using this PPT layout. Grab it now.
Information Technology In A Supply Chain Analytical Applications Ppt PowerPoint Presentation Portfolio Icon
This is a information technology in a supply chain analytical applications ppt powerpoint presentation portfolio icon. This is a three stage process. The stages in this process are strategic, planning, operational, supplier apps, manufacturer.
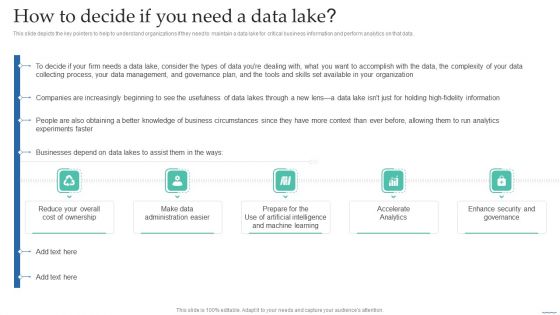
How To Decide If You Need A Data Lake Data Lake Creation With Hadoop Cluster Sample PDF
This slide depicts the key pointers to help to understand organizations if they need to maintain a data lake for critical business information and perform analytics on that data.If you are looking for a format to display your unique thoughts, then the professionally designed How To Decide If You Need A Data Lake Data Lake Creation With Hadoop Cluster Sample PDF is the one for you. You can use it as a Google Slides template or a PowerPoint template. Incorporate impressive visuals, symbols, images, and other charts. Modify or reorganize the text boxes as you desire. Experiment with shade schemes and font pairings. Alter, share or cooperate with other people on your work. Download How To Decide If You Need A Data Lake Data Lake Creation With Hadoop Cluster Sample PDF and find out how to give a successful presentation. Present a perfect display to your team and make your presentation unforgettable.
Internet Of Things In Transportation Industry For Supply Chain Management Icons Pdf
The below slide illustrates the IoT transportation advantage for effective supply chain management that leads to food safety promotion. The different benefits provided are tracking, monitoring, and analytics at various levels. Showcasing this set of slides titled Internet Of Things In Transportation Industry For Supply Chain Management Icons Pdf The topics addressed in these templates are Continuous Data Flow, Monitoring, Analytics, Tracking All the content presented in this PPT design is completely editable. Download it and make adjustments in color, background, font etc. as per your unique business setting. The below slide illustrates the IoT transportation advantage for effective supply chain management that leads to food safety promotion. The different benefits provided are tracking, monitoring, and analytics at various levels.
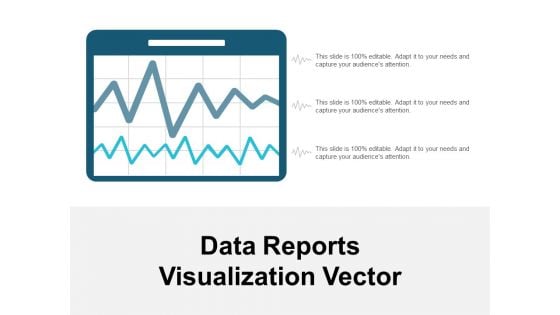
Data Reports Visualization Vector Ppt PowerPoint Presentation Visual Aids Deck
Presenting this set of slides with name data reports visualization vector ppt powerpoint presentation visual aids deck. The topics discussed in these slides are data visualization icon, research analysis, business focus. This is a completely editable PowerPoint presentation and is available for immediate download. Download now and impress your audience.
Magnifying Glass Big Data Analysis Ppt PowerPoint Presentation Diagram Templates
Presenting this set of slides with name magnifying glass big data analysis ppt powerpoint presentation diagram templates. This is a four stage process. The stages in this process are technology, marketing, planning, business, management. This is a completely editable PowerPoint presentation and is available for immediate download. Download now and impress your audience.
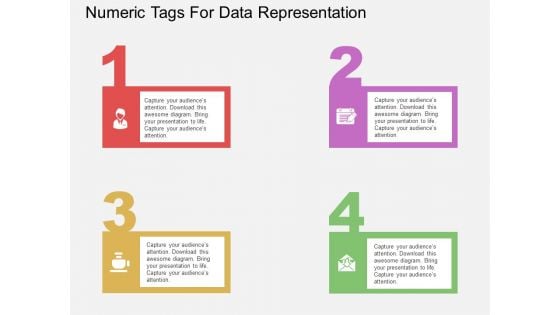
Four Staged Numeric Tags For Data Representation Powerpoint Template
Our above PowerPoint slide contains diagram of four numeric tags. Download this business slide for data representations. Use this diagram to impart more clarity to data and to create more sound impact on viewers.
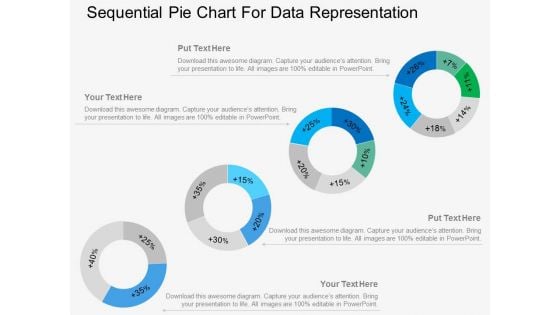
Four Sequential Pie Charts For Data Representation Powerpoint Template
Our above PowerPoint template displays infographic diagram of sequential pie chart. This diagram slide may be used for data representation in visual manner. Above slide provide ideal backdrop to make business presentations.
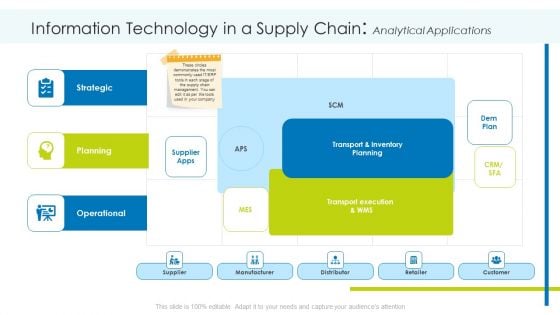
Information Technology In A Supply Chain Analytical Applications Diagrams PDF
Deliver an awe-inspiring pitch with this creative information technology in a supply chain analytical applications diagrams pdf. bundle. Topics like transport and inventory planning, transport execution and wms, planning can be discussed with this completely editable template. It is available for immediate download depending on the needs and requirements of the user.
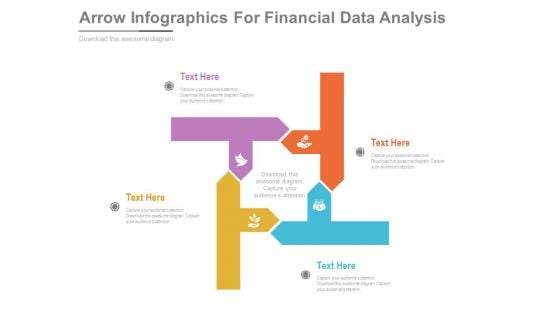
Arrow Infographics For Financial Data Analysis Powerpoint Template
This PowerPoint slide contains diagram of arrows infographic. This professional slide helps to exhibit financial data analysis for business growth. Use this PowerPoint template to make impressive presentations.
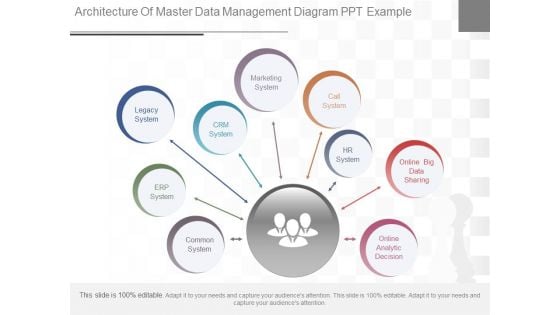
Architecture Of Master Data Management Diagram Ppt Example
This is a architecture of master data management diagram ppt example. This is a nine stage process. The stages in this process are common system, erp system, legacy system, crm system, marketing system, call system, hr system, online big data sharing, online analytic decision.
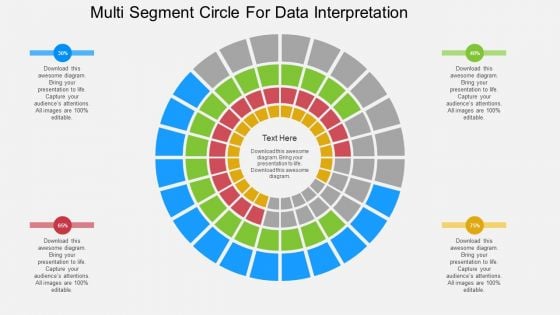
Multi Segment Circle For Data Interpretation Powerpoint Template
This PowerPoint template has been designed with circular web diagram. This diagram is useful to display outline of a business plan. Visual effect helps in maintaining the flow of the discussion and provides more clarity to the subject.
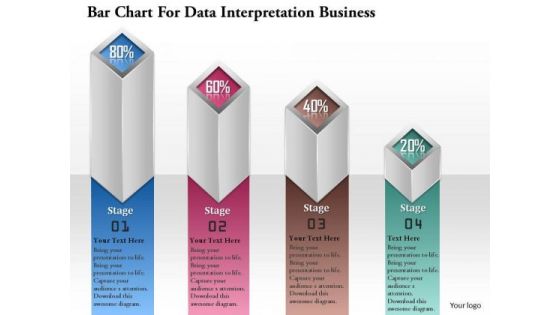
Consulting Slides Bar Chart For Data Interpretation Business Presentation
This pre-designed and appealing bar chart for PowerPoint offer an optimized possibility to illustrate your business strategy. You can use this diagram for data interpretation. This diagram is editable and can be easily adjusted.
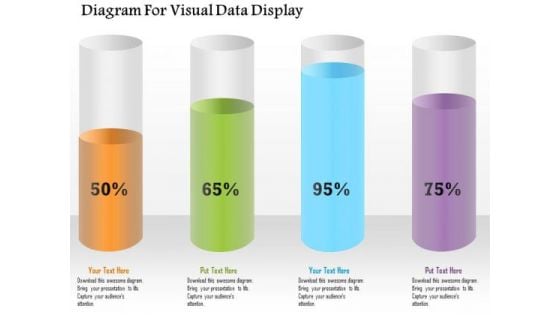
Business Diagram Diagram For Visual Data Display Presentation Template
Four colored cylindrical bars with percentage values are used to design this power point template. This diagram slide helps to display financial data analysis. Use this diagram for your business and finance related presentations.
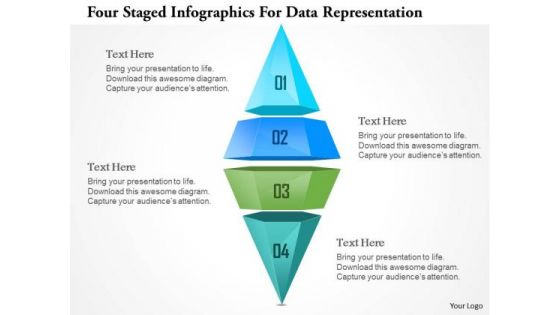
Busines Diagram Four Staged Ingographics For Data Representation Ppt Template
This business diagram has been designed with graphic of four staged info graphics. This info graphic can be used for data representation. Deliver amazing presentations to mesmerize your audience.
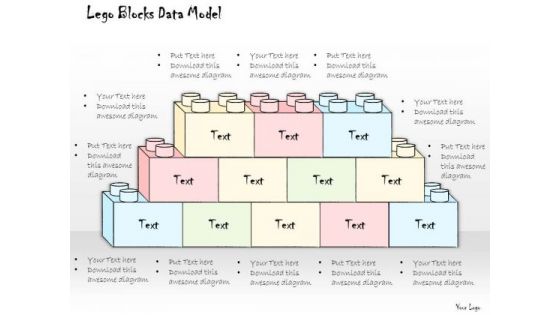
Ppt Slide Lego Blocks Data Model Consulting Firms
Our PPT Slide Lego Blocks Data Model Consulting Firms Powerpoint Templates Enjoy Drama. They Provide Entertaining Backdrops. Our Consulting Firms Powerpoint Templates Help To Make A Draft. They Give You A Good Place To Start.
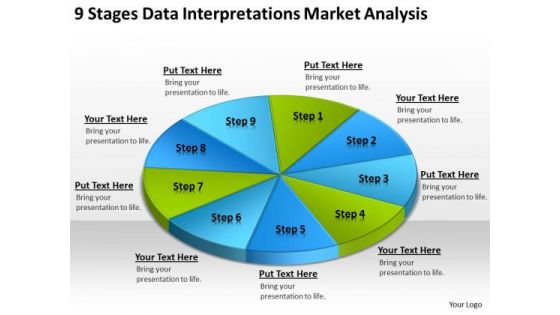
Data Interpretations Market Analysis Templates For Business Plan PowerPoint
We present our data interpretations market analysis templates for business plan PowerPoint.Present our Circle Charts PowerPoint Templates because Our PowerPoint Templates and Slides come in all colours, shades and hues. They help highlight every nuance of your views. Use our Business PowerPoint Templates because Our PowerPoint Templates and Slides will let you Hit the right notes. Watch your audience start singing to your tune. Download our Shapes PowerPoint Templates because Our PowerPoint Templates and Slides will fulfill your every need. Use them and effectively satisfy the desires of your audience. Present our Signs PowerPoint Templates because Our PowerPoint Templates and Slides will provide you a launch platform. Give a lift off to your ideas and send them into orbit. Use our Metaphors-Visual Concepts PowerPoint Templates because You have a driving passion to excel in your field. Our PowerPoint Templates and Slides will prove ideal vehicles for your ideas.Use these PowerPoint slides for presentations relating to business, chart, circle, circular, diagram, economy, finance, framework, graph, isolated, percentage, pie chart, results, scheme, statistics, stats, strategy, success. The prominent colors used in the PowerPoint template are Blue, Green, Blue light. Affiliate our Data Interpretations Market Analysis Templates For Business Plan PowerPoint to your thoughts. They will develop an affinity for them.

Business Diagram Business Bar Graph For Data Analysis Presentation Template
This business slide displays pie charts with percentage ratios. This diagram is a data visualization tool that gives you a simple way to present statistical information. This slide helps your audience examines and interprets the data you present.
Complete Online Marketing Audit Guide Cost Estimation Of Digital Marketing Audit Icons PDF
This slide highlights the cost estimation of digital audit which includes the website audit, social media audit, technical audit, sales and marketing audit with web analytics audit. This is a Complete Online Marketing Audit Guide Cost Estimation Of Digital Marketing Audit Icons PDF template with various stages. Focus and dispense information on one stages using this creative set, that comes with editable features. It contains large content boxes to add your information on topics like Sales And Marketing, Web Analytics Audit, Social Media Audit. You can also showcase facts, figures, and other relevant content using this PPT layout. Grab it now.
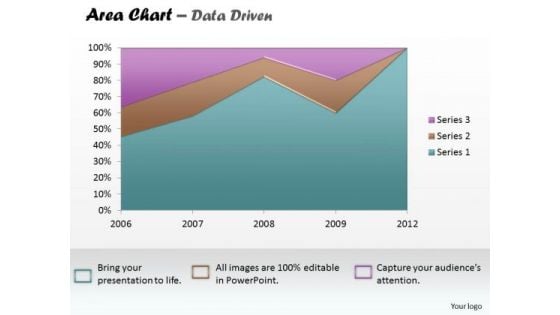
Data Analysis Excel Business Reporting Area Chart PowerPoint Templates
Establish The Dominance Of Your Ideas. Our data analysis excel business reporting area chart Powerpoint Templates Will Put Them On Top.
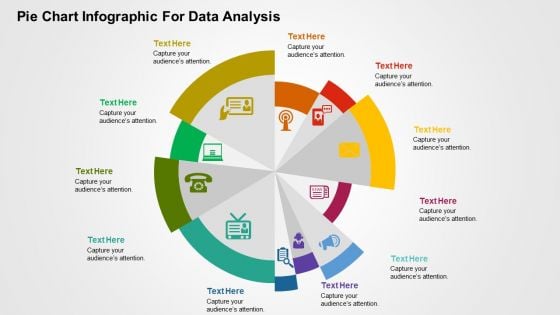
Pie Chart Infographic For Data Analysis PowerPoint Templates
This is one of the most downloaded PowerPoint template. This slide can be used for various purposes and to explain a number of processes. This can be included in your presentation to explain each step of a process and even include its relevance and importance in a single diagram. Using the uneven circular structure of the pie chart, the presenter can also explain random steps or highlight particular steps of process or parts of an organization or business that need special attention of any kind to the audience. Additionally, you can use this slide to show a transformation process or highlight key features of a product.
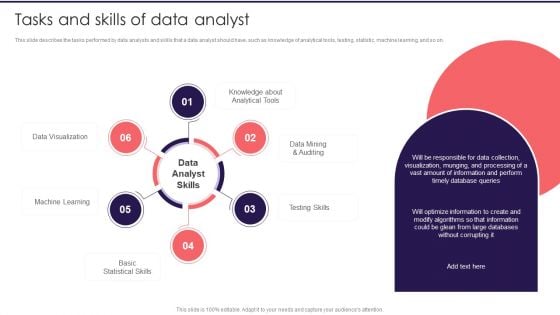
Information Studies Tasks And Skills Of Data Analyst Themes PDF
This slide describes the tasks performed by data analysts and skills that a data analyst should have, such as knowledge of analytical tools, testing, statistic, machine learning, and so on. Presenting Information Studies Tasks And Skills Of Data Analyst Themes PDF to provide visual cues and insights. Share and navigate important information on six stages that need your due attention. This template can be used to pitch topics like Data Visualization, Basic Statistical Skills, Machine Learning. In addtion, this PPT design contains high resolution images, graphics, etc, that are easily editable and available for immediate download.
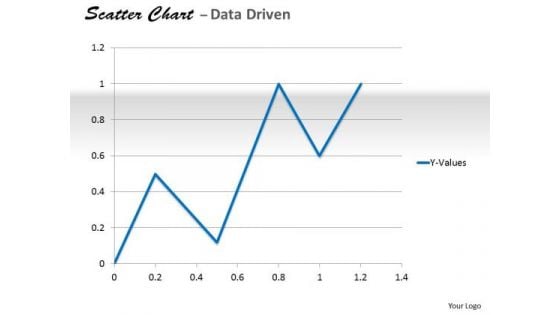
Data Analysis In Excel Analyzing Of Relationship Chart PowerPoint Templates
Delight Them With Our data analysis in excel analyzing of relationship chart Powerpoint Templates .
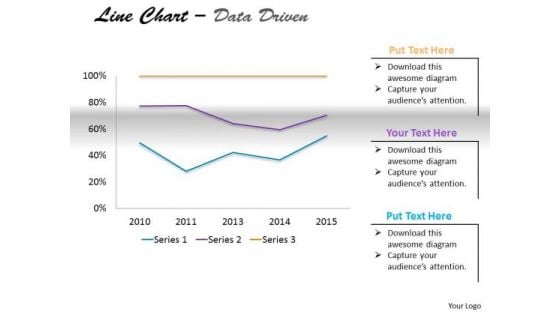
Multivariate Data Analysis Driven Market Line Chart PowerPoint Slides Templates
Delight Them With Our multivariate data analysis driven market line chart powerpoint slides Templates .

Data Analysis Excel Categorical Statistics Doughnut Chart PowerPoint Templates
Establish Your Dominion With Our data analysis excel categorical statistics doughnut chart Powerpoint Templates. Rule The Stage With Your Thoughts.
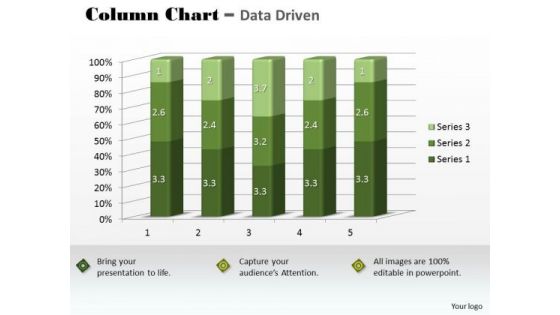
Marketing Data Analysis 3d Statistical Quality Control Chart PowerPoint Templates
Our marketing data analysis 3d statistical quality control chart Powerpoint Templates Abhor Doodling. They Never Let The Interest Flag.
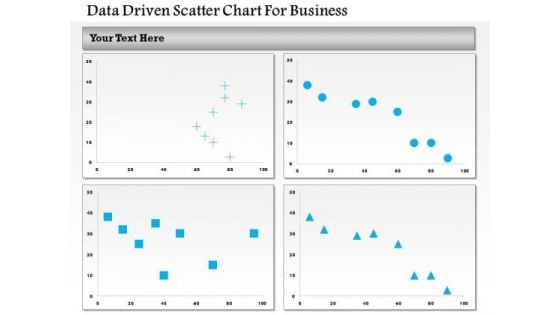
Business Diagram Data Driven Scatter Chart For Business PowerPoint Slide
This business diagram has been designed with four comparative charts. This slide suitable for data representation. You can also use this slide to present business analysis and reports. Use this diagram to present your views in a wonderful manner.
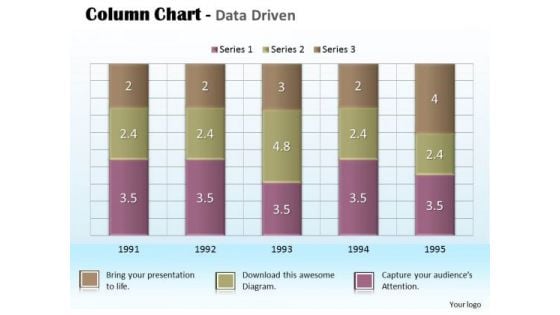
Business Data Analysis Chart For Project PowerPoint Templates
Document Your Views On Our business data analysis chart for project Powerpoint Templates. They Will Create A Strong Impression.
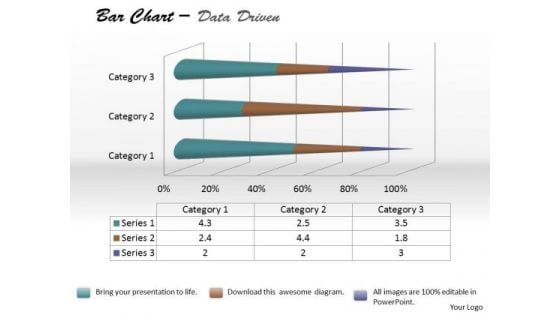
Data Analysis Bar Chart For Foreign Trade PowerPoint Templates
Be The Doer With Our data analysis bar chart for foreign trade Powerpoint Templates. Put Your Thoughts Into Practice.
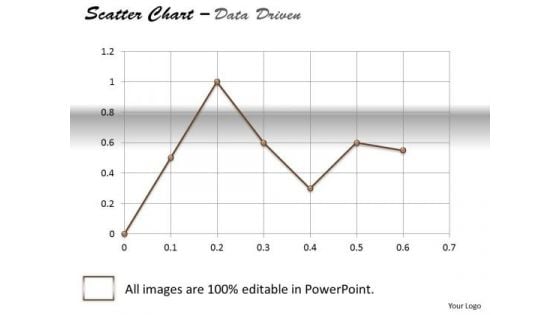
Data Analysis Excel Business Tool Scatter Chart PowerPoint Templates
Dominate Proceedings With Your Ideas. Our data analysis excel business tool scatter chart Powerpoint Templates Will Empower Your Thoughts.
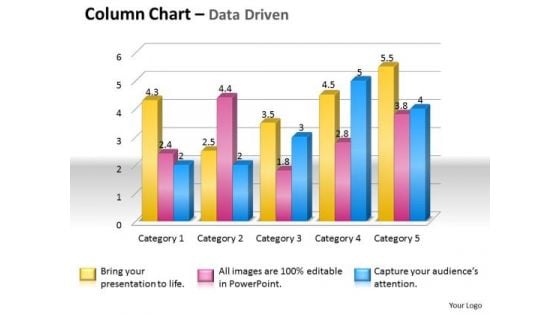
Data Analysis Techniques 3d Grouped Bar Chart PowerPoint Templates
Place The Orders With Your Thoughts. Our data analysis techniques 3d grouped bar chart Powerpoint Templates Know The Drill.
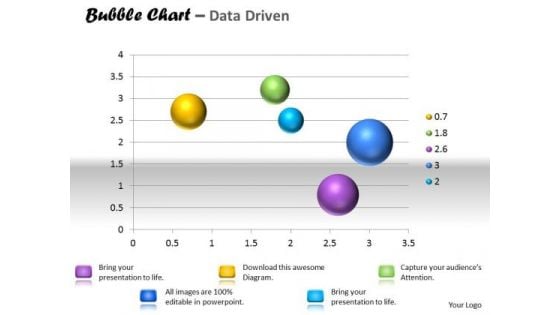
Data Analysis Template Interactive Bubble Chart PowerPoint Templates
Our data analysis template interactive bubble chart Powerpoint Templates Are A Wonder Drug. They Help Cure Almost Any Malaise.
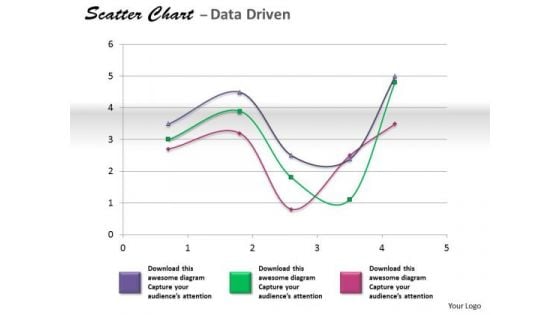
Financial Data Analysis Coordinate With Scatter Chart PowerPoint Templates
Get The Doers Into Action. Activate Them With Our financial data analysis coordinate with scatter chart Powerpoint Templates .
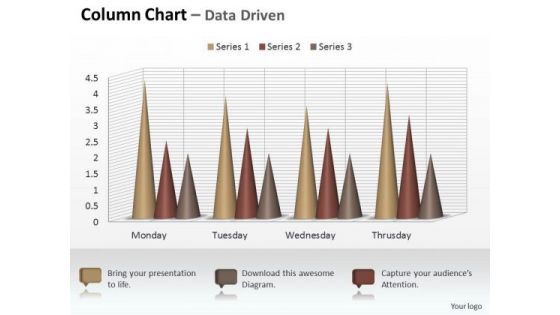
Marketing Data Analysis 3d Sets Of Column Chart PowerPoint Templates
Your Listeners Will Never Doodle. Our marketing data analysis 3d sets of column chart Powerpoint Templates Will Hold Their Concentration.
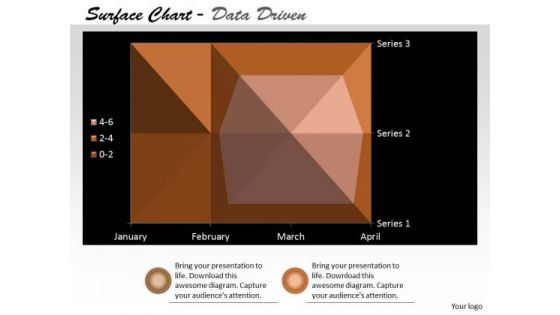
Multivariate Data Analysis Surface Chart Plots Trends PowerPoint Templates
Our multivariate data analysis surface chart plots trends Powerpoint Templates Heighten Concentration. Your Audience Will Be On The Edge.
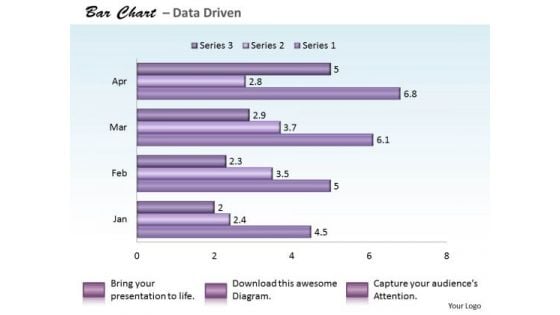
Quantitative Data Analysis Bar Chart For PowerPoint Templates
Reduce The Drag With Our quantitative data analysis bar chart for Powerpoint Templates . Give More Lift To Your Thoughts.

Data Analysis Techniques 3d Effective Display Chart PowerPoint Templates
Dribble Away With Our data analysis techniques 3d effective display chart Powerpoint Templates . Score A Goal With Your Ideas.


 Continue with Email

 Home
Home


