Data Analytics Icons
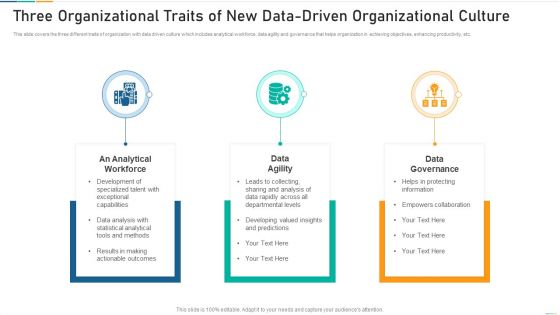
Three Organizational Traits Of New Data Driven Organizational Culture Themes PDF
Persuade your audience using this three organizational traits of new data driven organizational culture themes pdf. This PPT design covers three stages, thus making it a great tool to use. It also caters to a variety of topics including data agility, data governance, an analytical workforce. Download this PPT design now to present a convincing pitch that not only emphasizes the topic but also showcases your presentation skills.
Table Of Contents For Providing HR Service To Improve Management Capabilities And Organizing HR Workflow Procedure Icons PDF
Deliver and pitch your topic in the best possible manner with this table of contents for providing hr service to improve management capabilities and organizing hr workflow procedure icons pdf. Use them to share invaluable insights on technical components, human resources services, dashboard, hr service delivery model and impress your audience. This template can be altered and modified as per your expectations. So, grab it now.
Case Competition Inflated Fuel Price In Logistics Firm Logistics Dashboard For XYZ Logistic Company Product Icons PDF
The slide shows the logistic measurement dashboard for measuring order status, total orders, overdue shipments, global financial performance etc. Deliver and pitch your topic in the best possible manner with this case competition inflated fuel price in logistics firm logistics dashboard for xyz logistic company product icons pdf. Use them to share invaluable insights on overdue to ship, overdue shipments, open pos, late vendor shipments and impress your audience. This template can be altered and modified as per your expectations. So, grab it now.
Acquiring Clients Through Search Engine And Native Ads Dashboard To Track Website Traffic During Performance Icons PDF
This slide showcases dashboard that can help marketers to track the website traffic during execution of performance marketing activities. Its key elements are organic sessions, organic page views, inorganic sessions by month etc. Slidegeeks is here to make your presentations a breeze with Acquiring Clients Through Search Engine And Native Ads Dashboard To Track Website Traffic During Performance Icons PDF With our easy to use and customizable templates, you can focus on delivering your ideas rather than worrying about formatting. With a variety of designs to choose from, you are sure to find one that suits your needs. And with animations and unique photos, illustrations, and fonts, you can make your presentation pop. So whether you are giving a sales pitch or presenting to the board, make sure to check out Slidegeeks first.
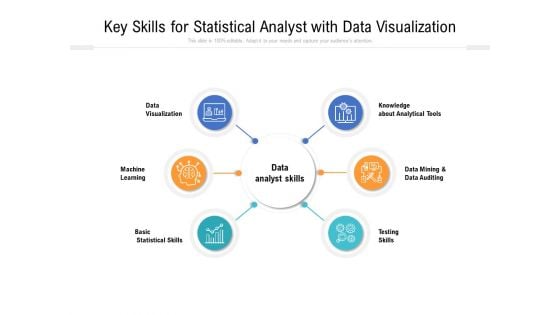
Key Skills For Statistical Analyst With Data Visualization Ppt PowerPoint Presentation Gallery Elements PDF
Presenting key skills for statistical analyst with data visualization ppt powerpoint presentation gallery elements pdf. to dispense important information. This template comprises six stages. It also presents valuable insights into the topics including machine, learning, statistical skills analyst, testing skills, analytical tools, knowledge. This is a completely customizable PowerPoint theme that can be put to use immediately. So, download it and address the topic impactfully.

Business Diagram 3d Pie Chart With Arrows For Data Representation PowerPoint Slide
This business slide displays pie chart with timeline graphics. This diagram has been designed with graphic of with four arrows representing yearly data. Use this diagram, in your presentations to display process steps, stages, for business management.
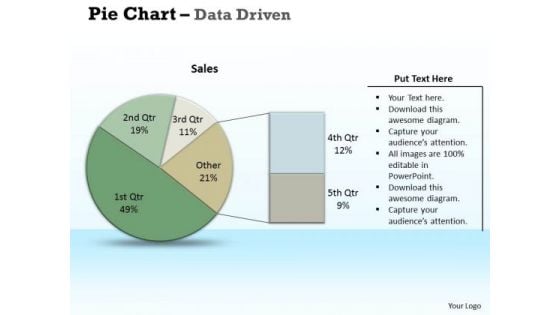
Examples Of Data Analysis Market Driven Pie Chart Research PowerPoint Slides Templates
Chalk It Up With Our examples of data analysis market driven pie chart research powerpoint slides Templates . Add To The Credits Of Your Ideas.
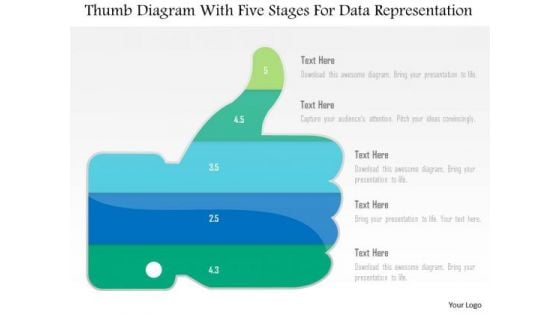
Business Diagram Thumb Diagram With Five Stages For Data Representation PowerPoint Slide
This business diagram displays thumb up with five stages. This diagram contains text boxes for data representation. Use this diagram to display business process workflows in any presentations.
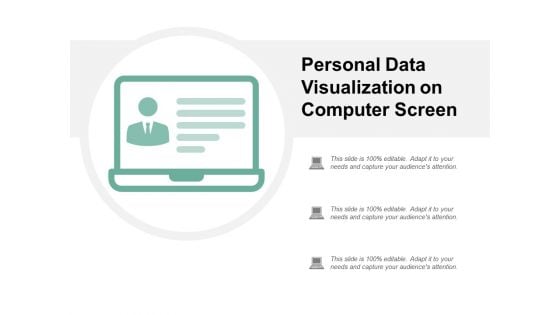
Personal Data Visualization On Computer Screen Ppt PowerPoint Presentation Show Layout Ideas
Presenting this set of slides with name personal data visualization on computer screen ppt powerpoint presentation show layout ideas. This is a one stage process. The stages in this process are data visualization icon, research analysis, business focus. This is a completely editable PowerPoint presentation and is available for immediate download. Download now and impress your audience.

Business Diagram Data Driven Pie Chart Inside The Magnifier PowerPoint Slide
This business slide displays 3d colorful pie graph with magnifier. This diagram is a data visualization tool that gives you a simple way to present statistical information. This slide helps your audience examine and interpret the data you present.
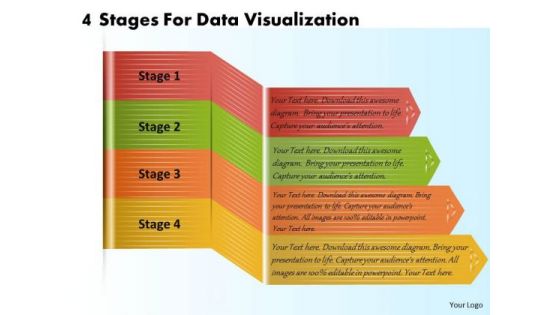
Business Plan And Strategy 4 Stages For Data Visualization Strategic Planning Template Ppt Slide
Your Listeners Will Never Doodle. Our business plan and strategy 4 stages for data visualization strategic planning template ppt slide Powerpoint Templates Will Hold Their Concentration. Do The One Thing With Your Thoughts. Uphold Custom With Our Process and Flows Powerpoint Templates.
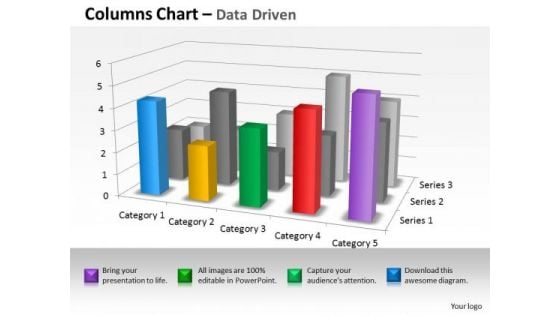
Quantitative Data Analysis 3d Interpretation Of Statistical Quality Control PowerPoint Templates
Land The Idea With Our quantitative data analysis 3d interpretation of statistical quality control Powerpoint Templates . Help It Grow With Your Thoughts.
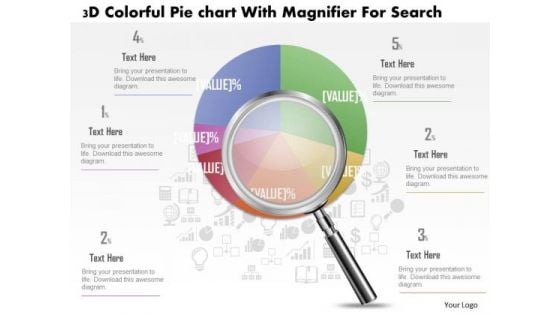
Business Diagram 3d Colorful Pie Graph With Magnifier Data Search PowerPoint Slide
This business slide displays 3d colorful pie graph with magnifier. This diagram is a data visualization tool that gives you a simple way to present statistical information. This slide helps your audience examine and interpret the data you present.
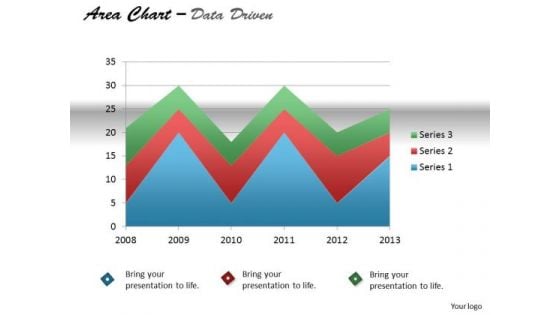
Quantitative Data Analysis Driven Display Series With Area Chart PowerPoint Slides Templates
Our quantitative data analysis driven display series with area chart powerpoint slides Templates Enjoy Drama. They Provide Entertaining Backdrops.
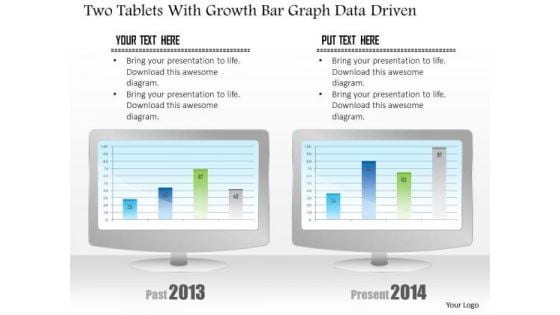
Business Diagram Two Tablets With Growth Bar Graph Data Driven PowerPoint Slide
This business diagram has been designed with comparative charts on tablets. This slide suitable for data representation. You can also use this slide to present business reports and information. Use this diagram to present your views in a wonderful manner.
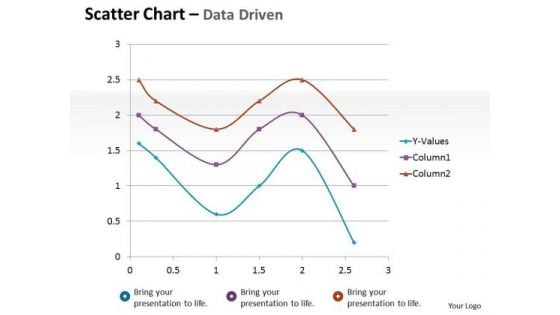
Financial Data Analysis Driven Scatter Chart Mathematical Diagram PowerPoint Slides Templates
Dominate Proceedings With Your Ideas. Our financial data analysis driven scatter chart mathematical diagram powerpoint slides Templates Will Empower Your Thoughts.
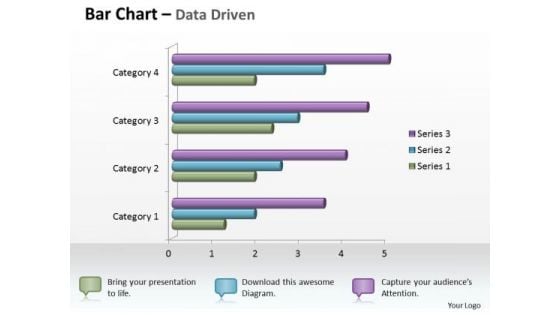
Data Analysis In Excel 3d Bar Chart For Business Statistics PowerPoint Templates
Knock On The Door To Success With Our data analysis in excel 3d bar chart for business statistics Powerpoint Templates . Be Assured Of Gaining Entry.
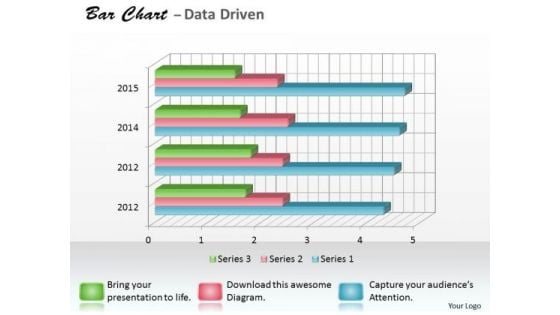
Data Analysis Programs 3d Bar Chart For Research In Statistics PowerPoint Templates
Draw It Out On Our data analysis programs 3d bar chart for research in statistics Powerpoint Templates . Provide Inspiration To Your Colleagues.
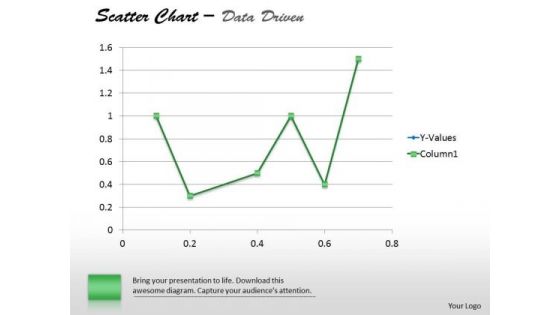
Financial Data Analysis Driven Demonstrate Statistics With Scatter Chart PowerPoint Slides Templates
Establish The Dominance Of Your Ideas. Our financial data analysis driven demonstrate statistics with scatter chart powerpoint slides Templates Will Put Them On Top.
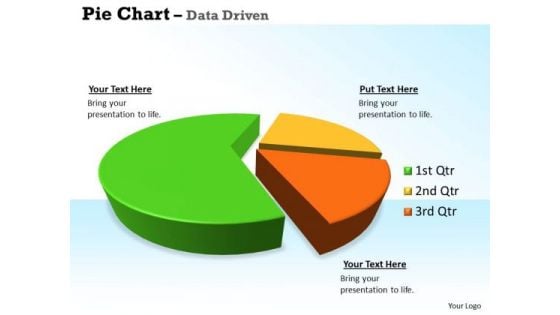
Quantitative Data Analysis 3d Pie Chart For Business Statistics PowerPoint Templates
Our quantitative data analysis 3d pie chart for business statistics Powerpoint Templates Allow You To Do It With Ease. Just Like Picking The Low Hanging Fruit.
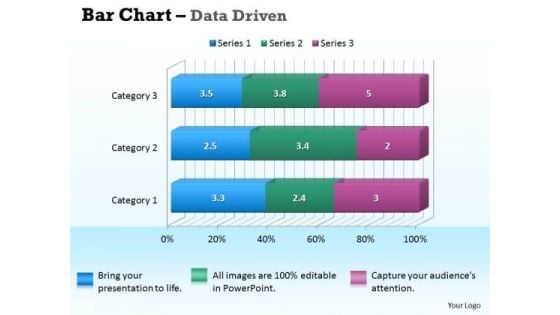
Data Analysis In Excel 3d Bar Chart For Business Information PowerPoint Templates
Our data analysis in excel 3d bar chart for business information Powerpoint Templates Deliver At Your Doorstep. Let Them In For A Wonderful Experience.
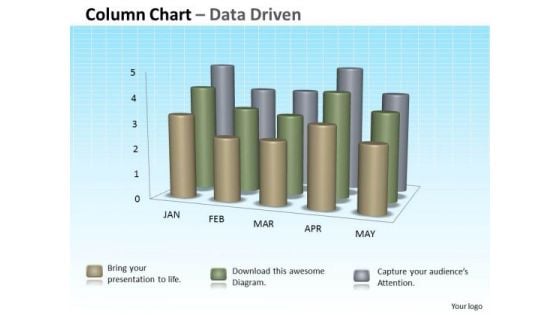
Data Analysis In Excel 3d Column Chart For Sets Of Information PowerPoint Templates
Double The Impact With Our data analysis in excel 3d column chart for sets of information Powerpoint Templates . Your Thoughts Will Have An Imposing Effect.
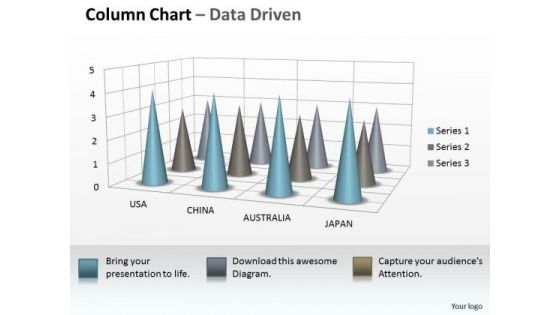
Data Analysis On Excel 3d Chart To Incorporate Business Information PowerPoint Templates
Our data analysis on excel 3d chart to incorporate business information Powerpoint Templates Allow You To Do It With Ease. Just Like Picking The Low Hanging Fruit.
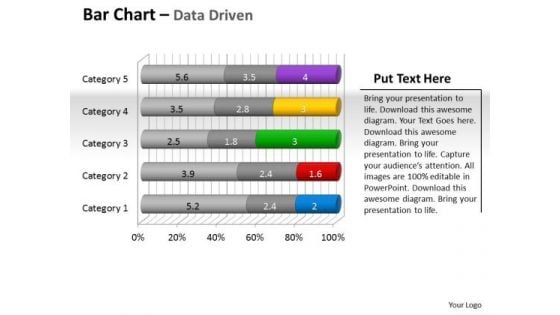
Data Analysis Programs 3d Bar Chart To Put Information PowerPoint Templates
Draw Up Your Agenda On Our data analysis programs 3d bar chart to put information Powerpoint Templates . Coax Your Audience Into Acceptance.
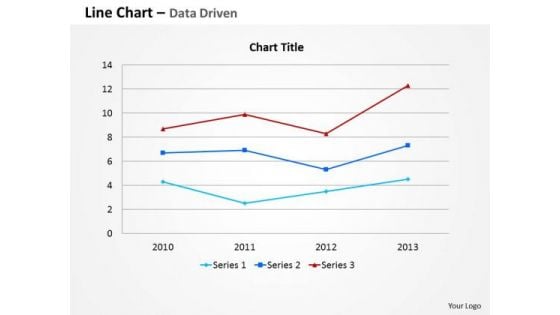
Data Analysis Template Driven Line Chart For Business Information PowerPoint Slides Templates
Your Thoughts Are Dripping With Wisdom. Lace It With Our data analysis template driven line chart for business information powerpoint slides Templates .
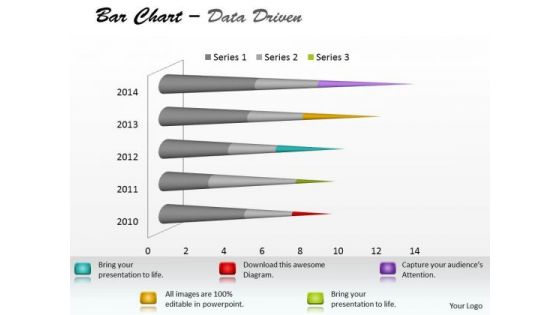
Microsoft Excel Data Analysis Bar Chart To Communicate Information PowerPoint Templates
With Our microsoft excel data analysis bar chart to communicate information Powerpoint Templates You Will Be Doubly Sure. They Possess That Stamp Of Authority.

Data Analysis Excel 3d Pie Chart For Marketing Process PowerPoint Templates
Our data analysis excel 3d pie chart for marketing process Powerpoint Templates Team Are A Dogged Lot. They Keep At It Till They Get It Right.
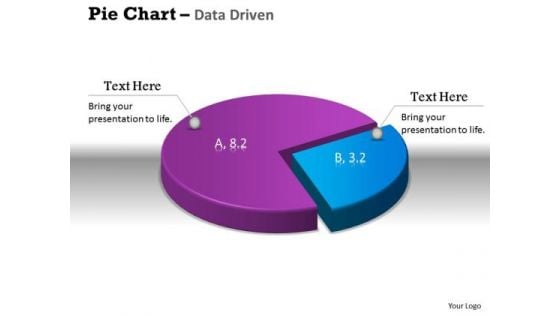
Data Analysis Excel 3d Pie Chart Shows Relative Size Of PowerPoint Templates
Get The Doers Into Action. Activate Them With Our data analysis excel 3d pie chart shows relative size of Powerpoint Templates.
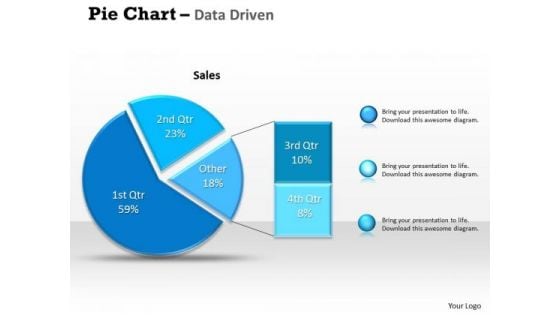
Data Analysis Excel Driven Percentage Breakdown Pie Chart PowerPoint Slides Templates
Be A Donor Of Great Ideas. Display Your Charity On Our data analysis excel driven percentage breakdown pie chart powerpoint slides Templates.
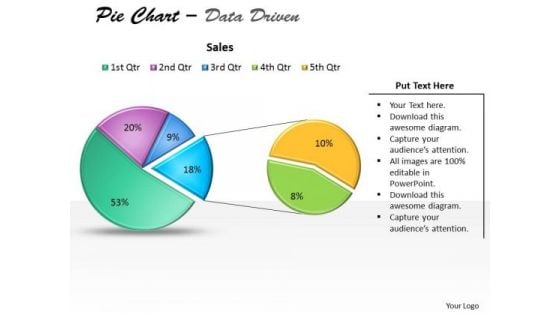
Data Analysis Excel Driven Pie Chart For Business Stratregy PowerPoint Slides Templates
Open Up Doors That Lead To Success. Our data analysis excel driven pie chart for business stratregy powerpoint slides Templates Provide The Handles.

Data Analysis Excel Driven Pie Chart For Easy Comparison PowerPoint Slides Templates
Our data analysis excel driven pie chart for easy comparison powerpoint slides Templates Abhor Doodling. They Never Let The Interest Flag.
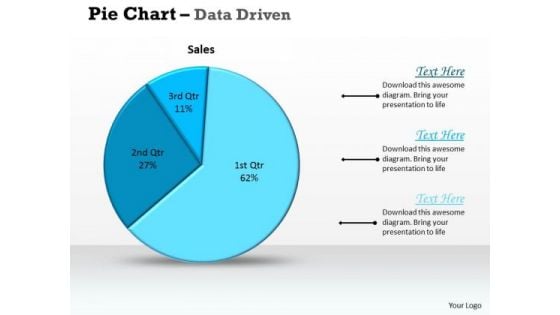
Data Analysis Excel Driven Pie Chart For Sales Process PowerPoint Slides Templates
Deliver The Right Dose With Our data analysis excel driven pie chart for sales process powerpoint slides Templates . Your Ideas Will Get The Correct Illumination.
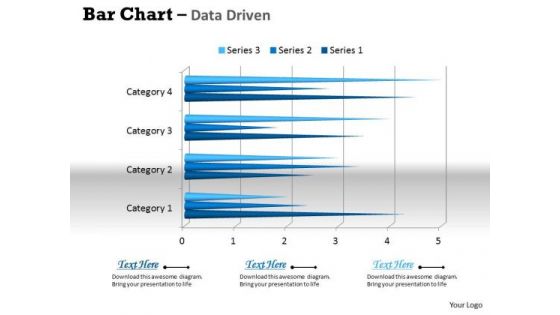
Data Analysis In Excel 3d Bar Chart For Business Trends PowerPoint Templates
Connect The Dots With Our data analysis in excel 3d bar chart for business trends Powerpoint Templates . Watch The Whole Picture Clearly Emerge.
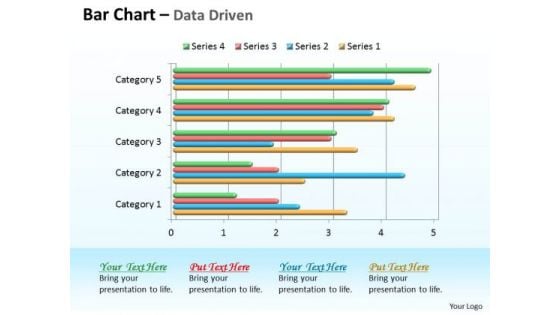
Data Analysis In Excel 3d Bar Chart For Comparison Of Time Series PowerPoint Templates
Double Your Chances With Our data analysis in excel 3d bar chart for comparison of time series Powerpoint Templates . The Value Of Your Thoughts Will Increase Two-Fold.
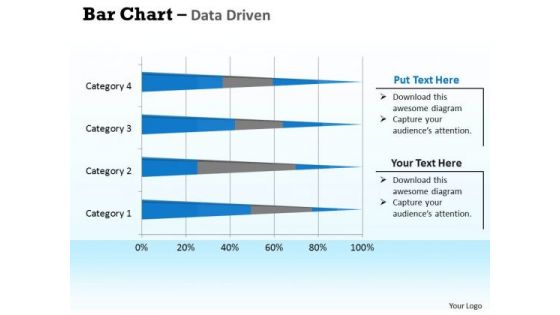
Data Analysis In Excel 3d Bar Chart For Interpretation PowerPoint Templates
Double Up Our data analysis in excel 3d bar chart for interpretation Powerpoint Templates With Your Thoughts. They Will Make An Awesome Pair.
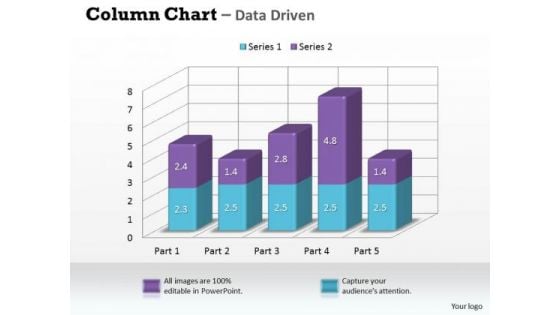
Data Analysis In Excel 3d Column Chart For Market Surveys PowerPoint Templates
Our data analysis in excel 3d column chart for market surveys Powerpoint Templates Leave No One In Doubt. Provide A Certainty To Your Views.
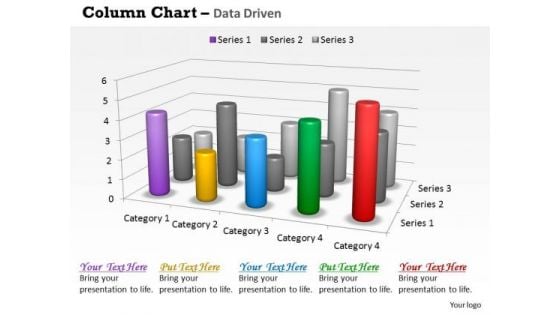
Data Analysis In Excel 3d Survey For Sales Chart PowerPoint Templates
Good Camaraderie Is A Key To Teamwork. Our data analysis in excel 3d survey for sales chart Powerpoint Templates Can Be A Cementing Force.
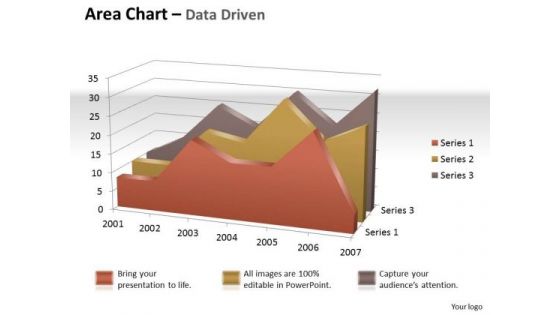
Data Analysis In Excel 3d Visual Display Of Area Chart PowerPoint Templates
Brace Yourself, Arm Your Thoughts. Prepare For The Hustle With Our data analysis in excel 3d visual display of area chart Powerpoint Templates .
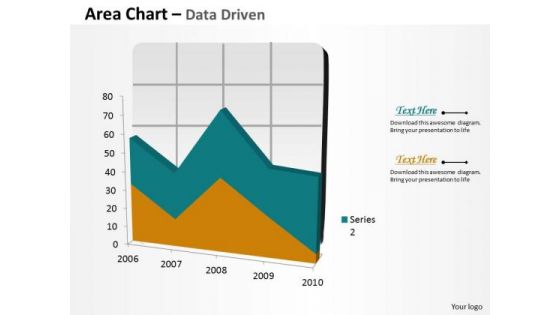
Data Analysis In Excel Area Chart For Business Process PowerPoint Templates
Your Grasp Of Economics Is Well Known. Help Your Audience Comprehend Issues With Our data analysis in excel area chart for business process Powerpoint Templates .
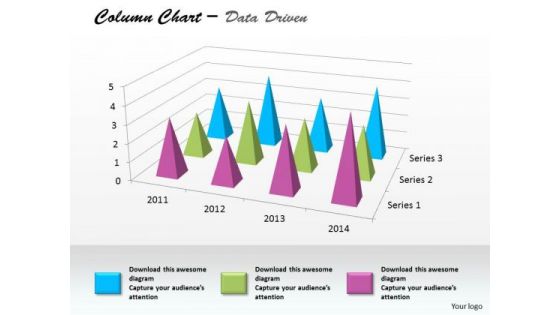
Data Analysis In Excel Column Chart For Business Project PowerPoint Templates
Edit Your Work With Our data analysis in excel column chart for business project Powerpoint Templates . They Will Help You Give The Final Form.
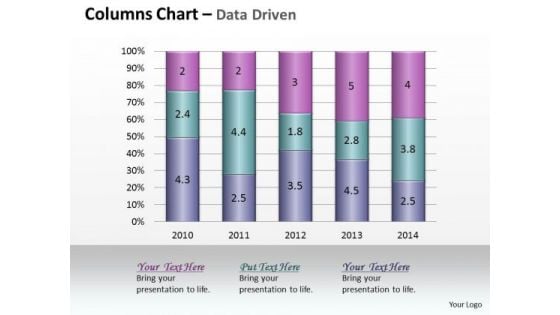
Data Analysis In Excel Column Chart Of Various Fields PowerPoint Templates
Land The Idea With Our data analysis in excel column chart of various fields Powerpoint Templates . Help It Grow With Your Thoughts.
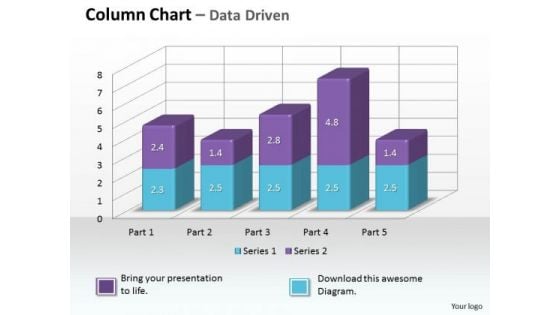
Data Analysis On Excel 3d Chart To Monitor Business Process PowerPoint Templates
Make Some Dough With Our data analysis on excel 3d chart to monitor business process Powerpoint Templates . Your Assets Will Rise Significantly.
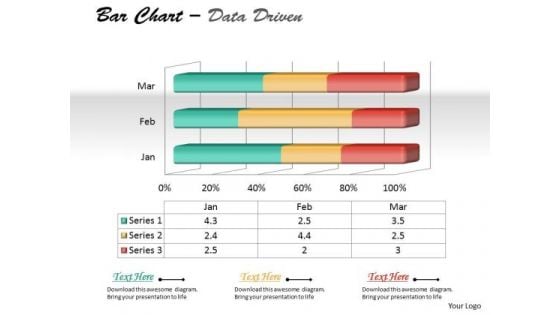
Data Analysis On Excel 3d Chart To Represent Quantitative Differences PowerPoint Templates
Draft It Out On Our data analysis on excel 3d chart to represent quantitative differences Powerpoint Templates . Give The Final Touches With Your Ideas.
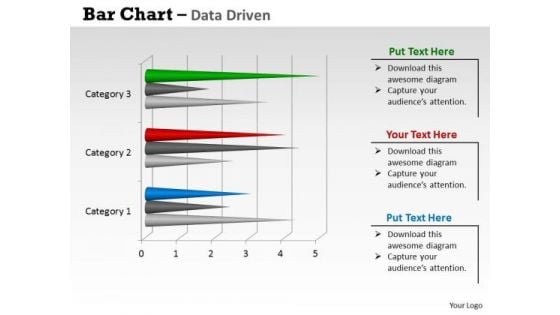
Data Analysis On Excel 3d Chart With Sets Of PowerPoint Templates
Reduce The Drag With Our data analysis on excel 3d chart with sets of Powerpoint Templates . Give More Lift To Your Thoughts.
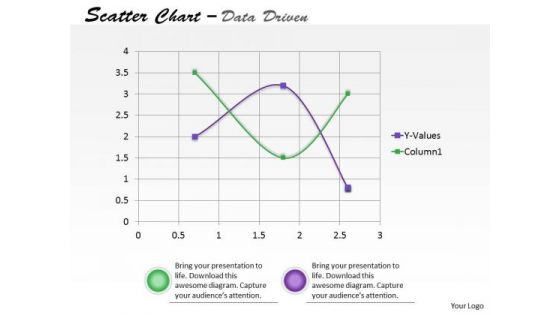
Data Analysis On Excel Driven Scatter Chart To Predict Future Movements PowerPoint Slides Templates
Our data analysis on excel driven scatter chart to predict future movements powerpoint slides Templates Enjoy Drama. They Provide Entertaining Backdrops.
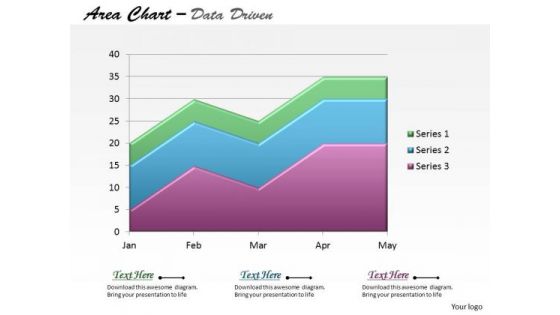
Data Analysis On Excel Driven Stacked Area Chart PowerPoint Slides Templates
Be The Dramatist With Our data analysis on excel driven stacked area chart powerpoint slides Templates . Script Out The Play Of Words.
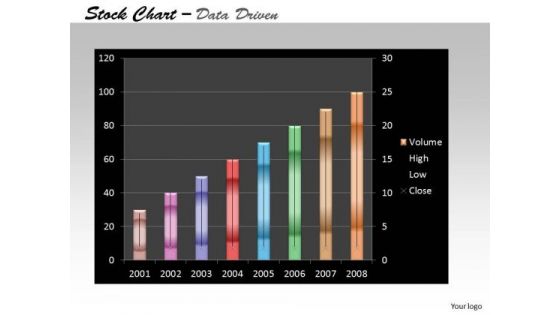
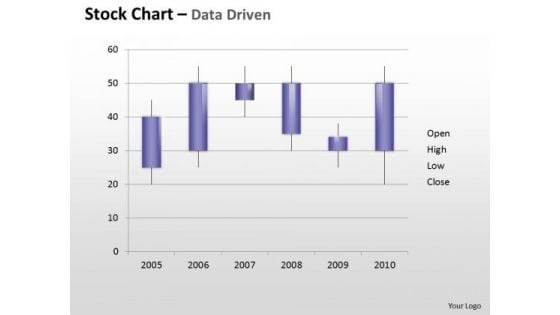
Data Analysis On Excel Driven Stock Chart For Business Growth PowerPoint Slides Templates
Add Some Dramatization To Your Thoughts. Our data analysis on excel driven stock chart for business growth powerpoint slides Templates Make Useful Props.
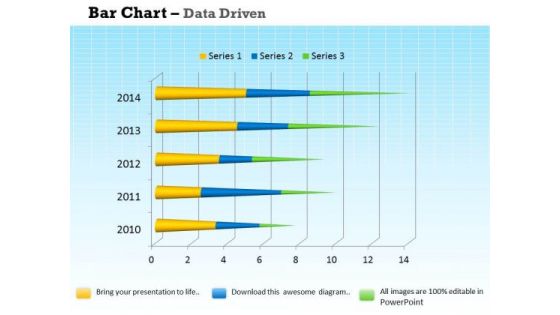
Data Analysis Programs 3d Bar Chart For Market Surveys PowerPoint Templates
Draw On The Experience Of Our data analysis programs 3d bar chart for market surveys Powerpoint Templates . They Imbibe From Past Masters.
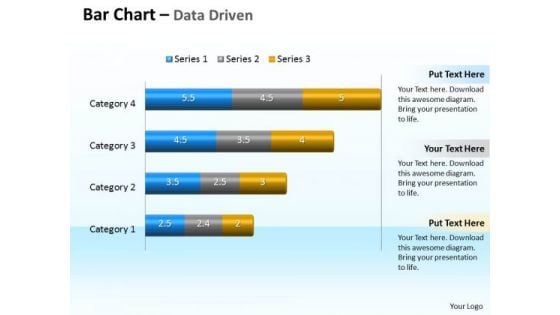
Data Analysis Programs 3d Bar Chart To Compare Categories PowerPoint Templates
Discover Decisive Moments With Our data analysis programs 3d bar chart to compare categories Powerpoint Templates . They Help Make That Crucial Difference.
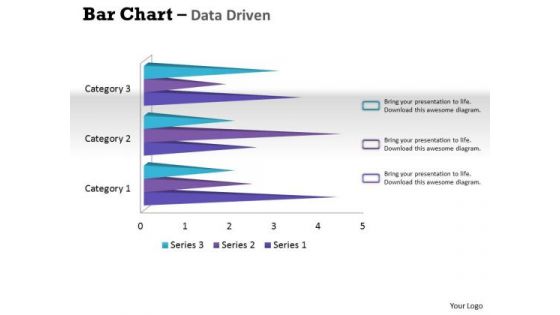
Data Analysis Techniques 3d Bar Chart For Financial Solutions PowerPoint Templates
Make Your Dreams A Reality With Our data analysis techniques 3d bar chart for financial solutions Powerpoint Templates . Your Ideas Will Begin To Take Shape.

Data Analysis Template Driven Express Business Facts Pie Chart PowerPoint Slides Templates
Display Your Drive On Our data analysis template driven express business facts pie chart powerpoint slides Templates . Invigorate The Audience With Your Fervor.
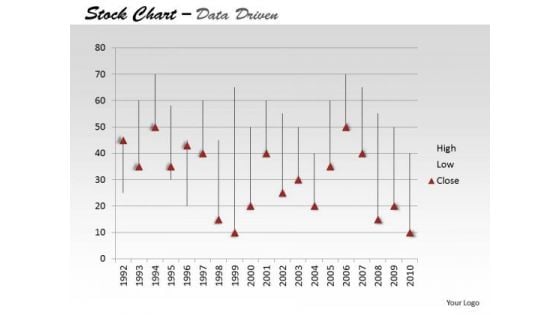
Data Analysis Template Driven Ineract With Stock Chart PowerPoint Slides Templates
Drive Your Passion With Our data analysis template driven ineract with stock chart powerpoint slides Templates . Steer Yourself To Achieve Your Aims.
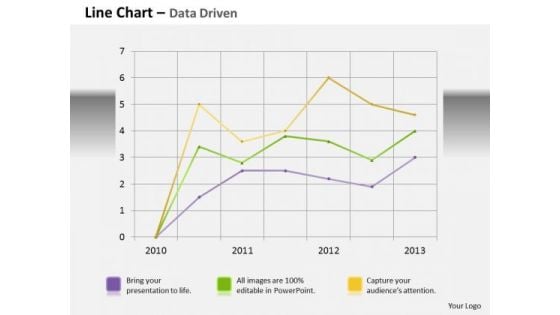
Data Analysis Template Driven Line Chart Business Graph PowerPoint Slides Templates
Bottle Your Thoughts In Our data analysis template driven line chart business graph powerpoint slides Templates . Pass It Around For Your Audience To Sip.
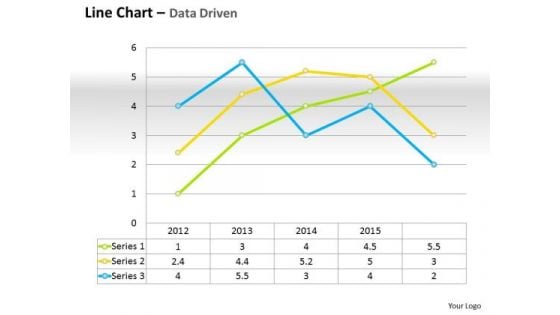
Data Analysis Template Driven Line Chart For Business Performance PowerPoint Slides Templates
Do Not Allow Things To Drift. Ring In Changes With Our data analysis template driven line chart for business performance powerpoint slides Templates .
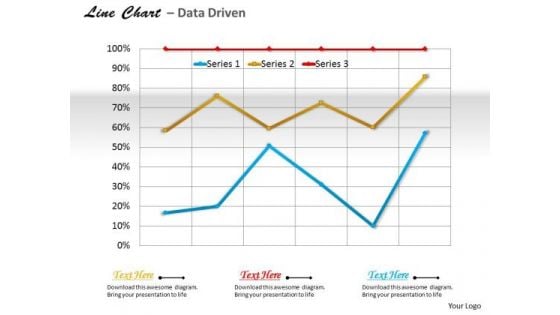
Data Analysis Template Driven Line Chart For Business Trends PowerPoint Slides Templates
Use Our data analysis template driven line chart for business trends powerpoint slides Templates As The Bit. Drill Your Thoughts Into Their Minds.
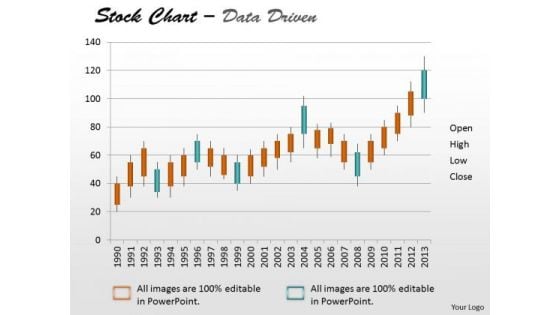
Data Analysis Template Driven Stock Chart For Market Trends PowerPoint Slides Templates
Drive Your Team Along The Road To Success. Take The Wheel With Our data analysis template driven stock chart for market trends powerpoint slides Templates .
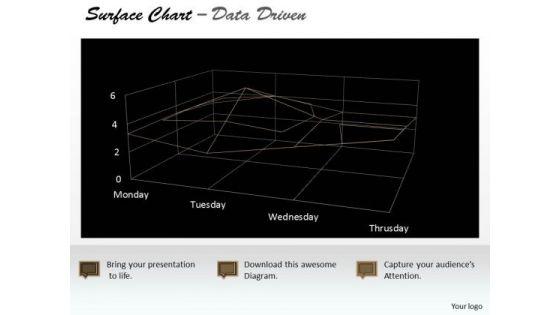
Data Analysis Template Driven Surface Chart Indicating Areas PowerPoint Slides Templates
Highlight Your Drive With Our data analysis template driven surface chart indicating areas powerpoint slides Templates . Prove The Fact That You Have Control.
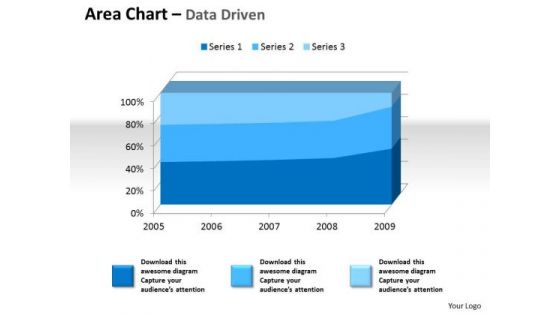
Examples Of Data Analysis Market 3d Area Chart For Quantiative PowerPoint Templates
Drum It Up With Our examples of data analysis market 3d area chart for quantiative Powerpoint Templates . Your Thoughts Will Raise The Tempo.
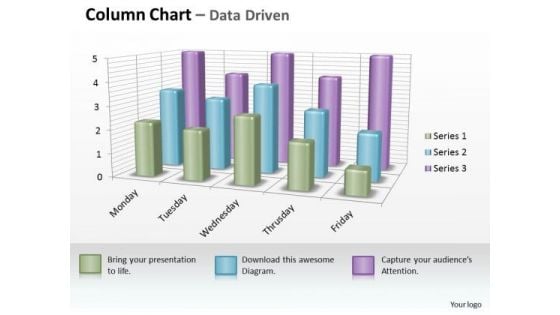
Examples Of Data Analysis Market 3d Business Inspection Procedure Chart PowerPoint Templates
However Dry Your Topic Maybe. Make It Catchy With Our examples of data analysis market 3d business inspection procedure chart Powerpoint Templates .
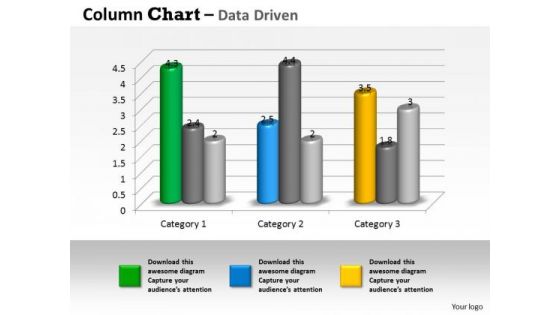
Examples Of Data Analysis Market 3d Business Trend Series Chart PowerPoint Templates
Duct It Through With Our examples of data analysis market 3d business trend series chart Powerpoint Templates . Your Ideas Will Reach Into Their Minds Intact.
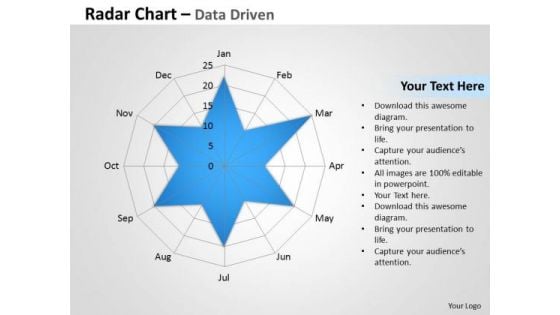
Examples Of Data Analysis Market Driven Radar Chart To Compare PowerPoint Slides Templates
Rely On Our examples of data analysis market driven radar chart to compare powerpoint slides Templates In Any Duel. They Will Drive Home Your Point.
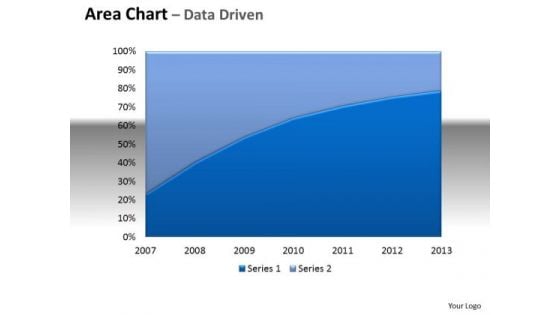
Financial Data Analysis Area Chart With Plotted Line Center PowerPoint Templates
Be The Doer With Our financial data analysis area chart with plotted line center Powerpoint Templates . Put Your Thoughts Into Practice.
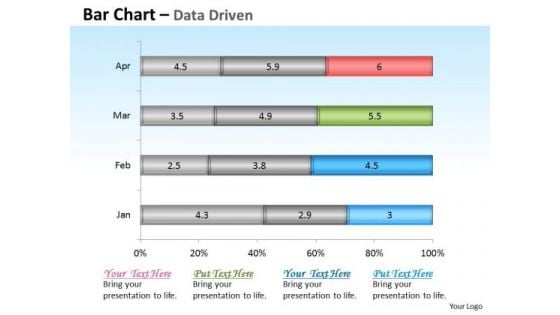
Financial Data Analysis Driven Base Bar Chart Design PowerPoint Slides Templates
Get The Domestics Right With Our financial data analysis driven base bar chart design powerpoint slides Templates . Create The Base For Thoughts To Grow.
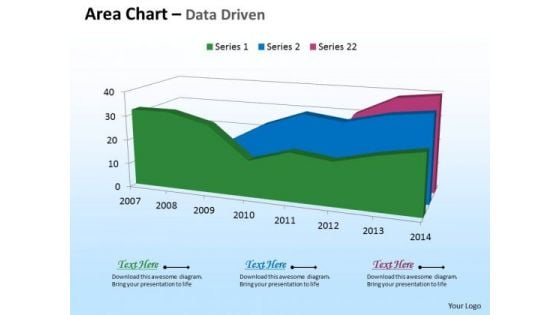
Microsoft Excel Data Analysis 3d Area Chart For Time Based PowerPoint Templates
Deliver The Right Dose With Our microsoft excel data analysis 3d area chart for time based Powerpoint Templates . Your Ideas Will Get The Correct Illumination.
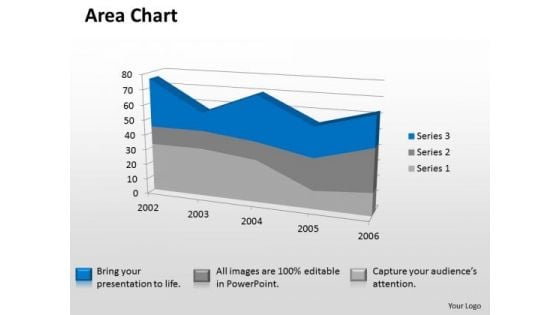
Microsoft Excel Data Analysis 3d Area Chart Showimg Change In Values PowerPoint Templates
Our microsoft excel data analysis 3d area chart showimg change in values Powerpoint Templates Deliver At Your Doorstep. Let Them In For A Wonderful Experience.
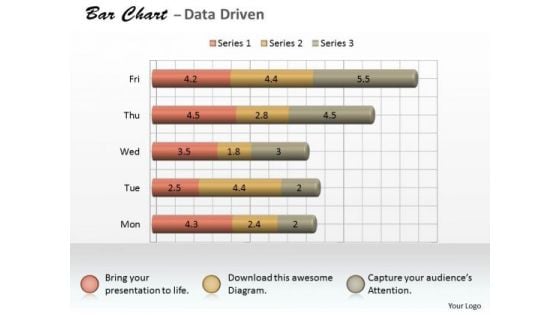
Microsoft Excel Data Analysis 3d Bar Chart As Research Tool PowerPoint Templates
Knock On The Door To Success With Our microsoft excel data analysis 3d bar chart as research tool Powerpoint Templates . Be Assured Of Gaining Entry.
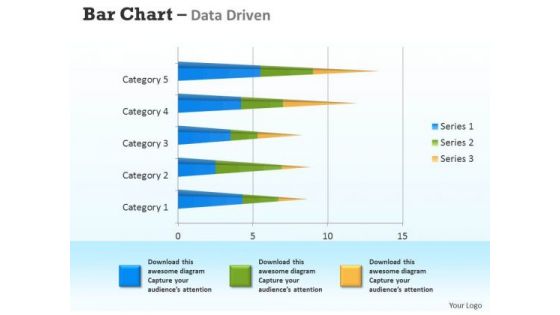
Microsoft Excel Data Analysis 3d Bar Chart For Analyzing Survey PowerPoint Templates
Connect The Dots With Our microsoft excel data analysis 3d bar chart for analyzing survey Powerpoint Templates . Watch The Whole Picture Clearly Emerge.
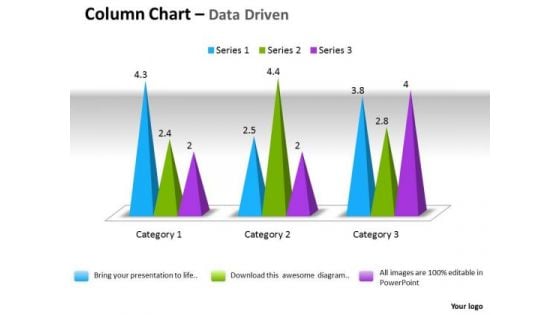
Microsoft Excel Data Analysis 3d Change In Business Process Chart PowerPoint Templates
Double Your Chances With Our microsoft excel data analysis 3d change in business process chart Powerpoint Templates . The Value Of Your Thoughts Will Increase Two-Fold.
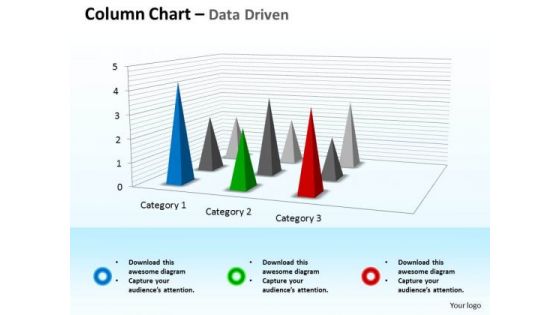
Microsoft Excel Data Analysis 3d Chart For Business Observation PowerPoint Templates
Double Up Our microsoft excel data analysis 3d chart for business observation Powerpoint Templates With Your Thoughts. They Will Make An Awesome Pair.
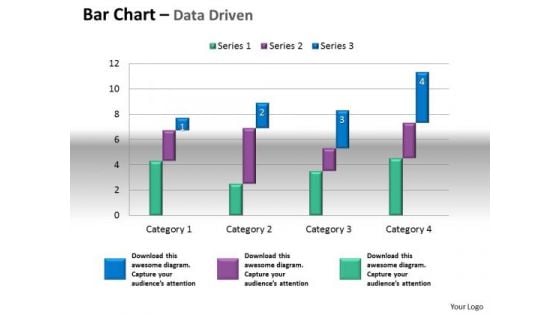
Microsoft Excel Data Analysis Bar Chart To Compare Quantities PowerPoint Templates
Our microsoft excel data analysis bar chart to compare quantities Powerpoint Templates Leave No One In Doubt. Provide A Certainty To Your Views.
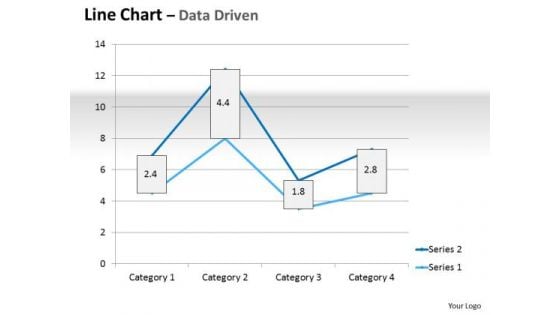
Multivariate Data Analysis Driven Line Chart Market Graph PowerPoint Slides Templates
Plan For All Contingencies With Our multivariate data analysis driven line chart market graph powerpoint slides Templates . Douse The Fire Before It Catches.
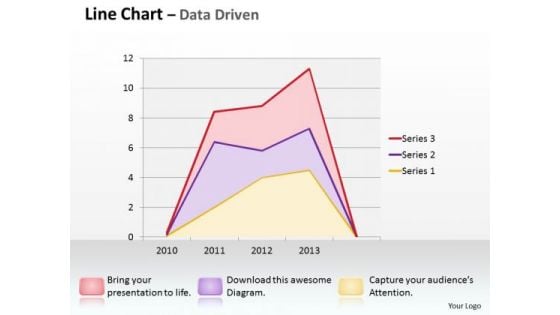
Multivariate Data Analysis Driven Line Chart Shows Revenue Trends PowerPoint Slides Templates
Good Camaraderie Is A Key To Teamwork. Our multivariate data analysis driven line chart shows revenue trends powerpoint slides Templates Can Be A Cementing Force.
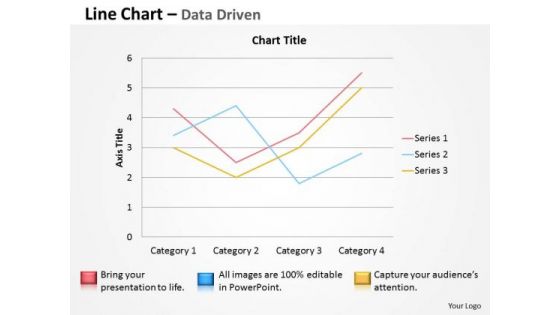
Multivariate Data Analysis Driven Line Chart To Demonstrate PowerPoint Slides Templates
Brace Yourself, Arm Your Thoughts. Prepare For The Hustle With Our multivariate data analysis driven line chart to demonstrate powerpoint slides Templates .
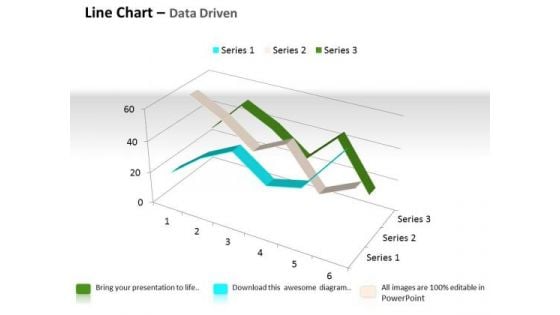
Quantitative Data Analysis 3d Line Chart For Comparison Of PowerPoint Templates
Touch Base With Our quantitative data analysis 3d line chart for comparison of Powerpoint Templates . Review Your Growth With Your Audience.

Quantitative Data Analysis 3d Pie Chart For Business Process PowerPoint Templates
Put Them On The Same Page With Our quantitative data analysis 3d pie chart for business process Powerpoint Templates . Your Team Will Sing From The Same Sheet.
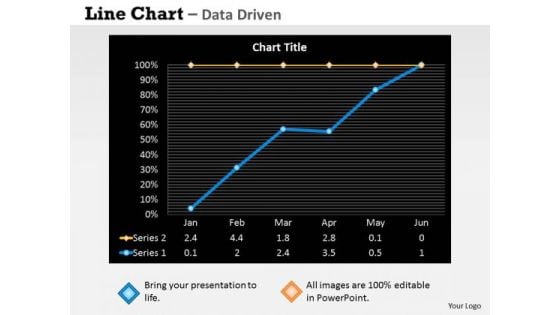
Quantitative Data Analysis Driven Economic Status Line Chart PowerPoint Slides Templates
Be The Dramatist With Our quantitative data analysis driven economic status line chart powerpoint slides Templates . Script Out The Play Of Words.
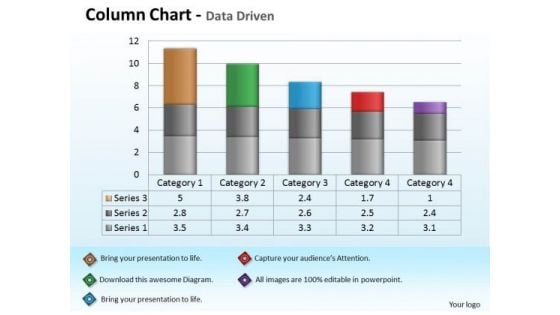
Quantitative Data Analysis Driven Economic With Column Chart PowerPoint Slides Templates
Add Some Dramatization To Your Thoughts. Our quantitative data analysis driven economic with column chart powerpoint slides Templates Make Useful Props.

Data Analysis On Excel Driven Sets Of Business Information PowerPoint Slides Templates
Break The Deadlock With Our data analysis on excel driven sets of business information powerpoint slides Templates . Let The Words Start To Flow.
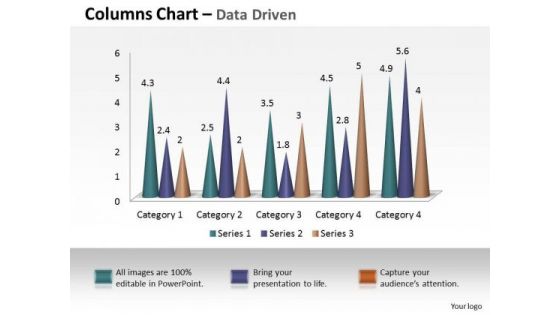
Examples Of Data Analysis Market 3d Business Intelligence And PowerPoint Templates
Our examples of data analysis market 3d business intelligence and Powerpoint Templates Are Dual Purpose. They Help Instruct And Inform At The Same Time.
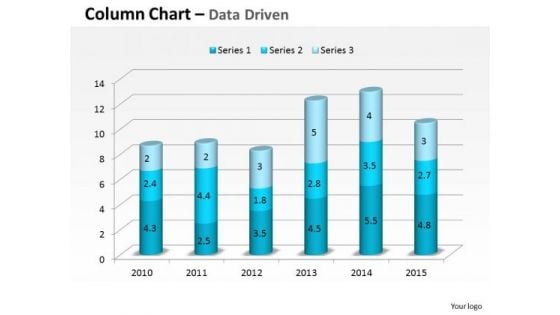
Data Analysis In Excel 3d Compare Yearly Business Performance PowerPoint Templates
Plan For All Contingencies With Our data analysis in excel 3d compare yearly business performance Powerpoint Templates . Douse The Fire Before It Catches.
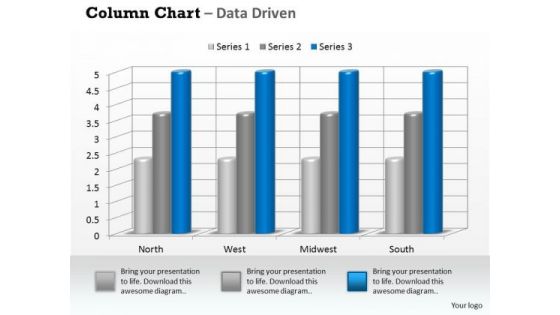
Examples Of Data Analysis Market 3d Business On Regular Intervals PowerPoint Templates
Drum It Out Loud And Clear On Our examples of data analysis market 3d business on regular intervals Powerpoint Templates . Your Words Will Ring In Their Ears.
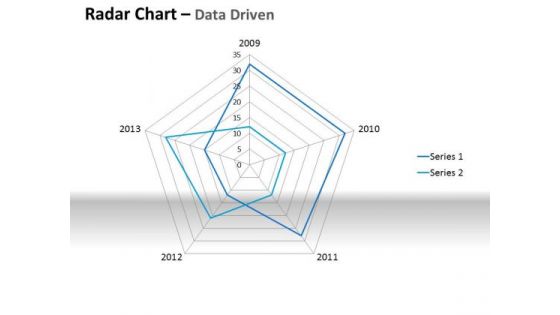
Examples Of Data Analysis Market Driven Plotting The Business Values PowerPoint Slides Templates
Ring The Duck With Our examples of data analysis market driven plotting the business values powerpoint slides Templates . Acquire The Points With Your Ideas.
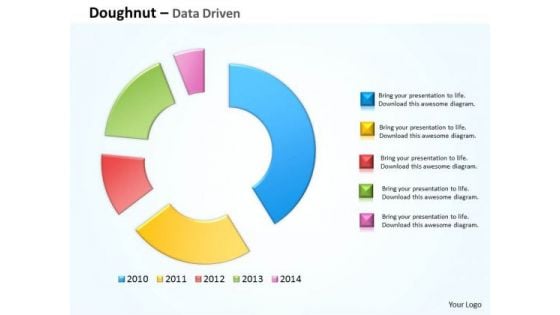
Financial Data Analysis Driven Compare Market Share Of Brand PowerPoint Templates
Doll Up Your Thoughts With Our financial data analysis driven compare market share of brand Powerpoint Templates . They Will Make A Pretty Picture.
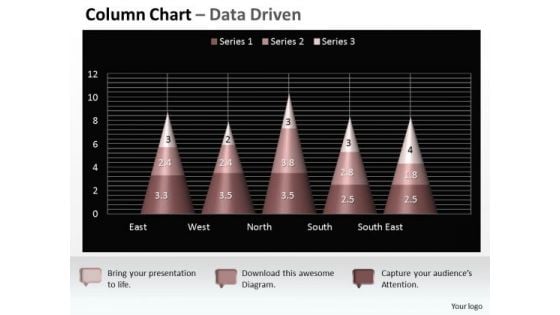
Data Analysis On Excel 3d Chart Shows Interrelated Sets Of PowerPoint Templates
Put Them On The Same Page With Our data analysis on excel 3d chart shows interrelated sets of Powerpoint Templates . Your Team Will Sing From The Same Sheet.
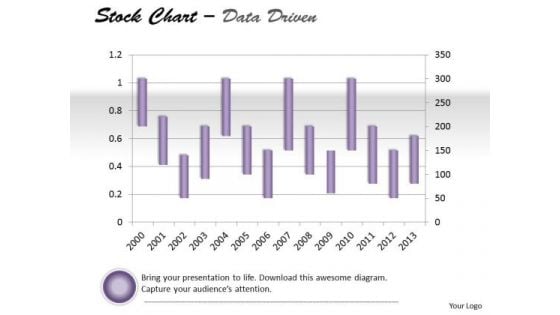
Data Analysis On Excel Driven Stock Chart For Market History PowerPoint Slides Templates
Draw Out The Best In You With Our data analysis on excel driven stock chart for market history powerpoint slides Templates . Let Your Inner Brilliance Come To The Surface.
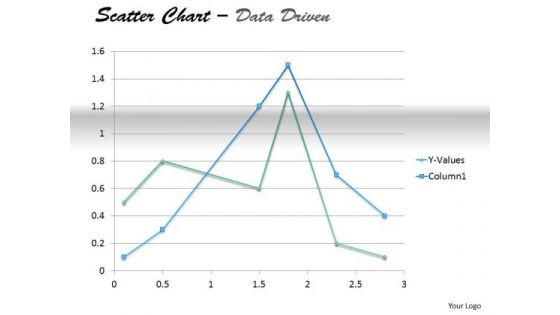
Examples Of Data Analysis Market Driven Present In Scatter Chart PowerPoint Slides Templates
Your Thoughts Will Take To Our examples of data analysis market driven present in scatter chart powerpoint slides Templates Like A Duck To Water. They Develop A Binding Affinity.
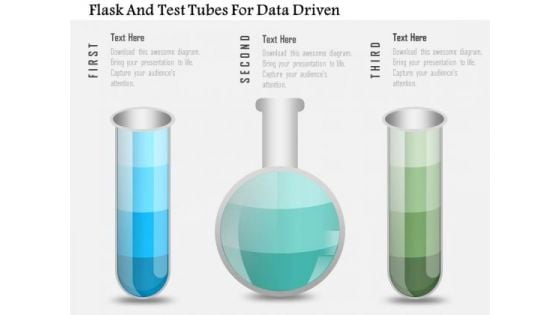
Business Diagram Flask And Test Tubes For Data Driven PowerPoint Slide
This data driven diagram has been designed with flask and test tubes. Download this diagram to give your presentations more effective look. It helps in clearly conveying your message to clients and audience.

Various Stages Data Extraction Process Flow Chart Ppt PowerPoint Presentation Pictures Show PDF
Persuade your audience using this various stages data extraction process flow chart ppt powerpoint presentation pictures show pdf. This PPT design covers five stages, thus making it a great tool to use. It also caters to a variety of topics including interpretation evaluation, data mining, transformation, preprocessing, selection, target data, preprocessed data, transformed data, patterns, knowledge. Download this PPT design now to present a convincing pitch that not only emphasizes the topic but also showcases your presentation skills.
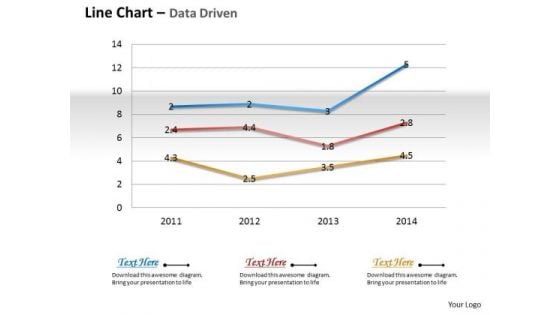
Business Data Analysis Chart Shows Changes Over The Time PowerPoint Templates
Document The Process On Our business data analysis chart shows changes over the time Powerpoint Templates. Make A Record Of Every Detail.
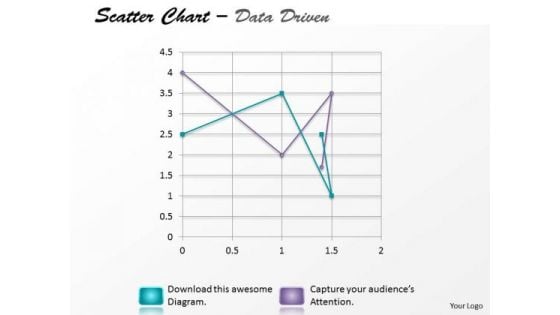
Data Analysis Excel Driven Multiple Series Scatter Chart PowerPoint Slides Templates
Your Listeners Will Never Doodle. Our data analysis excel driven multiple series scatter chart powerpoint slides Templates Will Hold Their Concentration.

Business Diagram Data Driven Bar Graph And Pie Chart For Analysis PowerPoint Slide
This PowerPoint template displays technology gadgets with various business charts. Use this diagram slide, in your presentations to make business reports for statistical analysis. You may use this diagram to impart professional appearance to your presentations.
Magnifying Glass Ppt PowerPoint Presentation Icon Good
This is a magnifying glass ppt powerpoint presentation icon good. This is a five stage process. The stages in this process are magnifying glass, process, icons, marketing, business.
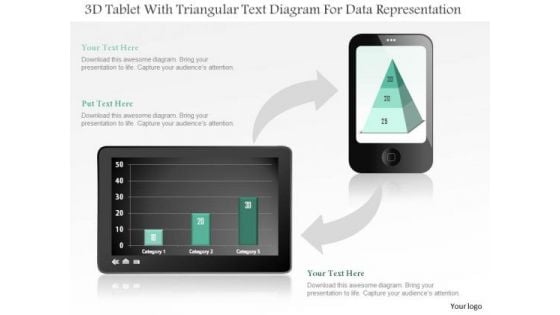
Business Diagram 3d Tablet With Triangular Text Diagram For Data Representation PowerPoint Slide
This business diagram displays bar graph on tablet and pyramid chart on mobile phone. Use this diagram, to make reports for interactive business presentations. Create professional presentations using this diagram.
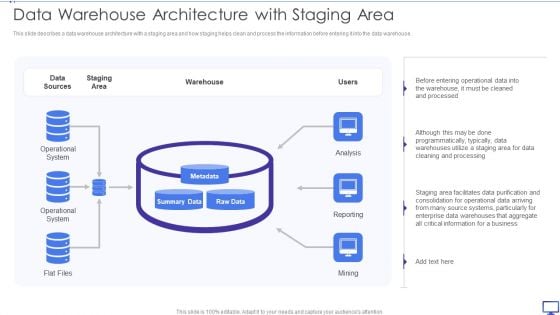
Decision Support System Data Warehouse Architecture With Staging Area Diagrams PDF
This slide describes a data warehouse architecture with a staging area and how staging helps clean and process the information before entering it into the data warehouse. This is a Decision Support System Data Warehouse Architecture With Staging Area Diagrams PDF template with various stages. Focus and dispense information on one stages using this creative set, that comes with editable features. It contains large content boxes to add your information on topics like Data Sources, Staging Area, Operational System. You can also showcase facts, figures, and other relevant content using this PPT layout. Grab it now.

Business Diagram Four Pie Chart For Data Driven Result Analysis Of Business PowerPoint Slide
This business diagram displays graphic of pie charts in shape of flasks. This business slide is suitable to present and compare business data. Use this diagram to build professional presentations for your viewers.
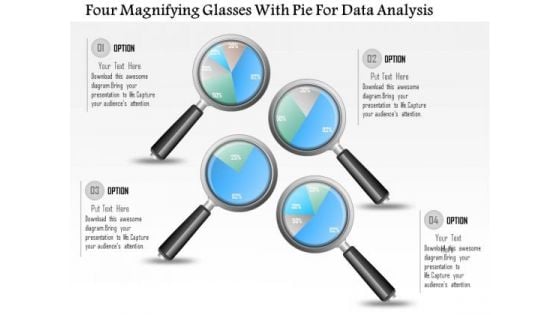
Business Diagram Four Magnifying Glasses With Pie For Data Analysis PowerPoint Slide
This business diagram displays graphic of pie charts in shape of magnifying glasses This business slide is suitable to present and compare business data. Use this diagram to build professional presentations for your viewers.

Business Diagram Three Heads With Pie For Data Driven Technology PowerPoint Slide
This business diagram displays three human faces with pie charts. This Power Point template has been designed to compare and present business data. You may use this diagram to impart professional appearance to your presentations.
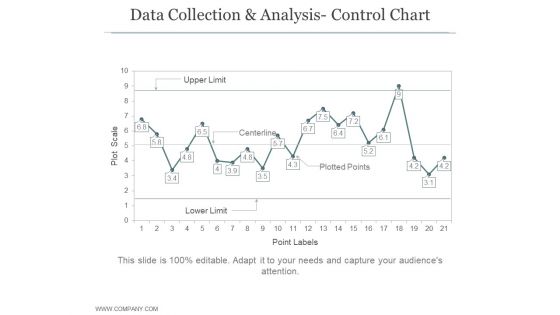
Data Collection And Analysis Control Chart Ppt PowerPoint Presentation Example File
This is a data collection and analysis control chart ppt powerpoint presentation example file. This is a four stage process. The stages in this process are business, strategy, marketing, bar graph, growth strategy.

Data Server Room With Computer Mainframe With Neon Lights Ppt PowerPoint Presentation Inspiration Grid PDF
Presenting data server room with computer mainframe with neon lights ppt powerpoint presentation inspiration grid pdf to dispense important information. This template comprises three stages. It also presents valuable insights into the topics including data server room with computer mainframe. This is a completely customizable PowerPoint theme that can be put to use immediately. So, download it and address the topic impactfully.
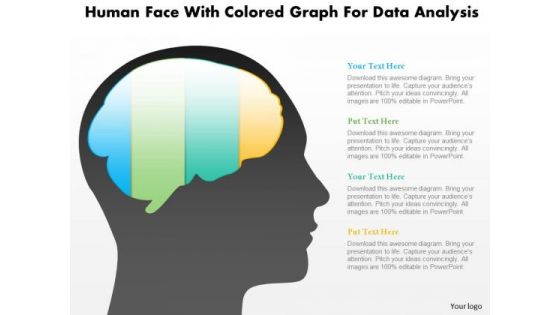
Business Diagram Human Face With Colored Graph For Data Analysis PowerPoint Slide
This diagram displays human face graphic with colored graph. This diagram can be used to represent strategy, planning, thinking of business plan. Display business options in your presentations by using this creative diagram.
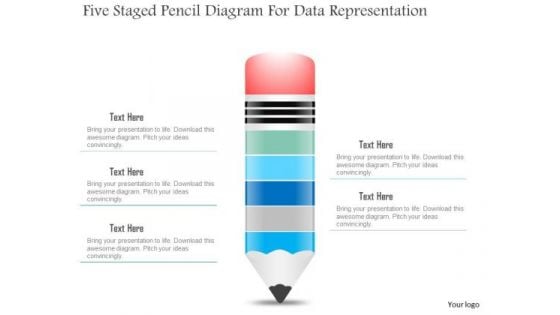
Business Diagram Five Staged Pencil Diagram For Data Representation PowerPoint Slide
This business slide displays five staged pencil diagram. It contains pencil graphic divided into five parts. This diagram slide depicts processes, stages, steps, points, options and education information display. Use this diagram, in your presentations to express your views innovatively.
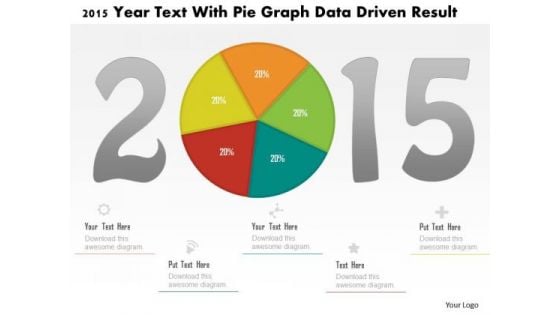
Business Diagram 2015 Year Text With Pie Graph Data Driven Result PowerPoint Slide
This business diagram displays 2015 year numbers with pie chart. This diagram is suitable to display business strategy for year 2015. Download this professional slide to present information in an attractive manner

Data Analysis In Excel 3d Column Chart To Represent Information PowerPoint Templates
Rake In The Dough With
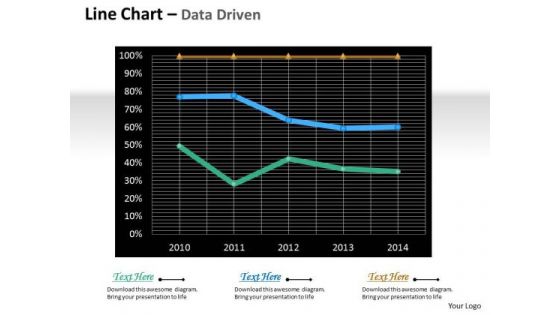
Multivariate Data Analysis Driven Line Chart For Market Survey PowerPoint Slides Templates
Rake In The Dough With
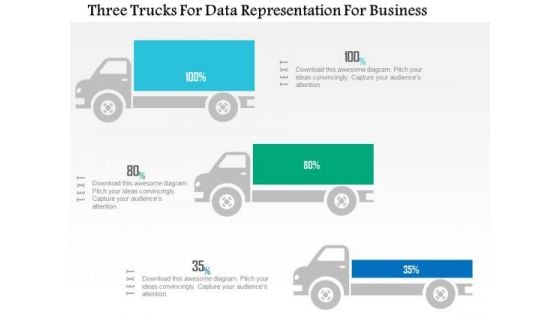
Business Diagram Three Trucks For Data Representation For Business PowerPoint Slide
This business diagram displays three trucks graphic. This diagram contains trucks for percentage value growth. Use this diagram to display business growth over a period of time.
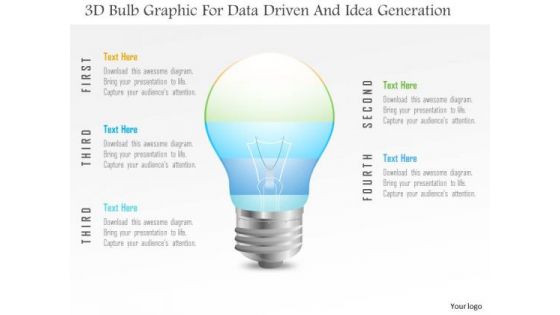
Business Diagram 3d Bulb Graphic For Data Driven And Idea Generation PowerPoint Slide
This Power Point template has been designed with 3d bulb graphic. Use this slide to represent technology idea and strategy concepts. Download this diagram for your business presentations and get exclusive comments on your efforts.
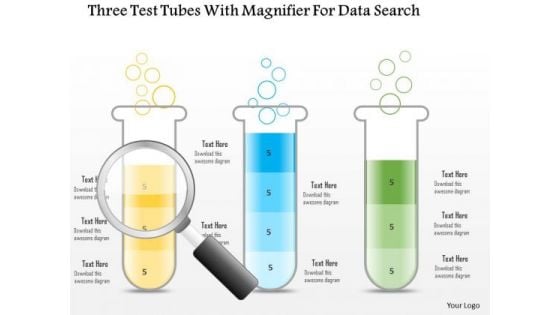
Business Diagram Three Test Tubes With Magnifier For Data Search PowerPoint Slide
This business diagram displays three test tubes with magnifying glass. This diagram is suitable to depict flow of business activities or steps. Download this professional slide to present information in an attractive manner.
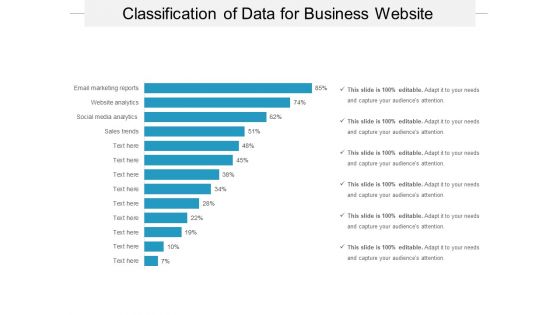
Classification Of Data For Business Website Ppt PowerPoint Presentation Styles Layout PDF
Presenting this set of slides with name classification of data for business website ppt powerpoint presentation styles layout pdf. The topics discussed in these slides are sales trends, social media analytics, website analytics, email marketing reports. This is a completely editable PowerPoint presentation and is available for immediate download. Download now and impress your audience.
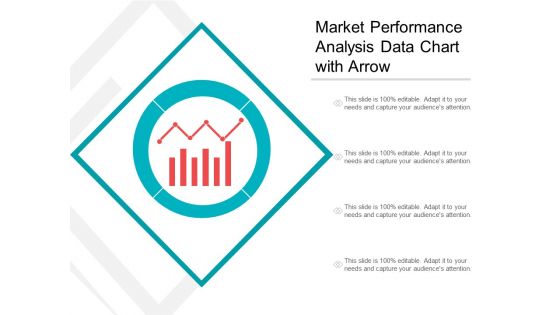
Market Performance Analysis Data Chart With Arrow Ppt PowerPoint Presentation Inspiration Graphics
This is a market performance analysis data chart with arrow ppt powerpoint presentation inspiration graphics. This is a four stage process. The stages in this process are marketing analytics, marketing performance, marketing discovery.
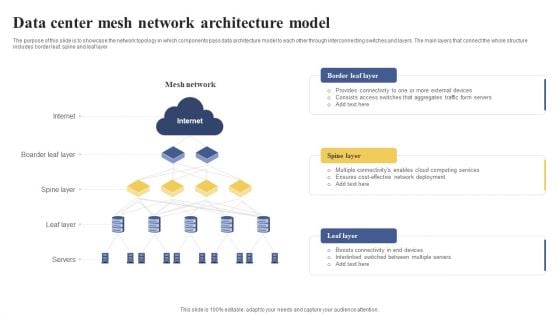
Data Center Mesh Network Architecture Model Ppt Portfolio Background Image PDF
The purpose of this slide is to showcase the network topology in which components pass data architecture model to each other through interconnecting switches and layers. the main layers that connect the whole structure includes border leaf, spine and leaf layer. Presenting Data Center Mesh Network Architecture Model Ppt Portfolio Background Image PDF to dispense important information. This template comprises one stages. It also presents valuable insights into the topics including Border Leaf Layer, Spine Layer, Leaf Layer. This is a completely customizable PowerPoint theme that can be put to use immediately. So, download it and address the topic impactfully.
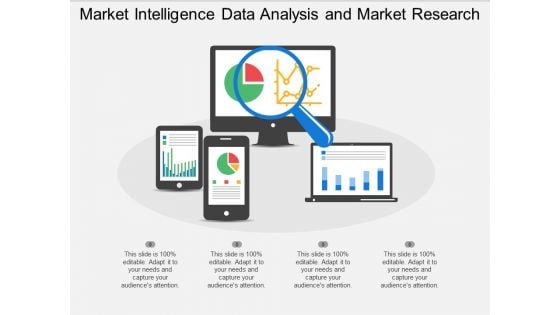
Market Intelligence Data Analysis And Market Research Ppt PowerPoint Presentation Professional Templates
This is a market intelligence data analysis and market research ppt powerpoint presentation professional templates. This is a four stage process. The stages in this process are digital analytics, digital dashboard, marketing.
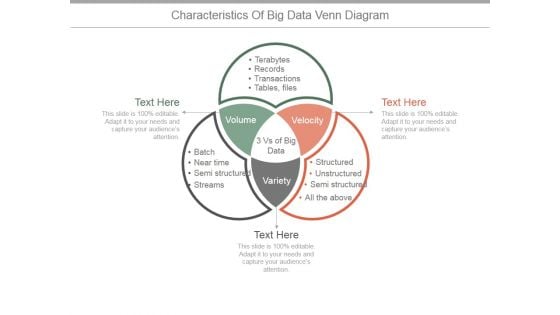
Characteristics Of Big Data Venn Diagram Ppt PowerPoint Presentation Example 2015
This is a characteristics of big data venn diagram ppt powerpoint presentation example 2015. This is a three stage process. The stages in this process are volume, velocity, variety, tables, files, transactions, records, terabytes.
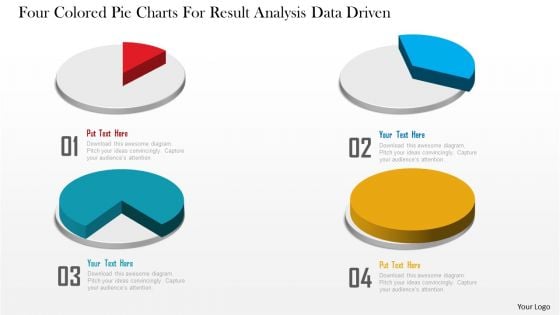
Business Diagram Four Colored Pie Charts For Result Analysis Data Driven PowerPoint Slide
This business diagram displays graphic of pie charts. This business slide is suitable to present and compare business data. Use this diagram to build professional presentations for your viewers.
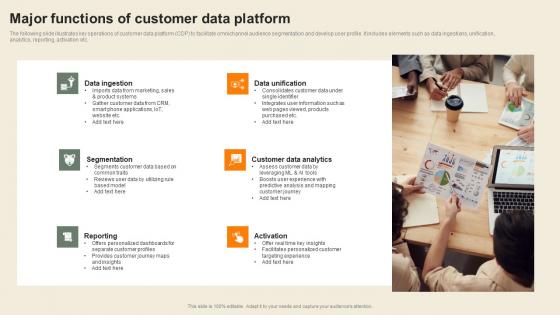
Major Functions Of Customer Data Platform Usability Of CDP Software Tool Mockup Pdf
The following slide illustrates key operations of customer data platform CDP to facilitate omnichannel audience segmentation and develop user profile. It includes elements such as data ingestions, unification, analytics, reporting, activation etc. Retrieve professionally designed Major Functions Of Customer Data Platform Usability Of CDP Software Tool Mockup Pdf to effectively convey your message and captivate your listeners. Save time by selecting pre-made slideshows that are appropriate for various topics, from business to educational purposes. These themes come in many different styles, from creative to corporate, and all of them are easily adjustable and can be edited quickly. Access them as PowerPoint templates or as Google Slides themes. You do not have to go on a hunt for the perfect presentation because Slidegeeks got you covered from everywhere. The following slide illustrates key operations of customer data platform CDP to facilitate omnichannel audience segmentation and develop user profile. It includes elements such as data ingestions, unification, analytics, reporting, activation etc.
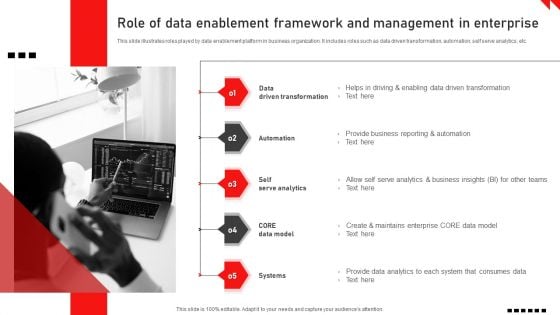
Role Of Data Enablement Framework And Management In Enterprise Background PDF
This slide illustrates roles played by data enablement platform in business organization. It includes roles such as data driven transformation, automation, self serve analytics, etc. Presenting Role Of Data Enablement Framework And Management In Enterprise Background PDF to dispense important information. This template comprises five stages. It also presents valuable insights into the topics including Data Driven Transformation, Automation, Self Serve Analytics. This is a completely customizable PowerPoint theme that can be put to use immediately. So, download it and address the topic impactfully.
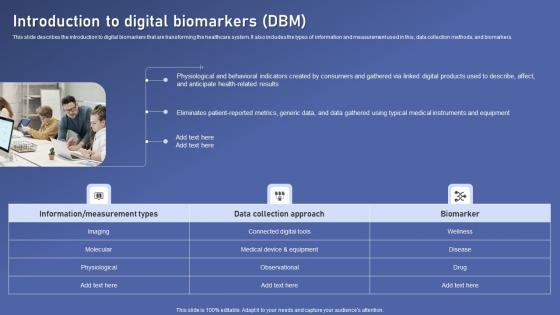
Introduction Digital Biomarkers Biomedical Data Science And Health Informatics Diagrams Pdf
This slide describes the introduction to digital biomarkers that are transforming the healthcare system. It also includes the types of information and measurement used in this, data collection methods, and biomarkers. Presenting this PowerPoint presentation, titled Introduction Digital Biomarkers Biomedical Data Science And Health Informatics Diagrams Pdf, with topics curated by our researchers after extensive research. This editable presentation is available for immediate download and provides attractive features when used. Download now and captivate your audience. Presenting this Introduction Digital Biomarkers Biomedical Data Science And Health Informatics Diagrams Pdf. Our researchers have carefully researched and created these slides with all aspects taken into consideration. This is a completely customizable Introduction Digital Biomarkers Biomedical Data Science And Health Informatics Diagrams Pdf that is available for immediate downloading. Download now and make an impact on your audience. Highlight the attractive features available with our PPTs. This slide describes the introduction to digital biomarkers that are transforming the healthcare system. It also includes the types of information and measurement used in this, data collection methods, and biomarkers.
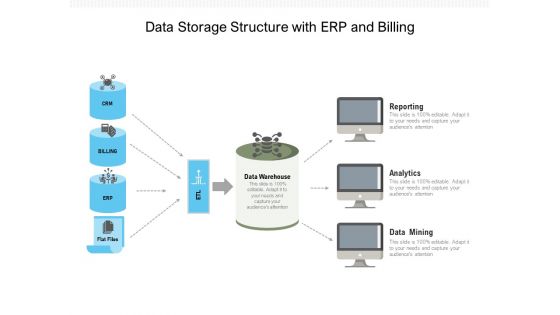
Data Storage Structure With ERP And Billing Ppt PowerPoint Presentation Gallery Outline PDF
Presenting data storage structure with erp and billing ppt powerpoint presentation gallery outline pdf to dispense important information. This template comprises four stages. It also presents valuable insights into the topics including reporting, analytics, data mining. This is a completely customizable PowerPoint theme that can be put to use immediately. So, download it and address the topic impactfully.
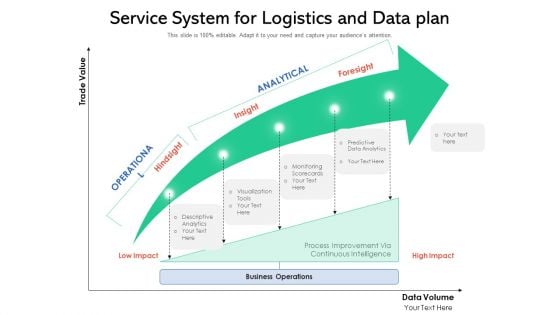
Service System For Logistics And Data Plan Ppt Pictures Graphic Images PDF
Presenting service system for logistics and data plan ppt pictures graphic images pdf to dispense important information. This template comprises one stage. It also presents valuable insights into the topics including business operations, monitoring, predictive data analytics. This is a completely customizable PowerPoint theme that can be put to use immediately. So, download it and address the topic impactfully.
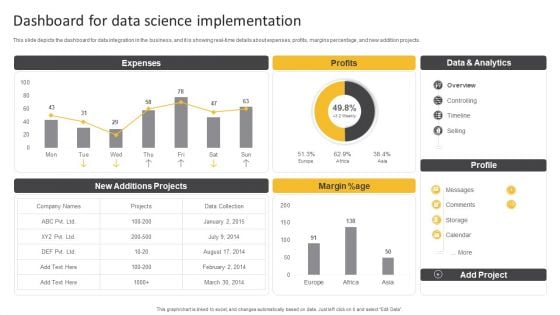
Information Science Dashboard For Data Science Implementation Ppt PowerPoint Presentation Slides Maker PDF
This slide depicts the dashboard for data integration in the business, and it is showing real-time details about expenses, profits, margins percentage, and new addition projects.Deliver and pitch your topic in the best possible manner with this Information Science Dashboard For Data Science Implementation Ppt PowerPoint Presentation Slides Maker PDF. Use them to share invaluable insights on Expenses, Data Analytics, New Projects and impress your audience. This template can be altered and modified as per your expectations. So, grab it now.
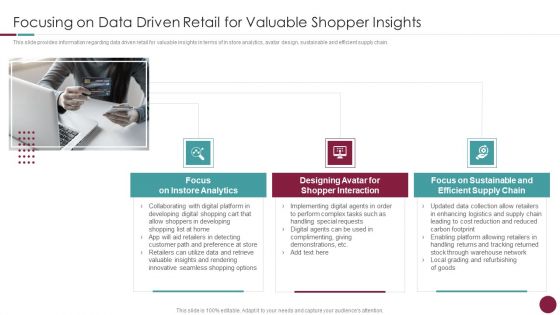
Incorporation Of Experience Focusing On Data Driven Retail For Valuable Shopper Insights Themes PDF
This slide provides information regarding data driven retail for valuable insights in terms of in store analytics, avatar design, sustainable and efficient supply chain. This is a incorporation of experience focusing on data driven retail for valuable shopper insights themes pdf template with various stages. Focus and dispense information on three stages using this creative set, that comes with editable features. It contains large content boxes to add your information on topics like focus instore analytics, designing avatar, shopper interaction, focus sustainable and efficient supply chain. You can also showcase facts, figures, and other relevant content using this PPT layout. Grab it now.
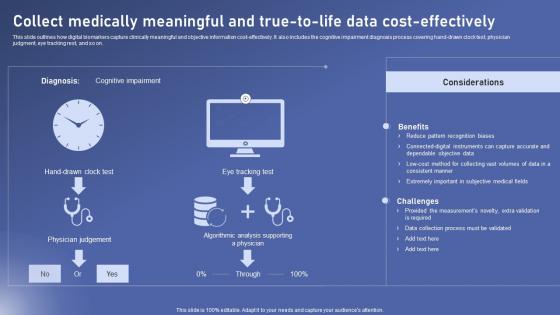
Collect Medically Meaningful True biomedical Data Science And Health Informatics Brochure Pdf
This slide outlines how digital biomarkers capture clinically meaningful and objective information cost effectively. It also includes the cognitive impairment diagnosis process covering hand drawn clock test, physician judgment, eye tracking rest, and so on. If you are looking for a format to display your unique thoughts, then the professionally designed Collect Medically Meaningful True biomedical Data Science And Health Informatics Brochure Pdf is the one for you. You can use it as a Google Slides template or a PowerPoint template. Incorporate impressive visuals, symbols, images, and other charts. Modify or reorganize the text boxes as you desire. Experiment with shade schemes and font pairings. Alter, share or cooperate with other people on your work. Download Collect Medically Meaningful True biomedical Data Science And Health Informatics Brochure Pdf and find out how to give a successful presentation. Present a perfect display to your team and make your presentation unforgettable. This slide outlines how digital biomarkers capture clinically meaningful and objective information cost effectively. It also includes the cognitive impairment diagnosis process covering hand drawn clock test, physician judgment, eye tracking rest, and so on.
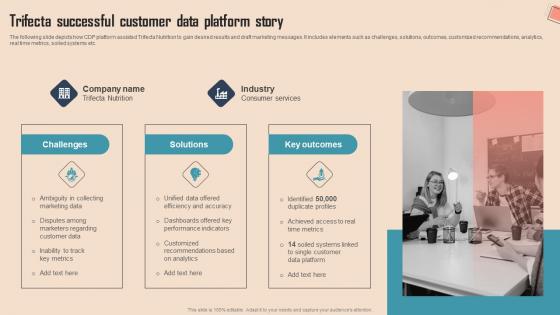
Trifecta Successful Customer Data Platform Comprehensive CDP Guide For Promoters Background Pdf
The following slide depicts how CDP platform assisted Trifecta Nutrition to gain desired results and draft marketing messages. It includes elements such as challenges, solutions, outcomes, customized recommendations, analytics, real time metrics, soiled systems etc.Do you know about Slidesgeeks Trifecta Successful Customer Data Platform Comprehensive CDP Guide For Promoters Background Pdf These are perfect for delivering any kind od presentation. Using it, create PowerPoint presentations that communicate your ideas and engage audiences. Save time and effort by using our pre-designed presentation templates that are perfect for a wide range of topic. Our vast selection of designs covers a range of styles, from creative to business, and are all highly customizable and easy to edit. Download as a PowerPoint template or use them as Google Slides themes. The following slide depicts how CDP platform assisted Trifecta Nutrition to gain desired results and draft marketing messages. It includes elements such as challenges, solutions, outcomes, customized recommendations, analytics, real time metrics, soiled systems etc.
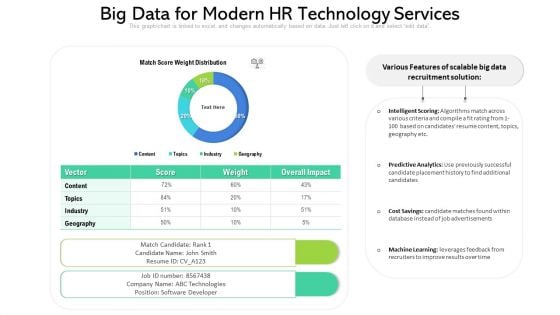
Big Data For Modern HR Technology Services Ppt PowerPoint Presentation Summary Graphic Tips PDF
Pitch your topic with ease and precision using this big data for modern hr technology services ppt powerpoint presentation summary graphic tips pdf. This layout presents information on intelligent scoring, predictive analytics, machine learning. It is also available for immediate download and adjustment. So, changes can be made in the color, design, graphics or any other component to create a unique layout.
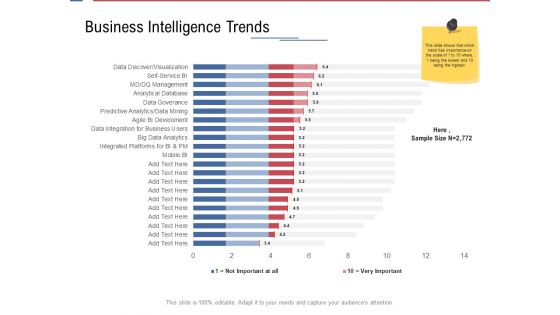
Data Assimilation Business Intelligence Trends Bid Ppt Show Example Introduction PDF
Deliver an awe inspiring pitch with this creative data assimilation business intelligence trends bid ppt show example introduction pdf bundle. Topics like management, governance, analytics, development, business can be discussed with this completely editable template. It is available for immediate download depending on the needs and requirements of the user.
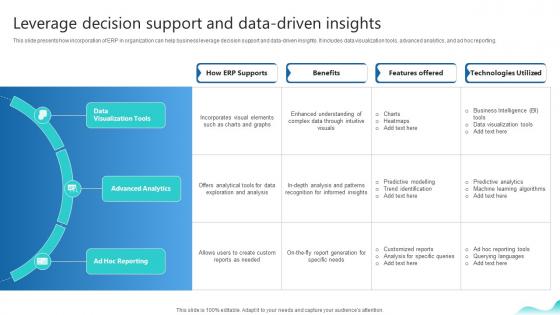
Leverage Decision Support And Data Driven Insights Erp And Digital Transformation For Maximizing DT SS V
This slide presents how incorporation of ERP in organization can help business leverage decision support and data-driven insights. It includes data visualization tools, advanced analytics, and ad hoc reporting.If you are looking for a format to display your unique thoughts, then the professionally designed Leverage Decision Support And Data Driven Insights Erp And Digital Transformation For Maximizing DT SS V is the one for you. You can use it as a Google Slides template or a PowerPoint template. Incorporate impressive visuals, symbols, images, and other charts. Modify or reorganize the text boxes as you desire. Experiment with shade schemes and font pairings. Alter, share or cooperate with other people on your work. Download Leverage Decision Support And Data Driven Insights Erp And Digital Transformation For Maximizing DT SS V and find out how to give a successful presentation. Present a perfect display to your team and make your presentation unforgettable. This slide presents how incorporation of ERP in organization can help business leverage decision support and data-driven insights. It includes data visualization tools, advanced analytics, and ad hoc reporting.
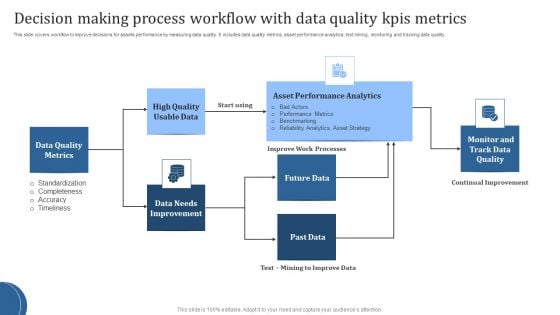
Decision Making Process Workflow With Data Quality Kpis Metrics Download PDF
This slide covers workflow to improve decisions for assets performance by measuring data quality. It includes data quality metrics, asset performance analytics, text mining, monitoring and tracking data quality. Presenting Decision Making Process Workflow With Data Quality Kpis Metrics Download PDF to dispense important information. This template comprises Seven stages. It also presents valuable insights into the topics including Data Quality Metrics, Data Needs Improvement. This is a completely customizable PowerPoint theme that can be put to use immediately. So, download it and address the topic impactfully.
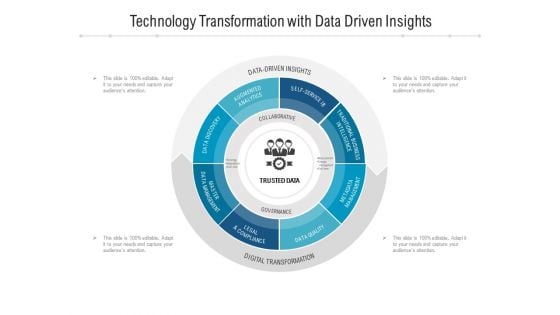
Technology Transformation With Data Driven Insights Ppt PowerPoint Presentation File Samples PDF
Presenting technology transformation with data driven insights ppt powerpoint presentation file samples pdf to dispense important information. This template comprises one stages. It also presents valuable insights into the topics including analytics, management, business. This is a completely customizable PowerPoint theme that can be put to use immediately. So, download it and address the topic impactfully.
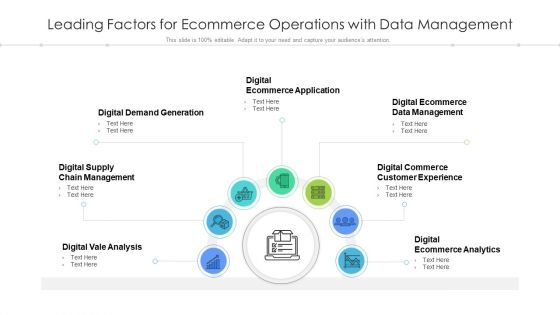
Leading Factors For Ecommerce Operations With Data Management Ppt Ideas PDF
Presenting leading factors for ecommerce operations with data management ppt ideas pdf to dispense important information. This template comprises sven stages. It also presents valuable insights into the topics including management, experience, analytics. This is a completely customizable PowerPoint theme that can be put to use immediately. So, download it and address the topic impactfully.
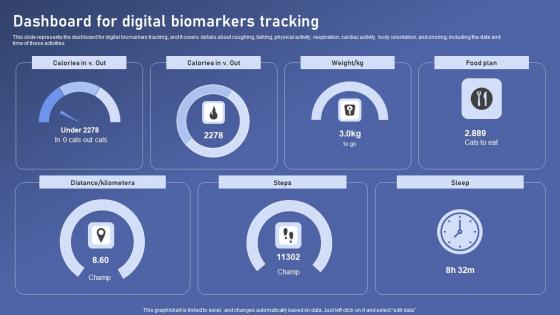
Dashboard For Digital Biomarkers Biomedical Data Science And Health Informatics Slides Pdf
This slide represents the dashboard for digital biomarkers tracking, and it covers details about coughing, talking, physical activity, respiration, cardiac activity, body orientation, and snoring, including the date and time of these activities Make sure to capture your audiences attention in your business displays with our gratis customizable Dashboard For Digital Biomarkers Biomedical Data Science And Health Informatics Slides Pdf. These are great for business strategies, office conferences, capital raising or task suggestions. If you desire to acquire more customers for your tech business and ensure they stay satisfied, create your own sales presentation with these plain slides. This slide represents the dashboard for digital biomarkers tracking, and it covers details about coughing, talking, physical activity, respiration, cardiac activity, body orientation, and snoring, including the date and time of these activities
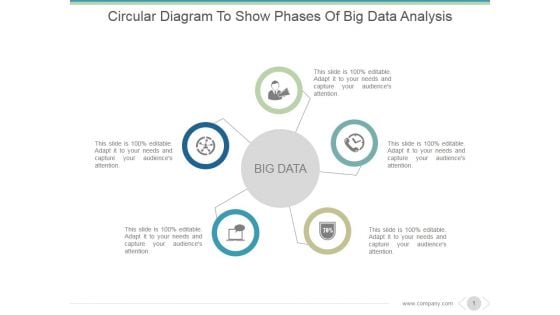
Circular Diagram To Show Phases Of Big Data Analysis Ppt PowerPoint Presentation Infographic Template
This is a circular diagram to show phases of big data analysis ppt powerpoint presentation infographic template. This is a five stage process. The stages in this process are big data, icons, management, strategy, business.
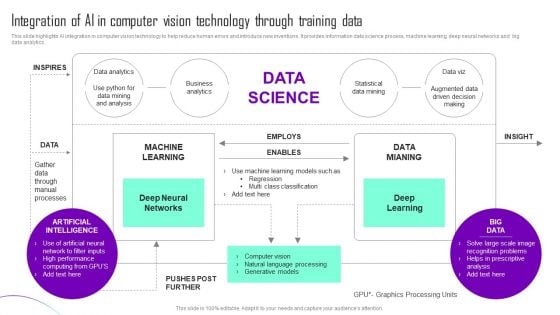
Integration Of AI In Computer Vision Technology Through Training Data Themes PDF
This slide highlights AI integration in computer vision technology to help reduce human errors and introduce new inventions. It provides information data science process, machine learning, deep neural networks and big data analytics. Showcasing this set of slides titled Integration Of AI In Computer Vision Technology Through Training Data Themes PDF. The topics addressed in these templates are MACHINE LEARNING, DATA MIANING, Deep Learning. All the content presented in this PPT design is completely editable. Download it and make adjustments in color, background, font etc. as per your unique business setting.
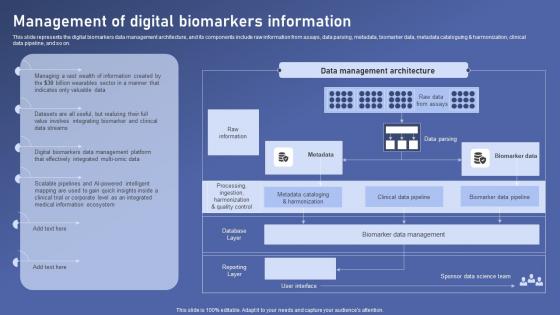
Management Digital Biomarkers Biomedical Data Science And Health Informatics Themes Pdf
This slide represents the digital biomarkers data management architecture, and its components include raw information from assays, data parsing, metadata, biomarker data, metadata cataloguing and harmonization, clinical data pipeline, and so on. Do you know about Slidesgeeks Management Digital Biomarkers Biomedical Data Science And Health Informatics Themes Pdf These are perfect for delivering any kind od presentation. Using it, create PowerPoint presentations that communicate your ideas and engage audiences. Save time and effort by using our pre designed presentation templates that are perfect for a wide range of topic. Our vast selection of designs covers a range of styles, from creative to business, and are all highly customizable and easy to edit. Download as a PowerPoint template or use them as Google Slides themes. This slide represents the digital biomarkers data management architecture, and its components include raw information from assays, data parsing, metadata, biomarker data, metadata cataloguing and harmonization, clinical data pipeline, and so on.

Deck Presentation Solutions for Enhanced Data Reach and Visibility PPT Sample
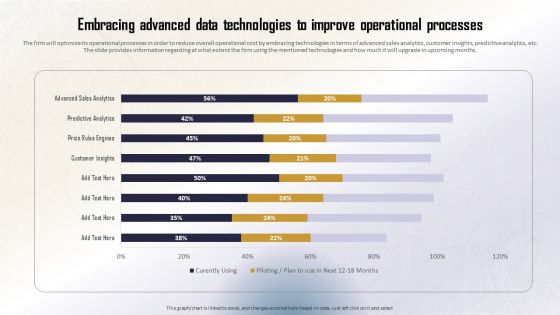
Identifying Direct And Indirect Embracing Advanced Data Technologies To Improve Guidelines PDF
The firm will optimize its operational processes in order to reduce overall operational cost by embracing technologies in terms of advanced sales analytics, customer insights, predictive analytics, etc. The slide provides information regarding at what extent the firm using the mentioned technologies and how much it will upgrade in upcoming months. Formulating a presentation can take up a lot of effort and time, so the content and message should always be the primary focus. The visuals of the PowerPoint can enhance the presenters message, so our Identifying Direct And Indirect Embracing Advanced Data Technologies To Improve Guidelines PDF was created to help save time. Instead of worrying about the design, the presenter can concentrate on the message while our designers work on creating the ideal templates for whatever situation is needed. Slidegeeks has experts for everything from amazing designs to valuable content, we have put everything into Identifying Direct And Indirect Embracing Advanced Data Technologies To Improve Guidelines PDF
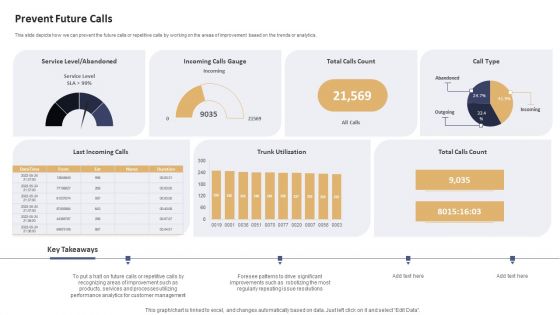
Data Processing Services Delivery Prevent Future Calls Ppt Inspiration Clipart Images PDF
This slide depicts how we can prevent the future calls or repetitive calls by working on the areas of improvement based on the trends or analytics. Deliver an awe inspiring pitch with this creative Data Processing Services Delivery Prevent Future Calls Ppt Inspiration Clipart Images PDF bundle. Topics like Service Level, Abandoned, Incoming Calls Gauge, Total Calls Count can be discussed with this completely editable template. It is available for immediate download depending on the needs and requirements of the user.
New Hires Data Tracker Dashboard Workforce Procurement And Aptitude Evaluation Ppt Presentation
This slide shows dashboard including date related to new hires for recruitment. It include data related to new hires per month, new hires for various departments and by sources, etc. Are you searching for a New Hires Data Tracker Dashboard Workforce Procurement And Aptitude Evaluation Ppt Presentation that is uncluttered, straightforward, and original Its easy to edit, and you can change the colors to suit your personal or business branding. For a presentation that expresses how much effort you have put in, this template is ideal With all of its features, including tables, diagrams, statistics, and lists, its perfect for a business plan presentation. Make your ideas more appealing with these professional slides. Download New Hires Data Tracker Dashboard Workforce Procurement And Aptitude Evaluation Ppt Presentation from Slidegeeks today. This slide shows dashboard including date related to new hires for recruitment. It include data related to new hires per month, new hires for various departments and by sources, etc.
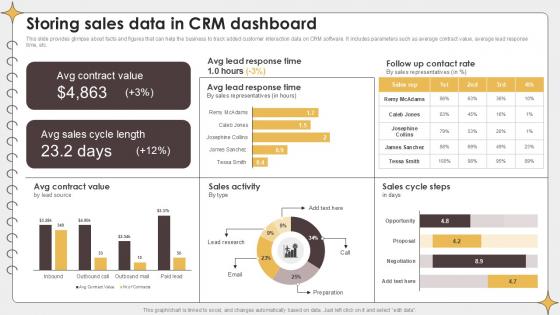
Storing Sales Data In CRM Dashboard Planning Outreach Campaigns PPT Slide
This slide provides glimpse about facts and figures that can help the business to track added customer interaction data on CRM software. It includes parameters such as average contract value, average lead response time, etc. This Storing Sales Data In CRM Dashboard Planning Outreach Campaigns PPT Slide is perfect for any presentation, be it in front of clients or colleagues. It is a versatile and stylish solution for organizing your meetings. The Storing Sales Data In CRM Dashboard Planning Outreach Campaigns PPT Slide features a modern design for your presentation meetings. The adjustable and customizable slides provide unlimited possibilities for acing up your presentation. Slidegeeks has done all the homework before launching the product for you. So, do not wait, grab the presentation templates today This slide provides glimpse about facts and figures that can help the business to track added customer interaction data on CRM software. It includes parameters such as average contract value, average lead response time, etc.
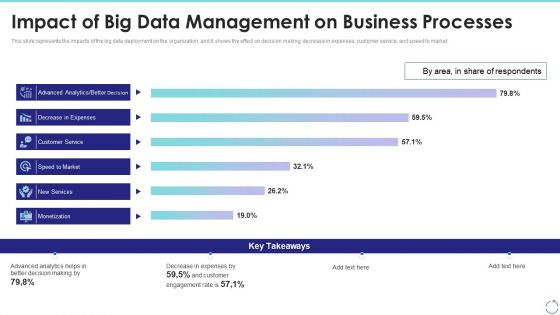
Impact Of Big Data Management On Business Processes Ppt Inspiration Gallery PDF
This slide represents the impacts of the big data deployment on the organization, and it shows the effect on decision making, decrease in expenses, customer service, and speed to market. Deliver and pitch your topic in the best possible manner with this impact of big data management on business processes ppt inspiration gallery pdf. Use them to share invaluable insights on analytics, customer, expenses, services and impress your audience. This template can be altered and modified as per your expectations. So, grab it now.
Student Data Tracking Application Dashboard Impact Of IoT Technology On Education IoT SS V
Following slide represents dashboard that provides accurate student data to analyze performance using educational apps. It includes metrics such as grades, attendance, average grades, progress rate, etc. From laying roadmaps to briefing everything in detail, our templates are perfect for you. You can set the stage with your presentation slides. All you have to do is download these easy-to-edit and customizable templates. Student Data Tracking Application Dashboard Impact Of IoT Technology On Education IoT SS V will help you deliver an outstanding performance that everyone would remember and praise you for. Do download this presentation today. Following slide represents dashboard that provides accurate student data to analyze performance using educational apps. It includes metrics such as grades, attendance, average grades, progress rate, etc.
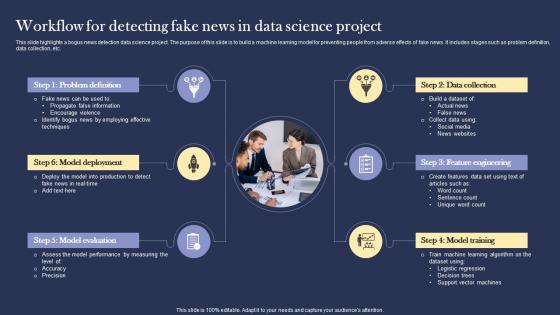
Workflow For Detecting Fake News In Data Science Project Diagrams pdf
This slide highlights a bogus news detection data science project. The purpose of this slide is to build a machine learning model for preventing people from adverse effects of fake news. It includes stages such as problem definition, data collection, etc. Pitch your topic with ease and precision using this Workflow For Detecting Fake News In Data Science Project Diagrams pdf. This layout presents information on Problem Definition, Model Deployment, Model Evaluation. It is also available for immediate download and adjustment. So, changes can be made in the color, design, graphics or any other component to create a unique layout. This slide highlights a bogus news detection data science project. The purpose of this slide is to build a machine learning model for preventing people from adverse effects of fake news. It includes stages such as problem definition, data collection, etc.

Global Data Security Industry Report Global Cybersecurity Industry A Quick Snapshot IR SS V
This slide provides a glimpse of key highlights of the cybersecurity industry, enabling executives to grasp the main findings quickly. It serves as a snapshot highlighting revenue, CAGR, fastest growing region, segments, regional breakdown, and key market players. If you are looking for a format to display your unique thoughts, then the professionally designed Global Data Security Industry Report Global Cybersecurity Industry A Quick Snapshot IR SS V is the one for you. You can use it as a Google Slides template or a PowerPoint template. Incorporate impressive visuals, symbols, images, and other charts. Modify or reorganize the text boxes as you desire. Experiment with shade schemes and font pairings. Alter, share or cooperate with other people on your work. Download Global Data Security Industry Report Global Cybersecurity Industry A Quick Snapshot IR SS V and find out how to give a successful presentation. Present a perfect display to your team and make your presentation unforgettable. This slide provides a glimpse of key highlights of the cybersecurity industry, enabling executives to grasp the main findings quickly. It serves as a snapshot highlighting revenue, CAGR, fastest growing region, segments, regional breakdown, and key market players.
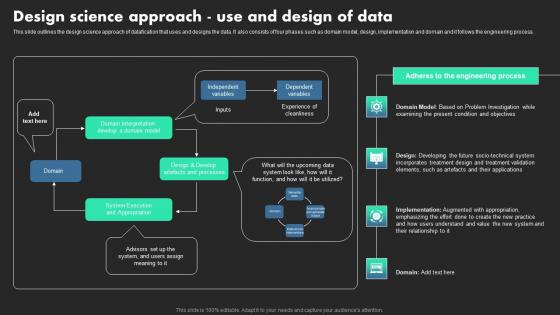
Design Science Approach Use And Design Of Data Ethical Dimensions Of Datafication Brochure Pdf
This slide outlines the design science approach of datafication that uses and designs the data. It also consists of four phases such as domain model, design, implementation and domain and it follows the engineering process. Coming up with a presentation necessitates that the majority of the effort goes into the content and the message you intend to convey. The visuals of a PowerPoint presentation can only be effective if it supplements and supports the story that is being told. Keeping this in mind our experts created Design Science Approach Use And Design Of Data Ethical Dimensions Of Datafication Brochure Pdf to reduce the time that goes into designing the presentation. This way, you can concentrate on the message while our designers take care of providing you with the right template for the situation. This slide outlines the design science approach of datafication that uses and designs the data. It also consists of four phases such as domain model, design, implementation and domain and it follows the engineering process.
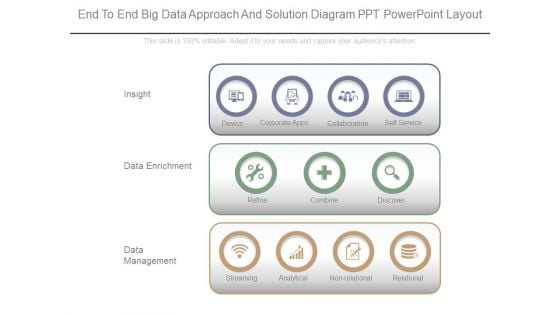
End To End Big Data Approach And Solution Diagram Ppt Powerpoint Layout
This is a end to end big data approach and solution diagram ppt powerpoint layout. This is a three stage process. The stages in this process are insight, data enrichment, data management, device, corporate apps, collaboration, self service, refine, combine, discover, relational, non relational, analytical, streaming.
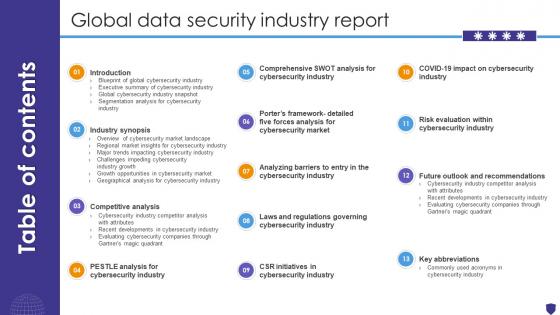
Table Of Contents For Global Data Security Industry Report IR SS V
Retrieve professionally designed Table Of Contents For Global Data Security Industry Report IR SS V to effectively convey your message and captivate your listeners. Save time by selecting pre-made slideshows that are appropriate for various topics, from business to educational purposes. These themes come in many different styles, from creative to corporate, and all of them are easily adjustable and can be edited quickly. Access them as PowerPoint templates or as Google Slides themes. You do not have to go on a hunt for the perfect presentation because Slidegeeks got you covered from everywhere. Our Table Of Contents For Global Data Security Industry Report IR SS V are topically designed to provide an attractive backdrop to any subject. Use them to look like a presentation pro.
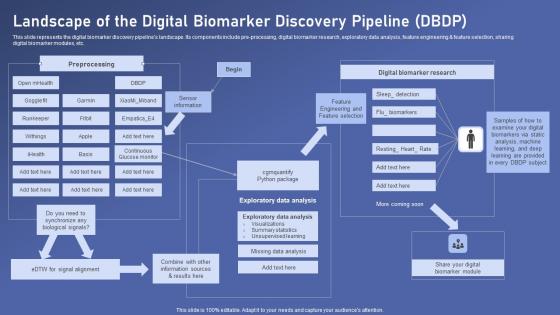
Landscape Of The Digital Biomarker Biomedical Data Science And Health Informatics Diagrams Pdf
This slide represents the digital biomarker discovery pipelines landscape. Its components include pre processing, digital biomarker research, exploratory data analysis, feature engineering and feature selection, sharing digital biomarker modules, etc. This Landscape Of The Digital Biomarker Biomedical Data Science And Health Informatics Diagrams Pdf from Slidegeeks makes it easy to present information on your topic with precision. It provides customization options, so you can make changes to the colors, design, graphics, or any other component to create a unique layout. It is also available for immediate download, so you can begin using it right away. Slidegeeks has done good research to ensure that you have everything you need to make your presentation stand out. Make a name out there for a brilliant performance. This slide represents the digital biomarker discovery pipelines landscape. Its components include pre processing, digital biomarker research, exploratory data analysis, feature engineering and feature selection, sharing digital biomarker modules, etc.
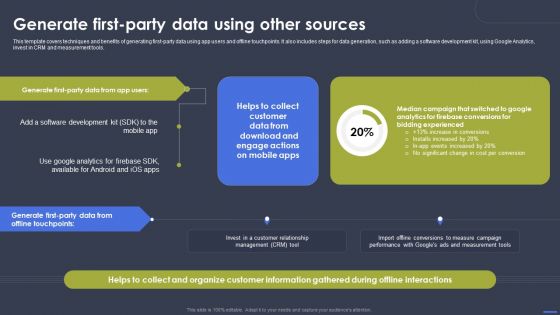
Optimizing Digital Marketing Strategy Generate First Party Data Using Other Sources Background PDF
This template covers techniques and benefits of generating first-party data using app users and offline touchpoints. It also includes steps for data generation, such as adding a software development kit, using Google Analytics, invest in CRM and measurement tools. Whether you have daily or monthly meetings, a brilliant presentation is necessary. Optimizing Digital Marketing Strategy Generate First Party Data Using Other Sources Background PDF can be your best option for delivering a presentation. Represent everything in detail using Optimizing Digital Marketing Strategy Generate First Party Data Using Other Sources Background PDF and make yourself stand out in meetings. The template is versatile and follows a structure that will cater to your requirements. All the templates prepared by Slidegeeks are easy to download and edit. Our research experts have taken care of the corporate themes as well. So, give it a try and see the results.
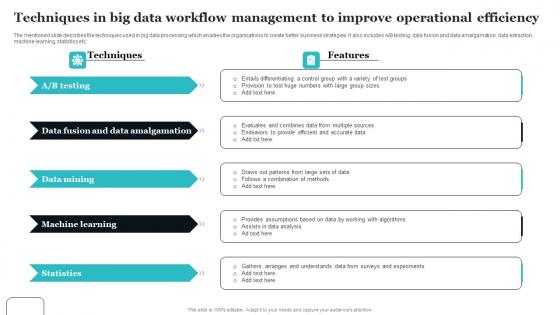
Techniques In Big Data Workflow Management To Improve Operational Efficiency Diagrams Pdf
The mentioned slide describes the techniques used in big data processing which enables the organizations to create better business strategies. It also includes A or B testing, data fusion and data amalgamation, data extraction, machine learning, statistics etc. Pitch your topic with ease and precision using this Techniques In Big Data Workflow Management To Improve Operational Efficiency Diagrams Pdf This layout presents information on Data Fusion, Data Amalgamation, Machine Learning It is also available for immediate download and adjustment. So, changes can be made in the color, design, graphics or any other component to create a unique layout. The mentioned slide describes the techniques used in big data processing which enables the organizations to create better business strategies. It also includes A or B testing, data fusion and data amalgamation, data extraction, machine learning, statistics etc.
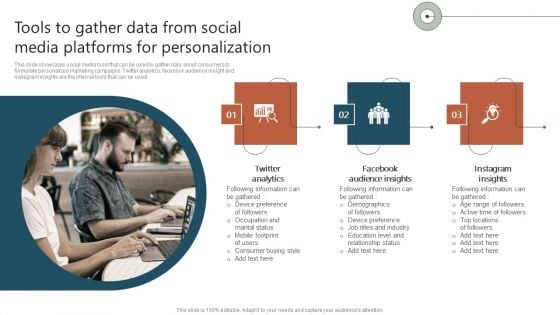
Tools To Gather Data From Social Media Platforms For Personalization Ppt Infographic Template Information PDF
This slide showcases social media tools that can be used to gather data about consumers to formulate personalized marketing campaigns. Twitter analytics, facebook audience insight and instagram insights are the internal tools that can be used. If you are looking for a format to display your unique thoughts, then the professionally designed Tools To Gather Data From Social Media Platforms For Personalization Ppt Infographic Template Information PDF is the one for you. You can use it as a Google Slides template or a PowerPoint template. Incorporate impressive visuals, symbols, images, and other charts. Modify or reorganize the text boxes as you desire. Experiment with shade schemes and font pairings. Alter, share or cooperate with other people on your work. Download Tools To Gather Data From Social Media Platforms For Personalization Ppt Infographic Template Information PDF and find out how to give a successful presentation. Present a perfect display to your team and make your presentation unforgettable.
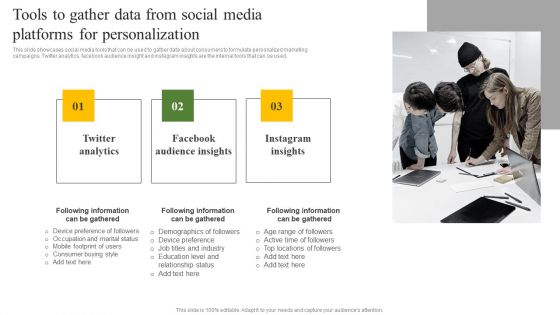
Tools To Gather Data From Social Media Platforms For Personalization Ppt Summary Microsoft PDF
This slide showcases social media tools that can be used to gather data about consumers to formulate personalized marketing campaigns. Twitter analytics, facebook audience insight and instagram insights are the internal tools that can be used. If you are looking for a format to display your unique thoughts, then the professionally designed Tools To Gather Data From Social Media Platforms For Personalization Ppt Summary Microsoft PDF is the one for you. You can use it as a Google Slides template or a PowerPoint template. Incorporate impressive visuals, symbols, images, and other charts. Modify or reorganize the text boxes as you desire. Experiment with shade schemes and font pairings. Alter, share or cooperate with other people on your work. Download Tools To Gather Data From Social Media Platforms For Personalization Ppt Summary Microsoft PDF and find out how to give a successful presentation. Present a perfect display to your team and make your presentation unforgettable.
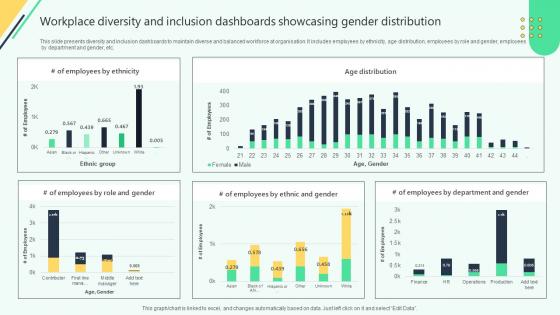
Workplace Diversity And Inclusion Dashboards Analysing Hr Data For Effective Decision Making
This slide presents diversity and inclusion dashboards to maintain diverse and balanced workforce at organisation. It includes employees by ethnicity, age distribution, employees by role and gender, employees by department and gender, etc. Whether you have daily or monthly meetings, a brilliant presentation is necessary. Workplace Diversity And Inclusion Dashboards Analysing Hr Data For Effective Decision Making can be your best option for delivering a presentation. Represent everything in detail using Workplace Diversity And Inclusion Dashboards Analysing Hr Data For Effective Decision Making and make yourself stand out in meetings. The template is versatile and follows a structure that will cater to your requirements. All the templates prepared by Slidegeeks are easy to download and edit. Our research experts have taken care of the corporate themes as well. So, give it a try and see the results. This slide presents diversity and inclusion dashboards to maintain diverse and balanced workforce at organisation. It includes employees by ethnicity, age distribution, employees by role and gender, employees by department and gender, etc.
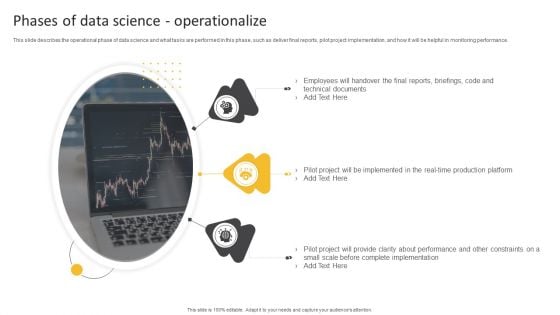
Information Science Phases Of Data Science Operationalize Ppt PowerPoint Presentation Show Display PDF
This slide describes the operational phase of data science and what tasks are performed in this phase, such as deliver final reports, pilot project implementation, and how it will be helpful in monitoring performance.Presenting Information Science Phases Of Data Science Operationalize Ppt PowerPoint Presentation Show Display PDF to provide visual cues and insights. Share and navigate important information on three stages that need your due attention. This template can be used to pitch topics like Technical Documents, Project Implemented, Complete Implementation. In addtion, this PPT design contains high resolution images, graphics, etc, that are easily editable and available for immediate download.
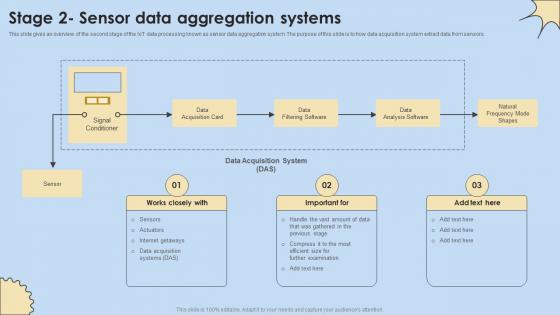
Stage 2 Sensor Data Aggregation Systems Internet Of Things Analysis Introduction Pdf
This slide gives an overview of the second stage of the IoT data processing known as sensor data aggregation system. The purpose of this slide is to how data acquisition system extract data from sensors. Do you know about Slidesgeeks Stage 2 Sensor Data Aggregation Systems Internet Of Things Analysis Introduction Pdf These are perfect for delivering any kind od presentation. Using it, create PowerPoint presentations that communicate your ideas and engage audiences. Save time and effort by using our pre-designed presentation templates that are perfect for a wide range of topic. Our vast selection of designs covers a range of styles, from creative to business, and are all highly customizable and easy to edit. Download as a PowerPoint template or use them as Google Slides themes. This slide gives an overview of the second stage of the IoT data processing known as sensor data aggregation system. The purpose of this slide is to how data acquisition system extract data from sensors.

Global Data Security Industry Report Geographical Analysis For Cybersecurity Industry IR SS V
The slide highlights the geographical summary of current state of cybersecurity industry. The purpose of the slide is to provide insights on cybersecurity landscape, trends, development at regional levels. It helps stakeholders in understanding the market dynamics, regulatory environments and potential growth opportunities. If your project calls for a presentation, then Slidegeeks is your go-to partner because we have professionally designed, easy-to-edit templates that are perfect for any presentation. After downloading, you can easily edit Global Data Security Industry Report Geographical Analysis For Cybersecurity Industry IR SS V and make the changes accordingly. You can rearrange slides or fill them with different images. Check out all the handy templates The slide highlights the geographical summary of current state of cybersecurity industry. The purpose of the slide is to provide insights on cybersecurity landscape, trends, development at regional levels. It helps stakeholders in understanding the market dynamics, regulatory environments and potential growth opportunities.
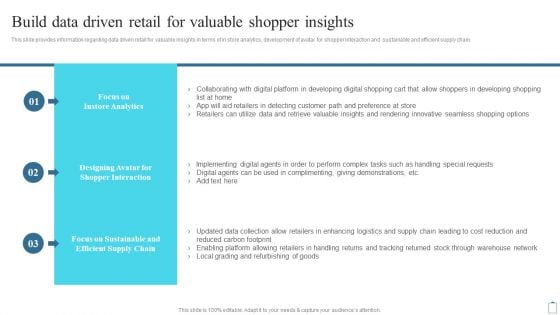
Build Data Driven Retail For Valuable Shopper Insights Customer Engagement Administration Inspiration PDF
This slide provides information regarding data driven retail for valuable insights in terms of in store analytics, development of avatar for shopper interaction and sustainable and efficient supply chain. If you are looking for a format to display your unique thoughts, then the professionally designed Build Data Driven Retail For Valuable Shopper Insights Customer Engagement Administration Inspiration PDF is the one for you. You can use it as a Google Slides template or a PowerPoint template. Incorporate impressive visuals, symbols, images, and other charts. Modify or reorganize the text boxes as you desire. Experiment with shade schemes and font pairings. Alter, share or cooperate with other people on your work. Download Build Data Driven Retail For Valuable Shopper Insights Customer Engagement Administration Inspiration PDF and find out how to give a successful presentation. Present a perfect display to your team and make your presentation unforgettable.

Business Analysis Data Charts And Reports Ppt Powerpoint Presentation Ideas Portrait
This is a business analysis data charts and reports ppt powerpoint presentation ideas portrait. This is a three stage process. The stages in this process are business metrics, business kpi, business dashboard.
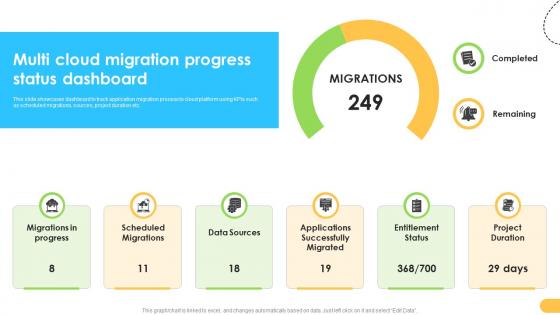
Multi Cloud Migration Progress Status Dashboard Data Migration From On Premises
This slide showcases dashboard to track application migration process to cloud platform using KPIs such as scheduled migrations, sources, project duration etc. Take your projects to the next level with our ultimate collection of Multi Cloud Migration Progress Status Dashboard Data Migration From On Premises. Slidegeeks has designed a range of layouts that are perfect for representing task or activity duration, keeping track of all your deadlines at a glance. Tailor these designs to your exact needs and give them a truly corporate look with your own brand colors they will make your projects stand out from the rest This slide showcases dashboard to track application migration process to cloud platform using KPIs such as scheduled migrations, sources, project duration etc.

Current Scenario Analysis Of Big Data Revolutionizing Production IoT Ppt Slide
The following slide showcases current scenario analysis of big data management to assess scope of improvement. It includes KPIs such as data accuracy, downtime reduction, etc. Whether you have daily or monthly meetings, a brilliant presentation is necessary. Current Scenario Analysis Of Big Data Revolutionizing Production IoT Ppt Slide can be your best option for delivering a presentation. Represent everything in detail using Current Scenario Analysis Of Big Data Revolutionizing Production IoT Ppt Slide and make yourself stand out in meetings. The template is versatile and follows a structure that will cater to your requirements. All the templates prepared by Slidegeeks are easy to download and edit. Our research experts have taken care of the corporate themes as well. So, give it a try and see the results. The following slide showcases current scenario analysis of big data management to assess scope of improvement. It includes KPIs such as data accuracy, downtime reduction, etc.
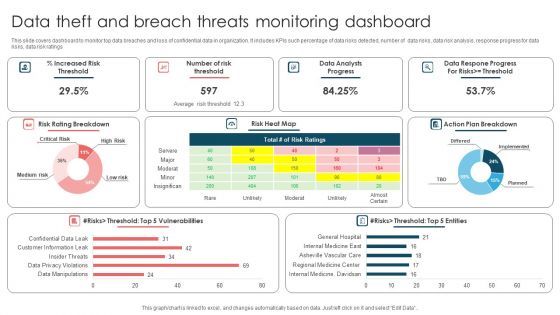
Data Theft And Breach Threats Monitoring Dashboard Ppt Outline Designs PDF
This slide covers dashboard to monitor top data breaches and loss of confidential data in organization. It includes KPIs such percentage of data risks detected, number of data risks, data risk analysis, response progress for data risks, data risk ratings. Showcasing this set of slides titled Data Theft And Breach Threats Monitoring Dashboard Ppt Outline Designs PDF. The topics addressed in these templates are Number Risk Threshold, Data Analysts Progress, Action Plan Breakdown. All the content presented in this PPT design is completely editable. Download it and make adjustments in color, background, font etc. as per your unique business setting.
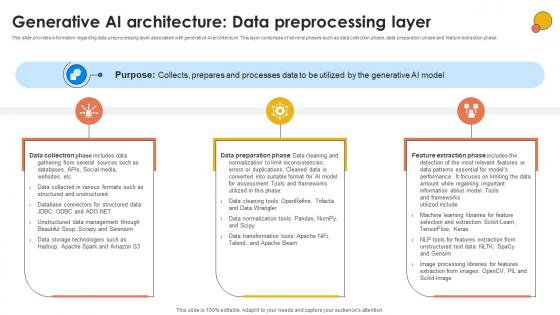
Generative AI Architecture Data Generative AI For Better Productivity AI SS V
This slide provides information regarding data preprocessing layer associated with generative AI architecture. This layer comprises of several phases such as data collection phase, data preparation phase and feature extraction phase. Crafting an eye-catching presentation has never been more straightforward. Let your presentation shine with this tasteful yet straightforward Generative AI Architecture Data Generative AI For Better Productivity AI SS V template. It offers a minimalistic and classy look that is great for making a statement. The colors have been employed intelligently to add a bit of playfulness while still remaining professional. Construct the ideal Generative AI Architecture Data Generative AI For Better Productivity AI SS V that effortlessly grabs the attention of your audience Begin now and be certain to wow your customers This slide provides information regarding data preprocessing layer associated with generative AI architecture. This layer comprises of several phases such as data collection phase, data preparation phase and feature extraction phase.
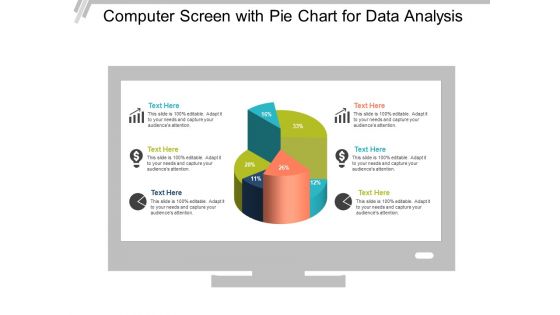
Computer Screen With Pie Chart For Data Analysis Ppt PowerPoint Presentation Show Picture
This is a computer screen with pie chart for data analysis ppt powerpoint presentation show picture. This is a six stage process. The stages in this process are computer icon, desktop icon, laptop screen icon.
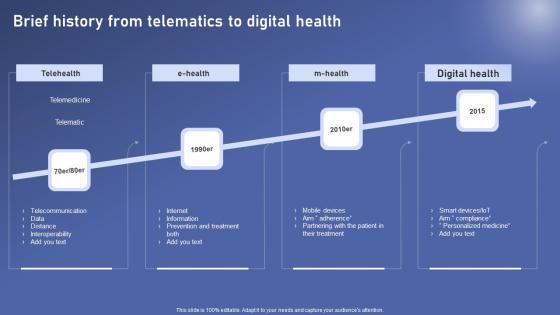
Brief History From Telematics Biomedical Data Science And Health Informatics Inspiration Pdf
Whether you have daily or monthly meetings, a brilliant presentation is necessary. Brief History From Telematics Biomedical Data Science And Health Informatics Inspiration Pdf can be your best option for delivering a presentation. Represent everything in detail using Brief History From Telematics Biomedical Data Science And Health Informatics Inspiration Pdf and make yourself stand out in meetings. The template is versatile and follows a structure that will cater to your requirements. All the templates prepared by Slidegeeks are easy to download and edit. Our research experts have taken care of the corporate themes as well. So, give it a try and see the results. Our Brief History From Telematics Biomedical Data Science And Health Informatics Inspiration Pdf are topically designed to provide an attractive backdrop to any subject. Use them to look like a presentation pro.
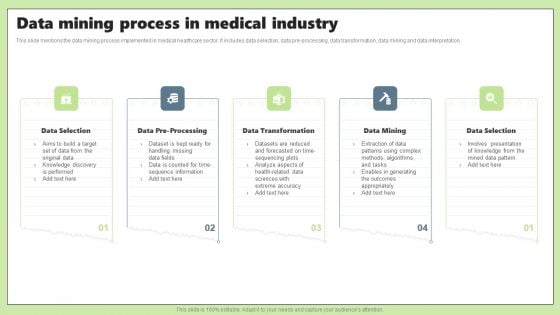
Data Mining Process In Medical Industry Ppt PowerPoint Presentation Portfolio Guide PDF
This slide mentions the data mining process implemented in medical healthcare sector. It includes data selection, data pre-processing, data transformation, data mining and data interpretation.Presenting Data Mining Process In Medical Industry Ppt PowerPoint Presentation Portfolio Guide PDF to dispense important information. This template comprises five stages. It also presents valuable insights into the topics including Data Selection, Data Transformation, Data Mining. This is a completely customizable PowerPoint theme that can be put to use immediately. So, download it and address the topic impactfully.
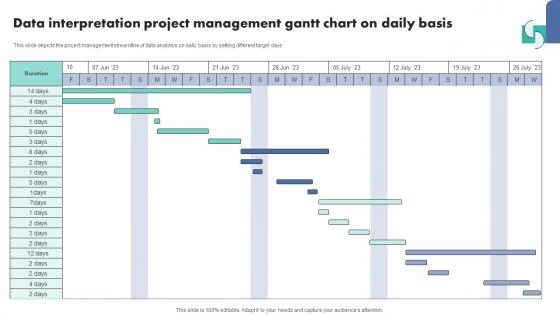
Data Interpretation Project Management Gantt Chart On Daily Basis Template Pdf
Showcasing this set of slides titled Data Interpretation Project Management Gantt Chart On Daily Basis Template Pdf The topics addressed in these templates are Data Interpretation Icon, Measure Business Growth All the content presented in this PPT design is completely editable. Download it and make adjustments in color, background, font etc. as per your unique business setting. Our Data Interpretation Project Management Gantt Chart On Daily Basis Template Pdf are topically designed to provide an attractive backdrop to any subject. Use them to look like a presentation pro.
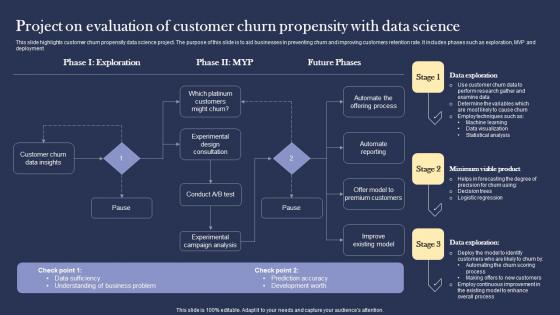
Project On Evaluation Of Customer Churn Propensity With Data Science Diagrams pdf
This slide highlights customer churn propensity data science project. The purpose of this slide is to aid businesses in preventing churn and improving customers retention rate. It includes phases such as exploration, MVP and deployment. Showcasing this set of slides titled Project On Evaluation Of Customer Churn Propensity With Data Science Diagrams pdf. The topics addressed in these templates are Determining Objective, Selection. All the content presented in this PPT design is completely editable. Download it and make adjustments in color, background, font etc. as per your unique business setting. This slide highlights customer churn propensity data science project. The purpose of this slide is to aid businesses in preventing churn and improving customers retention rate. It includes phases such as exploration, MVP and deployment.
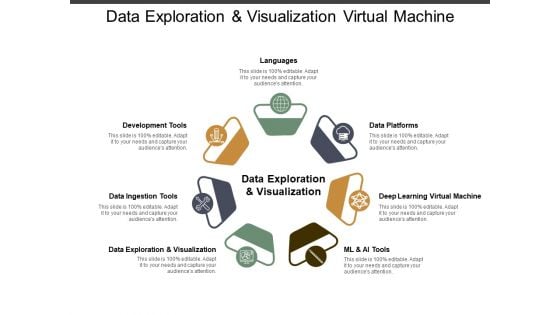
Data Exploration And Visualization Virtual Machine Ppt PowerPoint Presentation Infographics Diagrams
This is a data exploration and visualization virtual machine ppt powerpoint presentation infographics diagrams. This is a seven stage process. The stages in this process are data, analysis, data science, information science.

Data Science For Marketing And Sales Ppt PowerPoint Presentation Complete Deck With Slides
Share a great deal of information on the topic by deploying this Data Science For Marketing And Sales Ppt PowerPoint Presentation Complete Deck With Slides. Support your ideas and thought process with this prefabricated set. It includes a set of sixteen slides, all fully modifiable and editable. Each slide can be restructured and induced with the information and content of your choice. You can add or remove large content boxes as well, to make this PPT slideshow more personalized. Its high-quality graphics and visuals help in presenting a well-coordinated pitch. This PPT template is also a resourceful tool to take visual cues from and implement the best ideas to help your business grow and expand. The main attraction of this well-formulated deck is that everything is editable, giving you the freedom to adjust it to your liking and choice. Changes can be made in the background and theme as well to deliver an outstanding pitch. Therefore, click on the download button now to gain full access to this multifunctional set. Our Data Science For Marketing And Sales Ppt PowerPoint Presentation Complete Deck With Slides are topically designed to provide an attractive backdrop to any subject. Use them to look like a presentation pro.
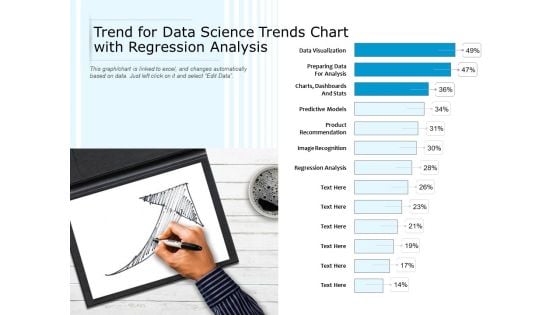
Trend For Data Science Trends Chart With Regression Analysis Ppt PowerPoint Presentation Visual Aids Layouts PDF
Showcasing this set of slides titled trend for data science trends chart with regression analysis ppt powerpoint presentation visual aids layouts pdf. The topics addressed in these templates are data visualization, preparing data for analysis, dashboards and stats, predictive models. All the content presented in this PPT design is completely editable. Download it and make adjustments in color, background, font etc. as per your unique business setting.
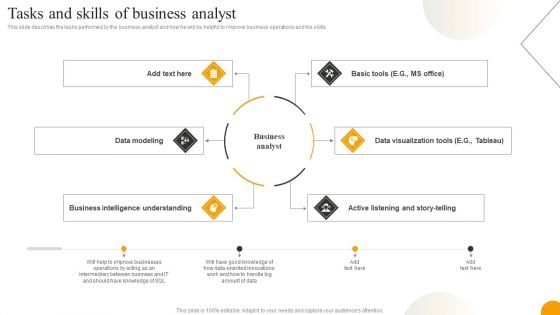
Using Data Science Technologies For Business Transformation Tasks And Skills Of Business Analyst Summary PDF
This slide represents the role of data science in decision making, and it includes collection and acquisition, storage, cleaning of data, integration, analysis, and actions. Whether you have daily or monthly meetings, a brilliant presentation is necessary. Using Data Science Technologies For Business Transformation Tasks And Skills Of Business Analyst Summary PDF can be your best option for delivering a presentation. Represent everything in detail using Using Data Science Technologies For Business Transformation Tasks And Skills Of Business Analyst Summary PDF and make yourself stand out in meetings. The template is versatile and follows a structure that will cater to your requirements. All the templates prepared by Slidegeeks are easy to download and edit. Our research experts have taken care of the corporate themes as well. So, give it a try and see the results.
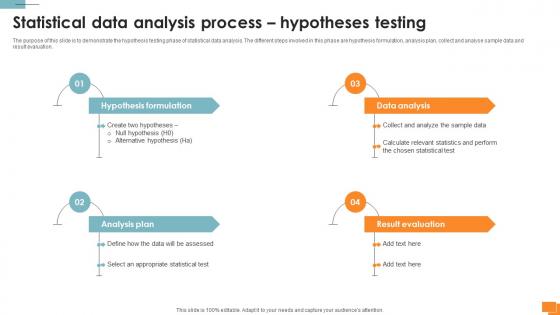
A134 Statistical Tools For Evidence Statistical Data Analysis Process Hypotheses Testing
The purpose of this slide is to demonstrate the hypothesis testing phase of statistical data analysis. The different steps involved in this phase are hypothesis formulation, analysis plan, collect and analyse sample data and result evaluation. Create an editable A134 Statistical Tools For Evidence Statistical Data Analysis Process Hypotheses Testing that communicates your idea and engages your audience. Whether you are presenting a business or an educational presentation, pre-designed presentation templates help save time. A134 Statistical Tools For Evidence Statistical Data Analysis Process Hypotheses Testing is highly customizable and very easy to edit, covering many different styles from creative to business presentations. Slidegeeks has creative team members who have crafted amazing templates. So, go and get them without any delay. The purpose of this slide is to demonstrate the hypothesis testing phase of statistical data analysis. The different steps involved in this phase are hypothesis formulation, analysis plan, collect and analyse sample data and result evaluation.
Business Diagram Big Data Written In Brain Made Of Pcb Board Ppt Slide
To define the concept of human intelligence and data technology we have designed an exclusive diagram. This slide contains the graphic of human brain and text of big data with PCB board graphics. Use this slide to build an innovative presentation for your viewers.
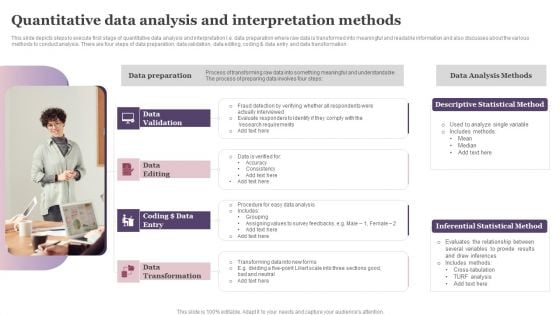
Quantitative Data Analysis And Interpretation Methods Ppt Ideas Graphics Tutorials PDF
This slide depicts steps to execute first stage of quantitative data analysis and interpretation I.e. data preparation where raw data is transformed into meaningful and readable information and also discusses about the various methods to conduct analysis. There are four steps of data preparation data validation, data editing, coding and data entry and data transformation. Presenting Quantitative Data Analysis And Interpretation Methods Ppt Ideas Graphics Tutorials PDF to dispense important information. This template comprises four stages. It also presents valuable insights into the topics including Data Validation, Data Editing, Data Preparation. This is a completely customizable PowerPoint theme that can be put to use immediately. So, download it and address the topic impactfully.
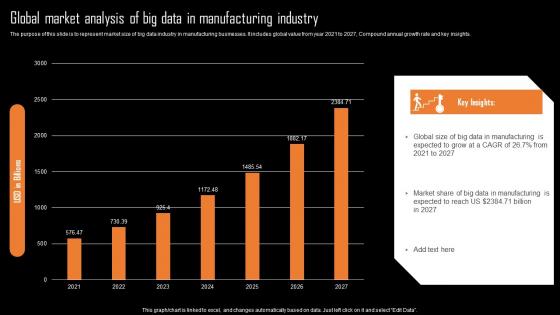
Global Market Analysis Of Big Data In Manufacturing Industry Information Pdf
The purpose of this slide is to represent market size of big data industry in manufacturing businesses. It includes global value from year 2021 to 2027, Compound annual growth rate and key insights.Showcasing this set of slides titled Global Market Analysis Of Big Data In Manufacturing Industry Information Pdf The topics addressed in these templates are Data Manufacturing, Expected Grow, Data Manufacturing All the content presented in this PPT design is completely editable. Download it and make adjustments in color, background, font etc. as per your unique business setting. The purpose of this slide is to represent market size of big data industry in manufacturing businesses. It includes global value from year 2021 to 2027, Compound annual growth rate and key insights.
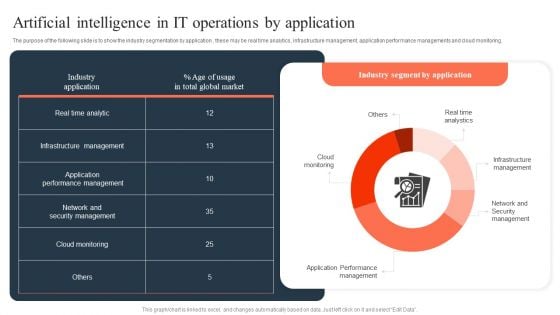
Ml And Big Data In Information Technology Processes Artificial Intelligence In IT Operations Mockup PDF
The purpose of the following slide is to show the industry segmentation by application , these may be real time analytics, infrastructure management, application performance managements and cloud monitoring. Are you in need of a template that can accommodate all of your creative concepts This one is crafted professionally and can be altered to fit any style. Use it with Google Slides or PowerPoint. Include striking photographs, symbols, depictions, and other visuals. Fill, move around, or remove text boxes as desired. Test out color palettes and font mixtures. Edit and save your work, or work with colleagues. Download Ml And Big Data In Information Technology Processes Artificial Intelligence In IT Operations Mockup PDF and observe how to make your presentation outstanding. Give an impeccable presentation to your group and make your presentation unforgettable.
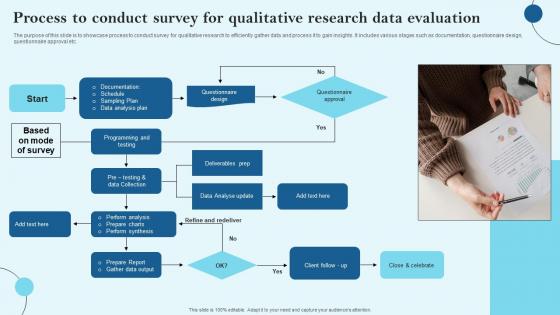
Process To Conduct Survey For Qualitative Research Data Evaluation Diagrams Pdf
The purpose of this slide is to showcase process to conduct survey for qualitative research to efficiently gather data and process it to gain insights. It includes various stages such as documentation, questionnaire design, questionnaire approval etc. Showcasing this set of slides titled Process To Conduct Survey For Qualitative Research Data Evaluation Diagrams Pdf The topics addressed in these templates are Data Analysis Plan, Data Analyse Update, Questionnaire Approval All the content presented in this PPT design is completely editable. Download it and make adjustments in color, background, font etc. as per your unique business setting. The purpose of this slide is to showcase process to conduct survey for qualitative research to efficiently gather data and process it to gain insights. It includes various stages such as documentation, questionnaire design, questionnaire approval etc.
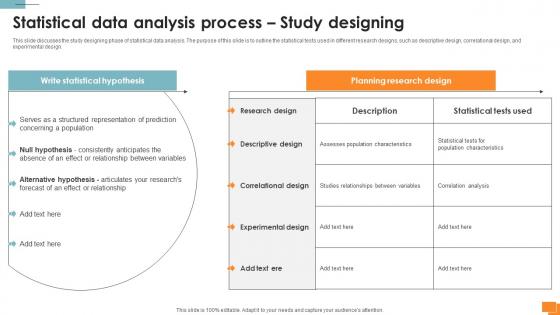
A135 Statistical Tools For Evidence Statistical Data Analysis Process Study Designing
This slide discusses the study designing phase of statistical data analysis. The purpose of this slide is to outline the statistical tests used in different research designs, such as descriptive design, correlational design, and experimental design. Slidegeeks is one of the best resources for PowerPoint templates. You can download easily and regulate A135 Statistical Tools For Evidence Statistical Data Analysis Process Study Designing for your personal presentations from our wonderful collection. A few clicks is all it takes to discover and get the most relevant and appropriate templates. Use our Templates to add a unique zing and appeal to your presentation and meetings. All the slides are easy to edit and you can use them even for advertisement purposes. This slide discusses the study designing phase of statistical data analysis. The purpose of this slide is to outline the statistical tests used in different research designs, such as descriptive design, correlational design, and experimental design.
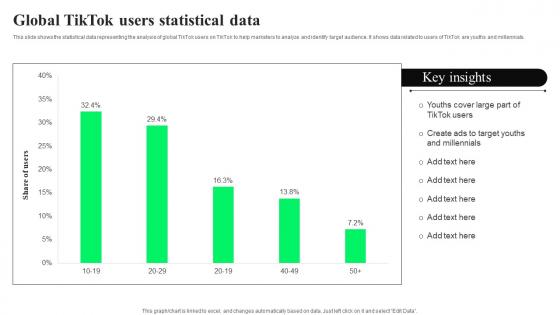
Global TikTok Users Statistical Data TikTok Advertising Strategies To Provide Effective Background Pdf
This slide shows the statistical data representing the analysis of global TikTok users on TikTok to help marketers to analyze and identify target audience. It shows data related to users of TikTok are youths and millennials. If your project calls for a presentation, then Slidegeeks is your go to partner because we have professionally designed, easy to edit templates that are perfect for any presentation. After downloading, you can easily edit Global TikTok Users Statistical Data TikTok Advertising Strategies To Provide Effective Background Pdf and make the changes accordingly. You can rearrange slides or fill them with different images. Check out all the handy templates This slide shows the statistical data representing the analysis of global TikTok users on TikTok to help marketers to analyze and identify target audience. It shows data related to users of TikTok are youths and millennials.
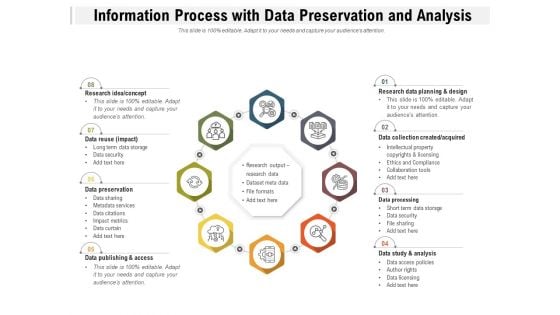
Information Process With Data Preservation And Analysis Ppt PowerPoint Presentation Styles Graphics Tutorials PDF
Presenting information process with data preservation and analysis ppt powerpoint presentation styles graphics tutorials pdf to dispense important information. This template comprises eight stages. It also presents valuable insights into the topics including research idea, concept, data reuse, data preservation, data publishing and access, research data planning and design, data collection created, acquired, data processing, data study and analysis. This is a completely customizable PowerPoint theme that can be put to use immediately. So, download it and address the topic impactfully.

Data Governance Steps Review Tools Setup Ppt PowerPoint Presentation Visual Aids Diagrams
This is a data governance steps review tools setup ppt powerpoint presentation visual aids diagrams. This is a five stage process. The stages in this process are data analysis, data review, data evaluation.

 Home
Home