Data Analytics Icons

Customer Relationship Management Action Plan Crm Data Analysis Current Ideas PDF
Deliver an awe inspiring pitch with this creative customer relationship management action plan crm data analysis current ideas pdf bundle. Topics like crm data analysis can be discussed with this completely editable template. It is available for immediate download depending on the needs and requirements of the user.
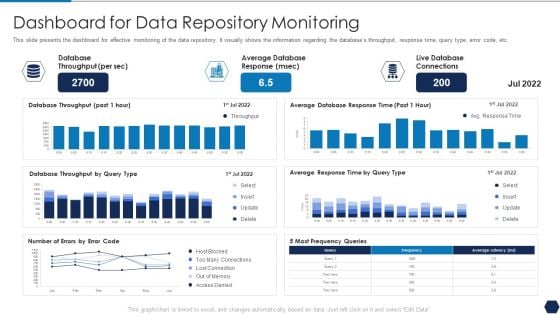
Tactical Plan For Upgrading DBMS Dashboard For Data Repository Monitoring Diagrams PDF
This slide presents the dashboard for effective monitoring of the data repository. It visually shows the information regarding the databases throughput, response time, query type, error code, etc. Deliver and pitch your topic in the best possible manner with this tactical plan for upgrading dbms dashboard for data repository monitoring diagrams pdf. Use them to share invaluable insights on database throughput, average database response, live database connections and impress your audience. This template can be altered and modified as per your expectations. So, grab it now.
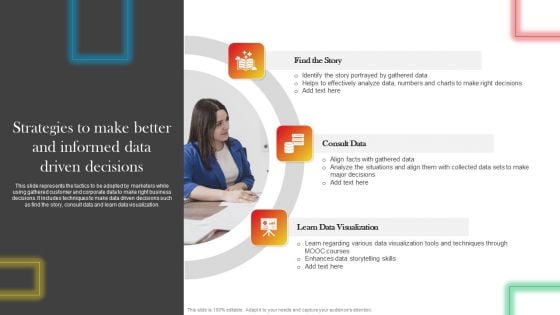
Strategies To Make Better And Informed Data Driven Decisions Introduction PDF
This slide represents the tactics to be adopted by marketers while using gathered customer and corporate data to make right business decisions. It includes techniques to make data driven decisions such as find the story, consult data and learn data visualization. Are you searching for a Strategies To Make Better And Informed Data Driven Decisions Introduction PDF that is uncluttered, straightforward, and original Its easy to edit, and you can change the colors to suit your personal or business branding. For a presentation that expresses how much effort you have put in, this template is ideal With all of its features, including tables, diagrams, statistics, and lists, its perfect for a business plan presentation. Make your ideas more appealing with these professional slides. Download Strategies To Make Better And Informed Data Driven Decisions Introduction PDF from Slidegeeks today.
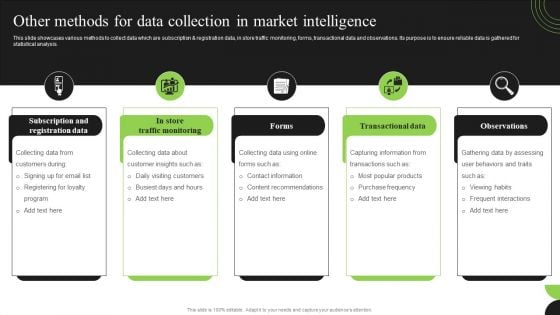
Guidebook For Executing Business Market Intelligence Other Methods For Data Collection Demonstration PDF
This slide showcases various methods to collect data which are subscription and registration data, in store traffic monitoring, forms, transactional data and observations. Its purpose is to ensure reliable data is gathered for statistical analysis. Are you searching for a Guidebook For Executing Business Market Intelligence Other Methods For Data Collection Demonstration PDF that is uncluttered, straightforward, and original Its easy to edit, and you can change the colors to suit your personal or business branding. For a presentation that expresses how much effort you have put in, this template is ideal With all of its features, including tables, diagrams, statistics, and lists, its perfect for a business plan presentation. Make your ideas more appealing with these professional slides. Download Guidebook For Executing Business Market Intelligence Other Methods For Data Collection Demonstration PDF from Slidegeeks today.
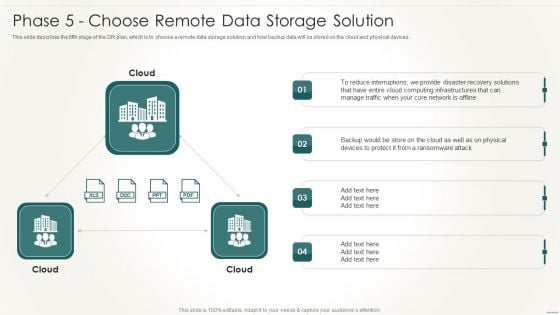
Information Technology Disaster Resilience Plan Phase 5 Choose Remote Data Storage Solution Slides PDF
This slide describes the fifth stage of the DR plan, which is to choose a remote data storage solution and how backup data will be stored on the cloud and physical devices.Deliver an awe inspiring pitch with this creative Information Technology Disaster Resilience Plan Phase 5 Choose Remote Data Storage Solution Slides PDF bundle. Topics like Reduce Interruptions, Computing Infrastructures, Ransomware Attack can be discussed with this completely editable template. It is available for immediate download depending on the needs and requirements of the user.
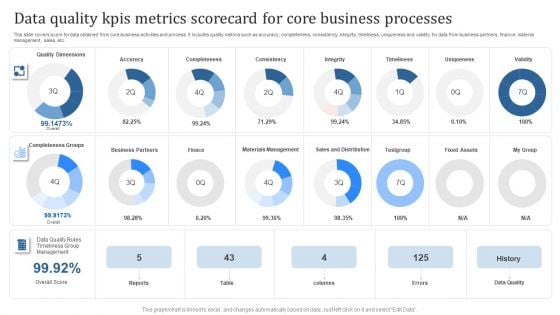
Data Quality Kpis Metrics Scorecard For Core Business Processes Topics PDF
This slide covers score for data obtained from core business activities and process. It includes quality metrics such as accuracy, completeness, consistency, integrity, timeliness, uniqueness and validity for data from business partners, finance, material management, sales, etc. Showcasing this set of slides titled Data Quality Kpis Metrics Scorecard For Core Business Processes Topics PDF. The topics addressed in these templates are Data Quality, Errors, Reports. All the content presented in this PPT design is completely editable. Download it and make adjustments in color, background, font etc. as per your unique business setting.
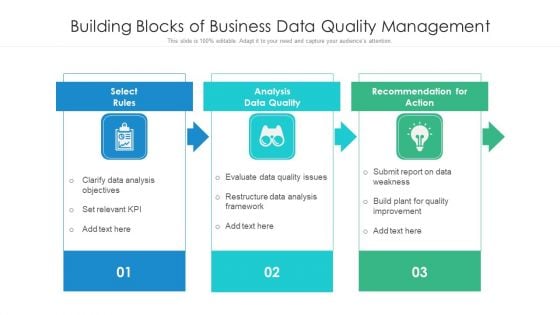
Building Blocks Of Business Data Quality Management Ppt PowerPoint Presentation Outline Samples PDF
Presenting building blocks of business data quality management ppt powerpoint presentation outline samples pdf to dispense important information. This template comprises three stages. It also presents valuable insights into the topics including data analysis objectives, analysis data quality, build plant for quality improvement. This is a completely customizable PowerPoint theme that can be put to use immediately. So, download it and address the topic impactfully.
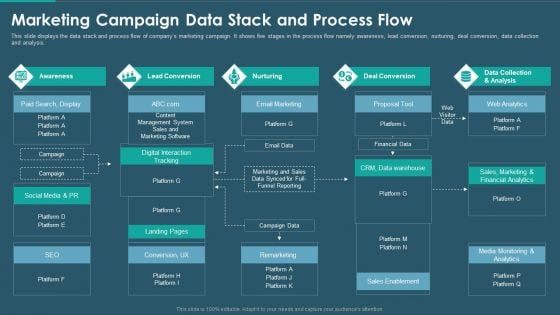
Sales And Promotion Playbook Marketing Campaign Data Stack And Process Flow Diagrams PDF
This slide displays the data stack and process flow of companys marketing campaign. It shows five stages in the process flow namely awareness, lead conversion, nurturing, deal conversion, data collection and analysis. Deliver and pitch your topic in the best possible manner with this sales and promotion playbook marketing campaign data stack and process flow diagrams pdf. Use them to share invaluable insights on deal conversion, data collection, lead conversion, awareness and impress your audience. This template can be altered and modified as per your expectations. So, grab it now.
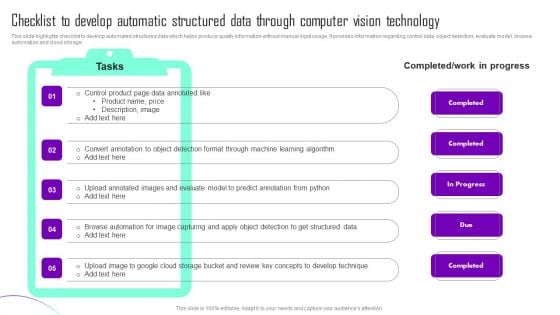
Checklist To Develop Automatic Structured Data Through Computer Vision Technology Graphics PDF
This slide highlights checklist to develop automated structured data which helps produce quality information without manual input usage. It provides information regarding control data, object detection, evaluate model, browse automation and cloud storage. Presenting Checklist To Develop Automatic Structured Data Through Computer Vision Technology Graphics PDF to dispense important information. This template comprises one stages. It also presents valuable insights into the topics including Control Product, Data Annotated Like, Convert Annotation Object Detection. This is a completely customizable PowerPoint theme that can be put to use immediately. So, download it and address the topic impactfully.
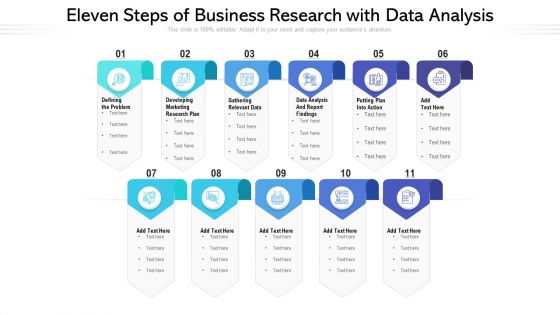
Eleven Steps Of Business Research With Data Analysis Ppt PowerPoint Presentation File Structure PDF
Presenting eleven steps of business research with data analysis ppt powerpoint presentation file structure pdf to dispense important information. This template comprises eleven stages. It also presents valuable insights into the topics including marketing, data analysis, developing. This is a completely customizable PowerPoint theme that can be put to use immediately. So, download it and address the topic impactfully.
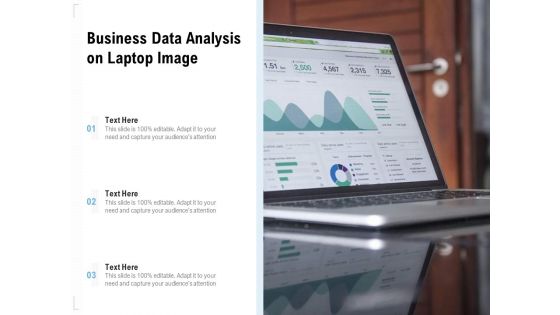
Business Data Analysis On Laptop Image Ppt PowerPoint Presentation Gallery Maker PDF
Presenting business data analysis on laptop image ppt powerpoint presentation gallery maker pdf. to dispense important information. This template comprises three stages. It also presents valuable insights into the topics including business data analysis on laptop image. This is a completely customizable PowerPoint theme that can be put to use immediately. So, download it and address the topic impactfully.
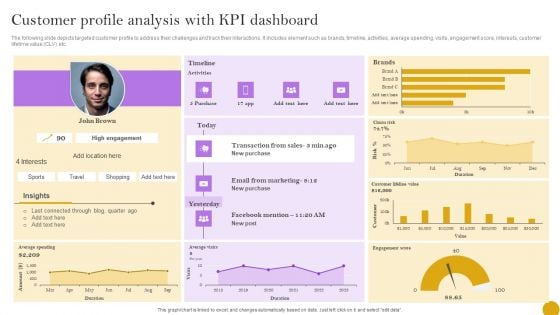
Comprehensive Customer Data Platform Guide Optimizing Promotional Initiatives Customer Profile Analysis KPI Dashboard Pictures PDF
The following slide depicts targeted customer profile to address their challenges and track their interactions. It includes element such as brands, timeline, activities, average spending, visits, engagement score, interests, customer lifetime value CLV etc. The best PPT templates are a great way to save time, energy, and resources. Slidegeeks have 100 percent editable powerpoint slides making them incredibly versatile. With these quality presentation templates, you can create a captivating and memorable presentation by combining visually appealing slides and effectively communicating your message. Download Comprehensive Customer Data Platform Guide Optimizing Promotional Initiatives Customer Profile Analysis KPI Dashboard Pictures PDF from Slidegeeks and deliver a wonderful presentation.
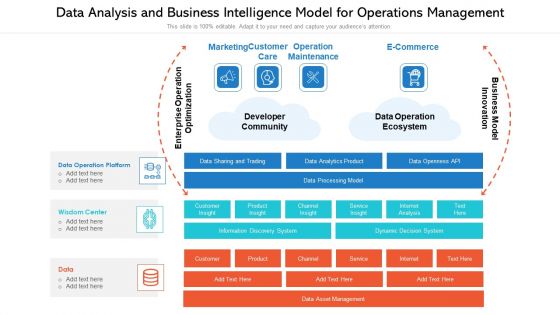
Data Analysis And Business Intelligence Model For Operations Management Ppt PowerPoint Presentation Rules PDF
Presenting data analysis and business intelligence model for operations management ppt powerpoint presentation rules pdf to dispense important information. This template comprises three stages. It also presents valuable insights into the topics including developer community, operation maintenance, data operation ecosystem . This is a completely customizable PowerPoint theme that can be put to use immediately. So, download it and address the topic impactfully.

KPI Dashboard Of Data Warehouse With Expansion By Months Themes PDF
Showcasing this set of slides titled KPI Dashboard Of Data Warehouse With Expansion By Months Themes PDF The topics addressed in these templates are Customer Lifetime Value, Salesforce Revenue, Retention And Expansion All the content presented in this PPT design is completely editable. Download it and make adjustments in color, background, font etc. as per your unique business setting.
Q And A Diagram For Deduplication Data Ppt PowerPoint Presentation Gallery Backgrounds PDF
Presenting q and a diagram for deduplication data ppt powerpoint presentation gallery backgrounds pdf to dispense important information. This template comprises three stages. It also presents valuable insights into the topics including q and a diagram for deduplication data. This is a completely customizable PowerPoint theme that can be put to use immediately. So, download it and address the topic impactfully.
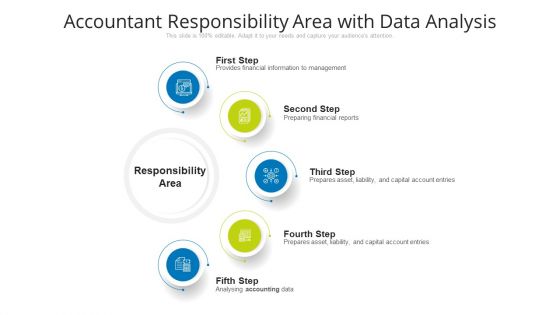
Accountant Responsibility Area With Data Analysis Ppt PowerPoint Presentation File Formats PDF
Presenting accountant responsibility area with data analysis ppt powerpoint presentation file formats pdf to dispense important information. This template comprises five stages. It also presents valuable insights into the topics including accountant responsibility area with data analysis. This is a completely customizable PowerPoint theme that can be put to use immediately. So, download it and address the topic impactfully.
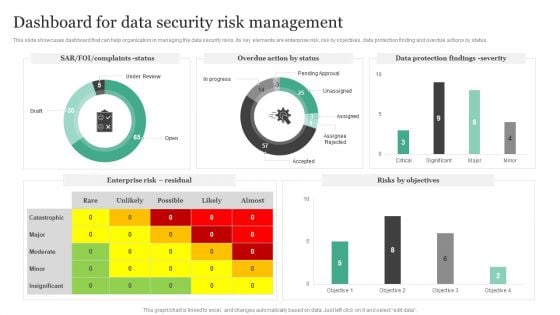
Dashboard For Data Security Risk Management Information Security Risk Administration Formats PDF
This slide showcases dashboard that can help organization in managing the data security risks. Its key elements are enterprise risk, risk by objectives, data protection finding and overdue actions by status.Slidegeeks is one of the best resources for PowerPoint templates. You can download easily and regulate Dashboard For Data Security Risk Management Information Security Risk Administration Formats PDF for your personal presentations from our wonderful collection. A few clicks is all it takes to discover and get the most relevant and appropriate templates. Use our Templates to add a unique zing and appeal to your presentation and meetings. All the slides are easy to edit and you can use them even for advertisement purposes.
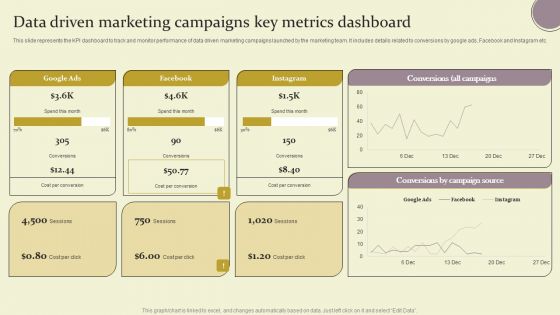
Data Driven Marketing Campaigns Key Metrics Dashboard Ppt Outline Example Introduction PDF
This slide represents the KPI dashboard to track and monitor performance of data driven marketing campaigns launched by the marketing team. It includes details related to conversions by google ads, Facebook and Instagram etc. Explore a selection of the finest Data Driven Marketing Campaigns Key Metrics Dashboard Ppt Outline Example Introduction PDF here. With a plethora of professionally designed and pre made slide templates, you can quickly and easily find the right one for your upcoming presentation. You can use our Data Driven Marketing Campaigns Key Metrics Dashboard Ppt Outline Example Introduction PDF to effectively convey your message to a wider audience. Slidegeeks has done a lot of research before preparing these presentation templates. The content can be personalized and the slides are highly editable. Grab templates today from Slidegeeks.
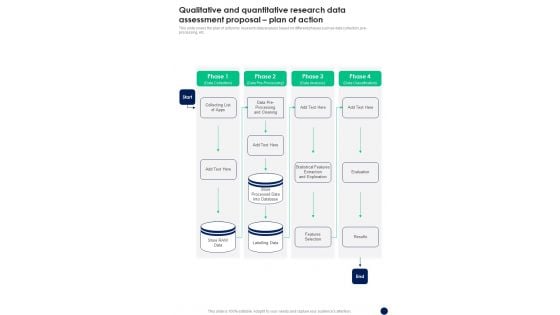
Qualitative And Quantitative Research Data Assessment Proposal Plan Of Action One Pager Sample Example Document
This slide covers the plan of action for research data analysis based on different phases such as data collection, pre- processing, etc. Presenting you an exemplary Qualitative And Quantitative Research Data Assessment Proposal Plan Of Action One Pager Sample Example Document. Our one pager comprises all the must have essentials of an inclusive document. You can edit it with ease, as its layout is completely editable. With such freedom, you can tweak its design and other elements to your requirements. Download this Qualitative And Quantitative Research Data Assessment Proposal Plan Of Action One Pager Sample Example Document brilliant piece now.
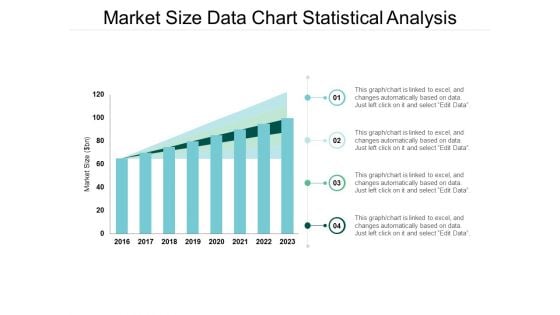
Market Size Data Chart Statistical Analysis Ppt Powerpoint Presentation Model Format
This is a market size data chart statistical analysis ppt powerpoint presentation model format. The topics discussed in this diagram are market growth, market opportunity, market profitability. This is a completely editable PowerPoint presentation, and is available for immediate download.
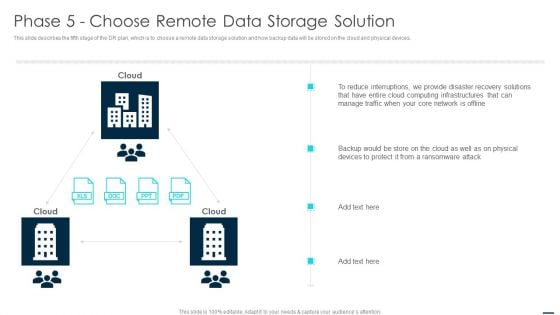
Technology Disaster Recovery Plan Phase 5 Choose Remote Data Storage Solution Professional PDF
This slide describes the fifth stage of the DR plan, which is to choose a remote data storage solution and how backup data will be stored on the cloud and physical devices. Presenting Technology Disaster Recovery Plan Phase 5 Choose Remote Data Storage Solution Professional PDF to provide visual cues and insights. Share and navigate important information on three stages that need your due attention. This template can be used to pitch topics like Network, Cloud, Reduce Interruptions. In addtion, this PPT design contains high resolution images, graphics, etc, that are easily editable and available for immediate download.
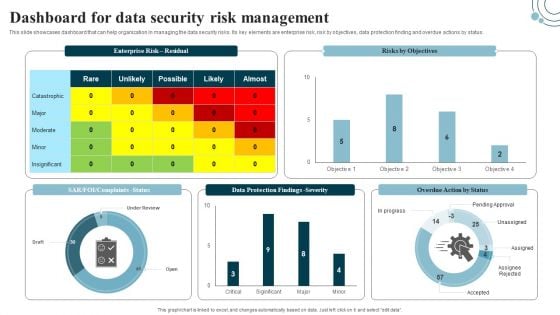
Developing IT Security Strategy Dashboard For Data Security Risk Management Pictures PDF
This slide showcases dashboard that can help organization in managing the data security risks. Its key elements are enterprise risk, risk by objectives, data protection finding and overdue actions by status. Slidegeeks has constructed Developing IT Security Strategy Dashboard For Data Security Risk Management Pictures PDF after conducting extensive research and examination. These presentation templates are constantly being generated and modified based on user preferences and critiques from editors. Here, you will find the most attractive templates for a range of purposes while taking into account ratings and remarks from users regarding the content. This is an excellent jumping-off point to explore our content and will give new users an insight into our top-notch PowerPoint Templates.
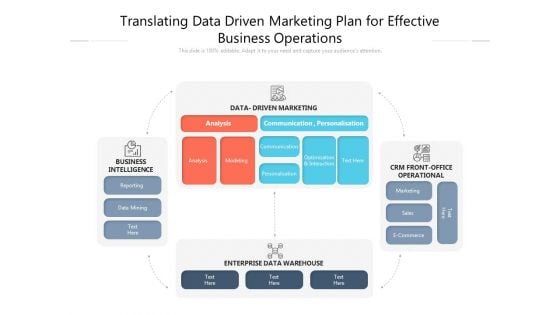
Translating Data Driven Marketing Plan For Effective Business Operations Ppt PowerPoint Presentation Ideas Visuals PDF
Presenting translating data driven marketing plan for effective business operations ppt powerpoint presentation ideas visuals pdf to dispense important information. This template comprises four stages. It also presents valuable insights into the topics including data driven marketing, crm front office operational, analysis, modeling, business intelligence, enterprise data warehouse. This is a completely customizable PowerPoint theme that can be put to use immediately. So, download it and address the topic impactfully.
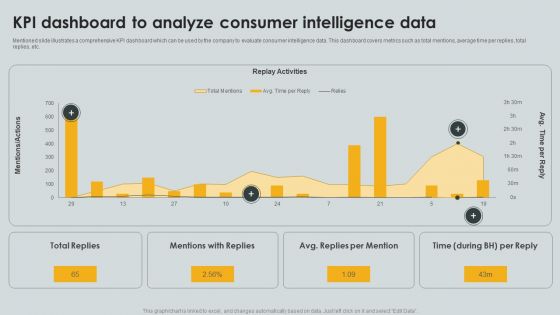
KPI Dashboard To Analyze Consumer Intelligence Data Ppt PowerPoint Presentation File Portfolio PDF
Mentioned slide illustrates a comprehensive KPI dashboard which can be used by the company to evaluate consumer intelligence data. This dashboard covers metrics such as total mentions, average time per replies, total replies, etc. Pitch your topic with ease and precision using this KPI Dashboard To Analyze Consumer Intelligence Data Ppt PowerPoint Presentation File Portfolio PDF. This layout presents information on Replay Activities, Total Replies, Mentions Replies. It is also available for immediate download and adjustment. So, changes can be made in the color, design, graphics or any other component to create a unique layout.

Dashboard Depicting Website Data Insights Creating Branding Techniques To Increase Brand Awareness Structure PDF
This slide shows the dashboard that depicts website data insights which covers channels such as display, social and email with total sessions, pages, average session duration, bounce rate, goal completion.Do you have to make sure that everyone on your team knows about any specific topic I yes, then you should give Dashboard Depicting Website Data Insights Creating Branding Techniques To Increase Brand Awareness Structure PDF a try. Our experts have put a lot of knowledge and effort into creating this impeccable Dashboard Depicting Website Data Insights Creating Branding Techniques To Increase Brand Awareness Structure PDF. You can use this template for your upcoming presentations, as the slides are perfect to represent even the tiniest detail. You can download these templates from the Slidegeeks website and these are easy to edit. So grab these today.
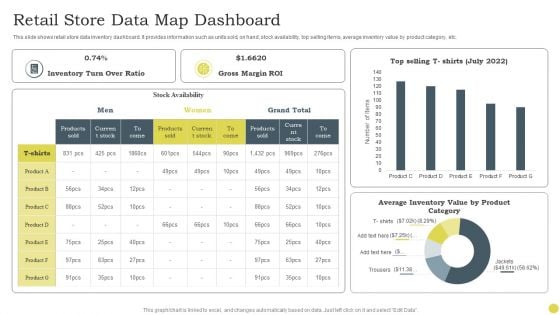
Retail Store Data Map Dashboard Ppt PowerPoint Presentation Gallery Display PDF
This slide shows retail store data inventory dashboard. It provides information such as units sold, on hand, stock availability, top selling items, average inventory value by product category, etc. Pitch your topic with ease and precision using this Retail Store Data Map Dashboard Ppt PowerPoint Presentation Gallery Display PDF. This layout presents information on Inventory Turn, Over Ratio, Gross Margin ROI. It is also available for immediate download and adjustment. So, changes can be made in the color, design, graphics or any other component to create a unique layout.
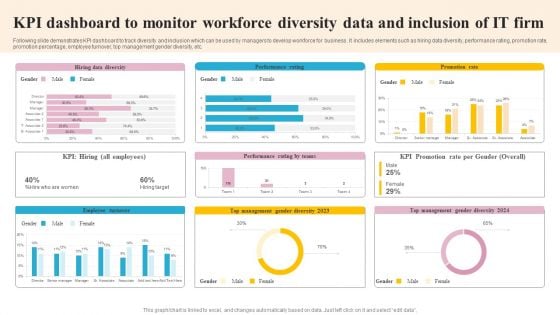
KPI Dashboard To Monitor Workforce Diversity Data And Inclusion Of IT Firm Slides PDF
Following slide demonstrates KPI dashboard to track diversity and inclusion which can be used by managers to develop workforce for business . It includes elements such as hiring data diversity, performance rating, promotion rate, promotion percentage, employee turnover, top management gender diversity, etc. Showcasing this set of slides titled KPI Dashboard To Monitor Workforce Diversity Data And Inclusion Of IT Firm Slides PDF. The topics addressed in these templates are Employee Turnover, Management, Promotion Rate. All the content presented in this PPT design is completely editable. Download it and make adjustments in color, background, font etc. as per your unique business setting.
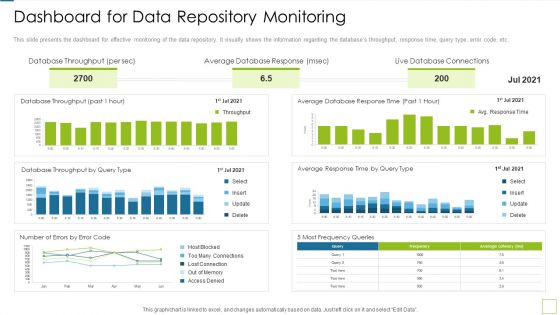
Database Expansion And Optimization Dashboard For Data Repository Monitoring Ppt Model Infographic Template
This slide presents the dashboard for effective monitoring of the data repository. It visually shows the information regarding the databases throughput, response time, query type, error code, etc. Deliver and pitch your topic in the best possible manner with this database expansion and optimization dashboard for data repository monitoring ppt model infographic template. Use them to share invaluable insights on database throughput, average database response, live database connections and impress your audience. This template can be altered and modified as per your expectations. So, grab it now.
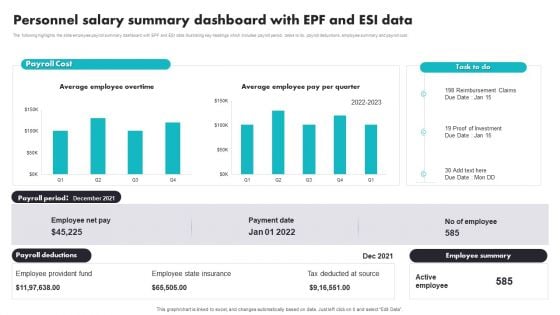
Personnel Salary Summary Dashboard With EPF And ESI Data Brochure PDF
The following highlights the slide employee payroll summary dashboard with EPF and ESI data illustrating key headings which includes payroll period, tasks to do, payroll deductions, employee summary and payroll cost. Pitch your topic with ease and precision using this Personnel Salary Summary Dashboard With EPF And ESI Data Brochure PDF. This layout presents information on Employee Provident Fund, Employee State Insurance, Tax Deducted At Source. It is also available for immediate download and adjustment. So, changes can be made in the color, design, graphics or any other component to create a unique layout.
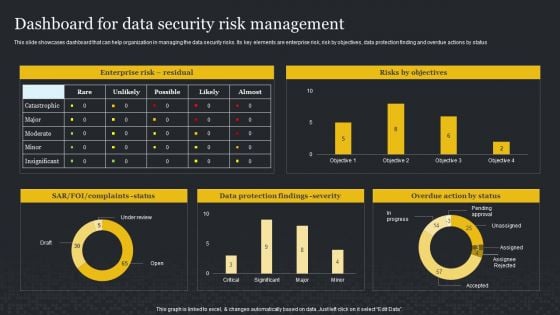
Dashboard For Data Security Risk Management Cybersecurity Risk Assessment Template PDF
This slide showcases dashboard that can help organization in managing the data security risks. Its key elements are enterprise risk, risk by objectives, data protection finding and overdue actions by status. Welcome to our selection of the Dashboard For Data Security Risk Management Cybersecurity Risk Assessment Template PDF. These are designed to help you showcase your creativity and bring your sphere to life. Planning and Innovation are essential for any business that is just starting out. This collection contains the designs that you need for your everyday presentations. All of our PowerPoints are 100 parcent editable, so you can customize them to suit your needs. This multi-purpose template can be used in various situations. Grab these presentation templates today.
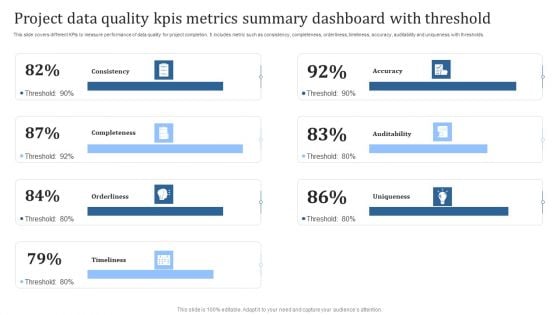
Project Data Quality Kpis Metrics Summary Dashboard With Threshold Guidelines PDF
This slide covers different KPIs to measure performance of data quality for project completion. It includes metric such as consistency, completeness, orderliness, timeliness, accuracy, auditability and uniqueness with thresholds. Pitch your topic with ease and precision using this Project Data Quality Kpis Metrics Summary Dashboard With Threshold Guidelines PDF. This layout presents information on Consistency, Completeness, Orderliness. It is also available for immediate download and adjustment. So, changes can be made in the color, design, graphics or any other component to create a unique layout.
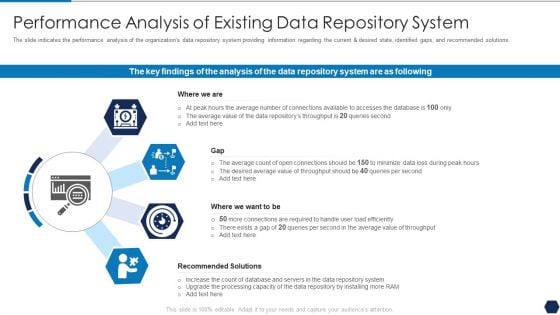
Tactical Plan For Upgrading DBMS Performance Analysis Of Existing Data Repository System Themes PDF
The slide indicates the performance analysis of the organizations data repository system providing information regarding the current and desired state, identified gaps, and recommended solutions. This is a tactical plan for upgrading dbms performance analysis of existing data repository system themes pdf template with various stages. Focus and dispense information on four stages using this creative set, that comes with editable features. It contains large content boxes to add your information on topics like performance analysis of existing data repository system. You can also showcase facts, figures, and other relevant content using this PPT layout. Grab it now.
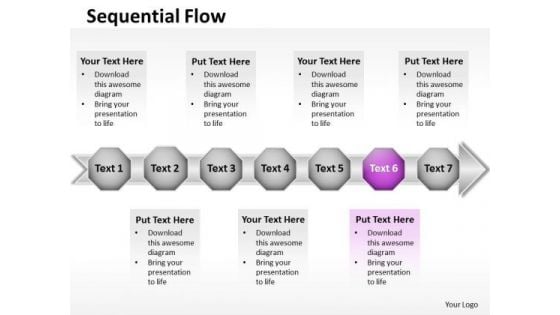
Ppt Pink Stage Business Data Flow Free Fishbone Diagram PowerPoint Template Templates
PPT pink stage business data flow free fishbone diagram PowerPoint template Templates-Arrows PowerPoint Diagram is nice for financial PowerPoint Diagram presentations as well as other analysis or business PowerPoint diagram needs. This image has been conceived to enable you to emphatically communicate your ideas in your Business PPT presentations.-PPT pink stage business data flow free fishbone diagram PowerPoint template Templates-arrow, art, assess, blue, business, chart, chevron, clip, clipart, colorful, compliance, corporate, design, development, diagram, flow, glossy, graphic, hierarchy, icon, illustration, implement, info graphic, levels, marketing, modern, plan, process, shape, shiny, square, stages, vector Add to your armoury with our Ppt Pink Stage Business Data Flow Free Fishbone Diagram PowerPoint Template Templates. Take up the contest with your thoughts.
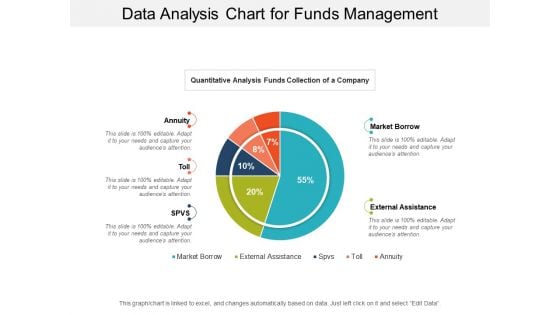
Data Analysis Chart For Funds Management Ppt PowerPoint Presentation Infographic Template Files
This is a data analysis chart for funds management ppt powerpoint presentation infographic template files. This is a five stage process. The stages in this process are financial analysis, quantitative, statistical modelling.
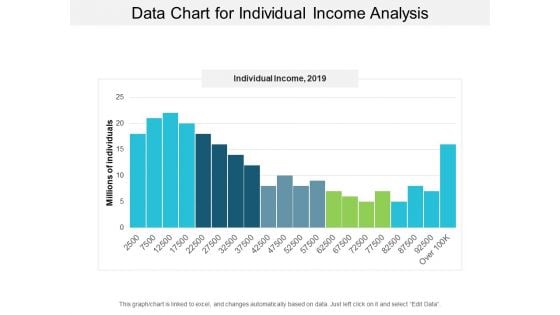
Data Chart For Individual Income Analysis Ppt PowerPoint Presentation Layouts Visual Aids
This is a data chart for individual income analysis ppt powerpoint presentation layouts visual aids. This is a five stage process. The stages in this process are financial analysis, quantitative, statistical modelling.
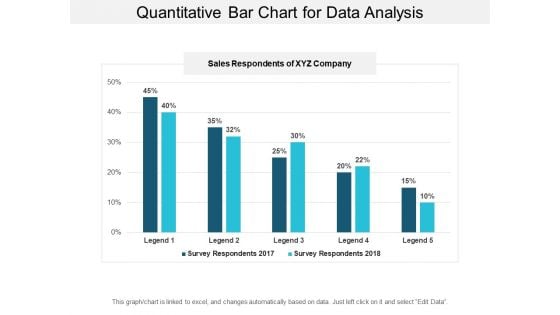
Quantitative Bar Chart For Data Analysis Ppt PowerPoint Presentation Model Graphic Tips
This is a quantitative bar chart for data analysis ppt powerpoint presentation model graphic tips. This is a two stage process. The stages in this process are financial analysis, quantitative, statistical modelling.
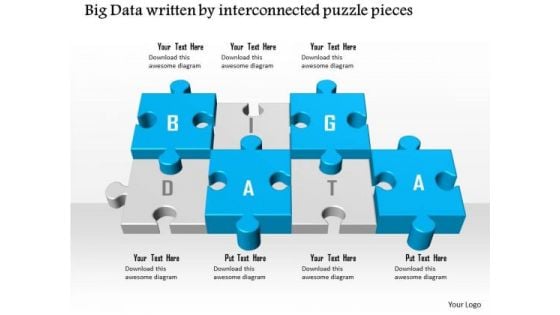
Business Diagram Big Data Written By Interconnected Puzzle Pieces Ppt Slide
Graphic of interconnected puzzles pieces with big data text are used to design this technology diagram. This diagram helps to depict the concept of data solution and strategy. Display your own analysis in any presentation by using this innovative template and build quality presentation for your viewers.
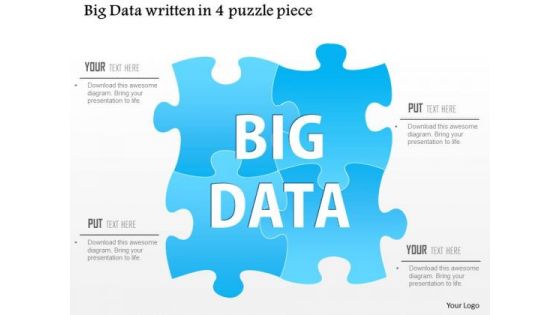
Business Diagram Big Data Written In A 4 Puzzle Piece Ppt Slide
Graphic of interconnected puzzles pieces with big data text are used to design this technology diagram. This diagram helps to depict the concept of data solution and strategy. Display your own analysis in any presentation by using this innovative template and build quality presentation for your viewers.
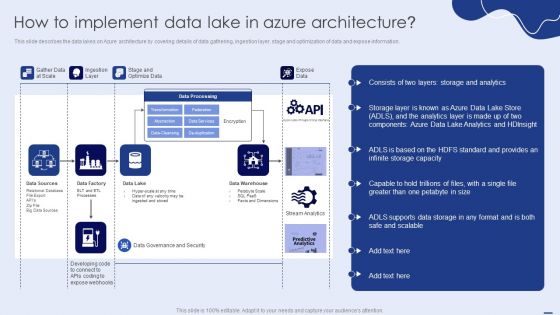
How To Implement Data Lake In Azure Architecture Ppt PowerPoint Presentation File Slides PDF
This slide describes the data lakes on Azure architecture by covering details of data gathering, ingestion layer, stage and optimization of data and expose information. Are you searching for a How To Implement Data Lake In Azure Architecture Ppt PowerPoint Presentation File Slides PDF that is uncluttered, straightforward, and original Its easy to edit, and you can change the colors to suit your personal or business branding. For a presentation that expresses how much effort you have put in, this template is ideal With all of its features, including tables, diagrams, statistics, and lists, its perfect for a business plan presentation. Make your ideas more appealing with these professional slides. Download How To Implement Data Lake In Azure Architecture Ppt PowerPoint Presentation File Slides PDF from Slidegeeks today.
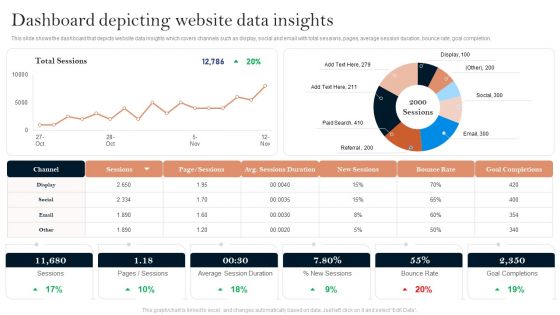
Successful Branding Technique For Electronic Commerce Corporation Dashboard Depicting Website Data Insights Microsoft PDF
Do you have to make sure that everyone on your team knows about any specific topic. I yes, then you should give Successful Branding Technique For Electronic Commerce Corporation Dashboard Depicting Website Data Insights Microsoft PDF a try. Our experts have put a lot of knowledge and effort into creating this impeccable Successful Branding Technique For Electronic Commerce Corporation Dashboard Depicting Website Data Insights Microsoft PDF. You can use this template for your upcoming presentations, as the slides are perfect to represent even the tiniest detail. You can download these templates from the Slidegeeks website and these are easy to edit. So grab these today.
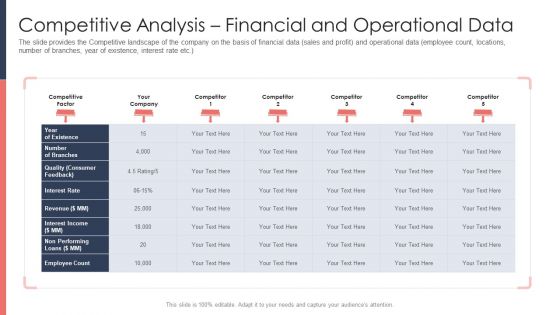
Pitch Deck For Fundraising From Post Market Financing Competitive Analysis Financial And Operational Data Themes PDF
The slide provides the Competitive landscape of the company on the basis of financial data sales and profit and operational data employee count, locations, number of branches, year of existence, interest rate etc.Deliver and pitch your topic in the best possible manner with this pitch deck for fundraising from post market financing competitive analysis financial and operational data themes pdf. Use them to share invaluable insights on quality consumer feedback, interest rate, employee count and impress your audience. This template can be altered and modified as per your expectations. So, grab it now.
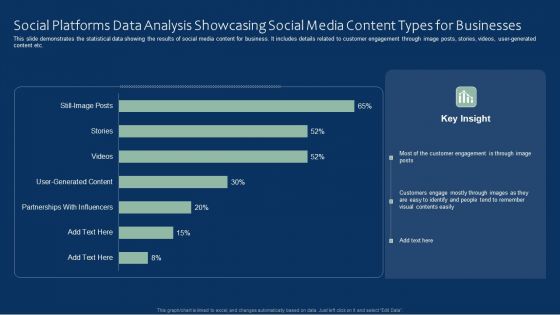
Social Platforms Data Analysis Showcasing Social Media Content Types For Businesses Inspiration PDF
This slide demonstrates the statistical data showing the results of social media content for business. It includes details related to customer engagement through image posts, stories, videos, user-generated content etc. Showcasing this set of slides titled Social Platforms Data Analysis Showcasing Social Media Content Types For Businesses Inspiration PDF. The topics addressed in these templates are Content Types For Businesses, Showcasing Social Media, Social Platforms Data Analysis. All the content presented in this PPT design is completely editable. Download it and make adjustments in color, background, font etc. as per your unique business setting.
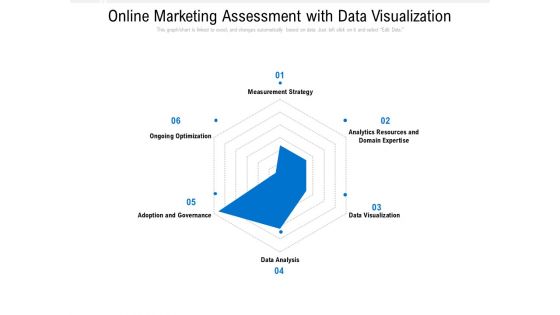
Online Marketing Assessment With Data Visualization Ppt PowerPoint Presentation Gallery Background Images PDF
Presenting this set of slides with name online marketing assessment with data visualization ppt powerpoint presentation gallery background images pdf. The topics discussed in these slides are strategy, data analysis, optimization. This is a completely editable PowerPoint presentation and is available for immediate download. Download now and impress your audience.
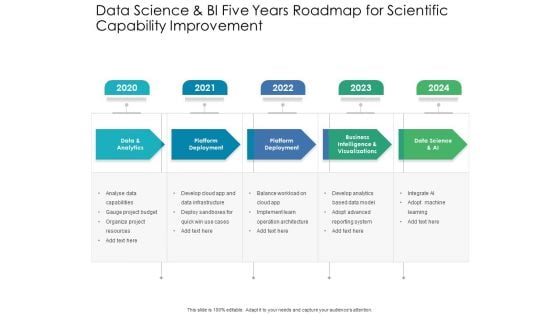
Data Science And BI Five Years Roadmap For Scientific Capability Improvement Formats
We present our data science and bi five years roadmap for scientific capability improvement formats. This PowerPoint layout is easy to edit so you can change the font size, font type, color, and shape conveniently. In addition to this, the PowerPoint layout is Google Slides compatible, so you can share it with your audience and give them access to edit it. Therefore, download and save this well researched data science and bi five years roadmap for scientific capability improvement formats in different formats like PDF, PNG, and JPG to smoothly execute your business plan.
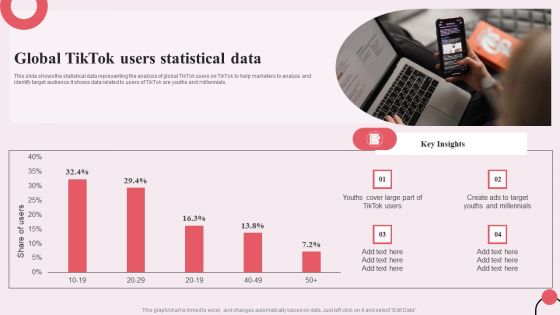
Tiktok Digital Marketing Campaign Global Tiktok Users Statistical Data Information PDF
This slide shows the statistical data representing the analysis of global TikTok users on TikTok to help marketers to analyze and identify target audience.It shows data related to users of TikTok are youths and millennials. Presenting this PowerPoint presentation, titled Tiktok Digital Marketing Campaign Global Tiktok Users Statistical Data Information PDF, with topics curated by our researchers after extensive research. This editable presentation is available for immediate download and provides attractive features when used. Download now and captivate your audience. Presenting this Tiktok Digital Marketing Campaign Global Tiktok Users Statistical Data Information PDF. Our researchers have carefully researched and created these slides with all aspects taken into consideration. This is a completely customizable Tiktok Digital Marketing Campaign Global Tiktok Users Statistical Data Information PDF that is available for immediate downloading. Download now and make an impact on your audience. Highlight the attractive features available with our PPTs.
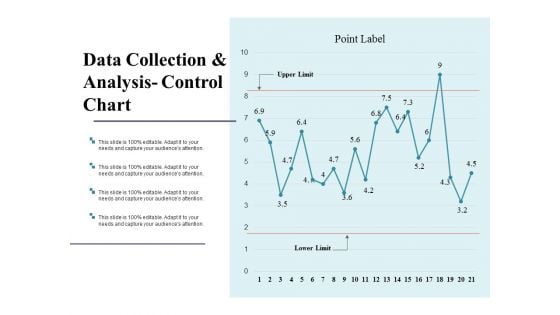
Data Collection And Analysis Control Chart Ppt PowerPoint Presentation Model Backgrounds
This is a data collection and analysis control chart ppt powerpoint presentation model backgrounds. This is a two stage process. The stages in this process are business, marketing, strategy, finance, analysis.
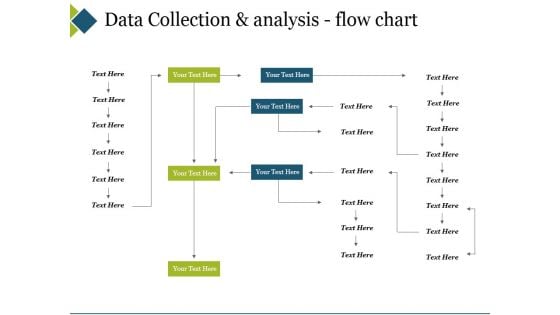
Data Collection And Analysis Flow Chart Ppt PowerPoint Presentation Model Rules
This is a data collection and analysis flow chart ppt powerpoint presentation model rules. This is a six stage process. The stages in this process are business, marketing, management, planning, chart.
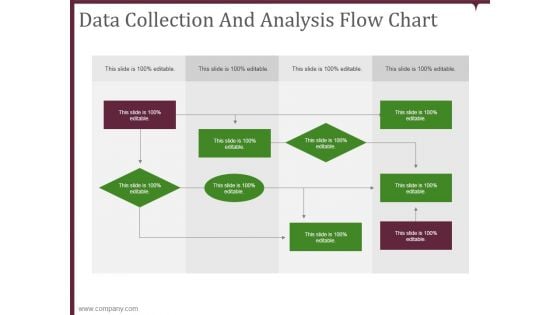
Data Collection And Analysis Flow Chart Template 1 Ppt PowerPoint Presentation Ideas Gridlines
This is a data collection and analysis flow chart template 1 ppt powerpoint presentation ideas gridlines. This is a nine stage process. The stages in this process are business, chart, organization, process, structure.
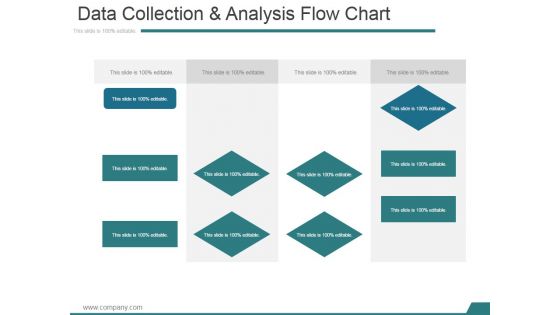
Data Collection And Analysis Flow Chart Template 2 Ppt PowerPoint Presentation Inspiration Layout Ideas
This is a data collection and analysis flow chart template 2 ppt powerpoint presentation inspiration layout ideas. This is a four stage process. The stages in this process are business, chart, organization, process, structure.
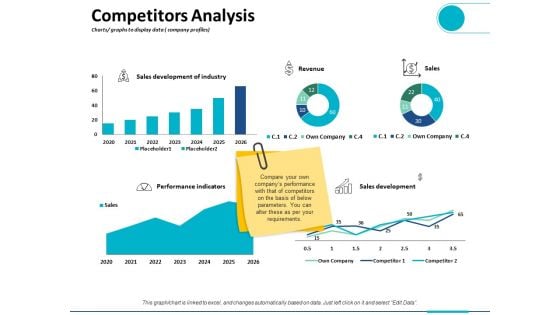
Competitors Analysis Charts Graphs To Display Data Company Profiles Ppt PowerPoint Presentation Outline Visual Aids
This is a competitors analysis charts graphs to display data company profiles ppt powerpoint presentation outline visual aids. This is a five stage process. The stages in this process are finance, analysis, business, investment, marketing.
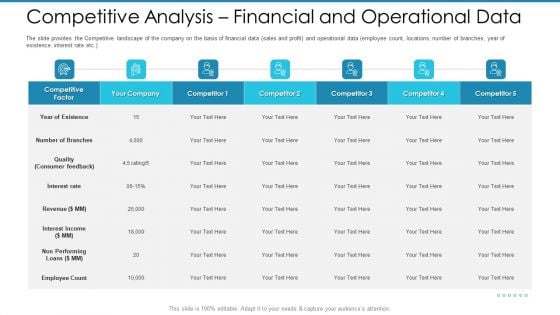
Post Initial Pubic Offering Market Pitch Deck Competitive Analysis Financial And Operational Data Diagrams PDF
The slide provides the Competitive landscape of the company on the basis of financial data sales and profit and operational data employee count, locations, number of branches, year of existence, interest rate etc.Deliver an awe-inspiring pitch with this creative post initial pubic offering market pitch deck competitive analysis financial and operational data diagrams pdf. bundle. Topics like interest rate, revenue interest income, non performing can be discussed with this completely editable template. It is available for immediate download depending on the needs and requirements of the user.
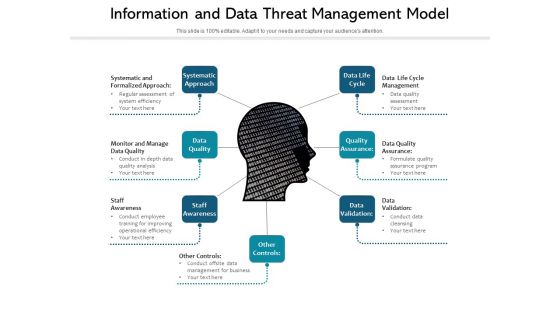
Information And Data Threat Management Model Ppt PowerPoint Presentation File Aids PDF
Presenting information and data threat management model ppt powerpoint presentation file aids pdf to dispense important information. This template comprises seven stages. It also presents valuable insights into the topics including systematic approach, data quality, staff awareness. This is a completely customizable PowerPoint theme that can be put to use immediately. So, download it and address the topic impactfully.
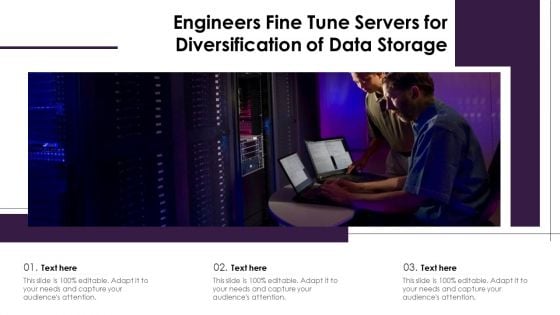
Engineers Fine Tune Servers For Diversification Of Data Storage Ppt Ideas Vector PDF
Presenting engineers fine tune servers for diversification of data storage ppt ideas vector pdf to dispense important information. This template comprises three stages. It also presents valuable insights into the topics including engineers fine tune servers for diversification of data storage. This is a completely customizable PowerPoint theme that can be put to use immediately. So, download it and address the topic impactfully.
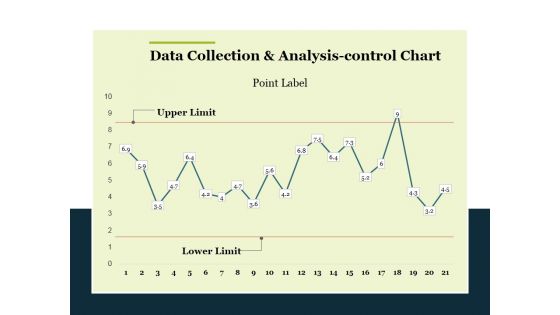
Data Collection And Analysis Control Chart Ppt PowerPoint Presentation Summary Templates
This is a data collection and analysis control chart ppt powerpoint presentation summary templates. This is a one stage process. The stages in this process are business, marketing, point label, upper limit, lower limit.
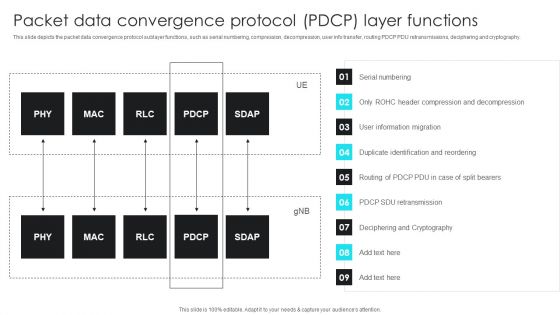
5G Network Operations Packet Data Convergence Protocol PDCP Layer Functions Themes PDF
This slide depicts the packet data convergence protocol sublayer functions, such as serial numbering, compression, decompression, user info transfer, routing PDCP PDU retransmissions, deciphering and cryptography. The 5G Network Operations Packet Data Convergence Protocol PDCP Layer Functions Themes PDF is a compilation of the most recent design trends as a series of slides. It is suitable for any subject or industry presentation, containing attractive visuals and photo spots for businesses to clearly express their messages. This template contains a variety of slides for the user to input data, such as structures to contrast two elements, bullet points, and slides for written information. Slidegeeks is prepared to create an impression.
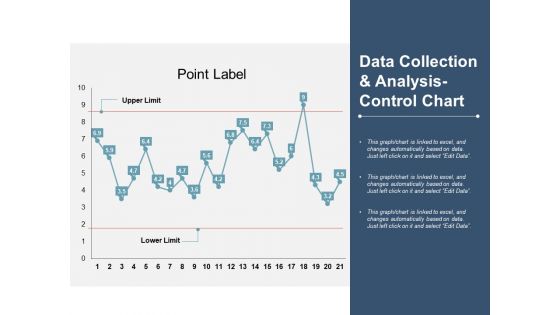
Data Collection And Analysis Control Chart Ppt PowerPoint Presentation Slide Download
This is a data collection and analysis control chart ppt powerpoint presentation slide download. This is a three stage process. The stages in this process are line chart, finance, marketing, management, investment.
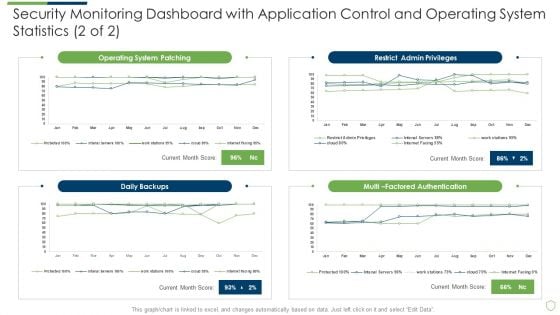
Modern Security Observation Plan To Eradicate Cybersecurity Risk And Data Breach Security Monitoring Dashboard Sample PDF
Deliver an awe inspiring pitch with this creative modern security observation plan to eradicate cybersecurity risk and data breach security monitoring dashboard sample pdf bundle. Topics like security monitoring dashboard with application control and operating system statistics can be discussed with this completely editable template. It is available for immediate download depending on the needs and requirements of the user.
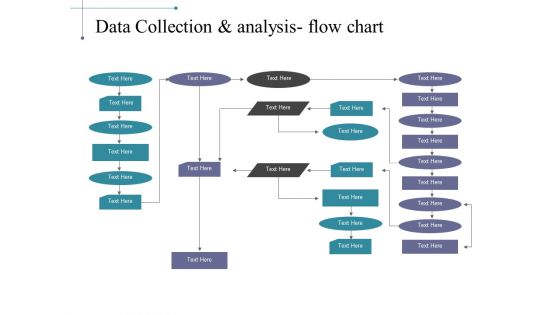
Data Collection And Analysis Flow Chart Ppt PowerPoint Presentation Ideas Images
This is a data collection and analysis flow chart ppt powerpoint presentation ideas images. This is a five stage process. The stages in this process are flow, marketing, strategy, process, arrows.
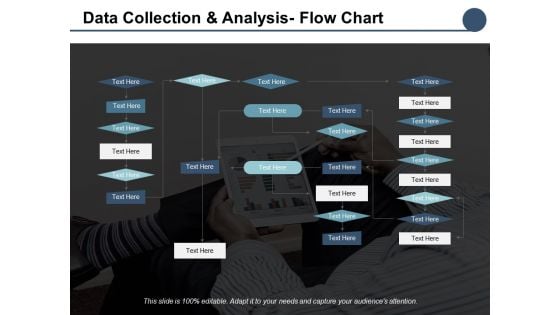
Data Collection And Analysis Flow Chart Ppt PowerPoint Presentation Outline Graphics
This is a data collection and analysis flow chart ppt powerpoint presentation outline graphics. This is a five stage process. The stages in this process are business, management, planning, strategy, marketing.
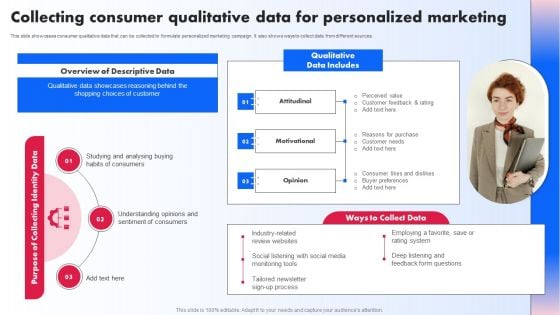
Collecting Consumer Qualitative Data For Personalized Marketing Ppt PowerPoint Presentation Diagram Graph Charts PDF
This slide showcases consumer qualitative data that can be collected to formulate personalized marketing campaign. It also shows ways to collect data from different sources Do you have an important presentation coming up Are you looking for something that will make your presentation stand out from the rest Look no further than Collecting Consumer Qualitative Data For Personalized Marketing Ppt PowerPoint Presentation Diagram Graph Charts PDF. With our professional designs, you can trust that your presentation will pop and make delivering it a smooth process. And with Slidegeeks, you can trust that your presentation will be unique and memorable. So why wait Grab Collecting Consumer Qualitative Data For Personalized Marketing Ppt PowerPoint Presentation Diagram Graph Charts PDF today and make your presentation stand out from the rest.
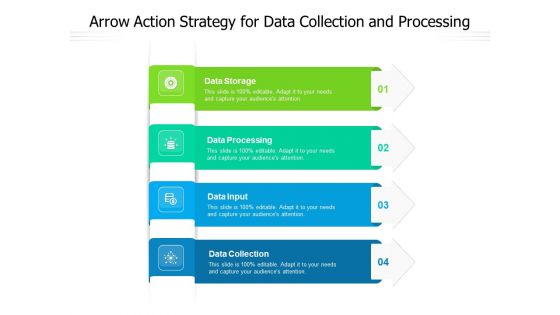
Arrow Action Strategy For Data Collection And Processing Ppt PowerPoint Presentation Infographic Template Gridlines PDF
Presenting arrow action strategy for data collection and processing ppt powerpoint presentation infographic template gridlines pdf to dispense important information. This template comprises four stages. It also presents valuable insights into the topics including data processing, storage, collection. This is a completely customizable PowerPoint theme that can be put to use immediately. So, download it and address the topic impactfully.
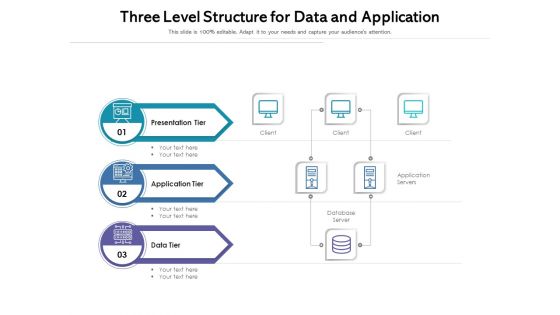
Three Level Structure For Data And Application Ppt PowerPoint Presentation File Background PDF
Presenting three level structure for data and application ppt powerpoint presentation file background pdf to dispense important information. This template comprises three stages. It also presents valuable insights into the topics including presentation tier, application tier, data tier. This is a completely customizable PowerPoint theme that can be put to use immediately. So, download it and address the topic impactfully.
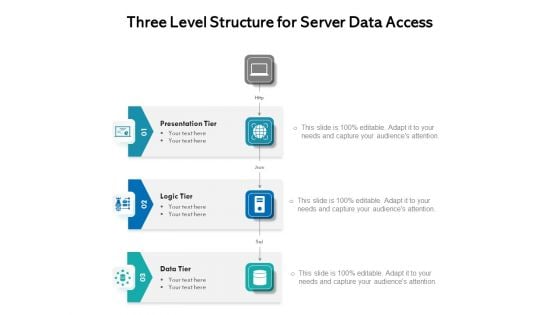
Three Level Structure For Server Data Access Ppt PowerPoint Presentation Gallery Layouts PDF
Presenting three level structure for server data access ppt powerpoint presentation gallery layouts pdf to dispense important information. This template comprises three stages. It also presents valuable insights into the topics including presentation tier, logic tier, data tier. This is a completely customizable PowerPoint theme that can be put to use immediately. So, download it and address the topic impactfully.
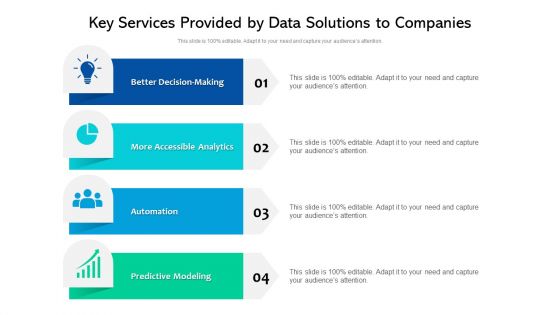
Key Services Provided By Data Solutions To Companies Ppt PowerPoint Presentation File Summary PDF
Presenting key services provided by data solutions to companies ppt powerpoint presentation file summary pdf to dispense important information. This template comprises four stages. It also presents valuable insights into the topics including key services provided by data solutions to companies. This is a completely customizable PowerPoint theme that can be put to use immediately. So, download it and address the topic impactfully.
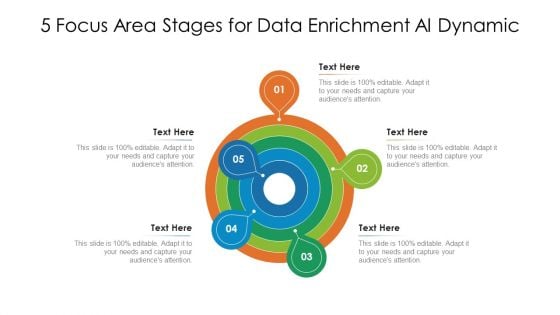
5 Focus Area Stages For Data Enrichment Ai Dynamics Ppt Pictures Graphics Tutorials PDF
Presenting 5 focus area stages for data enrichment ai dynamics ppt pictures graphics tutorials pdf to dispense important information. This template comprises five stages. It also presents valuable insights into the topics including 5 focus area stages for data enrichment ai dynamics. This is a completely customizable PowerPoint theme that can be put to use immediately. So, download it and address the topic impactfully.
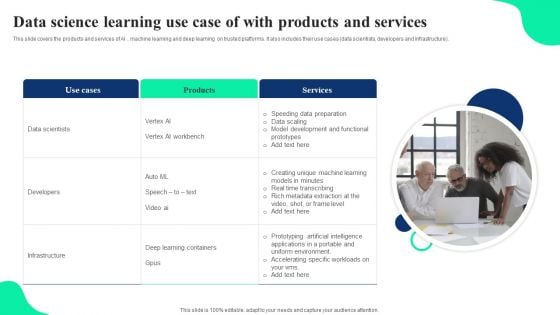
Data Science Learning Use Case Of With Products And Services Ppt Show Outfit PDF
This slide covers the products and services of AI , machine learning and deep learning on trusted platforms. It also includes their use cases data scientists, developers and infrastructure. Presenting Data Science Learning Use Case Of With Products And Services Ppt Show Outfit PDF to dispense important information. This template comprises one stages. It also presents valuable insights into the topics including Use Cases, Products, Services. This is a completely customizable PowerPoint theme that can be put to use immediately. So, download it and address the topic impactfully.
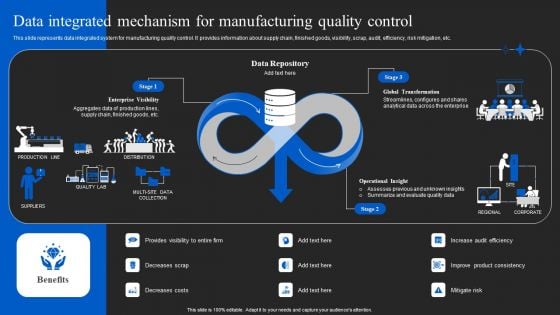
Automated Quality Control In Manufacturing Data Integrated Mechanism For Manufacturing Themes PDF
This slide represents data integrated system for manufacturing quality control. It provides information about supply chain, finished goods, visibility, scrap, audit, efficiency, risk mitigation, etc. Create an editable Automated Quality Control In Manufacturing Data Integrated Mechanism For Manufacturing Themes PDF that communicates your idea and engages your audience. Whether you are presenting a business or an educational presentation, pre designed presentation templates help save time. Automated Quality Control In Manufacturing Data Integrated Mechanism For Manufacturing Themes PDF is highly customizable and very easy to edit, covering many different styles from creative to business presentations. Slidegeeks has creative team members who have crafted amazing templates. So, go and get them without any delay.
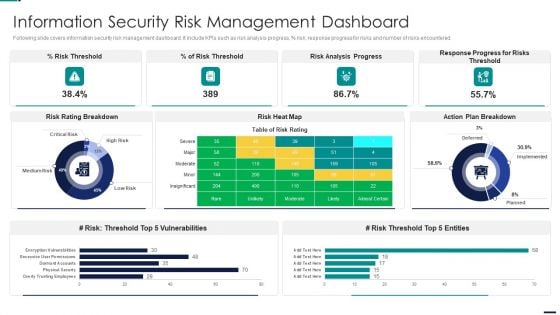
Risk Management Model For Data Security Information Security Risk Management Dashboard Pictures PDF
Following slide covers information security risk management dashboard. It include KPIs such as risk analysis progress, percent risk, response progress for risks and number of risks encountered. Deliver an awe inspiring pitch with this creative Risk Management Model For Data Security Information Security Risk Management Dashboard Pictures PDF bundle. Topics like Risk Threshold, Risk Analysis Progress, Response Progress For Risks Threshold, Action Plan Breakdown can be discussed with this completely editable template. It is available for immediate download depending on the needs and requirements of the user.
Information Security Dashboard For Threat Tracking In Data Security Summary PDF
Deliver an awe inspiring pitch with this creative information security dashboard for threat tracking in data security summary pdf bundle. Topics like monthly threat status, current risk status, threats based on role, threats by owners, risk by threats can be discussed with this completely editable template. It is available for immediate download depending on the needs and requirements of the user.
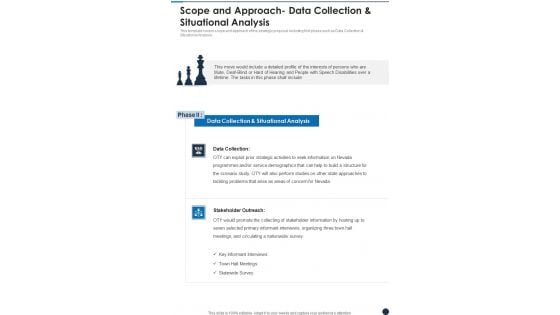
Strategic Plan Sample Scope And Approach Data Collection And Situational Analysis One Pager Sample Example Document
This template covers scope and approach of the strategic proposal including first phase such as Data Collection and Situational Analysis. Presenting you an exemplary Strategic Plan Sample Scope And Approach Data Collection And Situational Analysis One Pager Sample Example Document. Our one pager comprises all the must have essentials of an inclusive document. You can edit it with ease, as its layout is completely editable. With such freedom, you can tweak its design and other elements to your requirements. Download this Strategic Plan Sample Scope And Approach Data Collection And Situational Analysis One Pager Sample Example Document brilliant piece now.
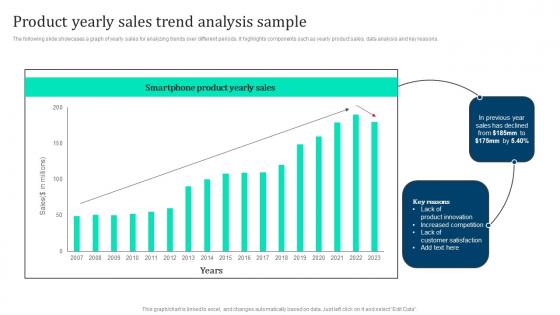
Product Yearly Sales Trend Analysis Marketing Intelligence Guide Data Gathering Introduction Pdf
The following slide showcases a graph of yearly sales for analyzing trends over different periods. It highlights components such as yearly product sales, data analysis and key reasons. Create an editable Product Yearly Sales Trend Analysis Marketing Intelligence Guide Data Gathering Introduction Pdf that communicates your idea and engages your audience. Whether you are presenting a business or an educational presentation, pre designed presentation templates help save time. Product Yearly Sales Trend Analysis Marketing Intelligence Guide Data Gathering Introduction Pdf is highly customizable and very easy to edit, covering many different styles from creative to business presentations. Slidegeeks has creative team members who have crafted amazing templates. So, go and get them without any delay. The following slide showcases a graph of yearly sales for analyzing trends over different periods. It highlights components such as yearly product sales, data analysis and key reasons.
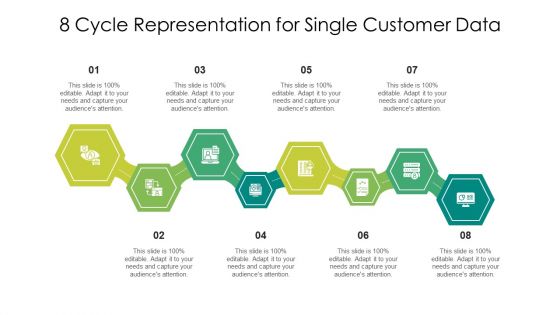
8 Cycle Representation For Single Customer Data Ppt PowerPoint Presentation File Slides PDF
Presenting 8 cycle representation for single customer data ppt powerpoint presentation file slides pdf to dispense important information. This template comprises eight stages. It also presents valuable insights into the topics including 8 cycle representation for single customer data. This is a completely customizable PowerPoint theme that can be put to use immediately. So, download it and address the topic impactfully.
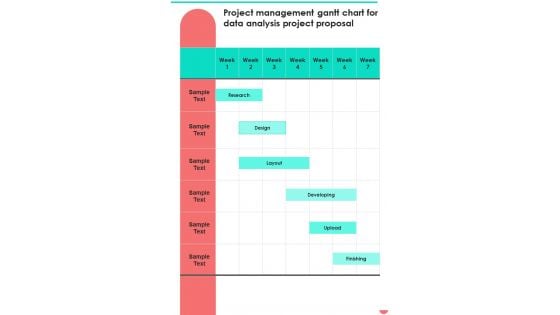
Project Management Gantt Chart For Data Analysis Project Proposal One Pager Sample Example Document
Presenting you an exemplary Project Management Gantt Chart For Data Analysis Project Proposal One Pager Sample Example Document. Our one-pager comprises all the must-have essentials of an inclusive document. You can edit it with ease, as its layout is completely editable. With such freedom, you can tweak its design and other elements to your requirements. Download this Project Management Gantt Chart For Data Analysis Project Proposal One Pager Sample Example Document brilliant piece now.
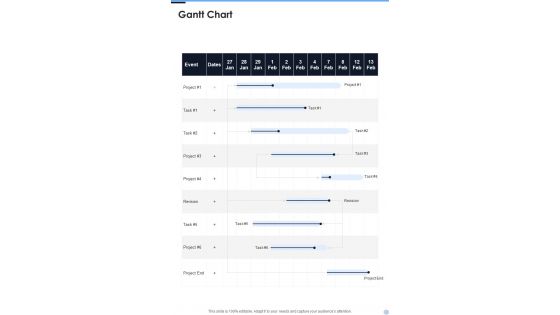
Gantt Chart Proposal For Data Analysis In Research Project One Pager Sample Example Document
Presenting you an exemplary Gantt Chart Proposal For Data Analysis In Research Project One Pager Sample Example Document. Our one-pager comprises all the must-have essentials of an inclusive document. You can edit it with ease, as its layout is completely editable. With such freedom, you can tweak its design and other elements to your requirements. Download this Gantt Chart Proposal For Data Analysis In Research Project One Pager Sample Example Document brilliant piece now.
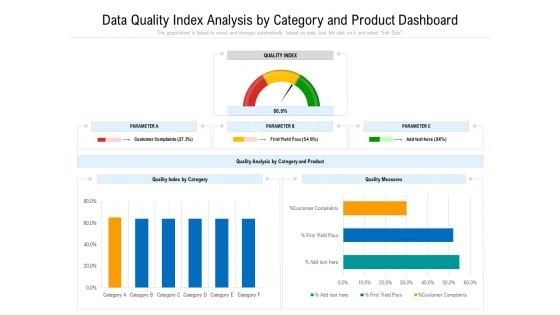
Data Quality Measurement Dashboard With Various Parameters Ppt PowerPoint Presentation Show Smartart PDF
Showcasing this set of slides titled data quality measurement dashboard with various parameters ppt powerpoint presentation show smartart pdf. The topics addressed in these templates are parametera, quality index by category, quality measures, quality index. All the content presented in this PPT design is completely editable. Download it and make adjustments in color, background, font etc. as per your unique business setting.
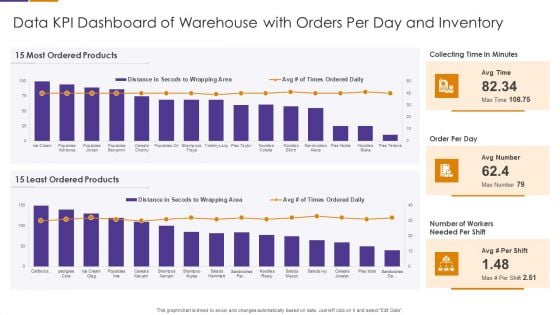
Data KPI Dashboard Of Warehouse With Orders Per Day And Inventory Brochure PDF
Showcasing this set of slides titled Data KPI Dashboard Of Warehouse With Orders Per Day And Inventory Brochure PDF The topics addressed in these templates are Most Ordered Products, Least Ordered Products, Collecting Time In Minutes All the content presented in this PPT design is completely editable. Download it and make adjustments in color, background, font etc. as per your unique business setting.
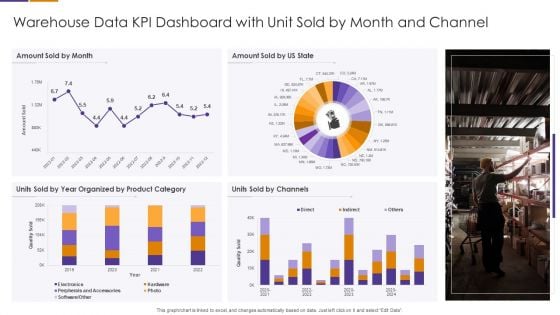
Warehouse Data KPI Dashboard With Unit Sold By Month And Channel Elements PDF
Showcasing this set of slides titled Warehouse Data KPI Dashboard With Unit Sold By Month And Channel Elements PDF The topics addressed in these templates are Organized By Product Category, Units Sold By Channels, Peripherals And Accessories All the content presented in this PPT design is completely editable. Download it and make adjustments in color, background, font etc. as per your unique business setting.
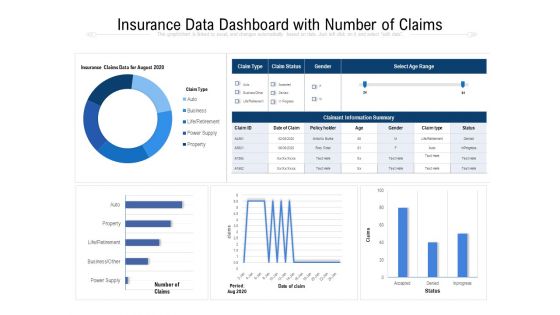
Insurance Data Dashboard With Number Of Claims Ppt PowerPoint Presentation Show Brochure PDF
Pitch your topic with ease and precision using this insurance data dashboard with number of claims ppt powerpoint presentation professional inspiration pdf. This layout presents information on business, power supply, property, accepted, category. It is also available for immediate download and adjustment. So, changes can be made in the color, design, graphics or any other component to create a unique layout.

KPI Dashboard Of Data Warehouse Overview With Delivery Reliability Clipart PDF
Pitch your topic with ease and precision using this KPI Dashboard Of Data Warehouse Overview With Delivery Reliability Clipart PDF This layout presents information on Delivery Reliability, Complaint Reasons, Delivery Reliability Retention And Expansion It is also available for immediate download and adjustment. So, changes can be made in the color, design, graphics or any other component to create a unique layout.
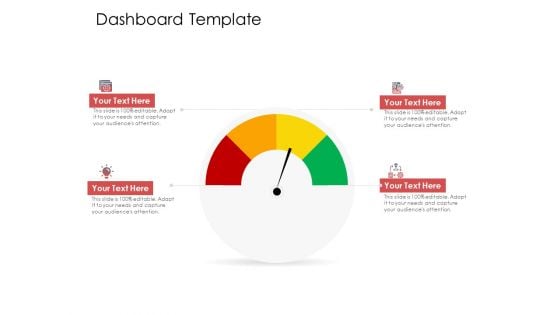
AIM Principles For Data Storage Dashboard Template Ppt Portfolio Topics PDF
Deliver an awe inspiring pitch with this creative aim principles for data storage dashboard template ppt portfolio topics pdf bundle. Topics like dashboard template can be discussed with this completely editable template. It is available for immediate download depending on the needs and requirements of the user.
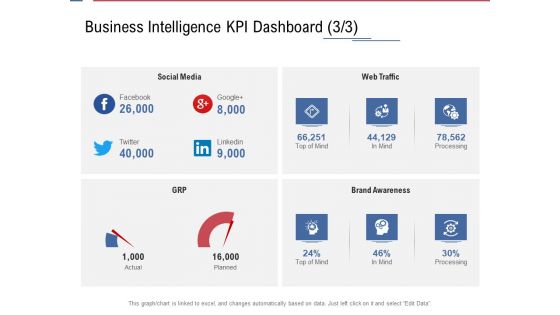
Data Assimilation Business Intelligence KPI Dashboard Media Ppt Layouts Show PDF
Deliver an awe inspiring pitch with this creative data assimilation business intelligence kpi dashboard media ppt layouts show pdf bundle. Topics like business intelligence kpi dashboard can be discussed with this completely editable template. It is available for immediate download depending on the needs and requirements of the user.
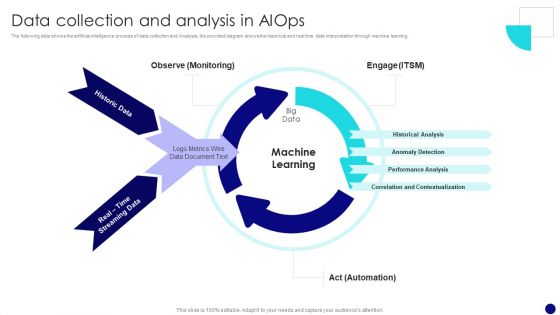
Information Technology Operations Administration With ML Data Collection And Analysis Microsoft PDF
The following slide shows the artificial intelligence process of data collection and Analysis, the provided diagram shows the historical and real time data interpretation through machine learning. Want to ace your presentation in front of a live audience Our Information Technology Operations Administration With ML Data Collection And Analysis Microsoft PDF can help you do that by engaging all the users towards you. Slidegeeks experts have put their efforts and expertise into creating these impeccable powerpoint presentations so that you can communicate your ideas clearly. Moreover, all the templates are customizable, and easy to edit and downloadable. Use these for both personal and commercial use.
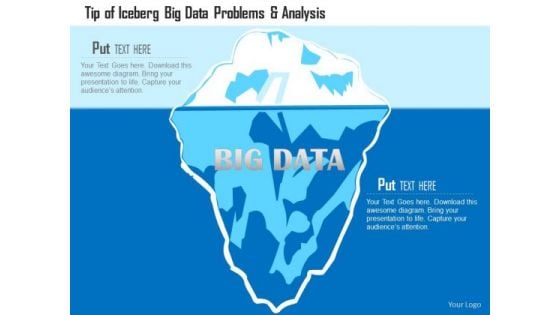
Business Diagram Tip Of Iceberg Big Data Problems And Analysis Ppt Slide
This PowerPoint template has been designed with graphic of iceberg diagram. This diagram slide depicts concept of big data problem and analysis Download this diagram to create professional presentations.
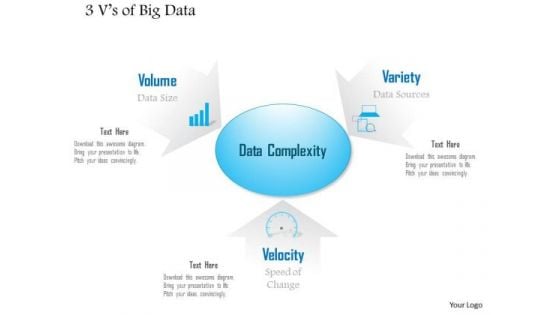
Business Diagram 3 Vs Of Big Data Showing Challenges And Complexity Of Analysis Ppt Slide
Explain the complexity and analysis with this unique PowerPoint template. This technology diagram contains the graphic of three V's to display data complexity. Use this diagram to make professional presentations.
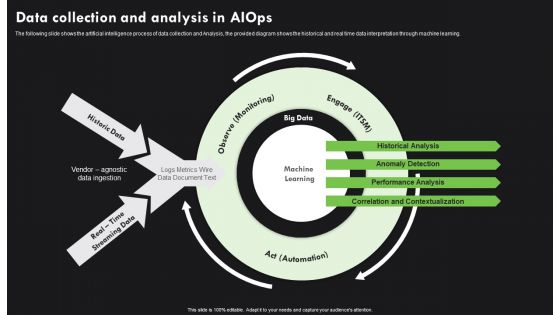
AI Deployment In IT Process Data Collection And Analysis In Aiops Introduction PDF
The following slide shows the artificial intelligence process of data collection and Analysis, the provided diagram shows the historical and real time data interpretation through machine learning. The best PPT templates are a great way to save time, energy, and resources. Slidegeeks have 100 percent editable powerpoint slides making them incredibly versatile. With these quality presentation templates, you can create a captivating and memorable presentation by combining visually appealing slides and effectively communicating your message. Download AI Deployment In IT Process Data Collection And Analysis In Aiops Introduction PDF from Slidegeeks and deliver a wonderful presentation.
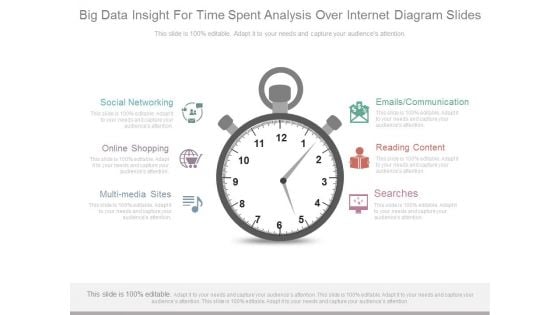
Big Data Insight For Time Spent Analysis Over Internet Diagram Slides
This is a big data insight for time spent analysis over internet diagram slides. This is a one stage process. The stages in this process are social networking, online shopping, multimedia sites, searches, reading content, emails communication.
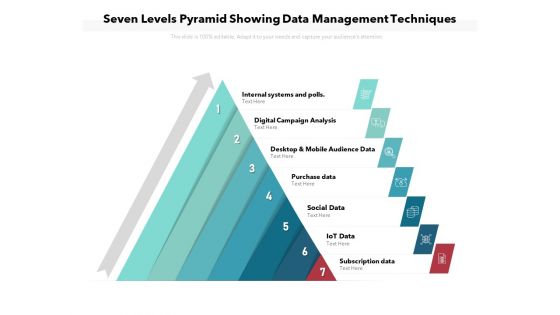
Seven Levels Pyramid Showing Data Management Techniques Ppt PowerPoint Presentation File Guide PDF
Presenting seven levels pyramid showing data management techniques ppt powerpoint presentation file guide pdf to dispense important information. This template comprises seven stages. It also presents valuable insights into the topics including analysis, social data, digital campaign. This is a completely customizable PowerPoint theme that can be put to use immediately. So, download it and address the topic impactfully.
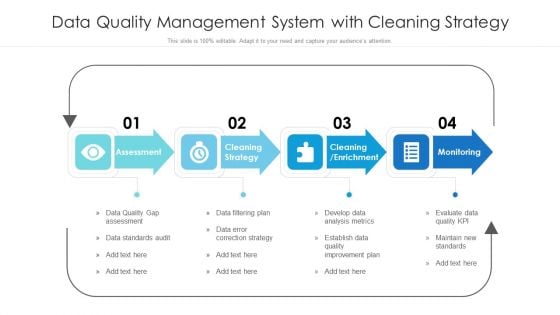
Data Quality Management System With Cleaning Strategy Ppt PowerPoint Presentation File Files PDF
Presenting data quality management system with cleaning strategy ppt powerpoint presentation file files pdf to dispense important information. This template comprises four stages. It also presents valuable insights into the topics including assessment, cleaning strategy, develop data analysis metrics. This is a completely customizable PowerPoint theme that can be put to use immediately. So, download it and address the topic impactfully.
Marketers Guide To Data Analysis Optimization Website Landing Page KPI Tracking Dashboard Information PDF
This slide covers a dashboard for analyzing the metrics of the website landing page. It includes KPIs such as conversions, conversion rate, sessions, bounce rate, engagement sickness, etc. Present like a pro with Marketers Guide To Data Analysis Optimization Website Landing Page KPI Tracking Dashboard Information PDF Create beautiful presentations together with your team, using our easy to use presentation slides. Share your ideas in real time and make changes on the fly by downloading our templates. So whether you are in the office, on the go, or in a remote location, you can stay in sync with your team and present your ideas with confidence. With Slidegeeks presentation got a whole lot easier. Grab these presentations today.
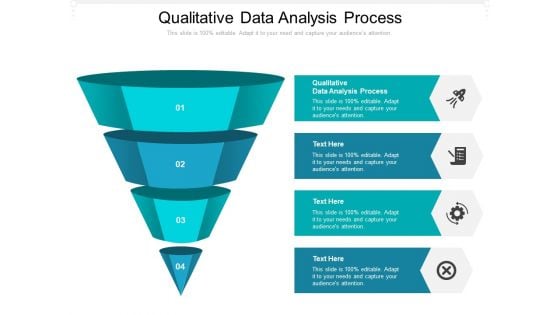
Qualitative Data Analysis Process Ppt PowerPoint Presentation Layouts Themes Cpb Pdf
Presenting this set of slides with name qualitative data analysis process ppt powerpoint presentation layouts themes cpb pdf. This is an editable Powerpoint four stages graphic that deals with topics like qualitative data analysis process to help convey your message better graphically. This product is a premium product available for immediate download and is 100 percent editable in Powerpoint. Download this now and use it in your presentations to impress your audience.
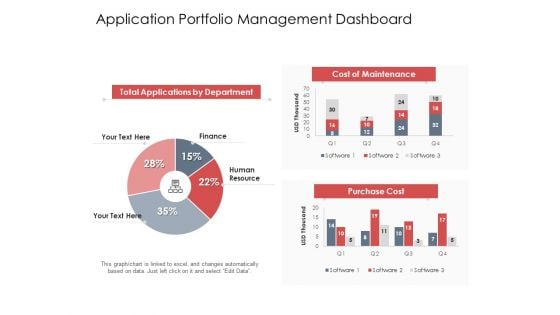
AIM Principles For Data Storage Application Portfolio Management Dashboard Structure PDF
Deliver an awe inspiring pitch with this creative aim principles for data storage application portfolio management dashboard structure pdf bundle. Topics like finance, human resource, cost, maintenance can be discussed with this completely editable template. It is available for immediate download depending on the needs and requirements of the user.
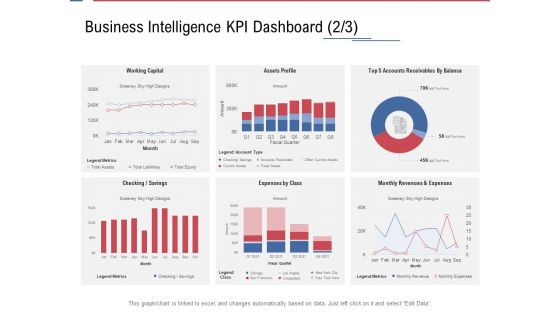
Data Assimilation Business Intelligence KPI Dashboard Sky Ppt Background Images PDF
Deliver an awe inspiring pitch with this creative data assimilation business intelligence kpi dashboard sky ppt background images pdf bundle. Topics like expenses, working capital, checking savings, revenues, assets can be discussed with this completely editable template. It is available for immediate download depending on the needs and requirements of the user.
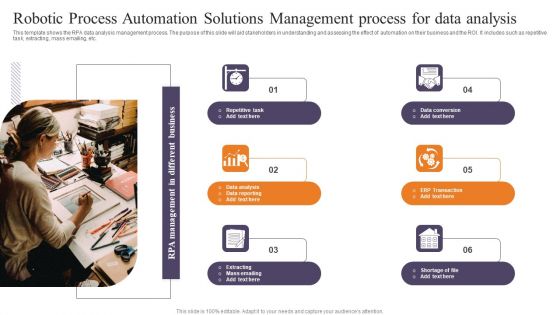
Robotic Process Automation Solutions Management Process For Data Analysis Clipart PDF
This template shows the RPA data analysis management process. The purpose of this slide will aid stakeholders in understanding and assessing the effect of automation on their business and the ROI. It includes such as repetitive task, extracting, mass emailing, etc. Presenting Robotic Process Automation Solutions Management Process For Data Analysis Clipart PDF to dispense important information. This template comprises six stages. It also presents valuable insights into the topics including Robotic Process Automation, Solutions Management, Process For Data Analysis. This is a completely customizable PowerPoint theme that can be put to use immediately. So, download it and address the topic impactfully.

Business Diagram Extract Transform Load Etl Business Intelligence Bug Data Analysis Pipeline Ppt Sli
This PowerPoint template has been designed with graphic of server. This diagram depicts the concept of ETL business intelligence with extract transform load. This slide also helps to display the data analysis pipeline.
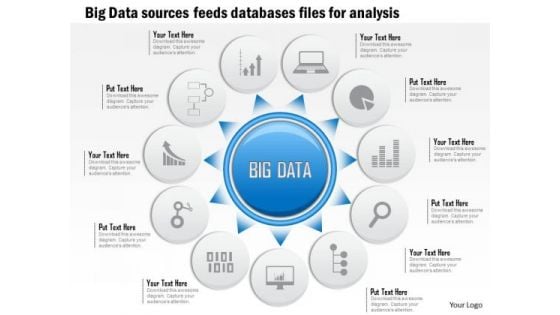
Business Diagram Big Data Sources Sensors Feeds Databases Files For Analysis Ppt Slide
This slide has been designed with graphic of circular source diagram. This diagram contains the concept of data source sensors and feeds of database files. Download this editable slide to build an exclusive presentation for your viewers.
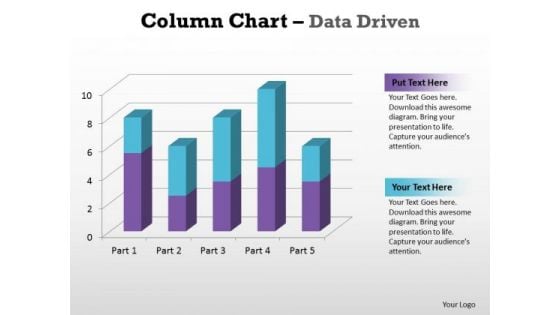
Business Graphic PowerPoint Templates Business Column Chart Data Driven Ppt Slides
Business Graphic PowerPoint Templates Business column chart data driven PPT Slides-With help of visual aids like this template you can capture the attention of the audience and make the presentation very interactive and lively.-Business Graphic PowerPoint Templates Business column chart data driven PPT Slides-This ppt can be used for concepts relating to-chart,, graph, growth, investment, , market, percentage, , presentation report, results, statistics, stock, success and business. Attain stardom with our Business Graphic PowerPoint Templates Business Column Chart Data Driven Ppt Slides. You will come out on top.
Marketers Guide To Data Analysis Optimization Dashboard For Tracking Business Blog Kpis Infographics PDF
This slide covers the dashboard for analyzing blogging KPIs such as performance, published posts, views, new blog subscribers, top blog posts by pageviews, top blog posts by CTR, etc. Coming up with a presentation necessitates that the majority of the effort goes into the content and the message you intend to convey. The visuals of a PowerPoint presentation can only be effective if it supplements and supports the story that is being told. Keeping this in mind our experts created Marketers Guide To Data Analysis Optimization Dashboard For Tracking Business Blog Kpis Infographics PDF to reduce the time that goes into designing the presentation. This way, you can concentrate on the message while our designers take care of providing you with the right template for the situation.
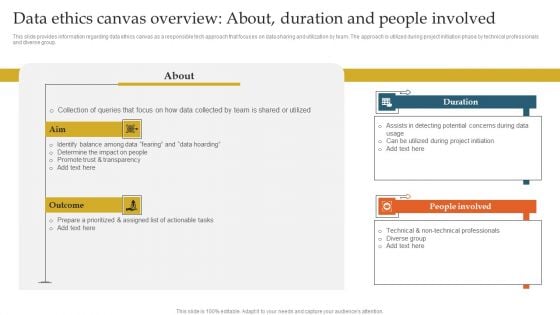
Data Ethics Canvas Overview About Duration And People Involved Ppt Inspiration Guide PDF
This slide provides information regarding data ethics canvas as a responsible tech approach that focuses on data sharing and utilization by team. The approach is utilized during project initiation phase by technical professionals and diverse group. From laying roadmaps to briefing everything in detail, our templates are perfect for you. You can set the stage with your presentation slides. All you have to do is download these easy to edit and customizable templates. Data Ethics Canvas Overview About Duration And People Involved Ppt Inspiration Guide PDF will help you deliver an outstanding performance that everyone would remember and praise you for. Do download this presentation today.
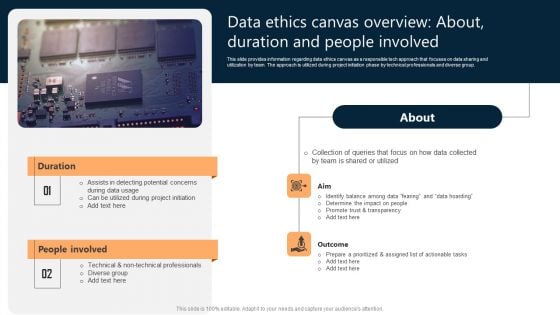
Data Ethics Canvas Overview About Duration And People Involved Ppt Ideas Vector PDF
This slide provides information regarding data ethics canvas as a responsible tech approach that focuses on data sharing and utilization by team. The approach is utilized during project initiation phase by technical professionals and diverse group. From laying roadmaps to briefing everything in detail, our templates are perfect for you. You can set the stage with your presentation slides. All you have to do is download these easy to edit and customizable templates. Data Ethics Canvas Overview About Duration And People Involved Ppt Ideas Vector PDF will help you deliver an outstanding performance that everyone would remember and praise you for. Do download this presentation today.
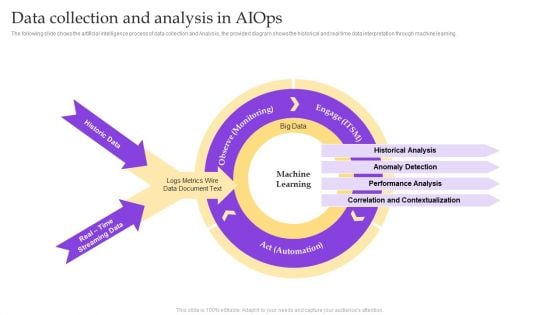
Operational Strategy For ML In IT Sector Data Collection And Analysis In Aiops Pictures PDF
The following slide shows the artificial intelligence process of data collection and Analysis, the provided diagram shows the historical and real time data interpretation through machine learning. The best PPT templates are a great way to save time, energy, and resources. Slidegeeks have 100 percent editable powerpoint slides making them incredibly versatile. With these quality presentation templates, you can create a captivating and memorable presentation by combining visually appealing slides and effectively communicating your message. Download Operational Strategy For ML In IT Sector Data Collection And Analysis In Aiops Pictures PDF from Slidegeeks and deliver a wonderful presentation.
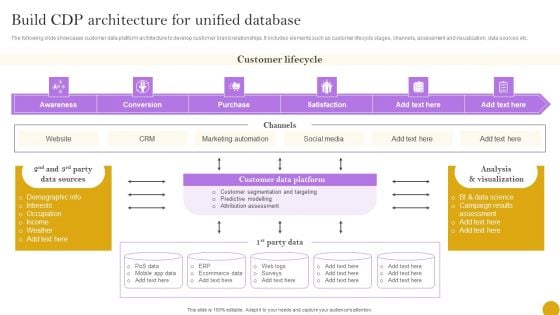
Comprehensive Customer Data Platform Guide Optimizing Promotional Initiatives Build CDP Architecture Unified Themes PDF
The following slide showcases customer data platform architecture to develop customer brand relationships. It includes elements such as customer lifecycle stages, channels, assessment and visualization, data sources etc. Find highly impressive Comprehensive Customer Data Platform Guide Optimizing Promotional Initiatives Build CDP Architecture Unified Themes PDF on Slidegeeks to deliver a meaningful presentation. You can save an ample amount of time using these presentation templates. No need to worry to prepare everything from scratch because Slidegeeks experts have already done a huge research and work for you. You need to download Comprehensive Customer Data Platform Guide Optimizing Promotional Initiatives Build CDP Architecture Unified Themes PDF for your upcoming presentation. All the presentation templates are 100 percent editable and you can change the color and personalize the content accordingly. Download now.
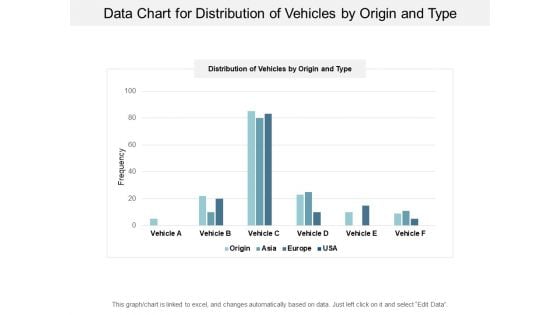
Data Chart For Distribution Of Vehicles By Origin And Type Ppt PowerPoint Presentation Infographics Topics
This is a data chart for distribution of vehicles by origin and type ppt powerpoint presentation infographics topics. This is a four stage process. The stages in this process are financial analysis, quantitative, statistical modelling.
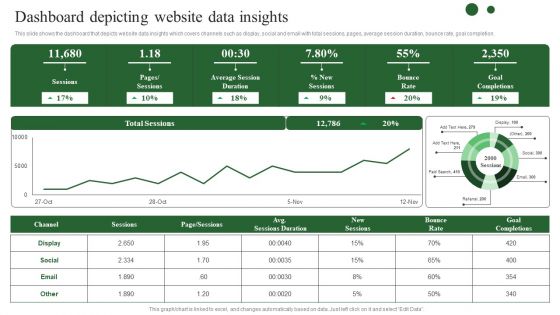
Brand Development Techniques To Increase Revenues Dashboard Depicting Website Data Diagrams PDF
This slide shows the dashboard that depicts website data insights which covers channels such as display, social and email with total sessions, pages, average session duration, bounce rate, goal completion. Are you in need of a template that can accommodate all of your creative concepts This one is crafted professionally and can be altered to fit any style. Use it with Google Slides or PowerPoint. Include striking photographs, symbols, depictions, and other visuals. Fill, move around, or remove text boxes as desired. Test out color palettes and font mixtures. Edit and save your work, or work with colleagues. Download Brand Development Techniques To Increase Revenues Dashboard Depicting Website Data Diagrams PDF and observe how to make your presentation outstanding. Give an impeccable presentation to your group and make your presentation unforgettable.
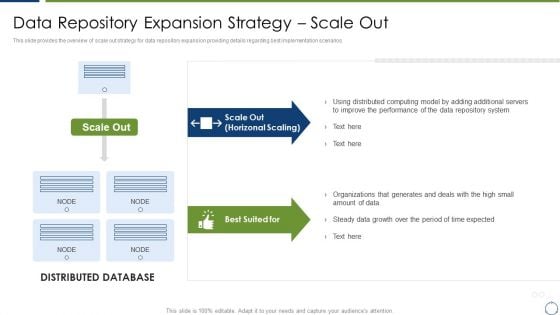
Horizontal Scaling Technique For Information Data Repository Expansion Strategy Scale Out Themes PDF
This slide provides the overview of scale out strategy for data repository expansion providing details regarding best implementation scenarios.Deliver and pitch your topic in the best possible manner with this Horizontal Scaling Technique For Information Data Repository Expansion Strategy Scale Out Themes PDF Use them to share invaluable insights on Distributed Computing, Improve The Performance, Repository System and impress your audience. This template can be altered and modified as per your expectations. So, grab it now.
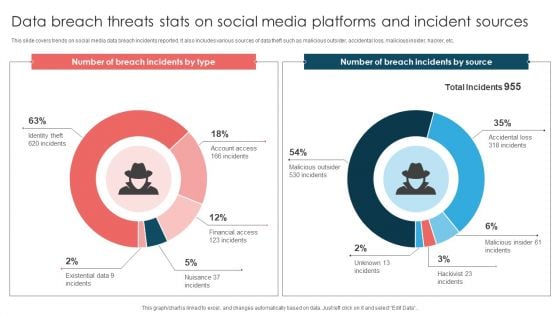
Data Breach Threats Stats On Social Media Platforms And Incident Sources Introduction PDF
This slide covers trends on social media data breach incidents reported. It also includes various sources of data theft such as malicious outsider, accidental loss, malicious insider, hacker, etc. Pitch your topic with ease and precision using this Data Breach Threats Stats On Social Media Platforms And Incident Sources Introduction PDF. This layout presents information on Number Breach, Total Incidents, Malicious Insider. It is also available for immediate download and adjustment. So, changes can be made in the color, design, graphics or any other component to create a unique layout.
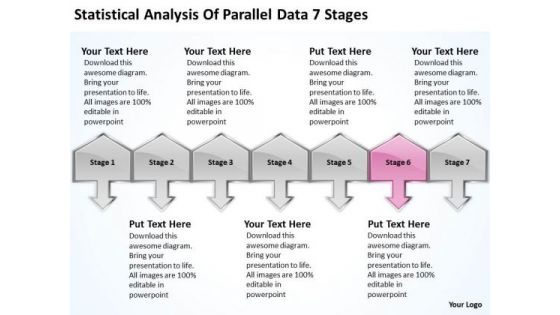
Statistical Analysis Of Parallel Data 7 Stages Business Planning Guide PowerPoint Slides
We present our statistical analysis of parallel data 7 stages business planning guide PowerPoint Slides.Download our Communication PowerPoint Templates because the mind is always whirring with new ideas. Use our Business PowerPoint Templates because watch the excitement levels rise as they realise their worth. Download our Arrows PowerPoint Templates because you know Coincidentally it will always point to the top. Use our Success PowerPoint Templates because they represent the proress in our lives. Use our Symbol PowerPoint Templates because with the help of our Slides you can Illustrate how each element flows seamlessly onto the next stage.Use these PowerPoint slides for presentations relating to 3d, Achievement, Action, Aim, Arrows, Black, Business, Color, Communication, Competition, Concept, Connection, Creative, Design, Different, Direction, Element, First, Forward, Graph, Graphic, Group, Growth, Higher, Icon, Illustration, Image, Isolated, Leader, Leadership, Line, Menu, Motion, Orange, Progress, Series, Seven, Sign, Slew, Solution, Success, Swerve, Symbol, Team, Teamwork, Turn, Up. The prominent colors used in the PowerPoint template are Pink, Gray, Black. Customers tell us our statistical analysis of parallel data 7 stages business planning guide PowerPoint Slides are Graceful. Use our Black PowerPoint templates and PPT Slides are Attractive. PowerPoint presentation experts tell us our statistical analysis of parallel data 7 stages business planning guide PowerPoint Slides are Nice. People tell us our Business PowerPoint templates and PPT Slides are Glamorous. We assure you our statistical analysis of parallel data 7 stages business planning guide PowerPoint Slides are Flirty. People tell us our Color PowerPoint templates and PPT Slides are Great. Scale mountains with our Statistical Analysis Of Parallel Data 7 Stages Business Planning Guide PowerPoint Slides. You will come out on top.
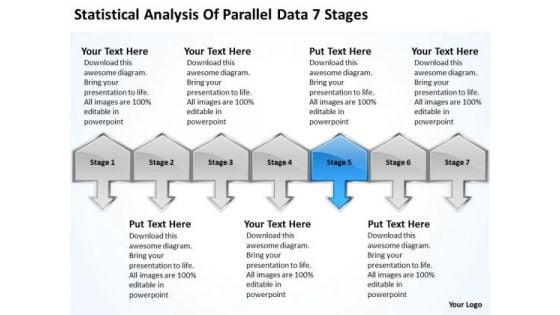
Statistical Analysis Of Parallel Data 7 Stages Fashion Business Plan PowerPoint Slides
We present our statistical analysis of parallel data 7 stages fashion business plan PowerPoint Slides.Download our Communication PowerPoint Templates because there is a key aspect to be emphasised. Present our Business PowerPoint Templates because watch the excitement levels rise as they realise their worth. Download our Arrows PowerPoint Templates because our PowerPoint templates designed for your ideas to sell. Download our Success PowerPoint Templates because your quest has taken you well onto the path of success. Download our Symbol PowerPoint Templates because they will Amplify your basic corporate concept and forefront the benefits of overlapping processes to arrive at common goals.Use these PowerPoint slides for presentations relating to 3d, Achievement, Action, Aim, Arrows, Black, Business, Color, Communication, Competition, Concept, Connection, Creative, Design, Different, Direction, Element, First, Forward, Graph, Graphic, Group, Growth, Higher, Icon, Illustration, Image, Isolated, Leader, Leadership, Line, Menu, Motion, Orange, Progress, Series, Seven, Sign, Slew, Solution, Success, Swerve, Symbol, Team, Teamwork, Turn, Up. The prominent colors used in the PowerPoint template are Blue, Gray, Black. Customers tell us our statistical analysis of parallel data 7 stages fashion business plan PowerPoint Slides are Awesome. Use our Business PowerPoint templates and PPT Slides will get their audience's attention. PowerPoint presentation experts tell us our statistical analysis of parallel data 7 stages fashion business plan PowerPoint Slides are Awesome. People tell us our Aim PowerPoint templates and PPT Slides are Sparkling. We assure you our statistical analysis of parallel data 7 stages fashion business plan PowerPoint Slides are Royal. People tell us our Black PowerPoint templates and PPT Slides are Detailed. Make your mark with our Statistical Analysis Of Parallel Data 7 Stages Fashion Business Plan PowerPoint Slides. You will be at the top of your game.
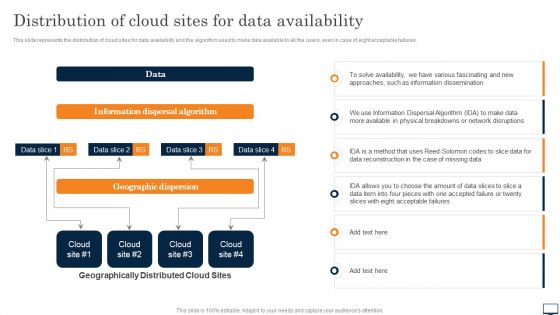
Distribution Of Cloud Sites For Data Availability Ppt PowerPoint Presentation File Diagrams PDF
This slide represents the distribution of cloud sites for data availability and the algorithm used to make data available to all the users, even in case of eight acceptable failures. Crafting an eye catching presentation has never been more straightforward. Let your presentation shine with this tasteful yet straightforward Distribution Of Cloud Sites For Data Availability Ppt PowerPoint Presentation File Diagrams PDF template. It offers a minimalistic and classy look that is great for making a statement. The colors have been employed intelligently to add a bit of playfulness while still remaining professional. Construct the ideal Distribution Of Cloud Sites For Data Availability Ppt PowerPoint Presentation File Diagrams PDF that effortlessly grabs the attention of your audience Begin now and be certain to wow your customers.
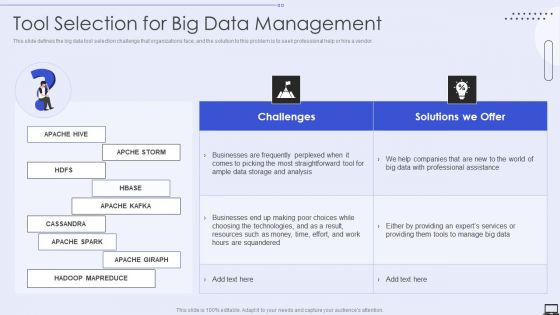
Tool Selection For Big Data Management Ppt PowerPoint Presentation Diagram Images PDF
This slide defines the big data tool selection challenge that organizations face, and the solution to this problem is to seek professional help or hire a vendor. Deliver and pitch your topic in the best possible manner with this Tool Selection For Big Data Management Ppt PowerPoint Presentation Diagram Images PDF. Use them to share invaluable insights on Analysis, Technologies, Resources and impress your audience. This template can be altered and modified as per your expectations. So, grab it now.
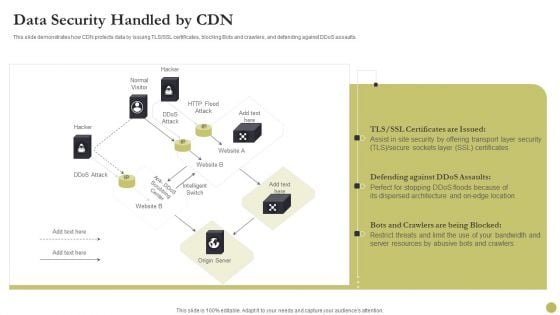
Content Delivery Network Edge Server Data Security Handled By CDN Diagrams PDF
This slide demonstrates how CDN protects data by issuing TLS or SSL certificates, blocking Bots and crawlers, and defending against DDoS assaults. Deliver and pitch your topic in the best possible manner with this Content Delivery Network Edge Server Data Security Handled By CDN Diagrams PDF. Use them to share invaluable insights on Security, Location, Server Resources and impress your audience. This template can be altered and modified as per your expectations. So, grab it now.

Risk Management Model For Data Security Threat And Vulnerability Management Dashboard Diagrams PDF
Following slide displays threat and vulnerability management dashboard. It covers KPIs such as organization exposure score, system configuration score and severity score. Deliver an awe inspiring pitch with this creative Risk Management Model For Data Security Threat And Vulnerability Management Dashboard Diagrams PDF bundle. Topics like Exposure Score, Configuration Score, Severity Distribution, Top Vulnerable Software, Active Remediation can be discussed with this completely editable template. It is available for immediate download depending on the needs and requirements of the user.
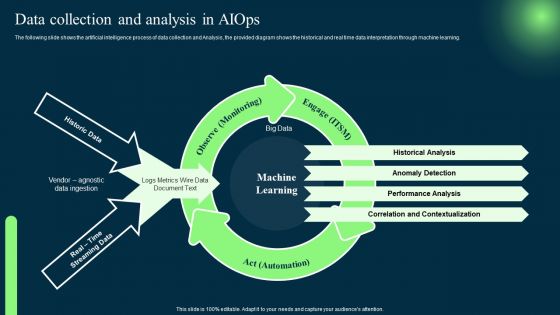
Introduction To Artificial Intelligence In Operation Management Industry Data Collection And Analysis In AIOPS Summary PDF
The following slide shows the artificial intelligence process of data collection and Analysis, the provided diagram shows the historical and real time data interpretation through machine learning. Do you have an important presentation coming up. Are you looking for something that will make your presentation stand out from the rest. Look no further than Introduction To Artificial Intelligence In Operation Management Industry Data Collection And Analysis In AIOPS Summary PDF. With our professional designs, you can trust that your presentation will pop and make delivering it a smooth process. And with Slidegeeks, you can trust that your presentation will be unique and memorable. So why wait. Grab Introduction To Artificial Intelligence In Operation Management Industry Data Collection And Analysis In AIOPS Summary PDF today and make your presentation stand out from the rest.
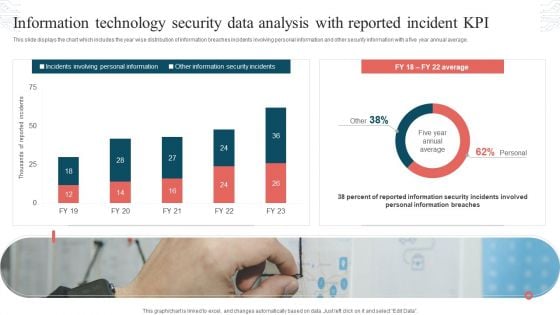
Information Technology Security Data Analysis With Reported Incident KPI Download PDF
This slide displays the chart which includes the year wise distribution of information breaches incidents involving personal information and other security information with a five year annual average. Showcasing this set of slides titled Information Technology Security Data Analysis With Reported Incident KPI Download PDF. The topics addressed in these templates are Incidents Involving, Personal Information, Other Information, Security Incidents. All the content presented in this PPT design is completely editable. Download it and make adjustments in color, background, font etc. as per your unique business setting.
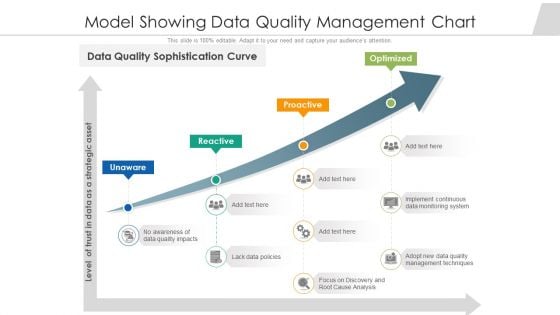
Model Showing Data Quality Management Chart Ppt PowerPoint Presentation Show Slide Download PDF
Persuade your audience using this model showing data quality management chart ppt powerpoint presentation show slide download pdf. This PPT design covers four stages, thus making it a great tool to use. It also caters to a variety of topics including implement continuous data monitoring system, management techniques, strategic asset. Download this PPT design now to present a convincing pitch that not only emphasizes the topic but also showcases your presentation skills.
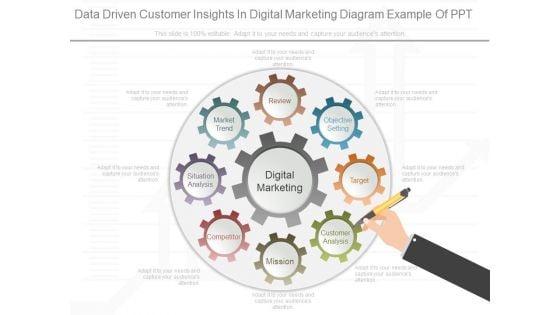
Data Driven Customer Insights In Digital Marketing Diagram Example Of Ppt
This is data driven customer insights in digital marketing diagram example of ppt. This is a eight stage process. The stages in this process are digital marketing, situation analysis, market trend, review, objective setting, customer analysis, competitor, mission.
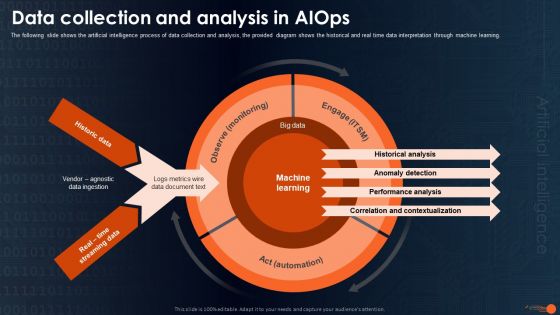
Integrating Aiops To Enhance Process Effectiveness Data Collection And Analysis In Aiops Pictures PDF
The following slide shows the artificial intelligence process of data collection and analysis, the provided diagram shows the historical and real time data interpretation through machine learning. Do you have an important presentation coming up Are you looking for something that will make your presentation stand out from the rest Look no further than Integrating Aiops To Enhance Process Effectiveness Data Collection And Analysis In Aiops Pictures PDF. With our professional designs, you can trust that your presentation will pop and make delivering it a smooth process. And with Slidegeeks, you can trust that your presentation will be unique and memorable. So why wait Grab Integrating Aiops To Enhance Process Effectiveness Data Collection And Analysis In Aiops Pictures PDF today and make your presentation stand out from the rest.
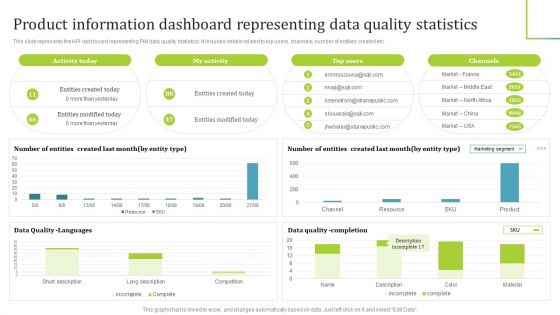
PIM Software Deployment To Enhance Conversion Rates Product Information Dashboard Representing Data Quality Statistics Download PDF
This slide represents the KPI dashboard representing PIM data quality statistics. It includes details related to top users, channels, number of entities created etc. Coming up with a presentation necessitates that the majority of the effort goes into the content and the message you intend to convey. The visuals of a PowerPoint presentation can only be effective if it supplements and supports the story that is being told. Keeping this in mind our experts created PIM Software Deployment To Enhance Conversion Rates Product Information Dashboard Representing Data Quality Statistics Download PDF to reduce the time that goes into designing the presentation. This way, you can concentrate on the message while our designers take care of providing you with the right template for the situation.
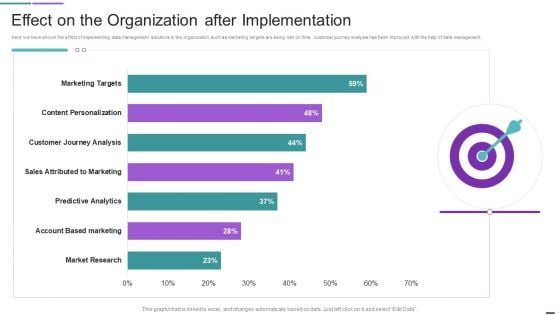
Data Management Solutions Effect On The Organization After Implementation Professional PDF
Here we have shown the effect of implementing data management solutions in the organization such as marketing targets are being met on time, customer journey analysis has been improved with the help of data management. Deliver an awe inspiring pitch with this creative Data Management Solutions Effect On The Organization After Implementation Professional PDF bundle. Topics like Market Research, Account Based Marketing, Sales Attributed Marketing can be discussed with this completely editable template. It is available for immediate download depending on the needs and requirements of the user.
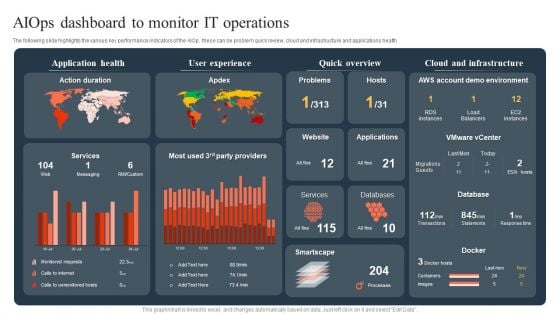
Ml And Big Data In Information Technology Processes Aiops Dashboard To Monitor IT Operations Sample PDF
The following slide highlights the various key performance indicators of the AIOp, these can be problem quick review, cloud and infrastructure and applications health If you are looking for a format to display your unique thoughts, then the professionally designed Ml And Big Data In Information Technology Processes Aiops Dashboard To Monitor IT Operations Sample PDF is the one for you. You can use it as a Google Slides template or a PowerPoint template. Incorporate impressive visuals, symbols, images, and other charts. Modify or reorganize the text boxes as you desire. Experiment with shade schemes and font pairings. Alter, share or cooperate with other people on your work. Download Ml And Big Data In Information Technology Processes Aiops Dashboard To Monitor IT Operations Sample PDF and find out how to give a successful presentation. Present a perfect display to your team and make your presentation unforgettable.
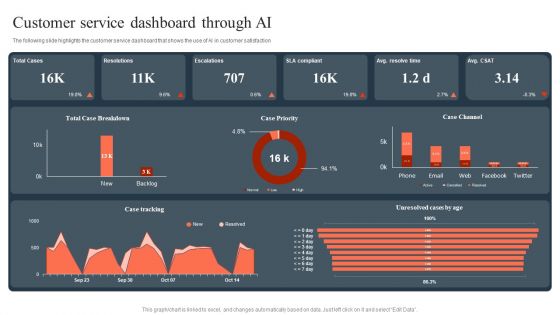
Ml And Big Data In Information Technology Processes Customer Service Dashboard Through AI Guidelines PDF
The following slide highlights the customer service dashboard that shows the use of AI in customer satisfaction Crafting an eye catching presentation has never been more straightforward. Let your presentation shine with this tasteful yet straightforward Ml And Big Data In Information Technology Processes Customer Service Dashboard Through AI Guidelines PDF template. It offers a minimalistic and classy look that is great for making a statement. The colors have been employed intelligently to add a bit of playfulness while still remaining professional. Construct the ideal Ml And Big Data In Information Technology Processes Customer Service Dashboard Through AI Guidelines PDF that effortlessly grabs the attention of your audience. Begin now and be certain to wow your customers.
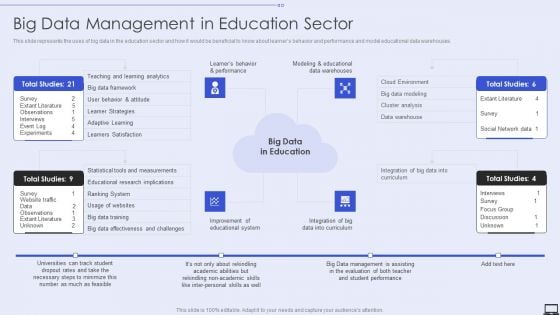
Big Data Management In Education Sector Ppt PowerPoint Presentation Diagram Templates PDF
Presenting Big Data Management In Education Sector Ppt PowerPoint Presentation Diagram Templates PDF to provide visual cues and insights. Share and navigate important information on four stages that need your due attention. This template can be used to pitch topics like Cluster Analysis, Data Warehouse, Cloud Environment. In addtion, this PPT design contains high resolution images, graphics, etc, that are easily editable and available for immediate download.
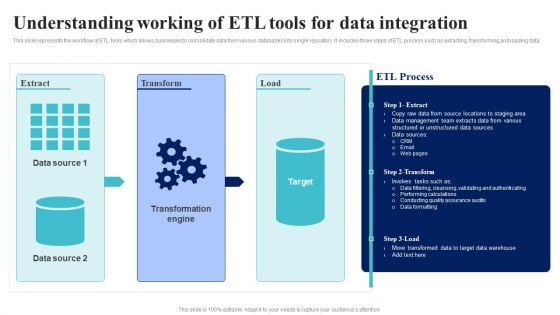
BI Implementation To Enhance Hiring Process Understanding Working Of Etl Tools For Data Integration Topics PDF
This slide represents the workflow of ETL tools which allows businesses to consolidate data from various databases into single repository. It includes three steps of ETL process such as extracting, transforming and loading data.If you are looking for a format to display your unique thoughts, then the professionally designed BI Implementation To Enhance Hiring Process Understanding Working Of Etl Tools For Data Integration Topics PDF is the one for you. You can use it as a Google Slides template or a PowerPoint template. Incorporate impressive visuals, symbols, images, and other charts. Modify or reorganize the text boxes as you desire. Experiment with shade schemes and font pairings. Alter, share or cooperate with other people on your work. Download BI Implementation To Enhance Hiring Process Understanding Working Of Etl Tools For Data Integration Topics PDF and find out how to give a successful presentation. Present a perfect display to your team and make your presentation unforgettable.
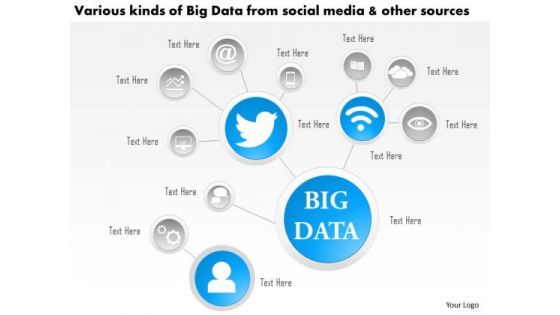
Business Diagram Various Kinds Of Big Data From Social Media And Other Sources Ppt Slide
This technology diagram contains the concept of big data analysis. This slide depicts various kinds of social media and other sources. Use this diagram for mobile and communication related presentations.
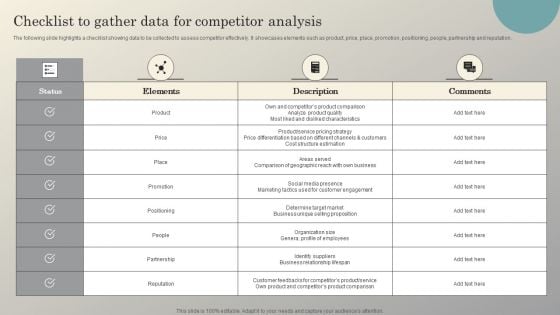
Steps To Conduct Competitor Analysis Checklist To Gather Data For Competitor Analysis Themes PDF
The following slide highlights a checklist showing data to be collected to assess competitor effectively. It showcases elements such as product, price, place, promotion, positioning, people, partnership and reputation. Explore a selection of the finest Steps To Conduct Competitor Analysis Checklist To Gather Data For Competitor Analysis Themes PDF here. With a plethora of professionally designed and pre-made slide templates, you can quickly and easily find the right one for your upcoming presentation. You can use our Steps To Conduct Competitor Analysis Checklist To Gather Data For Competitor Analysis Themes PDF to effectively convey your message to a wider audience. Slidegeeks has done a lot of research before preparing these presentation templates. The content can be personalized and the slides are highly editable. Grab templates today from Slidegeeks.
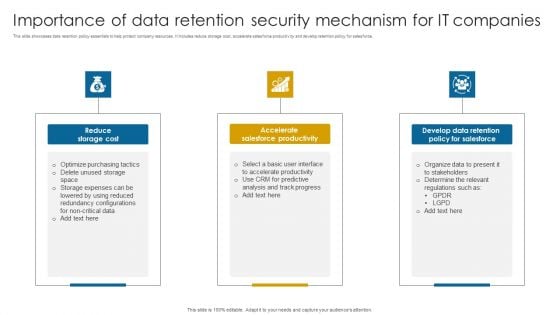
Importance Of Data Retention Security Mechanism For It Companies Professional PDF
This slide showcases data retention policy essentials to help protect company resources. It includes reduce storage cost, accelerate salesforce productivity and develop retention policy for salesforce.Presenting Importance Of Data Retention Security Mechanism For It Companies Professional PDF to dispense important information. This template comprises three stages. It also presents valuable insights into the topics including Salesforce Productivity, Develop Data Retention, Determine Relevant. This is a completely customizable PowerPoint theme that can be put to use immediately. So, download it and address the topic impactfully.
24 Hour Timeframe Diagram For Data Stewardship Model Ppt PowerPoint Presentation File Designs PDF
Persuade your audience using this 24 hour timeframe diagram for data stewardship model ppt powerpoint presentation file designs pdf. This PPT design covers four stages, thus making it a great tool to use. It also caters to a variety of topics including 24 hour timeframe diagram for data stewardship model. Download this PPT design now to present a convincing pitch that not only emphasizes the topic but also showcases your presentation skills.
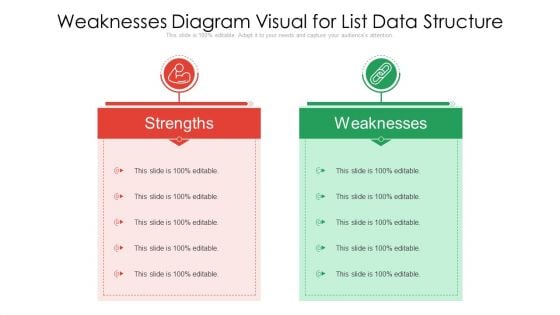
Strengths And Weaknesses Diagram Visual For List Data Structure Structure PDF
Persuade your audience using this strengths and weaknesses diagram visual for list data structure structure pdf. This PPT design covers two stages, thus making it a great tool to use. It also caters to a variety of topics including weaknesses diagram visual for list data structure. Download this PPT design now to present a convincing pitch that not only emphasizes the topic but also showcases your presentation skills.
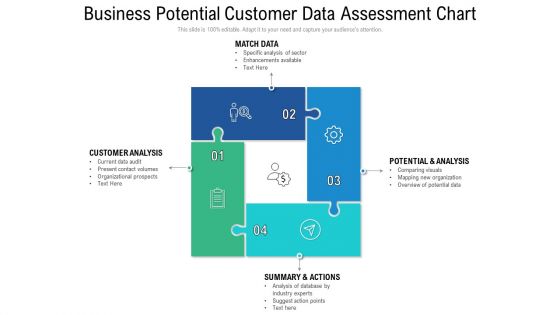
Business Potential Customer Data Assessment Chart Ppt PowerPoint Presentation Gallery Brochure PDF
Presenting business potential customer data assessment chart ppt powerpoint presentation gallery brochure pdf to provide visual cues and insights. Share and navigate important information on four stages that need your due attention. This template can be used to pitch topics like match data, potential and analysis, summary and actions. In addtion, this PPT design contains high resolution images, graphics, etc, that are easily editable and available for immediate download.
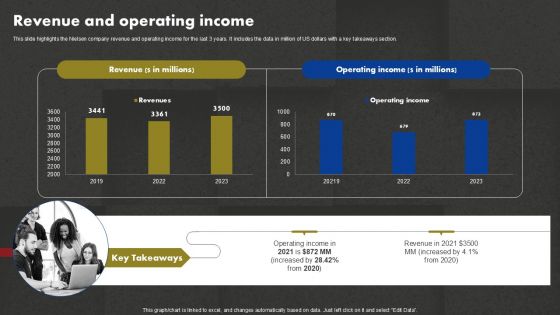
Data And Customer Analysis Company Outline Revenue And Operating Income Diagrams PDF
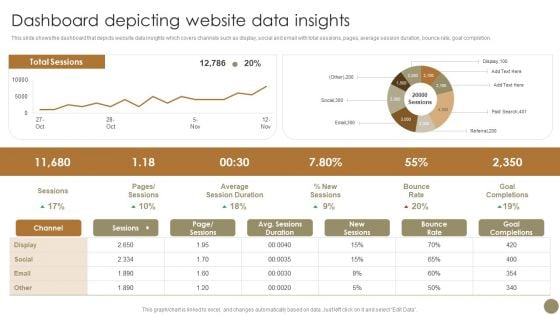
Echniques To Enhance Brand Dashboard Depicting Website Data Insights Clipart PDF
This slide shows the dashboard that depicts website data insights which covers channels such as display, social and email with total sessions, pages, average session duration, bounce rate, goal completion. Coming up with a presentation necessitates that the majority of the effort goes into the content and the message you intend to convey. The visuals of a PowerPoint presentation can only be effective if it supplements and supports the story that is being told. Keeping this in mind our experts created Echniques To Enhance Brand Dashboard Depicting Website Data Insights Clipart PDF to reduce the time that goes into designing the presentation. This way, you can concentrate on the message while our designers take care of providing you with the right template for the situation.
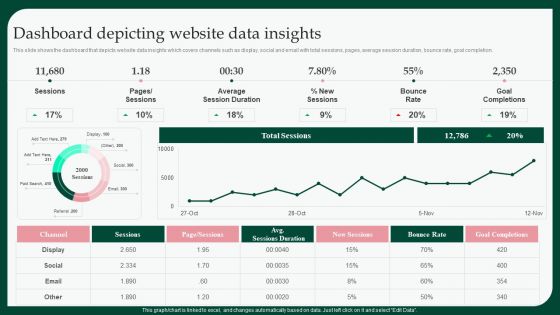
Boosting Product Sales Through Branding Dashboard Depicting Website Data Brochure PDF
This slide shows the dashboard that depicts website data insights which covers channels such as display, social and email with total sessions, pages, average session duration, bounce rate, goal completion. Coming up with a presentation necessitates that the majority of the effort goes into the content and the message you intend to convey. The visuals of a PowerPoint presentation can only be effective if it supplements and supports the story that is being told. Keeping this in mind our experts created Boosting Product Sales Through Branding Dashboard Depicting Website Data Brochure PDF to reduce the time that goes into designing the presentation. This way, you can concentrate on the message while our designers take care of providing you with the right template for the situation.
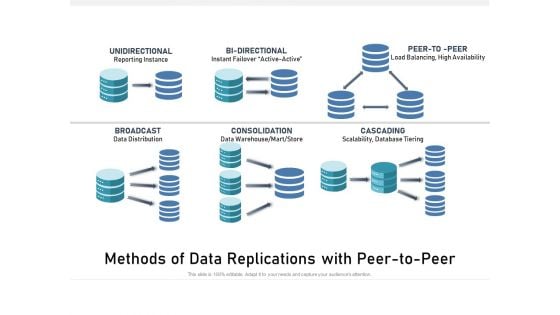
Methods Of Data Replications With Peer To Peer Ppt PowerPoint Presentation Model Graphic Images PDF
Presenting methods of data replications with peer to peer ppt powerpoint presentation model graphic images pdf. to dispense important information. This template comprises six stages. It also presents valuable insights into the topics including unidirectional, reporting instance, bi directional, instant failover active active, peer to peer, load balancing, high availability, broadcast, data distribution, consolidation, data warehouse mart store, cascading, scalability, database tiering. This is a completely customizable PowerPoint theme that can be put to use immediately. So, download it and address the topic impactfully.
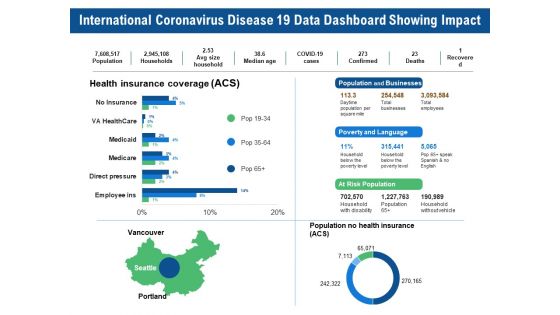
International Coronavirus Disease 19 Data Dashboard Showing Impact Ppt PowerPoint Presentation Portfolio Samples PDF
Pitch your topic with ease and precision using this international coronavirus disease 19 data dashboard showing impact ppt powerpoint presentation portfolio samples pdf. This layout presents information on population, households, avg size household, median age, confirmed, total employees, total businesses, population and businesses. It is also available for immediate download and adjustment. So, changes can be made in the color, design, graphics or any other component to create a unique layout.
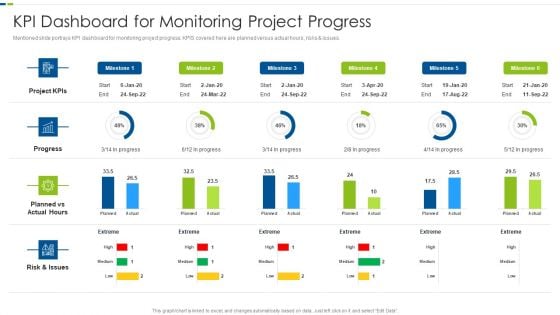
Utilizing Agile Methodology In Data Transformation Project IT KPI Dashboard For Monitoring Template PDF
Mentioned slide portrays KPI dashboard for monitoring project progress. KPIS covered here are planned versus actual hours, risks and issues. Deliver and pitch your topic in the best possible manner with this utilizing agile methodology in data transformation project it kpi dashboard for monitoring template pdf. Use them to share invaluable insights on risk, planned, project and impress your audience. This template can be altered and modified as per your expectations. So, grab it now.

Agile Techniques For Data Migration Kpi Dashboard For Monitoring Project Progress Inspiration PDF
Mentioned slide portrays KPI dashboard for monitoring project progress. KPIS covered here are planned versus actual hours, risks and issues. Deliver an awe inspiring pitch with this creative Agile Techniques For Data Migration Kpi Dashboard For Monitoring Project Progress Inspiration PDF bundle. Topics like Project, Progress, Planned, Risks And Issues can be discussed with this completely editable template. It is available for immediate download depending on the needs and requirements of the user.
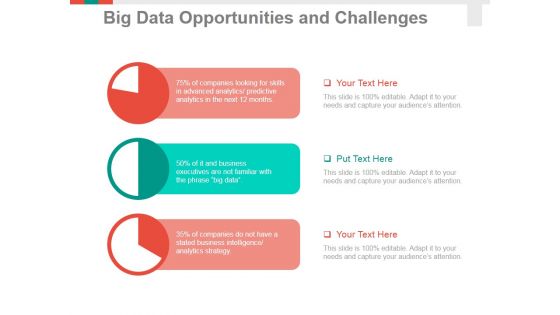
Big Data Opportunities And Challenges Template 1 Ppt PowerPoint Presentation Infographic Template Summary
This is a big data opportunities and challenges template 1 ppt powerpoint presentation infographic template summary. This is a three stage process. The stages in this process are business, pie chart, finance, marketing, analysis, strategy.
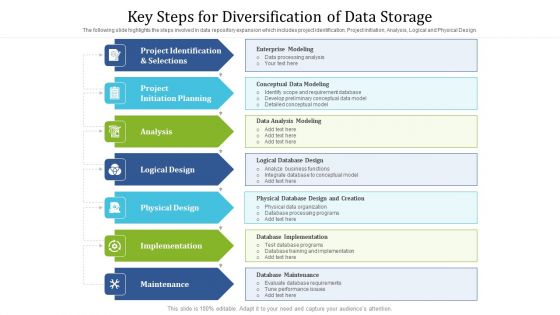
Key Steps For Diversification Of Data Storage Ppt Inspiration Ideas PDF
The following slide highlights the steps involved in data repository expansion which includes project identification, Project initiation, Analysis, Logical and Physical Design. Presenting key steps for diversification of data storage ppt inspiration ideas pdf to dispense important information. This template comprises seven stages. It also presents valuable insights into the topics including analysis, physical design, implementation, maintenance, logical design. This is a completely customizable PowerPoint theme that can be put to use immediately. So, download it and address the topic impactfully.
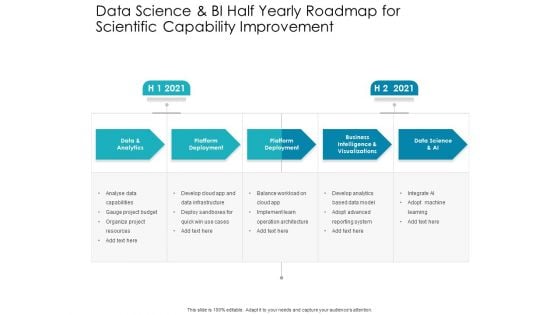
Data Science And BI Half Yearly Roadmap For Scientific Capability Improvement Brochure
Presenting our innovatively structured data science and bi half yearly roadmap for scientific capability improvement brochure Template. Showcase your roadmap process in different formats like PDF, PNG, and JPG by clicking the download button below. This PPT design is available in both Standard Screen and Widescreen aspect ratios. It can also be easily personalized and presented with modified font size, font type, color, and shapes to measure your progress in a clear way.
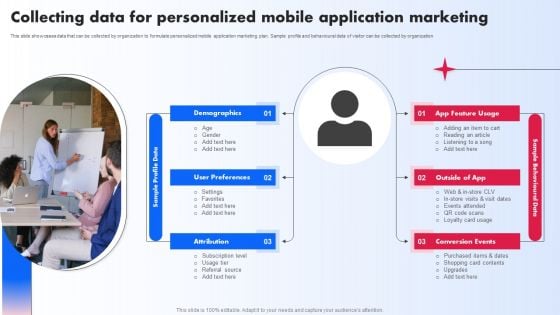
Collecting Data For Personalized Mobile Application Marketing Ppt PowerPoint Presentation File Infographics PDF
This slide showcases data that can be collected by organization to formulate personalized mobile application marketing plan. Sample profile and behavioural data of visitor can be collected by organization Whether you have daily or monthly meetings, a brilliant presentation is necessary. Collecting Data For Personalized Mobile Application Marketing Ppt PowerPoint Presentation File Infographics PDF can be your best option for delivering a presentation. Represent everything in detail using Collecting Data For Personalized Mobile Application Marketing Ppt PowerPoint Presentation File Infographics PDF and make yourself stand out in meetings. The template is versatile and follows a structure that will cater to your requirements. All the templates prepared by Slidegeeks are easy to download and edit. Our research experts have taken care of the corporate themes as well. So, give it a try and see the results.
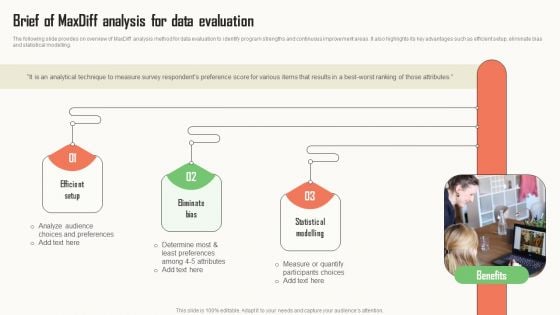
Strategic Market Insight Implementation Guide Brief Of Maxdiff Analysis For Data Evaluation Themes PDF
The following slide provides on overview of MaxDiff analysis method for data evaluation to identify program strengths and continuous improvement areas. It also highlights its key advantages such as efficient setup, eliminate bias and statistical modelling. Do you have to make sure that everyone on your team knows about any specific topic I yes, then you should give Strategic Market Insight Implementation Guide Brief Of Maxdiff Analysis For Data Evaluation Themes PDF a try. Our experts have put a lot of knowledge and effort into creating this impeccable Strategic Market Insight Implementation Guide Brief Of Maxdiff Analysis For Data Evaluation Themes PDF. You can use this template for your upcoming presentations, as the slides are perfect to represent even the tiniest detail. You can download these templates from the Slidegeeks website and these are easy to edit. So grab these today.
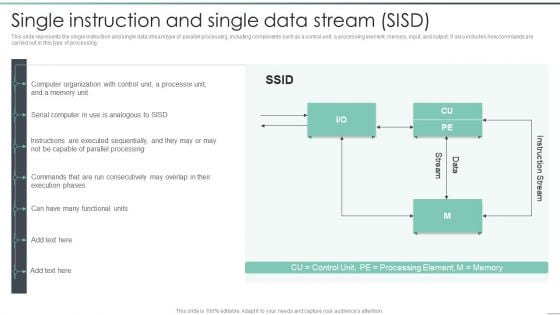
Parallel Computing Processing Single Instruction And Single Data Stream SISD Diagrams PDF
This slide represents the single instruction and single data stream type of parallel processing, including components such as a control unit, a processing element, memory, input, and output. It also includes how commands are carried out in this type of processing. Deliver and pitch your topic in the best possible manner with this Parallel Computing Processing Single Instruction And Single Data Stream SISD Diagrams PDF. Use them to share invaluable insights on Parallel Processing, Execution Phases, Processor Unit and impress your audience. This template can be altered and modified as per your expectations. So, grab it now.

Illustration Of 6 Data Processes And Flows Cycle Arrow PowerPoint Templates
We present our illustration of 6 data processes and flows Cycle Arrow PowerPoint templates.Present our Arrows PowerPoint Templates because knowledge is power goes the popular saying. Download our Process and Flows PowerPoint Templates because there is a crucial aspect that requires extra attention. Present our Business PowerPoint Templates because the NASA Space programme took mankind to the moon and so much more. Like them you too can look far beyond normal boundaries. Show them that in your mind the sky is certainly not the limit. Download and present our Shapes PowerPoint Templates because this template helps you to bring your audiences to the table. Present our Circle Charts PowerPoint Templates because let your words be the drops of wisdom spreading knowledge and peace like ripples through the expectant minds of your devoted followers.Use these PowerPoint slides for presentations relating to Arrows, Background, Blue, Chart, Circle, Circular, Circulation, Color, Connection, Continuity, Cycle, Cyclic, Diagram, Direction, Empty, Flow, Four, Dimensional, Graph, Icon, Presentation, Process, Progress, Reason, Recycle, Recycling, Repetition, Report, Result, Ring, Rotation, Round, Scheme, Section, Step, Symbol, Teamwork. The prominent colors used in the PowerPoint template are Yellow, Gray, White. Professionals tell us our illustration of 6 data processes and flows Cycle Arrow PowerPoint templates will impress their bosses and teams. You can be sure our Circulation PowerPoint templates and PPT Slides are Functional. Customers tell us our illustration of 6 data processes and flows Cycle Arrow PowerPoint templates are specially created by a professional team with vast experience. They diligently strive to come up with the right vehicle for your brilliant Ideas. Professionals tell us our Connection PowerPoint templates and PPT Slides are Graceful. People tell us our illustration of 6 data processes and flows Cycle Arrow PowerPoint templates are Awesome. People tell us our Connection PowerPoint templates and PPT Slides are Spiffy. Examine all possibilities with our Illustration Of 6 Data Processes And Flows Cycle Arrow PowerPoint Templates. Give every option a real close look.
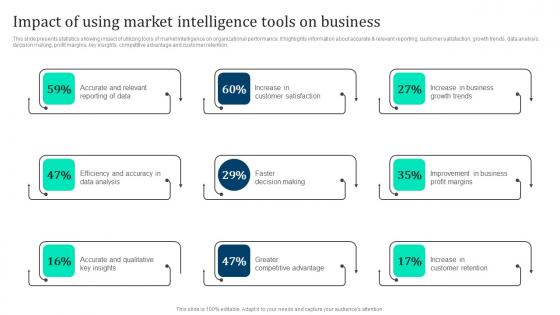
Impact Of Using Market Intelligence Marketing Intelligence Guide Data Gathering Portrait Pdf
This slide presents statistics showing impact of utilizing tools of market intelligence on organizational performance. It highlights information about accurate and relevant reporting, customer satisfaction, growth trends, data analysis, decision making, profit margins, key insights, competitive advantage and customer retention. If you are looking for a format to display your unique thoughts, then the professionally designed Impact Of Using Market Intelligence Marketing Intelligence Guide Data Gathering Portrait Pdf is the one for you. You can use it as a Google Slides template or a PowerPoint template. Incorporate impressive visuals, symbols, images, and other charts. Modify or reorganize the text boxes as you desire. Experiment with shade schemes and font pairings. Alter, share or cooperate with other people on your work. Download Impact Of Using Market Intelligence Marketing Intelligence Guide Data Gathering Portrait Pdf and find out how to give a successful presentation. Present a perfect display to your team and make your presentation unforgettable. This slide presents statistics showing impact of utilizing tools of market intelligence on organizational performance. It highlights information about accurate and relevant reporting, customer satisfaction, growth trends, data analysis, decision making, profit margins, key insights, competitive advantage and customer retention.
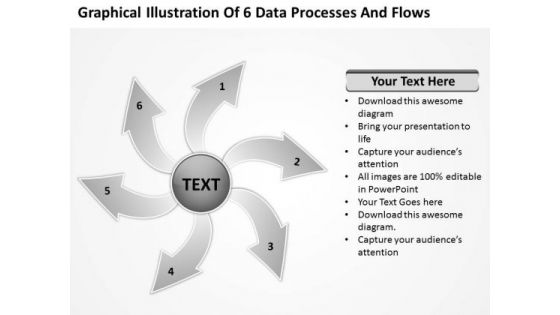
Illustration Of 6 Data Processes And Flows Circular Diagram PowerPoint Slides
We present our illustration of 6 data processes and flows Circular Diagram PowerPoint Slides.Download our Arrows PowerPoint Templates because They will bring a lot to the table. Their alluring flavours will make your audience salivate. Present our Process and Flows PowerPoint Templates because Our PowerPoint Templates and Slides will bullet point your ideas. See them fall into place one by one. Present our Business PowerPoint Templates because your product has established a foothold in the market. Customers are happy with the value it brings to their lives. Present our Shapes PowerPoint Templates because Our PowerPoint Templates and Slides team portray an attitude of elegance. Personify this quality by using them regularly. Present our Circle Charts PowerPoint Templates because you can gain the success to desired levels in one go.Use these PowerPoint slides for presentations relating to Arrows, Background, Blue, Chart, Circle, Circular, Circulation, Color, Connection, Continuity, Cycle, Cyclic, Diagram, Direction, Empty, Flow, Four, Dimensional, Graph, Icon, Presentation, Process, Progress, Reason, Recycle, Recycling, Repetition, Report, Result, Ring, Rotation, Round, Scheme, Section, Step, Symbol, Teamwork. The prominent colors used in the PowerPoint template are Gray, Black, White. Professionals tell us our illustration of 6 data processes and flows Circular Diagram PowerPoint Slides are Stunning. You can be sure our Circle PowerPoint templates and PPT Slides will make the presenter successul in his career/life. Customers tell us our illustration of 6 data processes and flows Circular Diagram PowerPoint Slides are Precious. Professionals tell us our Chart PowerPoint templates and PPT Slides are Gorgeous. People tell us our illustration of 6 data processes and flows Circular Diagram PowerPoint Slides are Playful. People tell us our Circle PowerPoint templates and PPT Slides are One-of-a-kind. Go on a binge with our Illustration Of 6 Data Processes And Flows Circular Diagram PowerPoint Slides. The after effects will always be pleasant.
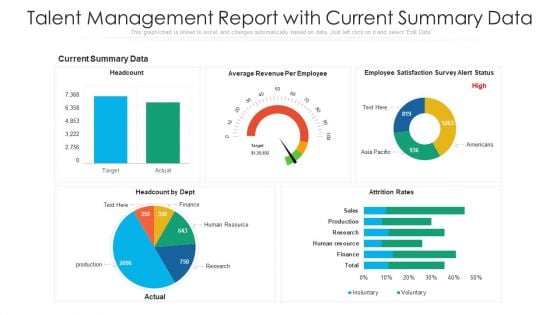
Talent Management Report With Current Summary Data Ppt Gallery Example Topics PDF
Showcasing this set of slides titled talent management report with current summary data ppt gallery example topics pdf. The topics addressed in these templates are human resource, research, production. All the content presented in this PPT design is completely editable. Download it and make adjustments in color, background, font etc. as per your unique business setting.
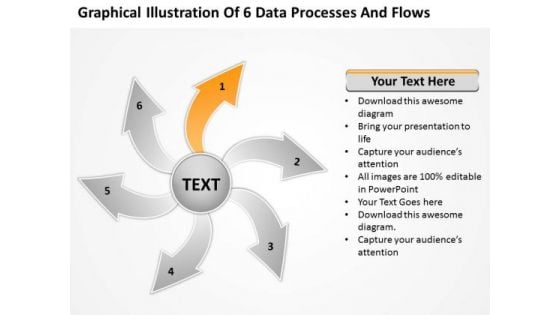
Illustration Of 6 Data Processes And Flows Circular Spoke Chart PowerPoint Slides
We present our illustration of 6 data processes and flows Circular Spoke Chart PowerPoint Slides.Present our Arrows PowerPoint Templates because this slide helps you to communicate your concerns and educate your team along the path to success. Download our Process and Flows PowerPoint Templates because it Highlights the results of you thought process and convinces your team of the reasons for selecting a particular path to follow. Present our Business PowerPoint Templates because project your ideas to you colleagues and complete the full picture. Download our Shapes PowerPoint Templates because different personalities, different abilities but formidable together. Download and present our Circle Charts PowerPoint Templates because this slide shows each path to the smallest detail.Use these PowerPoint slides for presentations relating to Arrows, Background, Blue, Chart, Circle, Circular, Circulation, Color, Connection, Continuity, Cycle, Cyclic, Diagram, Direction, Empty, Flow, Four, Dimensional, Graph, Icon, Presentation, Process, Progress, Reason, Recycle, Recycling, Repetition, Report, Result, Ring, Rotation, Round, Scheme, Section, Step, Symbol, Teamwork. The prominent colors used in the PowerPoint template are Yellow, Gray, White. Professionals tell us our illustration of 6 data processes and flows Circular Spoke Chart PowerPoint Slides are Beautiful. You can be sure our Circulation PowerPoint templates and PPT Slides are Charming. Customers tell us our illustration of 6 data processes and flows Circular Spoke Chart PowerPoint Slides look good visually. Professionals tell us our Circle PowerPoint templates and PPT Slides are Endearing. People tell us our illustration of 6 data processes and flows Circular Spoke Chart PowerPoint Slides are Energetic. People tell us our Chart PowerPoint templates and PPT Slides are Breathtaking. Intensify growth with our Illustration Of 6 Data Processes And Flows Circular Spoke Chart PowerPoint Slides. Download without worries with our money back guaranteee.
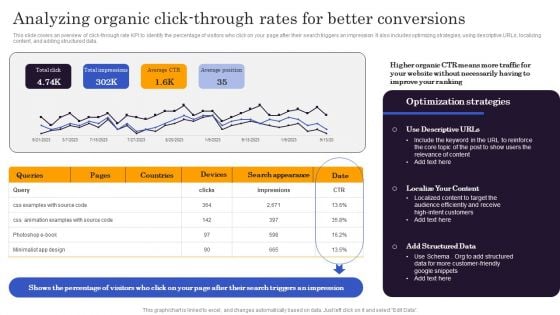
Marketers Guide To Data Analysis Optimization Analyzing Organic Click Through Rates For Better Conversions Structure PDF
This slide covers an overview of click-through rate KPI to identify the percentage of visitors who click on your page after their search triggers an impression. It also includes optimizing strategies, using descriptive URLs, localizing content, and adding structured data. Find highly impressive Marketers Guide To Data Analysis Optimization Analyzing Organic Click Through Rates For Better Conversions Structure PDF on Slidegeeks to deliver a meaningful presentation. You can save an ample amount of time using these presentation templates. No need to worry to prepare everything from scratch because Slidegeeks experts have already done a huge research and work for you. You need to download Marketers Guide To Data Analysis Optimization Analyzing Organic Click Through Rates For Better Conversions Structure PDF for your upcoming presentation. All the presentation templates are 100 percent editable and you can change the color and personalize the content accordingly. Download now.
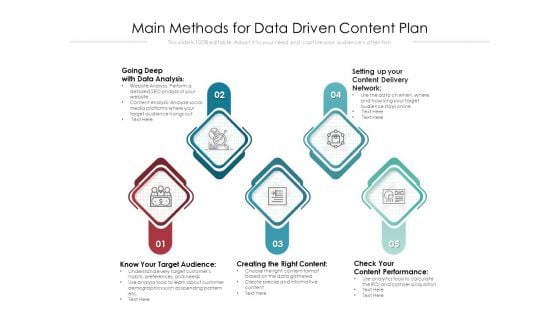
Main Methods For Data Driven Content Plan Ppt PowerPoint Presentation Professional Design Templates PDF
Presenting main methods for data driven content plan ppt powerpoint presentation professional design templates pdf to dispense important information. This template comprises five stages. It also presents valuable insights into the topics including going deep with data analysis, setting up your content delivery network, know your target audience, creating the right content, check your content performance. This is a completely customizable PowerPoint theme that can be put to use immediately. So, download it and address the topic impactfully.
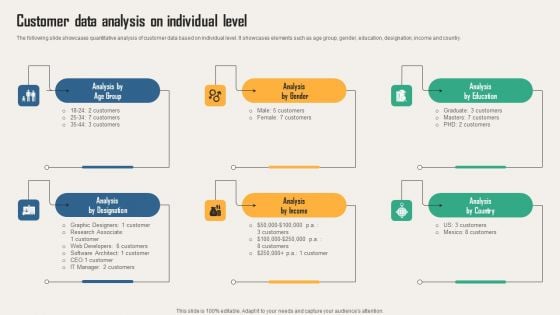
Creating Customer Personas For Customizing Customer Data Analysis On Individual Level Themes PDF
The following slide showcases quantitative analysis of customer data based on individual level. It showcases elements such as age group, gender, education, designation, income and country. From laying roadmaps to briefing everything in detail, our templates are perfect for you. You can set the stage with your presentation slides. All you have to do is download these easy-to-edit and customizable templates. Creating Customer Personas For Customizing Customer Data Analysis On Individual Level Themes PDF will help you deliver an outstanding performance that everyone would remember and praise you for. Do download this presentation today.
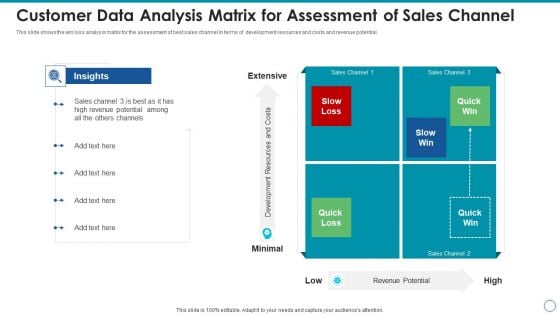
Customer Data Analysis Matrix For Assessment Of Sales Channel Template PDF
This slide shows the win loss analysis matrix for the assessment of best sales channel in terms of development resources and costs and revenue potential. Presenting customer data analysis matrix for assessment of sales channel template pdf to dispense important information. This template comprises four stages. It also presents valuable insights into the topics including customer data analysis matrix for assessment of sales channel. This is a completely customizable PowerPoint theme that can be put to use immediately. So, download it and address the topic impactfully.
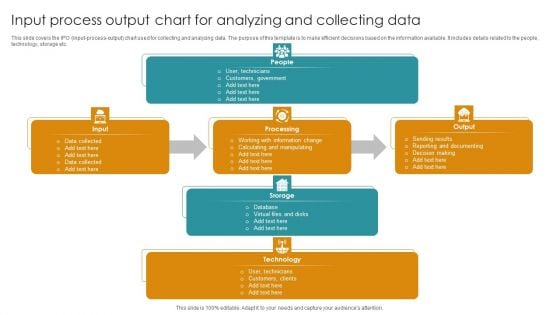
Input Process Output Chart For Analyzing And Collecting Data Download PDF
This slide covers the IPO input-process-output chart used for collecting and analyzing data. The purpose of this template is to make efficient decisions based on the information available. It includes details related to the people, technology, storage etc. Showcasing this set of slides titled Input Process Output Chart For Analyzing And Collecting Data Download PDF. The topics addressed in these templates are People, Storage, Technology. All the content presented in this PPT design is completely editable. Download it and make adjustments in color, background, font etc. as per your unique business setting.
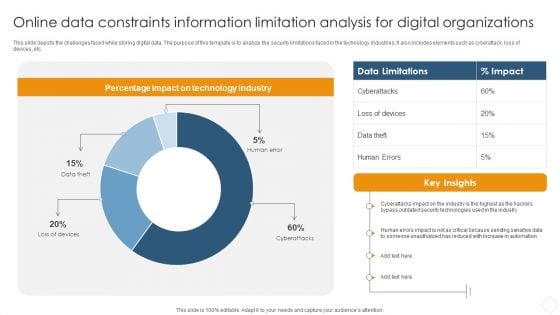
Online Data Constraints Information Limitation Analysis For Digital Organizations Information PDF
This slide depicts the challenges faced while storing digital data. The purpose of this template is to analyze the security limitations faced in the technology industries. It also includes elements such as cyberattack, loss of devices, etc.Pitch your topic with ease and precision using this Online Data Constraints Information Limitation Analysis For Digital Organizations Information PDF. This layout presents information on Percentage Impact, Technology Industry, Security Technologies. It is also available for immediate download and adjustment. So, changes can be made in the color, design, graphics or any other component to create a unique layout.
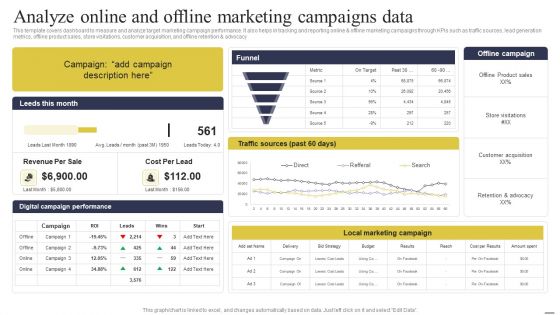
Defining Generic Target Marketing Techniques Analyze Online And Offline Marketing Campaigns Data Topics PDF
This template covers dashboard to measure and analyze target marketing campaign performance. It also helps in tracking and reporting online and offline marketing campaigns through KPIs such as traffic sources, lead generation metrics, offline product sales, store visitations, customer acquisition, and offline retention and advocacy. Create an editable Defining Generic Target Marketing Techniques Analyze Online And Offline Marketing Campaigns Data Topics PDF that communicates your idea and engages your audience. Whether you are presenting a business or an educational presentation, pre designed presentation templates help save time. Defining Generic Target Marketing Techniques Analyze Online And Offline Marketing Campaigns Data Topics PDF is highly customizable and very easy to edit, covering many different styles from creative to business presentations. Slidegeeks has creative team members who have crafted amazing templates. So, go and get them without any delay.
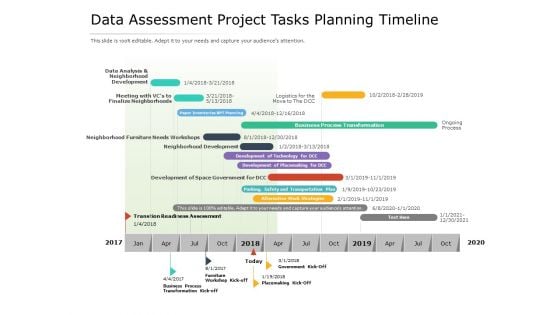
Data Assessment Project Tasks Planning Timeline Ppt PowerPoint Presentation Ideas Images PDF
Presenting data assessment project tasks planning timeline ppt powerpoint presentation ideas images pdf to dispense important information. This template comprises one stages. It also presents valuable insights into the topics including data analysis and neighborhood development, meeting with vcs to finalize neighborhoods, business process transformation, development of placemaking for dcc, business process transformation kick off, 2017 to 2020. This is a completely customizable PowerPoint theme that can be put to use immediately. So, download it and address the topic impactfully.
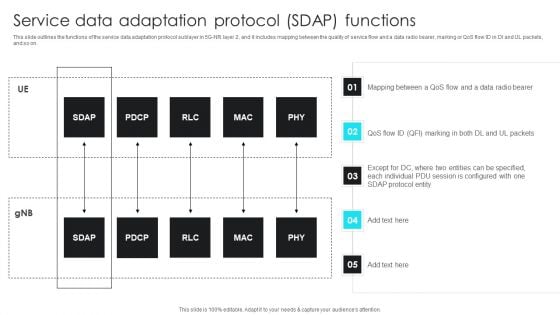
5G Network Operations Service Data Adaptation Protocol SDAP Functions Themes PDF
This slide outlines the functions of the service data adaptation protocol sublayer in 5G-NR layer 2, and it includes mapping between the quality of service flow and a data radio bearer, marking or QoS flow ID in Dl and UL packets, and so on. This 5G Network Operations Service Data Adaptation Protocol SDAP Functions Themes PDF from Slidegeeks makes it easy to present information on your topic with precision. It provides customization options, so you can make changes to the colors, design, graphics, or any other component to create a unique layout. It is also available for immediate download, so you can begin using it right away. Slidegeeks has done good research to ensure that you have everything you need to make your presentation stand out. Make a name out there for a brilliant performance.
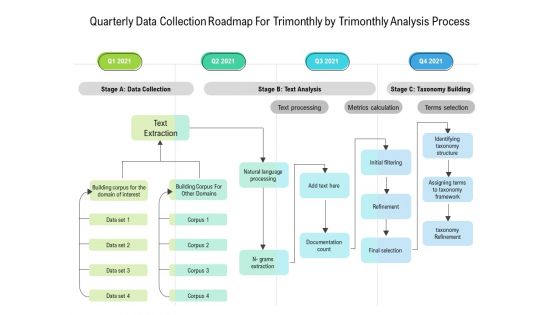
Quarterly Data Collection Roadmap For Trimonthly By Trimonthly Analysis Process Information
We present our quarterly data collection roadmap for trimonthly by trimonthly analysis process information. This PowerPoint layout is easy to edit so you can change the font size, font type, color, and shape conveniently. In addition to this, the PowerPoint layout is Google Slides compatible, so you can share it with your audience and give them access to edit it. Therefore, download and save this well researched quarterly data collection roadmap for trimonthly by trimonthly analysis process information in different formats like PDF, PNG, and JPG to smoothly execute your business plan.
Business Strategy 5 Staged Data Analysis Strategic Plan Example Ppt Slide
Double Your Chances With Our business strategy 5 staged data analysis strategic plan example ppt slide Powerpoint Templates. The Value Of Your Thoughts Will Increase Two-Fold. Charm The Audience With Your Thoughts. Add Our Process and Flows Powerpoint Templates And They Will Be Dotty For You.
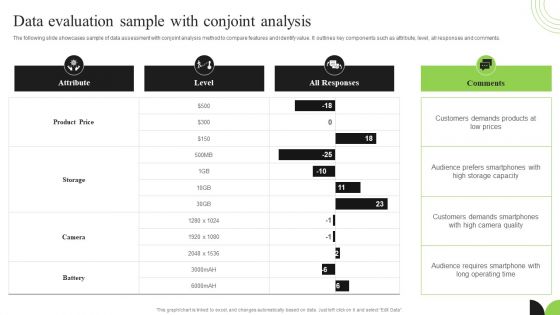
Guidebook For Executing Business Market Intelligence Data Evaluation Sample With Conjoint Analysis Ideas PDF
The following slide showcases sample of data assessment with conjoint analysis method to compare features and identify value. It outlines key components such as attribute, level, all responses and comments. Boost your pitch with our creative Guidebook For Executing Business Market Intelligence Data Evaluation Sample With Conjoint Analysis Ideas PDF. Deliver an awe inspiring pitch that will mesmerize everyone. Using these presentation templates you will surely catch everyones attention. You can browse the ppts collection on our website. We have researchers who are experts at creating the right content for the templates. So you do not have to invest time in any additional work. Just grab the template now and use them.
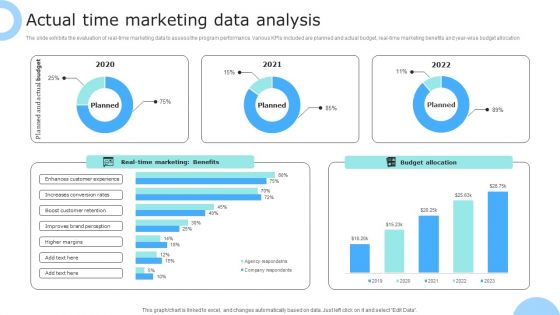
Actual Time Marketing Data Analysis Ppt PowerPoint Presentation Gallery Pictures PDF
The slide exhibits the evaluation of real-time marketing data to assess the program performance. Various KPIs included are planned and actual budget, real-time marketing benefits and year-wise budget allocation. Showcasing this set of slides titled Actual Time Marketing Data Analysis Ppt PowerPoint Presentation Gallery Pictures PDF. The topics addressed in these templates are Planned, Actual Budget, Budget Allocation, Real Time Marketing, Benefits. All the content presented in this PPT design is completely editable. Download it and make adjustments in color, background, font etc. as per your unique business setting.
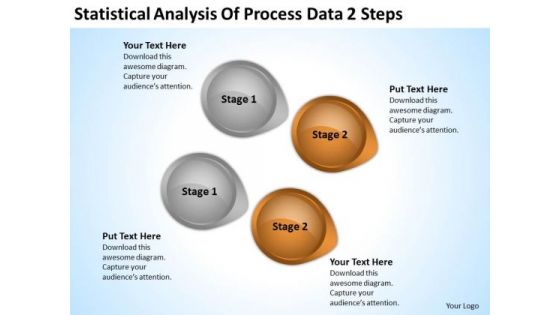
Arrow In PowerPoint Statistical Analysis Of Process Data 2 Steps Ppt Slide
We present our arrow in powerpoint statistical analysis of process data 2 steps ppt Slide.Download our Business PowerPoint Templates because Our PowerPoint Templates and Slides will weave a web of your great ideas. They are gauranteed to attract even the most critical of your colleagues. Use our Circle Charts PowerPoint Templates because Our PowerPoint Templates and Slides will let your words and thoughts hit bullseye everytime. Download our Arrows PowerPoint Templates because Our PowerPoint Templates and Slides will let you Hit the right notes. Watch your audience start singing to your tune. Download and present our Shapes PowerPoint Templates because You have the co-ordinates for your destination of success. Let our PowerPoint Templates and Slides map out your journey. Download and present our Signs PowerPoint Templates because It will let you Set new benchmarks with our PowerPoint Templates and Slides. They will keep your prospects well above par.Use these PowerPoint slides for presentations relating to 3d, abstract, analysis, arrow, background, business, button, chart, circle, circular, color, concept, conservation, cycle, development, diagram, direction, eco, ecology, energy, environment, flow, flowchart, globe, graphic, growing, growth, icon, internet, isolated, object, power, process, protection, recyclable, recycle, recycling, render, resource, saving, sign, solution, sphere, statistic, sustainable, symbol, technology, white. The prominent colors used in the PowerPoint template are Brown, Gray, Black. You can be sure our arrow in powerpoint statistical analysis of process data 2 steps ppt Slide are designed by professionals People tell us our button PowerPoint templates and PPT Slides will make the presenter look like a pro even if they are not computer savvy. You can be sure our arrow in powerpoint statistical analysis of process data 2 steps ppt Slide are designed by professionals Use our arrow PowerPoint templates and PPT Slides have awesome images to get your point across. Presenters tell us our arrow in powerpoint statistical analysis of process data 2 steps ppt Slide will make the presenter successul in his career/life. We assure you our arrow PowerPoint templates and PPT Slides are visually appealing. Get noticed immediately with our Arrow In PowerPoint Statistical Analysis Of Process Data 2 Steps Ppt Slide. Dont waste time struggling with PowerPoint. Let us do it for you.
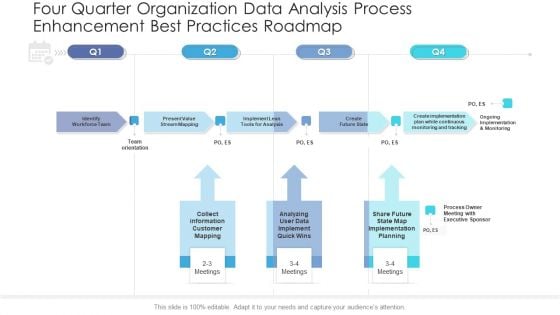
Four Quarter Organization Data Analysis Process Enhancement Best Practices Roadmap Demonstration
We present our four quarter organization data analysis process enhancement best practices roadmap demonstration. This PowerPoint layout is easy to edit so you can change the font size, font type, color, and shape conveniently. In addition to this, the PowerPoint layout is Google Slides compatible, so you can share it with your audience and give them access to edit it. Therefore, download and save this well researched four quarter organization data analysis process enhancement best practices roadmap demonstration in different formats like PDF, PNG, and JPG to smoothly execute your business plan.
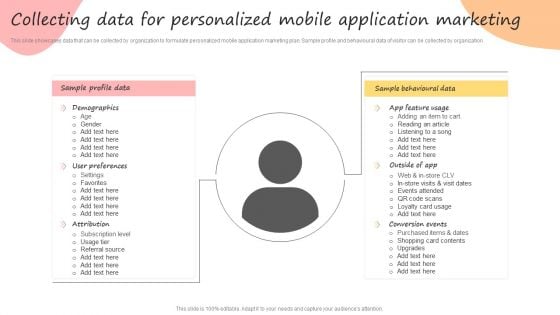
Developing Promotional Strategic Plan For Online Marketing Collecting Data For Personalized Mobile Themes PDF
Whether you have daily or monthly meetings, a brilliant presentation is necessary. Developing Promotional Strategic Plan For Online Marketing Collecting Data For Personalized Mobile Themes PDF can be your best option for delivering a presentation. Represent everything in detail using Developing Promotional Strategic Plan For Online Marketing Collecting Data For Personalized Mobile Themes PDF and make yourself stand out in meetings. The template is versatile and follows a structure that will cater to your requirements. All the templates prepared by Slidegeeks are easy to download and edit. Our research experts have taken care of the corporate themes as well. So, give it a try and see the results.
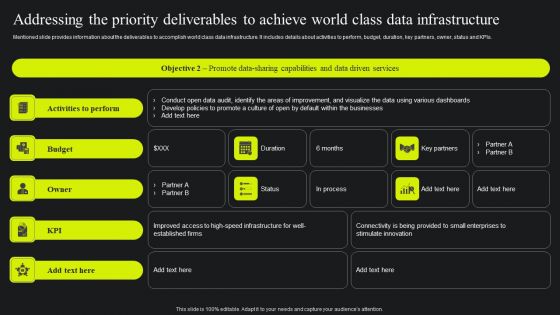
Addressing The Priority Deliverables To Achieve World Class Data Infrastructure Themes PDF
Mentioned slide provides information about the deliverables to accomplish world class data infrastructure. It includes details about activities to perform, budget, duration, key partners, owner, status and KPIs. Slidegeeks is one of the best resources for PowerPoint templates. You can download easily and regulate Addressing The Priority Deliverables To Achieve World Class Data Infrastructure Themes PDF for your personal presentations from our wonderful collection. A few clicks is all it takes to discover and get the most relevant and appropriate templates. Use our Templates to add a unique zing and appeal to your presentation and meetings. All the slides are easy to edit and you can use them even for advertisement purposes.
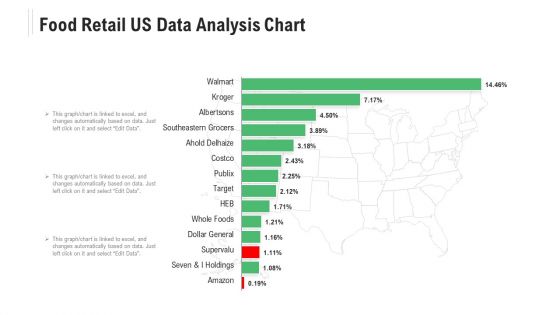
Food Retail US Data Analysis Chart Ppt Powerpoint Presentation Ideas Microsoft Pdf
Pitch your topic with ease and precision using this food retail us data analysis chart ppt powerpoint presentation ideas microsoft pdf. This layout presents information on seven and i holdings, amazon, southeastern grocers, albertsons, target. It is also available for immediate download and adjustment. So, changes can be made in the color, design, graphics or any other component to create a unique layout.
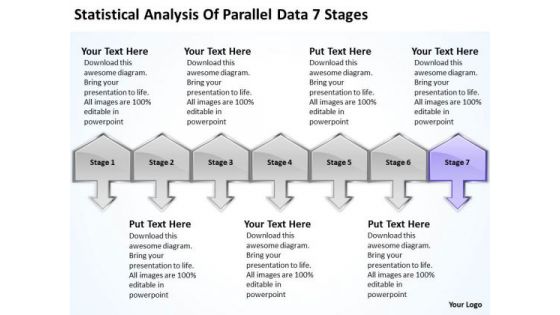
Statistical Analysis Of Parallel Data 7 Stages Ppt Help With Business Plan PowerPoint Slides
We present our statistical analysis of parallel data 7 stages ppt help with business plan PowerPoint Slides.Download and present our Communication PowerPoint Templates because You have gained great respect for your brilliant ideas. Use our PowerPoint Templates and Slides to strengthen and enhance your reputation. Present our Business PowerPoint Templates because you have developed a vision of where you want to be a few years from now. Use our Arrows PowerPoint Templates because this business powerpoint template helps expound on the logic of your detailed thought process to take your company forward. Download our Success PowerPoint Templates because iT outlines the entire thought process for the benefit of others. Tell it to the world with your characteristic aplomb. Use our Symbol PowerPoint Templates because this template helps you to bring your audiences to the table.Use these PowerPoint slides for presentations relating to 3d, Achievement, Action, Aim, Arrows, Black, Business, Color, Communication, Competition, Concept, Connection, Creative, Design, Different, Direction, Element, First, Forward, Graph, Graphic, Group, Growth, Higher, Icon, Illustration, Image, Isolated, Leader, Leadership, Line, Menu, Motion, Orange, Progress, Series, Seven, Sign, Slew, Solution, Success, Swerve, Symbol, Team, Teamwork, Turn, Up. The prominent colors used in the PowerPoint template are Purple, Gray, Black. Customers tell us our statistical analysis of parallel data 7 stages ppt help with business plan PowerPoint Slides will generate and maintain the level of interest you desire. They will create the impression you want to imprint on your audience. Use our Arrows PowerPoint templates and PPT Slides are Magnificent. PowerPoint presentation experts tell us our statistical analysis of parallel data 7 stages ppt help with business plan PowerPoint Slides will help them to explain complicated concepts. People tell us our Action PowerPoint templates and PPT Slides will make the presenter successul in his career/life. We assure you our statistical analysis of parallel data 7 stages ppt help with business plan PowerPoint Slides are Precious. People tell us our Aim PowerPoint templates and PPT Slides are Pleasant. Many a popular belief turn out fallacious. Establish the factual position with our Statistical Analysis Of Parallel Data 7 Stages Ppt Help With Business Plan PowerPoint Slides.
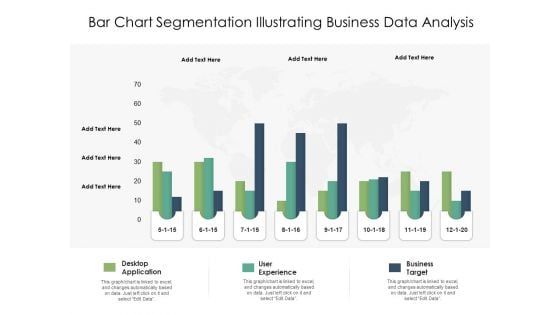
Bar Chart Segmentation Illustrating Business Data Analysis Ppt PowerPoint Presentation Outline File Formats
Presenting this set of slides with name bar chart segmentation illustrating business data analysis ppt powerpoint presentation outline file formats. The topics discussed in these slides are desktop application, user experience, business target. This is a completely editable PowerPoint presentation and is available for immediate download. Download now and impress your audience.
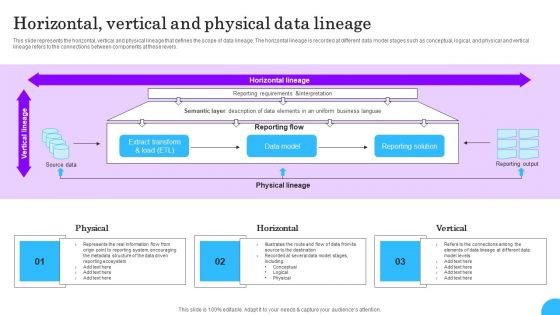
Comprehensive Analysis Of Different Data Lineage Classification Horizontal Vertical And Physical Demonstration PDF
This slide represents the horizontal, vertical and physical lineage that defines the scope of data lineage. The horizontal lineage is recorded at different data model stages such as conceptual, logical, and physical and vertical lineage refers to the connections between components at these levels. Retrieve professionally designed Comprehensive Analysis Of Different Data Lineage Classification Horizontal Vertical And Physical Demonstration PDF to effectively convey your message and captivate your listeners. Save time by selecting pre-made slideshows that are appropriate for various topics, from business to educational purposes. These themes come in many different styles, from creative to corporate, and all of them are easily adjustable and can be edited quickly. Access them as PowerPoint templates or as Google Slides themes. You do not have to go on a hunt for the perfect presentation because Slidegeeks got you covered from everywhere.
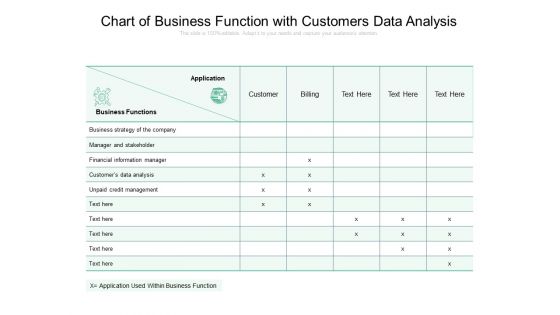
Chart Of Business Function With Customers Data Analysis Ppt PowerPoint Presentation File Slides PDF
Pitch your topic with ease and precision using this chart of business function with customers data analysis ppt powerpoint presentation file slides pdf. This layout presents information on financial, business, strategy. It is also available for immediate download and adjustment. So, changes can be made in the color, design, graphics or any other component to create a unique layout.
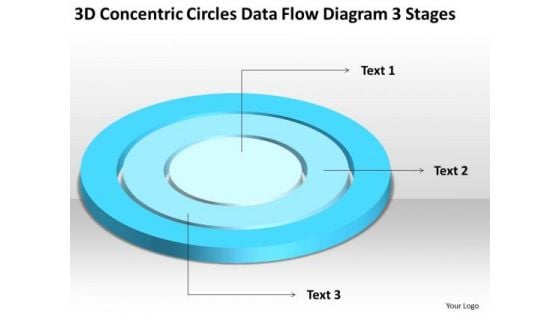
Concentric Circles Data Flow Diagram 3 Stages Business Plan For Non Profit PowerPoint Slides
We present our concentric circles data flow diagram 3 stages business plan for non profit PowerPoint Slides.Present our Circle Charts PowerPoint Templates because Our PowerPoint Templates and Slides team portray an attitude of elegance. Personify this quality by using them regularly. Download our Shapes PowerPoint Templates because You will get more than you ever bargained for. Download our Signs PowerPoint Templates because Timeline crunches are a fact of life. Meet all deadlines using our PowerPoint Templates and Slides. Use our Maketing PowerPoint Templates because you can Add colour to your speech with our PowerPoint Templates and Slides. Your presentation will leave your audience speechless. Use our Metaphors-Visual Concepts PowerPoint Templates because Our PowerPoint Templates and Slides are like the strings of a tennis racquet. Well strung to help you serve aces.Use these PowerPoint slides for presentations relating to diagram, circular, market, bar, advertise, interface, business, concept, vector, sign, success, presentation, symbol, template, circle, brochure, finance, data, description, report, marketing, title, label, abstract, management, graph, four, illustration, icon, pie, chart, strategy, catalog, research, web, design, growth, text, professional, banner, account, profit, information, background, info-graphic, analyze, financial, button, goals. The prominent colors used in the PowerPoint template are Blue, Blue light, White. Our Concentric Circles Data Flow Diagram 3 Stages Business Plan For Non Profit PowerPoint Slides are evidently advantageous. The balance will tilt in your favour.
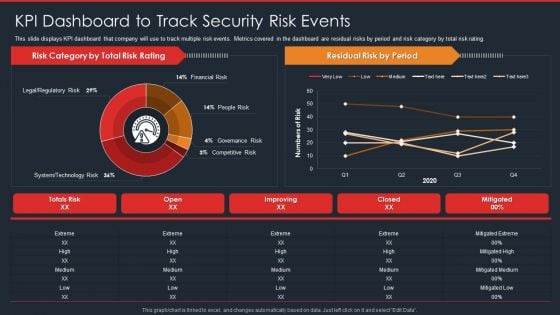
Data Safety Initiatives KPI Dashboard To Track Security Risk Events Portrait PDF
This slide displays KPI dashboard that company will use to track multiple risk events. Metrics covered in the dashboard are residual risks by period and risk category by total risk rating. Deliver and pitch your topic in the best possible manner with this data safety initiatives kpi dashboard to track security risk events portrait pdf. Use them to share invaluable insights on risk category, total risk rating, residual risk by period, technology risk and impress your audience. This template can be altered and modified as per your expectations. So, grab it now.
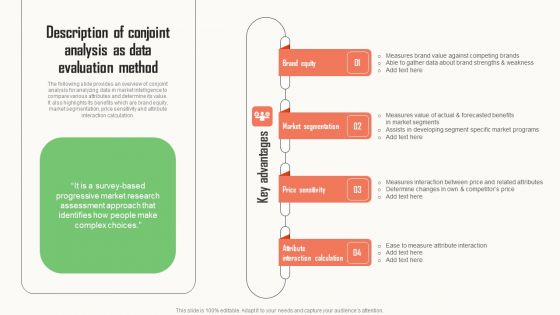
Strategic Market Insight Implementation Guide Description Of Conjoint Analysis As Data Evaluation Method Graphics PDF
The following slide provides an overview of conjoint analysis for analyzing data in market intelligence to compare various attributes and determine its value. It also highlights its benefits which are brand equity, market segmentation, price sensitivity and attribute interaction calculation. Whether you have daily or monthly meetings, a brilliant presentation is necessary. Strategic Market Insight Implementation Guide Description Of Conjoint Analysis As Data Evaluation Method Graphics PDF can be your best option for delivering a presentation. Represent everything in detail using Strategic Market Insight Implementation Guide Description Of Conjoint Analysis As Data Evaluation Method Graphics PDF and make yourself stand out in meetings. The template is versatile and follows a structure that will cater to your requirements. All the templates prepared by Slidegeeks are easy to download and edit. Our research experts have taken care of the corporate themes as well. So, give it a try and see the results.
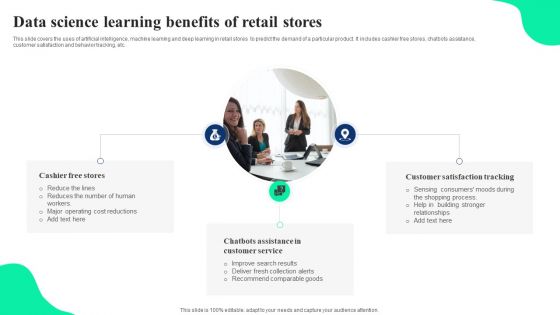
Data Science Learning Benefits Of Retail Stores Ppt Professional Themes PDF
This slide covers the uses of artificial intelligence, machine learning and deep learning in retail stores to predict the demand of a particular product. It includes cashier free stores, chatbots assistance, customer satisfaction and behavior tracking, etc. Persuade your audience using this Data Science Learning Benefits Of Retail Stores Ppt Professional Themes PDF. This PPT design covers three stages, thus making it a great tool to use. It also caters to a variety of topics including Cashier Free Stores, Customer Satisfaction Tracking, Chatbots Assistance, Customer Service. Download this PPT design now to present a convincing pitch that not only emphasizes the topic but also showcases your presentation skills.
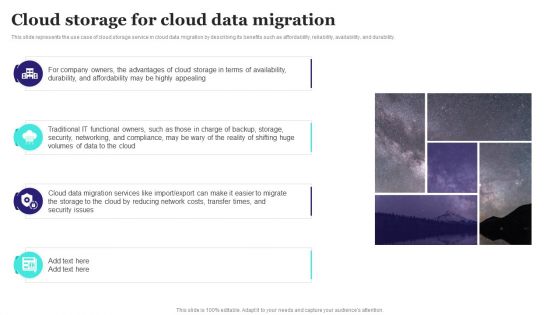
Cloud Storage For Cloud Data Migration Ppt PowerPoint Presentation Diagram Images PDF
This slide represents the use case of cloud storage service in cloud data migration by describing its benefits such as affordability, reliability, availability, and durability. Want to ace your presentation in front of a live audience Our Cloud Storage For Cloud Data Migration Ppt PowerPoint Presentation Diagram Images PDF can help you do that by engaging all the users towards you. Slidegeeks experts have put their efforts and expertise into creating these impeccable powerpoint presentations so that you can communicate your ideas clearly. Moreover, all the templates are customizable, and easy to edit and downloadable. Use these for both personal and commercial use.
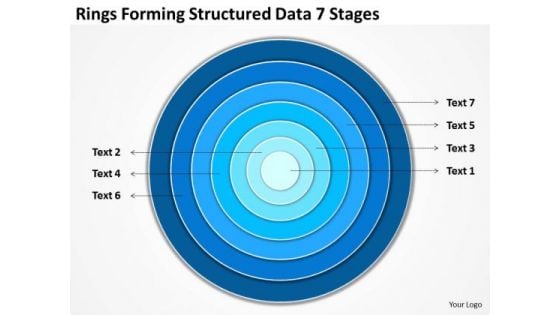
Rings Forming Structured Data 7 Stages Step By Business Plan Template PowerPoint Slides
We present our rings forming structured data 7 stages step by business plan template PowerPoint Slides.Use our Circle Charts PowerPoint Templates because They will Put your wonderful verbal artistry on display. Our PowerPoint Templates and Slides will provide you the necessary glam and glitter. Present our Shapes PowerPoint Templates because It will Give impetus to the hopes of your colleagues. Our PowerPoint Templates and Slides will aid you in winning their trust. Download and present our Signs PowerPoint Templates because Our PowerPoint Templates and Slides will let you Clearly mark the path for others to follow. Download and present our Maketing PowerPoint Templates because It will mark the footprints of your journey. Illustrate how they will lead you to your desired destination. Use our Metaphors-Visual Concepts PowerPoint Templates because Our PowerPoint Templates and Slides has conjured up a web of all you need with the help of our great team. Use them to string together your glistening ideas.Use these PowerPoint slides for presentations relating to diagram, circular, market, bar, advertise, interface, business, concept, vector, sign, success, presentation, symbol, template, circle, brochure, finance, data, description, report, marketing, title, label, abstract, management, graph, four, illustration, icon, pie, chart, strategy, catalog, research, web, design, growth, text, professional, banner, account, profit, information, background, info-graphic, analyze, financial, button, goals. The prominent colors used in the PowerPoint template are Blue, Blue light, White. Face your audience with our Rings Forming Structured Data 7 Stages Step By Business Plan Template PowerPoint Slides. You will come out on top.
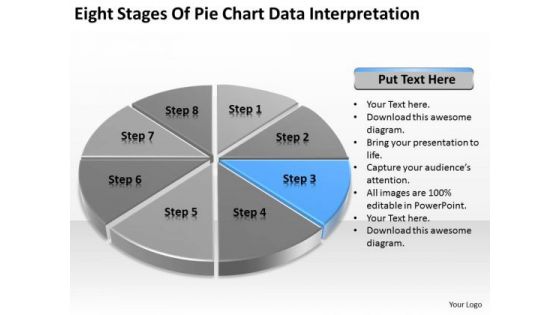
Eight Stages Of Pie Chart Data Interpretation Business Plan PowerPoint Slides
We present our eight stages of pie chart data interpretation business plan PowerPoint Slides.Use our Competition PowerPoint Templates because Our PowerPoint Templates and Slides will let you Clearly mark the path for others to follow. Download and present our Marketing PowerPoint Templates because Our PowerPoint Templates and Slides will weave a web of your great ideas. They are gauranteed to attract even the most critical of your colleagues. Present our Arrows PowerPoint Templates because Our PowerPoint Templates and Slides will let you Hit the target. Go the full distance with ease and elan. Use our Circle Charts PowerPoint Templates because You have gained great respect for your brilliant ideas. Use our PowerPoint Templates and Slides to strengthen and enhance your reputation. Download our Business PowerPoint Templates because You are an avid believer in ethical practices. Highlight the benefits that accrue with our PowerPoint Templates and Slides.Use these PowerPoint slides for presentations relating to chart, graph, pie, 3d, diagram, graphic, icon, control, business, data, profit, market, sales, display, corporate, concept, render, success, presentation, finance, report, marketing, accounting, management, piece, strategy, money, growth, company, competition, progress, account, sheet, part, information, investment, improvement, banking, index, financial, reflect, results, performance, exchange. The prominent colors used in the PowerPoint template are Blue, Black, Gray. Great presentations happen with our Eight Stages Of Pie Chart Data Interpretation Business Plan PowerPoint Slides. Try us out and see what a difference our templates make.
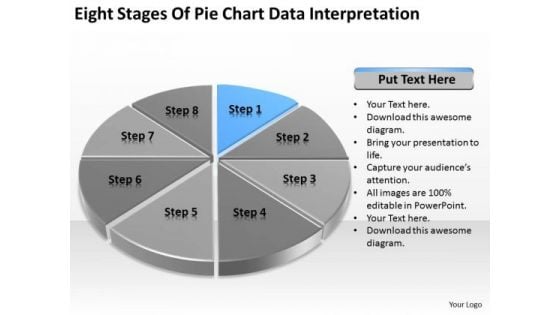
Eight Stages Of Pie Chart Data Interpretation Business Plan PowerPoint Templates
We present our eight stages of pie chart data interpretation business plan PowerPoint templates.Download and present our Competition PowerPoint Templates because Our PowerPoint Templates and Slides will embellish your thoughts. See them provide the desired motivation to your team. Download and present our Marketing PowerPoint Templates because You should Press the right buttons with our PowerPoint Templates and Slides. They will take your ideas down the perfect channel. Download our Arrows PowerPoint Templates because Your ideas provide food for thought. Our PowerPoint Templates and Slides will help you create a dish to tickle the most discerning palate. Use our Circle Charts PowerPoint Templates because You can Raise a toast with our PowerPoint Templates and Slides. Spread good cheer amongst your audience. Download and present our Business PowerPoint Templates because Our PowerPoint Templates and Slides will let your ideas bloom. Create a bed of roses for your audience.Use these PowerPoint slides for presentations relating to chart, graph, pie, 3d, diagram, graphic, icon, control, business, data, profit, market, sales, display, corporate, concept, render, success, presentation, finance, report, marketing, accounting, management, piece, strategy, money, growth, company, competition, progress, account, sheet, part, information, investment, improvement, banking, index, financial, reflect, results, performance, exchange. The prominent colors used in the PowerPoint template are Blue, Black, Gray. Our Eight Stages Of Pie Chart Data Interpretation Business Plan PowerPoint Templates capture the attention of your audience. With our money back guarantee you have nothing to lose.
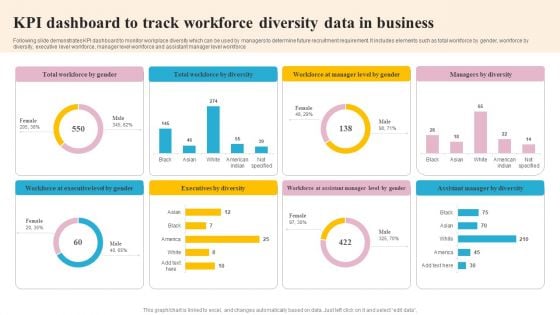
KPI Dashboard To Track Workforce Diversity Data In Business Mockup PDF
Following slide demonstrates KPI dashboard to monitor workplace diversity which can be used by managers to determine future recruitment requirement. It includes elements such as total workforce by gender, workforce by diversity, executive level workforce, manager level workforce and assistant manager level workforce. Pitch your topic with ease and precision using this KPI Dashboard To Track Workforce Diversity Data In Business Mockup PDF. This layout presents information on Executives By Diversity, Workforce By Diversity, Executive Level By Gender. It is also available for immediate download and adjustment. So, changes can be made in the color, design, graphics or any other component to create a unique layout.
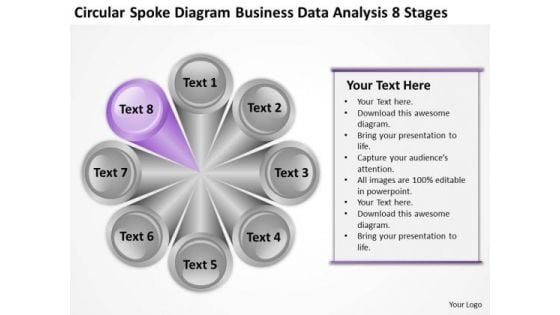
Circular Spoke Diagram Business Data Analysis 8 Stages Ppt Film Plan PowerPoint Slides
We present our circular spoke diagram business data analysis 8 stages ppt film plan PowerPoint Slides.Download and present our Process and Flows PowerPoint Templates because Our PowerPoint Templates and Slides are aesthetically designed to attract attention. We gaurantee that they will grab all the eyeballs you need. Download and present our Spheres PowerPoint Templates because Our PowerPoint Templates and Slides will let Your superior ideas hit the target always and everytime. Download our Business PowerPoint Templates because They will Put your wonderful verbal artistry on display. Our PowerPoint Templates and Slides will provide you the necessary glam and glitter. Download and present our Shapes PowerPoint Templates because It will get your audience in sync. Download our Circle Charts PowerPoint Templates because Our PowerPoint Templates and Slides will generate and maintain the level of interest you desire. They will create the impression you want to imprint on your audience.Use these PowerPoint slides for presentations relating to Design, isolated, statistics, model, statement, interface, business, vector, presentation, glossy, internet, diagram, circle,brochure, description, report, marketing, level, abstract, steps, illustration, pie, chart, sphere, registry, catalog, section, futuristic, web, text,information,eight space, demonstration, navigation, pattern, structure, multiple. The prominent colors used in the PowerPoint template are Purple, Gray, White. Let your thoughts exert some pressure. Our Circular Spoke Diagram Business Data Analysis 8 Stages Ppt Film Plan PowerPoint Slides will do the deed.
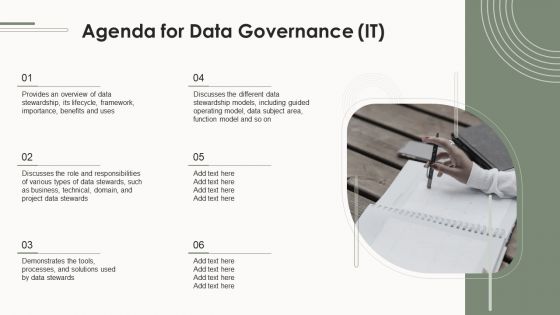
Agenda For Data Governance IT Ppt PowerPoint Presentation File Diagrams PDF
If you are looking for a format to display your unique thoughts, then the professionally designed Agenda For Data Governance IT Ppt PowerPoint Presentation File Diagrams PDF is the one for you. You can use it as a Google Slides template or a PowerPoint template. Incorporate impressive visuals, symbols, images, and other charts. Modify or reorganize the text boxes as you desire. Experiment with shade schemes and font pairings. Alter, share or cooperate with other people on your work. Download Agenda For Data Governance IT Ppt PowerPoint Presentation File Diagrams PDF and find out how to give a successful presentation. Present a perfect display to your team and make your presentation unforgettable.
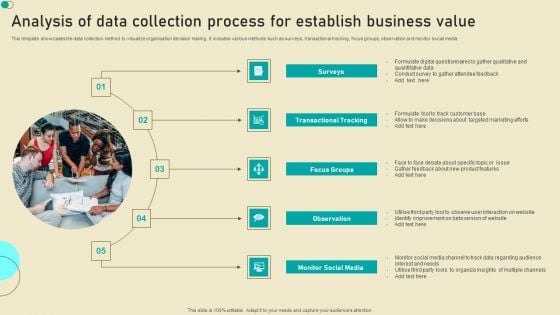
Analysis Of Data Collection Process For Establish Business Value Formats PDF

 Home
Home