Data Analytics Icons
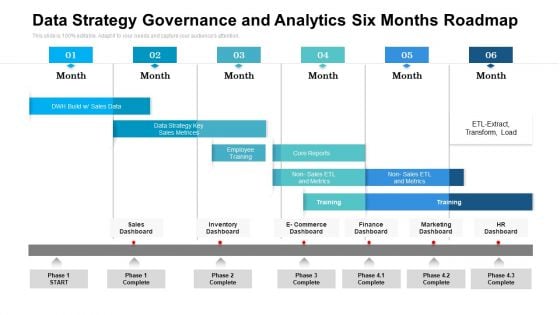
Data Strategy Governance And Analytics Six Months Roadmap Slides
Presenting the data strategy governance and analytics six months roadmap slides. The template includes a roadmap that can be used to initiate a strategic plan. Not only this, the PowerPoint slideshow is completely editable and you can effortlessly modify the font size, font type, and shapes according to your needs. This PPT slide can be easily reached in standard screen and widescreen aspect ratios. The set is also available in various formats like PDF, PNG, and JPG. So download and use it multiple times as per your knowledge.
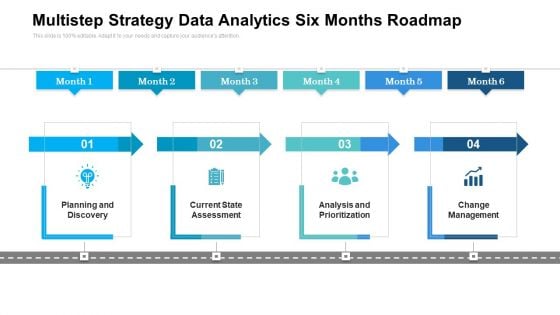
Multistep Strategy Data Analytics Six Months Roadmap Template
Presenting the multistep strategy data analytics six months roadmap template. The template includes a roadmap that can be used to initiate a strategic plan. Not only this, the PowerPoint slideshow is completely editable and you can effortlessly modify the font size, font type, and shapes according to your needs. This PPT slide can be easily reached in standard screen and widescreen aspect ratios. The set is also available in various formats like PDF, PNG, and JPG. So download and use it multiple times as per your knowledge.
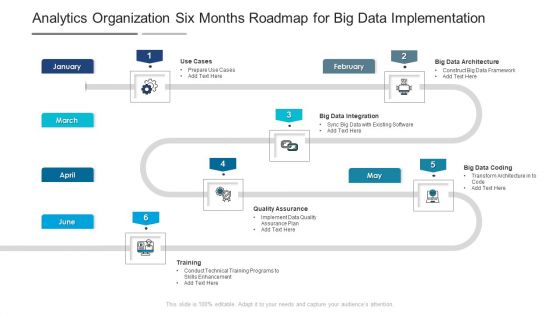
Analytics Organization Six Months Roadmap For Big Data Implementation Inspiration
Presenting the analytics organization six months roadmap for big data implementation inspiration. The template includes a roadmap that can be used to initiate a strategic plan. Not only this, the PowerPoint slideshow is completely editable and you can effortlessly modify the font size, font type, and shapes according to your needs. This PPT slide can be easily reached in standard screen and widescreen aspect ratios. The set is also available in various formats like PDF, PNG, and JPG. So download and use it multiple times as per your knowledge.
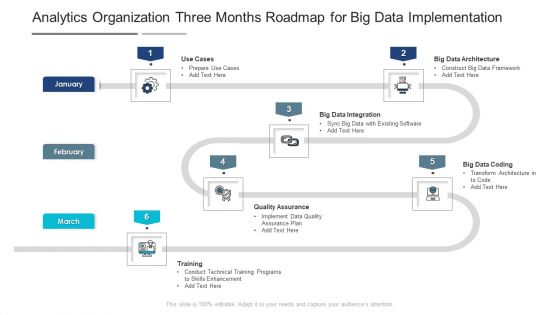
Analytics Organization Three Months Roadmap For Big Data Implementation Demonstration
Presenting our jaw dropping analytics organization three months roadmap for big data implementation demonstration. You can alternate the color, font size, font type, and shapes of this PPT layout according to your strategic process. This PPT presentation is compatible with Google Slides and is available in both standard screen and widescreen aspect ratios. You can also download this well researched PowerPoint template design in different formats like PDF, JPG, and PNG. So utilize this visually appealing design by clicking the download button given below.
Consumer Data Analytics Ppt PowerPoint Presentation Complete Deck With Slides
This Consumer Data Analytics Ppt PowerPoint Presentation Complete Deck With Slides acts as backup support for your ideas, vision, thoughts, etc. Use it to present a thorough understanding of the topic. This PPT slideshow can be utilized for both in-house and outside presentations depending upon your needs and business demands. Entailing twelve slides with a consistent design and theme, this template will make a solid use case. As it is intuitively designed, it suits every business vertical and industry. All you have to do is make a few tweaks in the content or any other component to design unique presentations. The biggest advantage of this complete deck is that it can be personalized multiple times once downloaded. The color, design, shapes, and other elements are free to modify to add personal touches. You can also insert your logo design in this PPT layout. Therefore a well-thought and crafted presentation can be delivered with ease and precision by downloading this Consumer Data Analytics Ppt PowerPoint Presentation Complete Deck With Slides PPT slideshow.
Data Requirements For Analytics Ppt PowerPoint Presentation Complete With Slides
If designing a presentation takes a lot of your time and resources and you are looking for a better alternative, then this data requirements for analytics ppt powerpoint presentation complete with slides is the right fit for you. This is a prefabricated set that can help you deliver a great presentation on the topic. All the thirty slides included in this sample template can be used to present a birds-eye view of the topic. These slides are also fully editable, giving you enough freedom to add specific details to make this layout more suited to your business setting. Apart from the content, all other elements like color, design, theme are also replaceable and editable. This helps in designing a variety of presentations with a single layout. Not only this, you can use this PPT design in formats like PDF, PNG, and JPG once downloaded. Therefore, without any further ado, download and utilize this sample presentation as per your liking.
Healthcare Data Analytics Ppt PowerPoint Presentation Complete Deck With Slides
If designing a presentation takes a lot of your time and resources and you are looking for a better alternative, then this Healthcare Data Analytics Ppt PowerPoint Presentation Complete Deck With Slides is the right fit for you. This is a prefabricated set that can help you deliver a great presentation on the topic. All the Seventeen slides included in this sample template can be used to present a birds eye view of the topic. These slides are also fully editable, giving you enough freedom to add specific details to make this layout more suited to your business setting. Apart from the content, all other elements like color, design, theme are also replaceable and editable. This helps in designing a variety of presentations with a single layout. Not only this, you can use this PPT design in formats like PDF, PNG, and JPG once downloaded. Therefore, without any further ado, download and utilize this sample presentation as per your liking.
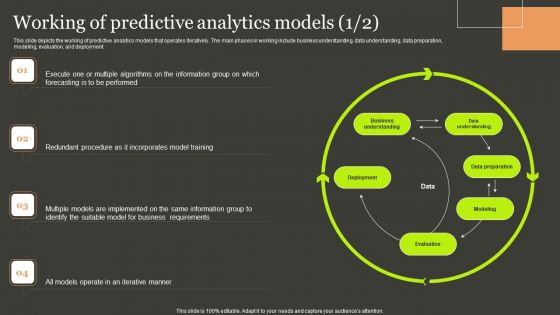
Predictive Analytics Methods Working Of Predictive Analytics Models Summary PDF
This slide depicts the working of predictive analytics models that operates iteratively. The main phases in working include business understanding, data understanding, data preparation, modeling, evaluation, and deployment. Find highly impressive Predictive Analytics Methods Working Of Predictive Analytics Models Summary PDF on Slidegeeks to deliver a meaningful presentation. You can save an ample amount of time using these presentation templates. No need to worry to prepare everything from scratch because Slidegeeks experts have already done a huge research and work for you. You need to download Predictive Analytics Methods Working Of Predictive Analytics Models Summary PDF for your upcoming presentation. All the presentation templates are 100 percent editable and you can change the color and personalize the content accordingly. Download now.
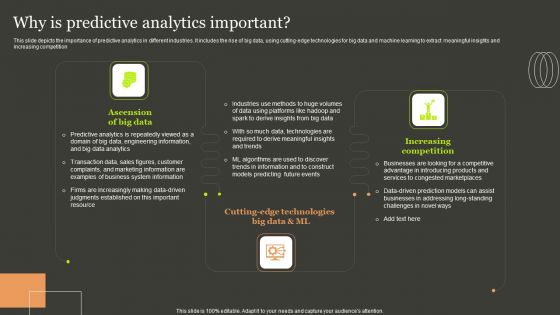
Predictive Analytics Methods Why Is Predictive Analytics Important Ideas PDF
This slide depicts the importance of predictive analytics in different industries. It includes the rise of big data, using cutting-edge technologies for big data and machine learning to extract meaningful insights and increasing competition. Whether you have daily or monthly meetings, a brilliant presentation is necessary. Predictive Analytics Methods Why Is Predictive Analytics Important Ideas PDF can be your best option for delivering a presentation. Represent everything in detail using Predictive Analytics Methods Why Is Predictive Analytics Important Ideas PDF and make yourself stand out in meetings. The template is versatile and follows a structure that will cater to your requirements. All the templates prepared by Slidegeeks are easy to download and edit. Our research experts have taken care of the corporate themes as well. So, give it a try and see the results.
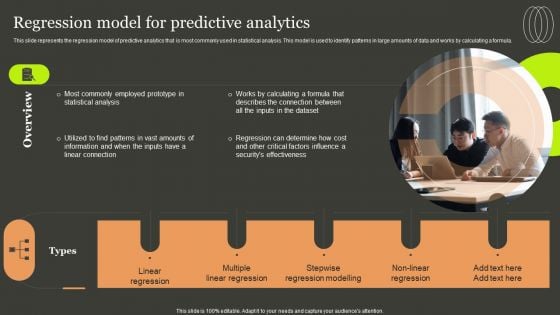
Predictive Analytics Methods Regression Model For Predictive Analytics Template PDF
This slide represents the regression model of predictive analytics that is most commonly used in statistical analysis. This model is used to identify patterns in large amounts of data and works by calculating a formula. Retrieve professionally designed Predictive Analytics Methods Regression Model For Predictive Analytics Template PDF to effectively convey your message and captivate your listeners. Save time by selecting pre made slideshows that are appropriate for various topics, from business to educational purposes. These themes come in many different styles, from creative to corporate, and all of them are easily adjustable and can be edited quickly. Access them as PowerPoint templates or as Google Slides themes. You do not have to go on a hunt for the perfect presentation because Slidegeeks got you covered from everywhere.
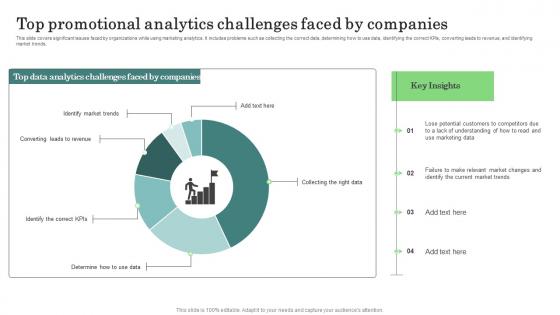
Major Promotional Analytics Future Trends Top Promotional Analytics Ideas Pdf
This slide covers significant issues faced by organizations while using marketing analytics. It includes problems such as collecting the correct data, determining how to use data, identifying the correct KPIs, converting leads to revenue, and identifying market trends. qSlidegeeks has constructed Major Promotional Analytics Future Trends Top Promotional Analytics Ideas Pdf after conducting extensive research and examination. These presentation templates are constantly being generated and modified based on user preferences and critiques from editors. Here, you will find the most attractive templates for a range of purposes while taking into account ratings and remarks from users regarding the content. This is an excellent jumping off point to explore our content and will give new users an insight into our top notch PowerPoint Templates. This slide covers significant issues faced by organizations while using marketing analytics. It includes problems such as collecting the correct data, determining how to use data, identifying the correct KPIs, converting leads to revenue, and identifying market trends.
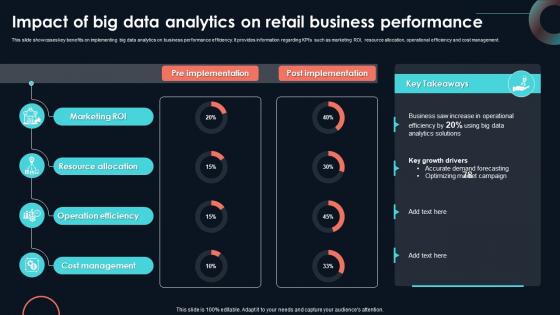
Impact Of Big Data Analytics On Retail Business Developing Strategic Insights Using Big Data Analytics SS V
This slide showcases key benefits on implementing big data analytics on business performance efficiency. It provides information regarding KPIs such as marketing ROI, resource allocation, operational efficiency and cost management. Do you know about Slidesgeeks Impact Of Big Data Analytics On Retail Business Developing Strategic Insights Using Big Data Analytics SS V These are perfect for delivering any kind od presentation. Using it, create PowerPoint presentations that communicate your ideas and engage audiences. Save time and effort by using our pre-designed presentation templates that are perfect for a wide range of topic. Our vast selection of designs covers a range of styles, from creative to business, and are all highly customizable and easy to edit. Download as a PowerPoint template or use them as Google Slides themes. This slide showcases key benefits on implementing big data analytics on business performance efficiency. It provides information regarding KPIs such as marketing ROI, resource allocation, operational efficiency and cost management.
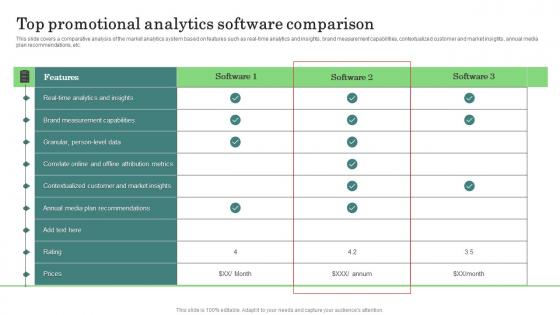
Top Promotional Analytics Major Promotional Analytics Future Trends Diagrams Pdf
This slide covers a comparative analysis of the market analytics system based on features such as real time analytics and insights, brand measurement capabilities, contextualized customer and market insights, annual media plan recommendations, etc. Do you know about Slidesgeeks Top Promotional Analytics Major Promotional Analytics Future Trends Diagrams Pdf These are perfect for delivering any kind od presentation. Using it, create PowerPoint presentations that communicate your ideas and engage audiences. Save time and effort by using our pre designed presentation templates that are perfect for a wide range of topic. Our vast selection of designs covers a range of styles, from creative to business, and are all highly customizable and easy to edit. Download as a PowerPoint template or use them as Google Slides themes. This slide covers a comparative analysis of the market analytics system based on features such as real time analytics and insights, brand measurement capabilities, contextualized customer and market insights, annual media plan recommendations, etc.
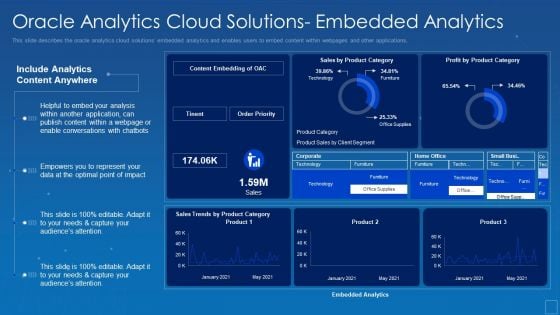
Oracle Analytics Cloud Solutions Embedded Analytics Elements PDF
This slide describes the oracle analytics cloud solutions embedded analytics and enables users to embed content within webpages and other applications. Deliver an awe inspiring pitch with this creative oracle analytics cloud solutions embedded analytics elements pdf bundle. Topics like application, conversations, optimal, empowers, analytics can be discussed with this completely editable template. It is available for immediate download depending on the needs and requirements of the user.
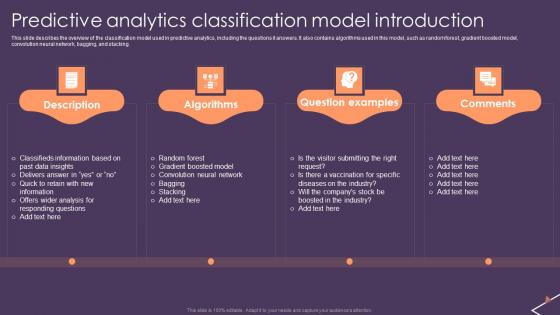
Predictive Analytics For Empowering Predictive Analytics Classification Model Information Pdf
This slide describes the overview of the classification model used in predictive analytics, including the questions it answers. It also contains algorithms used in this model, such as random forest, gradient boosted model, convolution neural network, bagging, and stacking. If you are looking for a format to display your unique thoughts, then the professionally designed Predictive Analytics For Empowering Predictive Analytics Classification Model Information Pdf is the one for you. You can use it as a Google Slides template or a PowerPoint template. Incorporate impressive visuals, symbols, images, and other charts. Modify or reorganize the text boxes as you desire. Experiment with shade schemes and font pairings. Alter, share or cooperate with other people on your work. Download Predictive Analytics For Empowering Predictive Analytics Classification Model Information Pdf and find out how to give a successful presentation. Present a perfect display to your team and make your presentation unforgettable. This slide describes the overview of the classification model used in predictive analytics, including the questions it answers. It also contains algorithms used in this model, such as random forest, gradient boosted model, convolution neural network, bagging, and stacking.
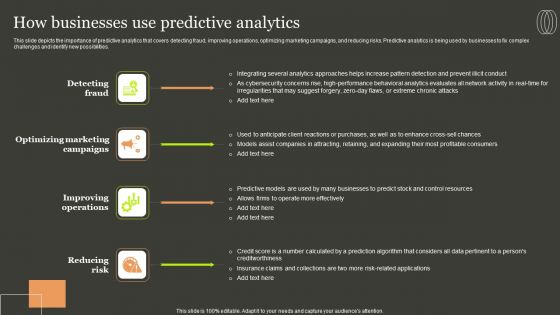
Predictive Analytics Methods How Businesses Use Predictive Analytics Background PDF
This slide depicts the importance of predictive analytics that covers detecting fraud, improving operations, optimizing marketing campaigns, and reducing risks. Predictive analytics is being used by businesses to fix complex challenges and identify new possibilities. Do you know about Slidesgeeks Predictive Analytics Methods How Businesses Use Predictive Analytics Background PDF These are perfect for delivering any kind od presentation. Using it, create PowerPoint presentations that communicate your ideas and engage audiences. Save time and effort by using our pre designed presentation templates that are perfect for a wide range of topic. Our vast selection of designs covers a range of styles, from creative to business, and are all highly customizable and easy to edit. Download as a PowerPoint template or use them as Google Slides themes.
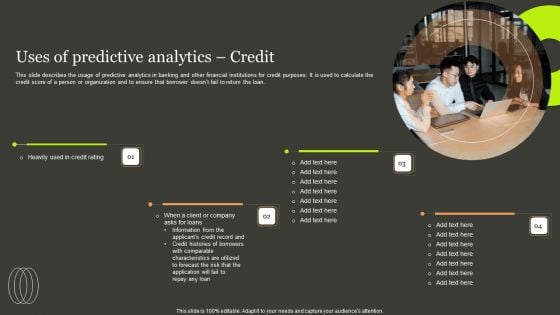
Predictive Analytics Methods Uses Of Predictive Analytics Credit Diagrams PDF
This slide describes the usage of predictive analytics in banking and other financial institutions for credit purposes. It is used to calculate the credit score of a person or organization and to ensure that borrower doesnt fail to return the loan. Slidegeeks is here to make your presentations a breeze with Predictive Analytics Methods Uses Of Predictive Analytics Credit Diagrams PDF With our easy to use and customizable templates, you can focus on delivering your ideas rather than worrying about formatting. With a variety of designs to choose from, you are sure to find one that suits your needs. And with animations and unique photos, illustrations, and fonts, you can make your presentation pop. So whether you are giving a sales pitch or presenting to the board, make sure to check out Slidegeeks first.
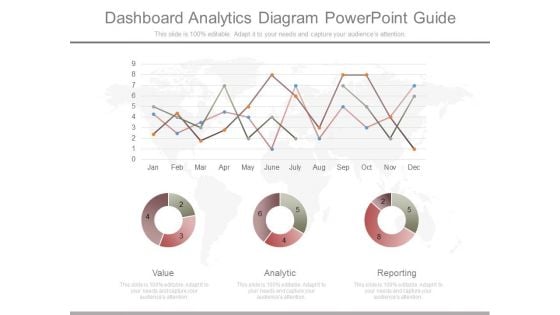
Dashboard Analytics Diagram Powerpoint Guide
This is a dashboard analytics diagram powerpoint guide. This is a three stage process. The stages in this process are value, analytic, reporting.
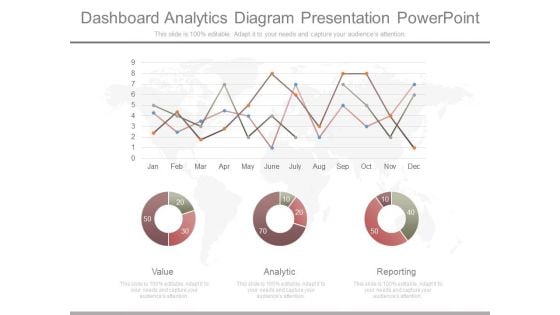
Dashboard Analytics Diagram Presentation Powerpoint
This is a dashboard analytics diagram presentation powerpoint. This is a three stage process. The stages in this process are value, analytic, reporting.
Working Capital Analytics Template PDF
Presenting Working Capital Analytics Template PDF to dispense important information. This template comprises two stages. It also presents valuable insights into the topics including Working Capital Analytics This is a completely customizable PowerPoint theme that can be put to use immediately. So, download it and address the topic impactfully.
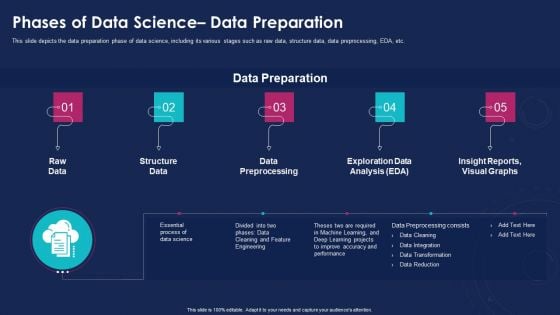
Data Analytics IT Phases Of Data Science Data Preparation Ppt Professional Example Topics PDF
This slide depicts the data preparation phase of data science, including its various stages such as raw data, structure data, data preprocessing, EDA, etc. This is a data analytics it phases of data science data preparation ppt professional example topics pdf template with various stages. Focus and dispense information on five stages using this creative set, that comes with editable features. It contains large content boxes to add your information on topics like raw data, structure data, data preprocessing, exploration data analysis, insight reports, visual graphs. You can also showcase facts, figures, and other relevant content using this PPT layout. Grab it now.
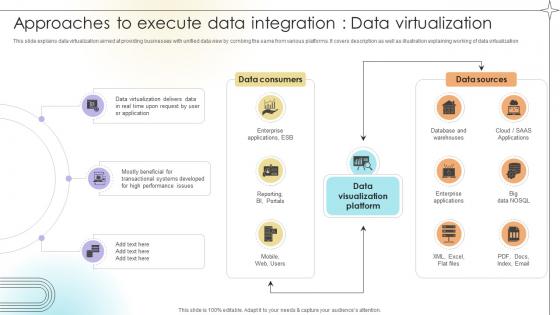
Approaches To Execute Data Integration Data Virtualization Data Analytics SS V
This slide explains data virtualization aimed at providing businesses with unified data view by combing the same from various platforms. It covers description as well as illustration explaining working of data virtualization.If you are looking for a format to display your unique thoughts, then the professionally designed Approaches To Execute Data Integration Data Virtualization Data Analytics SS V is the one for you. You can use it as a Google Slides template or a PowerPoint template. Incorporate impressive visuals, symbols, images, and other charts. Modify or reorganize the text boxes as you desire. Experiment with shade schemes and font pairings. Alter, share or cooperate with other people on your work. Download Approaches To Execute Data Integration Data Virtualization Data Analytics SS V and find out how to give a successful presentation. Present a perfect display to your team and make your presentation unforgettable. This slide explains data virtualization aimed at providing businesses with unified data view by combing the same from various platforms. It covers description as well as illustration explaining working of data virtualization.
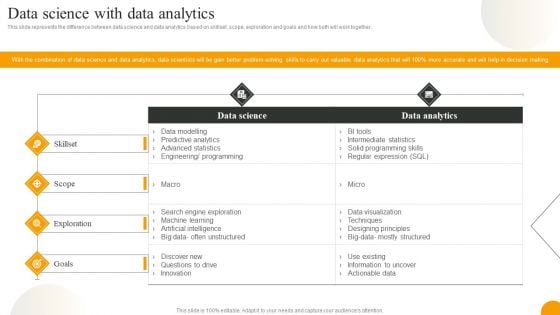
Using Data Science Technologies For Business Transformation Data Science With Data Analytics Formats PDF
This slide represents the difference between data science and data analytics based on skillset, scope, exploration and goals and how both will work together. Do you know about Slidesgeeks Using Data Science Technologies For Business Transformation Data Science With Data Analytics Formats PDF These are perfect for delivering any kind od presentation. Using it, create PowerPoint presentations that communicate your ideas and engage audiences. Save time and effort by using our pre designed presentation templates that are perfect for a wide range of topic. Our vast selection of designs covers a range of styles, from creative to business, and are all highly customizable and easy to edit. Download as a PowerPoint template or use them as Google Slides themes.
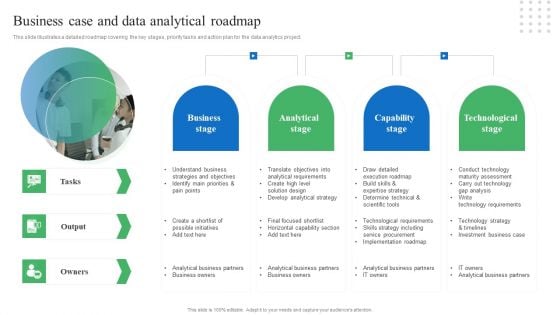
Toolkit For Data Science And Analytics Transition Business Case And Data Analytical Roadmap Professional PDF
This slide illustrates a detailed roadmap covering the key stages, priority tasks and action plan for the data analytics project. Do you know about Slidesgeeks Toolkit For Data Science And Analytics Transition Business Case And Data Analytical Roadmap Professional PDF These are perfect for delivering any kind od presentation. Using it, create PowerPoint presentations that communicate your ideas and engage audiences. Save time and effort by using our pre designed presentation templates that are perfect for a wide range of topic. Our vast selection of designs covers a range of styles, from creative to business, and are all highly customizable and easy to edit. Download as a PowerPoint template or use them as Google Slides themes.
Business Data Analysis Icons Slide Icons PDF
Help your business to create an attention grabbing presentation using our business data analysis icons slide icons pdf set of slides. The slide contains innovative icons that can be flexibly edited. Choose this business data analysis icons slide icons pdf template to create a satisfactory experience for your customers. Go ahead and click the download button.
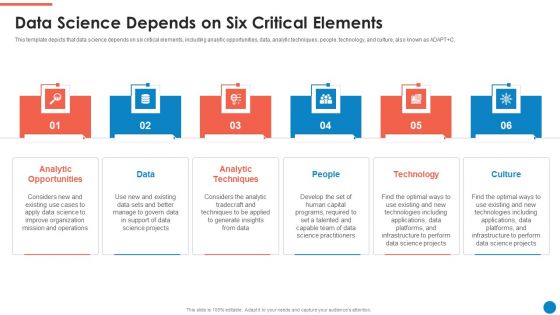
Data And Analytics Playbook Data Science Depends On Six Critical Elements Inspiration PDF
This template depicts that data science depends on six critical elements, including analytic opportunities, data, analytic techniques, people, technology, and culture, also known as ADAPTC. This is a Data And Analytics Playbook Data Science Depends On Six Critical Elements Inspiration PDF template with various stages. Focus and dispense information on six stages using this creative set, that comes with editable features. It contains large content boxes to add your information on topics like Analytic Opportunities, Data, Analytic Techniques, People, Technology, Culture. You can also showcase facts, figures, and other relevant content using this PPT layout. Grab it now.
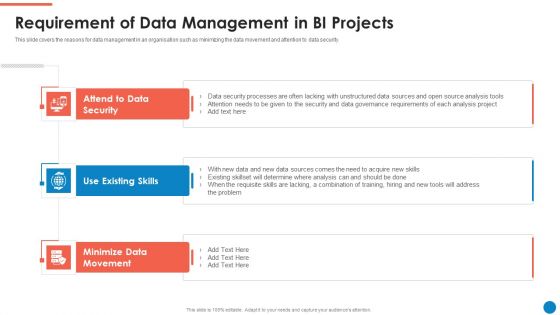
Data And Analytics Playbook Requirement Of Data Management In BI Projects Introduction PDF
This slide covers the reasons for data management in an organisation such as minimizing the data movement and attention to data security. This is a Data And Analytics Playbook Requirement Of Data Management In BI Projects Introduction PDF template with various stages. Focus and dispense information on three stages using this creative set, that comes with editable features. It contains large content boxes to add your information on topics like Attend To Data Security, Use Existing Skills, Minimize Data Movement. You can also showcase facts, figures, and other relevant content using this PPT layout. Grab it now.

Data Evaluation And Processing Toolkit Key Phases Of Data Analytics Project Professional PDF
The slide explains the key phases of data analytics management. It includes multiple functions like data integration, data governance and repository management to accomplish data analytical results. Boost your pitch with our creative Data Evaluation And Processing Toolkit Key Phases Of Data Analytics Project Professional PDF. Deliver an awe-inspiring pitch that will mesmerize everyone. Using these presentation templates you will surely catch everyones attention. You can browse the ppts collection on our website. We have researchers who are experts at creating the right content for the templates. So you dont have to invest time in any additional work. Just grab the template now and use them.
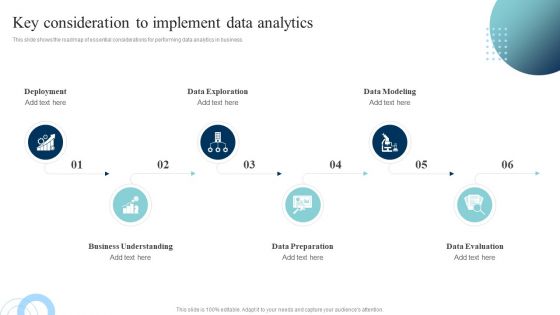
Data Evaluation And Processing Toolkit Key Consideration To Implement Data Analytics Graphics PDF
This slide shows the roadmap of essential considerations for performing data analytics in business. Find a pre-designed and impeccable Data Evaluation And Processing Toolkit Key Consideration To Implement Data Analytics Graphics PDF. The templates can ace your presentation without additional effort. You can download these easy-to-edit presentation templates to make your presentation stand out from others. So, what are you waiting for Download the template from Slidegeeks today and give a unique touch to your presentation.
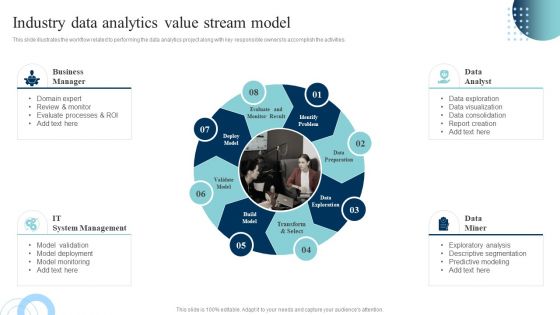
Data Evaluation And Processing Toolkit Industry Data Analytics Value Stream Model Clipart PDF
This slide illustrates the workflow related to performing the data analytics project along with key responsible owners to accomplish the activities. The Data Evaluation And Processing Toolkit Industry Data Analytics Value Stream Model Clipart PDF is a compilation of the most recent design trends as a series of slides. It is suitable for any subject or industry presentation, containing attractive visuals and photo spots for businesses to clearly express their messages. This template contains a variety of slides for the user to input data, such as structures to contrast two elements, bullet points, and slides for written information. Slidegeeks is prepared to create an impression.
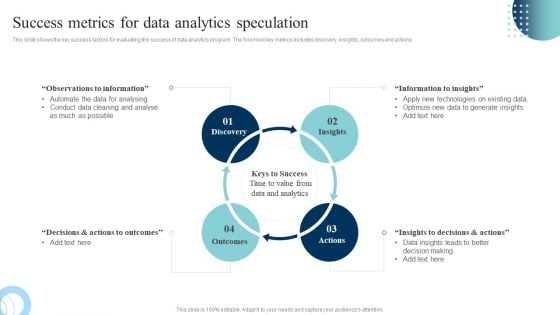
Data Evaluation And Processing Toolkit Success Metrics For Data Analytics Speculation Portrait PDF
This slide shows the key success factors for evaluating the success of data analytics program. The foremost key metrics includes discovery, insights, outcomes and actions. Crafting an eye-catching presentation has never been more straightforward. Let your presentation shine with this tasteful yet straightforward Data Evaluation And Processing Toolkit Success Metrics For Data Analytics Speculation Portrait PDF template. It offers a minimalistic and classy look that is great for making a statement. The colors have been employed intelligently to add a bit of playfulness while still remaining professional. Construct the ideal Data Evaluation And Processing Toolkit Success Metrics For Data Analytics Speculation Portrait PDF that effortlessly grabs the attention of your audience Begin now and be certain to wow your customers.
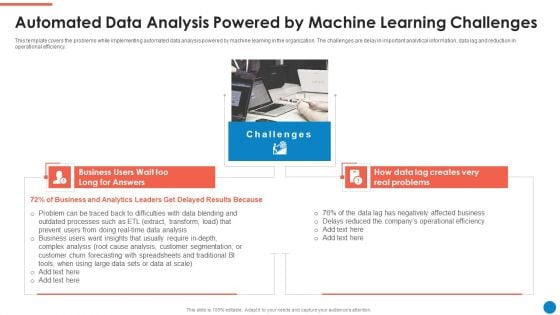
Data And Analytics Playbook Automated Data Analysis Powered By Machine Themes PDF
This template covers the problems while implementing automated data analysis powered by machine learning in the organization. The challenges are delay in important analytical information, data lag and reduction in operational efficiency. Presenting Data And Analytics Playbook Automated Data Analysis Powered By Machine Themes PDF to provide visual cues and insights. Share and navigate important information on two stages that need your due attention. This template can be used to pitch topics like Challenges, Data Lag Creates, Real Problems, Business Users. In addtion, this PPT design contains high resolution images, graphics, etc, that are easily editable and available for immediate download.
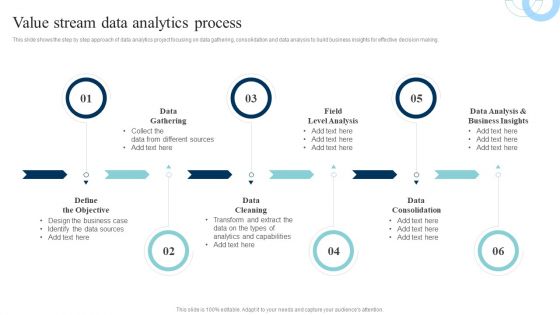
Data Evaluation And Processing Toolkit Value Stream Data Analytics Process Demonstration PDF
This slide shows the step by step approach of data analytics project focusing on data gathering, consolidation and data analysis to build business insights for effective decision making. Coming up with a presentation necessitates that the majority of the effort goes into the content and the message you intend to convey. The visuals of a PowerPoint presentation can only be effective if it supplements and supports the story that is being told. Keeping this in mind our experts created Data Evaluation And Processing Toolkit Value Stream Data Analytics Process Demonstration PDF to reduce the time that goes into designing the presentation. This way, you can concentrate on the message while our designers take care of providing you with the right template for the situation.
Visual Analytics Vector Icon Ppt PowerPoint Presentation Visual Aids Show
Presenting this set of slides with name visual analytics vector icon ppt powerpoint presentation visual aids show. This is a three stage process. The stages in this process are data visualization icon, research analysis, business focus. This is a completely editable PowerPoint presentation and is available for immediate download. Download now and impress your audience.
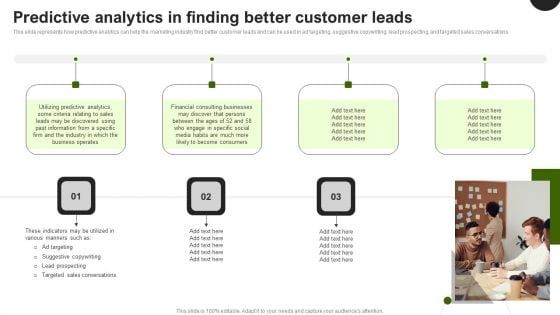
Predictive Analytics In The Age Of Big Data Predictive Analytics In Finding Better Customer Leads Diagrams PDF
This slide represents how predictive analytics can help the marketing industry find better customer leads and can be used in ad targeting, suggestive copywriting, lead prospecting, and targeted sales conversations. Welcome to our selection of the Predictive Analytics In The Age Of Big Data Predictive Analytics In Finding Better Customer Leads Diagrams PDF. These are designed to help you showcase your creativity and bring your sphere to life. Planning and Innovation are essential for any business that is just starting out. This collection contains the designs that you need for your everyday presentations. All of our PowerPoints are 100 percent editable, so you can customize them to suit your needs. This multi purpose template can be used in various situations. Grab these presentation templates today.
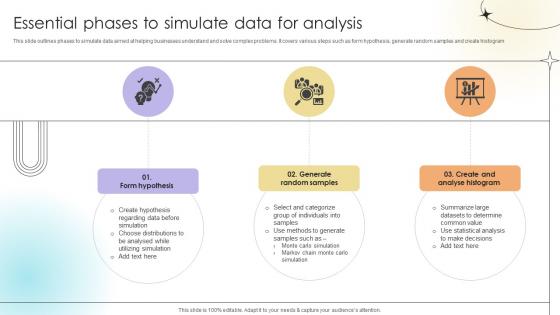
Essential Phases To Simulate Data For Analysis Data Analytics SS V
This slide outlines phases to simulate data aimed at helping businesses understand and solve complex problems. It covers various steps such as form hypothesis, generate random samples and create histogram.Here you can discover an assortment of the finest PowerPoint and Google Slides templates. With these templates, you can create presentations for a variety of purposes while simultaneously providing your audience with an eye-catching visual experience. Download Essential Phases To Simulate Data For Analysis Data Analytics SS V to deliver an impeccable presentation. These templates will make your job of preparing presentations much quicker, yet still, maintain a high level of quality. Slidegeeks has experienced researchers who prepare these templates and write high-quality content for you. Later on, you can personalize the content by editing the Essential Phases To Simulate Data For Analysis Data Analytics SS V. This slide outlines phases to simulate data aimed at helping businesses understand and solve complex problems. It covers various steps such as form hypothesis, generate random samples and create histogram.
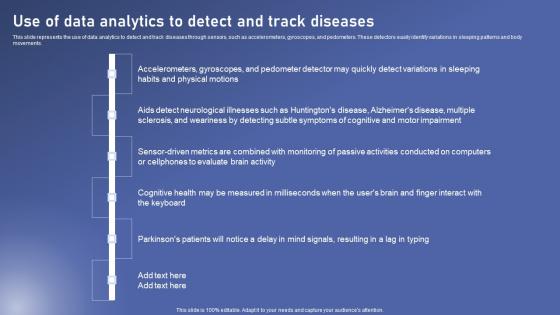
Use Of Data Analytics Detect Biomedical Data Science And Health Informatics Clipart Pdf
This slide represents the use of data analytics to detect and track diseases through sensors, such as accelerometers, gyroscopes, and pedometers. These detectors easily identify variations in sleeping patterns and body movements. Whether you have daily or monthly meetings, a brilliant presentation is necessary. Use Of Data Analytics Detect Biomedical Data Science And Health Informatics Clipart Pdf can be your best option for delivering a presentation. Represent everything in detail using Use Of Data Analytics Detect Biomedical Data Science And Health Informatics Clipart Pdf and make yourself stand out in meetings. The template is versatile and follows a structure that will cater to your requirements. All the templates prepared by Slidegeeks are easy to download and edit. Our research experts have taken care of the corporate themes as well. So, give it a try and see the results. This slide represents the use of data analytics to detect and track diseases through sensors, such as accelerometers, gyroscopes, and pedometers. These detectors easily identify variations in sleeping patterns and body movements.
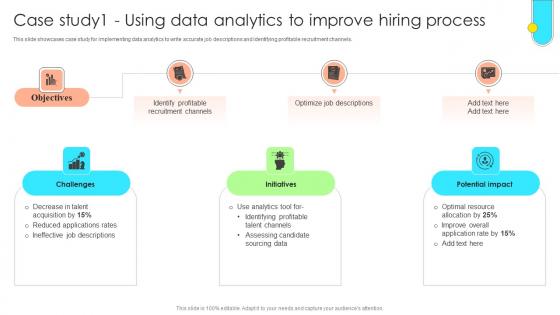
Data Driven Approach To Optimise Case Study1 Using Data Analytics To Improve CRP SS V
This slide showcases case study for implementing data analytics to write accurate job descriptions and identifying profitable recruitment channels. Whether you have daily or monthly meetings, a brilliant presentation is necessary. Data Driven Approach To Optimise Case Study1 Using Data Analytics To Improve CRP SS V can be your best option for delivering a presentation. Represent everything in detail using Data Driven Approach To Optimise Case Study1 Using Data Analytics To Improve CRP SS V and make yourself stand out in meetings. The template is versatile and follows a structure that will cater to your requirements. All the templates prepared by Slidegeeks are easy to download and edit. Our research experts have taken care of the corporate themes as well. So, give it a try and see the results. This slide showcases case study for implementing data analytics to write accurate job descriptions and identifying profitable recruitment channels.
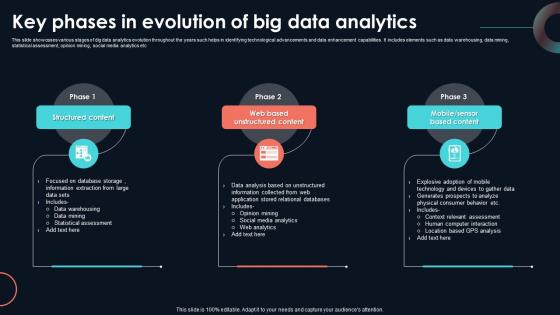
Key Phases In Evolution Of Big Data Developing Strategic Insights Using Big Data Analytics SS V
This slide showcases various stages of dig data analytics evolution throughout the years such helps in identifying technological advancements and data enhancement capabilities. It includes elements such as data warehousing, data mining, statistical assessment, opinion mining, social media analytics etc. Find highly impressive Key Phases In Evolution Of Big Data Developing Strategic Insights Using Big Data Analytics SS V on Slidegeeks to deliver a meaningful presentation. You can save an ample amount of time using these presentation templates. No need to worry to prepare everything from scratch because Slidegeeks experts have already done a huge research and work for you. You need to download Key Phases In Evolution Of Big Data Developing Strategic Insights Using Big Data Analytics SS V for your upcoming presentation. All the presentation templates are 100 percent editable and you can change the color and personalize the content accordingly. Download now This slide showcases various stages of dig data analytics evolution throughout the years such helps in identifying technological advancements and data enhancement capabilities. It includes elements such as data warehousing, data mining, statistical assessment, opinion mining, social media analytics etc.
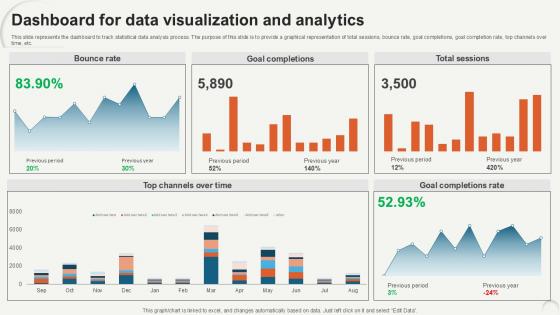
Dashboard For Data Visualization Data Analytics For Informed Decision Ppt Sample
This slide represents the dashboard to track statistical data analysis process. The purpose of this slide is to provide a graphical representation of total sessions, bounce rate, goal completions, goal completion rate, top channels over time, etc. Do you have an important presentation coming up Are you looking for something that will make your presentation stand out from the rest Look no further than Dashboard For Data Visualization Data Analytics For Informed Decision Ppt Sample. With our professional designs, you can trust that your presentation will pop and make delivering it a smooth process. And with Slidegeeks, you can trust that your presentation will be unique and memorable. So why wait Grab Dashboard For Data Visualization Data Analytics For Informed Decision Ppt Sample today and make your presentation stand out from the rest This slide represents the dashboard to track statistical data analysis process. The purpose of this slide is to provide a graphical representation of total sessions, bounce rate, goal completions, goal completion rate, top channels over time, etc.

Steps To Develop Data Driven Insights Using Developing Strategic Insights Using Big Data Analytics SS V
This slide showcases steps involved in using descriptive analytics to create valuable business insights. It provides information regarding data collection, preparation, analysis and visualization. Are you searching for a Steps To Develop Data Driven Insights Using Developing Strategic Insights Using Big Data Analytics SS V that is uncluttered, straightforward, and original Its easy to edit, and you can change the colors to suit your personal or business branding. For a presentation that expresses how much effort you have put in, this template is ideal With all of its features, including tables, diagrams, statistics, and lists, its perfect for a business plan presentation. Make your ideas more appealing with these professional slides. Download Steps To Develop Data Driven Insights Using Developing Strategic Insights Using Big Data Analytics SS V from Slidegeeks today. This slide showcases steps involved in using descriptive analytics to create valuable business insights. It provides information regarding data collection, preparation, analysis and visualization.
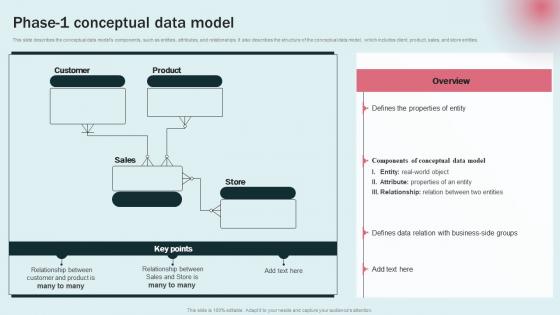
Phase 1 Conceptual Data Model Data Modeling Approaches For Modern Analytics Download Pdf
This slide describes the conceptual data models components, such as entities, attributes, and relationships. It also describes the structure of the conceptual data model, which includes client, product, sales, and store entities. This Phase 1 Conceptual Data Model Data Modeling Approaches For Modern Analytics Download Pdf is perfect for any presentation, be it in front of clients or colleagues. It is a versatile and stylish solution for organizing your meetings. The Phase 1 Conceptual Data Model Data Modeling Approaches For Modern Analytics Download Pdf features a modern design for your presentation meetings. The adjustable and customizable slides provide unlimited possibilities for acing up your presentation. Slidegeeks has done all the homework before launching the product for you. So, do not wait, grab the presentation templates today This slide describes the conceptual data models components, such as entities, attributes, and relationships. It also describes the structure of the conceptual data model, which includes client, product, sales, and store entities.
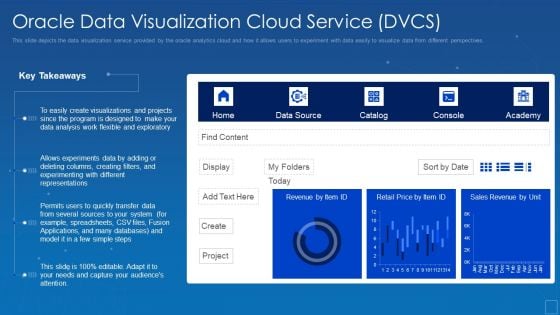
Oracle Cloud Data Analytics Administration IT Oracle Data Visualization Cloud Service DVCS Inspiration PDF
This slide depicts the data visualization service provided by the oracle analytics cloud and how it allows users to experiment with data easily to visualize data from different perspectives. Deliver an awe inspiring pitch with this creative oracle cloud data analytics administration it oracle data visualization cloud service dvcs inspiration pdf bundle. Topics like experiments, representations, sources, visualizations can be discussed with this completely editable template. It is available for immediate download depending on the needs and requirements of the user.
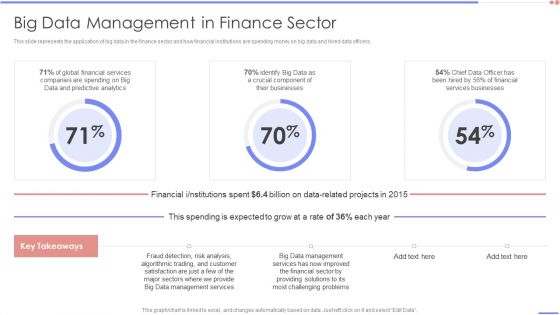
Data Analytics Management Big Data Management In Finance Sector Portrait PDF
This slide represents the application of big data in the finance sector and how financial institutions are spending money on big data and hired data officers.Deliver an awe inspiring pitch with this creative Data Analytics Management Big Data Management In Finance Sector Portrait PDF bundle. Topics like Companies Spending, Predictive Analytics, Services Businesses can be discussed with this completely editable template. It is available for immediate download depending on the needs and requirements of the user.
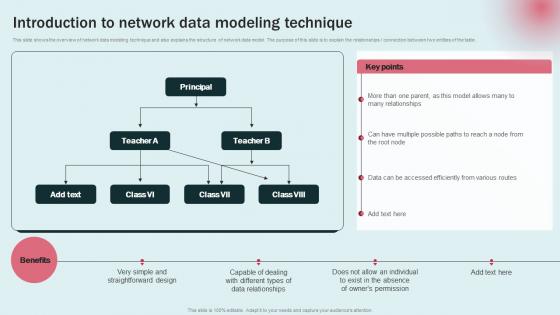
Data Modeling Approaches For Modern Analytics Introduction To Network Data Modeling Graphics Pdf
This slide shows the overview of network data modeling technique and also explains the structure of network data model. The purpose of this slide is to explain the relationships connection between two entities of the table. Slidegeeks is here to make your presentations a breeze with Data Modeling Approaches For Modern Analytics Introduction To Network Data Modeling Graphics Pdf With our easy to use and customizable templates, you can focus on delivering your ideas rather than worrying about formatting. With a variety of designs to choose from, you are sure to find one that suits your needs. And with animations and unique photos, illustrations, and fonts, you can make your presentation pop. So whether you are giving a sales pitch or presenting to the board, make sure to check out Slidegeeks first This slide shows the overview of network data modeling technique and also explains the structure of network data model. The purpose of this slide is to explain the relationships connection between two entities of the table.
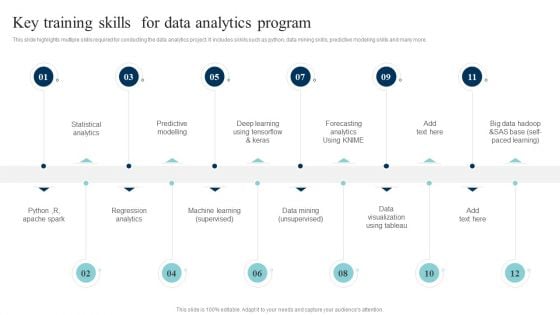
Data Evaluation And Processing Toolkit Key Training Skills For Data Analytics Program Themes PDF
This slide highlights multiple skills required for conducting the data analytics project. It includes skkils such as python, data mining skills, predictive modeling skills and many more. There are so many reasons you need a Data Evaluation And Processing Toolkit Key Training Skills For Data Analytics Program Themes PDF. The first reason is you cant spend time making everything from scratch, Thus, Slidegeeks has made presentation templates for you too. You can easily download these templates from our website easily.
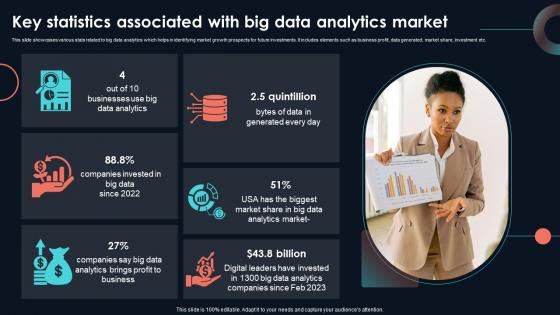
Key Statistics Associated With Big Data Developing Strategic Insights Using Big Data Analytics SS V
This slide showcases various stats related to big data analytics which helps in identifying market growth prospects for future investments. It includes elements such as business profit, data generated, market share, investment etc. If you are looking for a format to display your unique thoughts, then the professionally designed Key Statistics Associated With Big Data Developing Strategic Insights Using Big Data Analytics SS V is the one for you. You can use it as a Google Slides template or a PowerPoint template. Incorporate impressive visuals, symbols, images, and other charts. Modify or reorganize the text boxes as you desire. Experiment with shade schemes and font pairings. Alter, share or cooperate with other people on your work. Download Key Statistics Associated With Big Data Developing Strategic Insights Using Big Data Analytics SS V and find out how to give a successful presentation. Present a perfect display to your team and make your presentation unforgettable. This slide showcases various stats related to big data analytics which helps in identifying market growth prospects for future investments. It includes elements such as business profit, data generated, market share, investment etc.
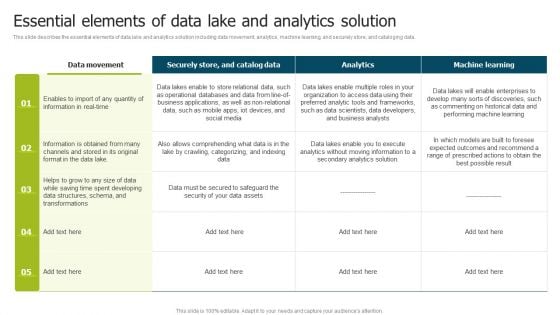
Data Lake Implementation Essential Elements Of Data Lake And Analytics Solution Brochure PDF
This slide describes the essential elements of data lake and analytics solution including data movement, analytics, machine learning, and securely store, and cataloging data. If you are looking for a format to display your unique thoughts, then the professionally designed Data Lake Implementation Essential Elements Of Data Lake And Analytics Solution Brochure PDF is the one for you. You can use it as a Google Slides template or a PowerPoint template. Incorporate impressive visuals, symbols, images, and other charts. Modify or reorganize the text boxes as you desire. Experiment with shade schemes and font pairings. Alter, share or cooperate with other people on your work. Download Data Lake Implementation Essential Elements Of Data Lake And Analytics Solution Brochure PDF and find out how to give a successful presentation. Present a perfect display to your team and make your presentation unforgettable.
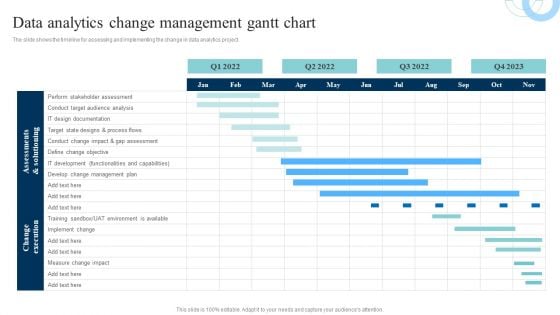
Data Evaluation And Processing Toolkit Data Analytics Change Management Gantt Chart Elements PDF
The slide shows the timeline for assessing and implementing the change in data analytics project. If your project calls for a presentation, then Slidegeeks is your go-to partner because we have professionally designed, easy-to-edit templates that are perfect for any presentation. After downloading, you can easily edit Data Evaluation And Processing Toolkit Data Analytics Change Management Gantt Chart Elements PDF and make the changes accordingly. You can rearrange slides or fill them with different images. Check out all the handy templates.

Big Data Analytics Lifecycle Top Big Data Technology Domains Ppt Show Diagrams PDF
This slide represents the top big data technology domains, such as data storage, mining, analytics, and data visualization. It caters to the big data tools that every domain contains, such as Hadoop, MongoDB, RainStor, Presto, RapidMiner, etc. There are so many reasons you need a Big Data Analytics Lifecycle Top Big Data Technology Domains Ppt Show Diagrams PDF. The first reason is you cant spend time making everything from scratch, Thus, Slidegeeks has made presentation templates for you too. You can easily download these templates from our website easily.
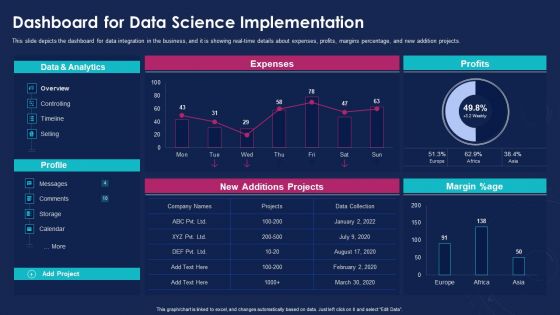
Data Analytics IT Dashboard For Data Science Implementation Ppt Portfolio Pictures PDF
This slide depicts the dashboard for data integration in the business, and it is showing real-time details about expenses, profits, margins percentage, and new addition projects. Deliver and pitch your topic in the best possible manner with this data analytics it dashboard for data science implementation ppt portfolio pictures pdf. Use them to share invaluable insights on data and analytics, margin percentage, profits, expenses, new additions projects and impress your audience. This template can be altered and modified as per your expectations. So, grab it now.
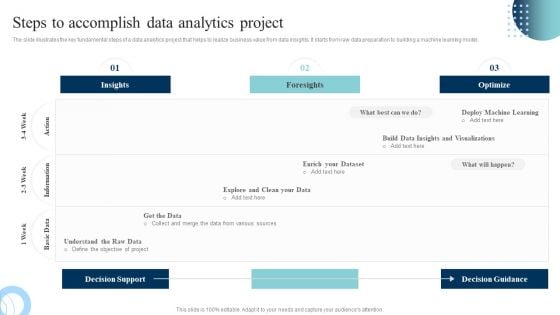
Data Evaluation And Processing Toolkit Steps To Accomplish Data Analytics Project Structure PDF
The slide illustrates the key fundamental steps of a data analytics project that helps to realize business value from data insights. It starts from raw data preparation to building a machine learning model. If you are looking for a format to display your unique thoughts, then the professionally designed Data Evaluation And Processing Toolkit Steps To Accomplish Data Analytics Project Structure PDF is the one for you. You can use it as a Google Slides template or a PowerPoint template. Incorporate impressive visuals, symbols, images, and other charts. Modify or reorganize the text boxes as you desire. Experiment with shade schemes and font pairings. Alter, share or cooperate with other people on your work. Download Data Evaluation And Processing Toolkit Steps To Accomplish Data Analytics Project Structure PDF and find out how to give a successful presentation. Present a perfect display to your team and make your presentation unforgettable.
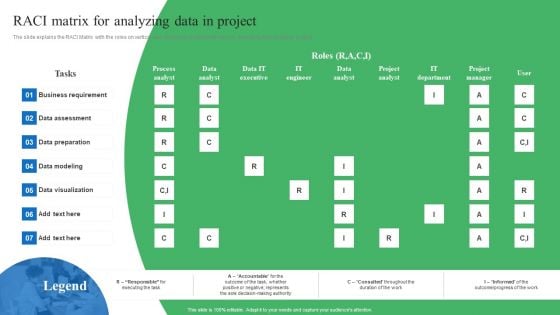
Toolkit For Data Science And Analytics Transition RACI Matrix For Analyzing Data In Project Diagrams PDF
The slide explains the RACI Matrix with the roles on vertical axis and tasks on horizontal axis for executing data analytics project. Explore a selection of the finest Toolkit For Data Science And Analytics Transition RACI Matrix For Analyzing Data In Project Diagrams PDF here. With a plethora of professionally designed and pre made slide templates, you can quickly and easily find the right one for your upcoming presentation. You can use our Toolkit For Data Science And Analytics Transition RACI Matrix For Analyzing Data In Project Diagrams PDF to effectively convey your message to a wider audience. Slidegeeks has done a lot of research before preparing these presentation templates. The content can be personalized and the slides are highly editable. Grab templates today from Slidegeeks.
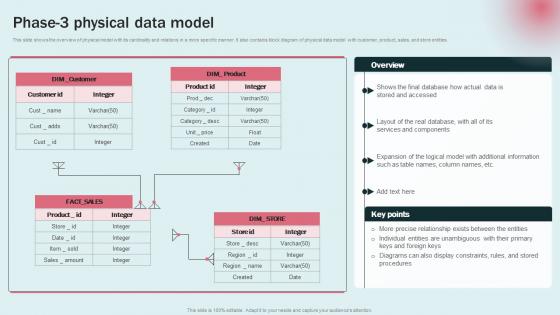
Phase 3 Physical Data Model Data Modeling Approaches For Modern Analytics Pictures Pdf
This slide shows the overview of physical model with its cardinality and relations in a more specific manner. It also contains block diagram of physical data model with customer, product, sales, and store entities. qExplore a selection of the finest Phase 3 Physical Data Model Data Modeling Approaches For Modern Analytics Pictures Pdf here. With a plethora of professionally designed and pre made slide templates, you can quickly and easily find the right one for your upcoming presentation. You can use our Phase 3 Physical Data Model Data Modeling Approaches For Modern Analytics Pictures Pdf to effectively convey your message to a wider audience. Slidegeeks has done a lot of research before preparing these presentation templates. The content can be personalized and the slides are highly editable. Grab templates today from Slidegeeks. This slide shows the overview of physical model with its cardinality and relations in a more specific manner. It also contains block diagram of physical data model with customer, product, sales, and store entities.
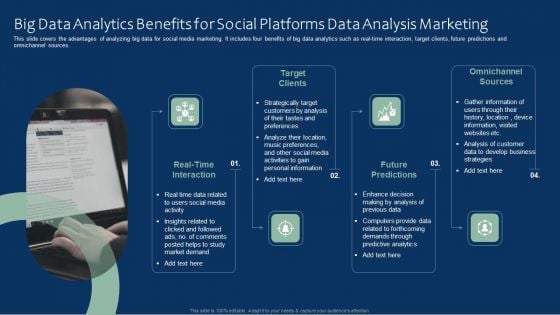
Big Data Analytics Benefits For Social Platforms Data Analysis Marketing Mockup PDF
This slide covers the advantages of analyzing big data for social media marketing. It includes four benefits of big data analytics such as real-time interaction, target clients, future predictions and omnichannel sources. Presenting Big Data Analytics Benefits For Social Platforms Data Analysis Marketing Mockup PDF to dispense important information. This template comprises four stages. It also presents valuable insights into the topics including Target Clients, Future Predictions, Omnichannel Sources. This is a completely customizable PowerPoint theme that can be put to use immediately. So, download it and address the topic impactfully.

Data Evaluation And Processing Toolkit Work Streams For Data Analytics With Its Roles Themes PDF
This slide shows the work streams structure with team head for implementing the data analytics project. Here you can discover an assortment of the finest PowerPoint and Google Slides templates. With these templates, you can create presentations for a variety of purposes while simultaneously providing your audience with an eye-catching visual experience. Download Data Evaluation And Processing Toolkit Work Streams For Data Analytics With Its Roles Themes PDF to deliver an impeccable presentation. These templates will make your job of preparing presentations much quicker, yet still, maintain a high level of quality. Slidegeeks has experienced researchers who prepare these templates and write high-quality content for you. Later on, you can personalize the content by editing the Data Evaluation And Processing Toolkit Work Streams For Data Analytics With Its Roles Themes PDF.
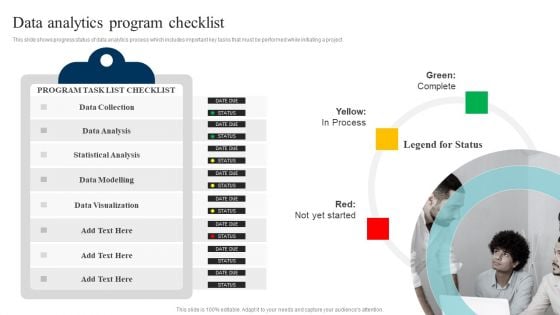
Data Evaluation And Processing Toolkit Data Analytics Program Checklist Inspiration PDF
This slide shows progress status of data analytics process which includes important key tasks that must be performed while initiating a project. If you are looking for a format to display your unique thoughts, then the professionally designed Data Evaluation And Processing Toolkit Data Analytics Program Checklist Inspiration PDF is the one for you. You can use it as a Google Slides template or a PowerPoint template. Incorporate impressive visuals, symbols, images, and other charts. Modify or reorganize the text boxes as you desire. Experiment with shade schemes and font pairings. Alter, share or cooperate with other people on your work. Download Data Evaluation And Processing Toolkit Data Analytics Program Checklist Inspiration PDF and find out how to give a successful presentation. Present a perfect display to your team and make your presentation unforgettable.
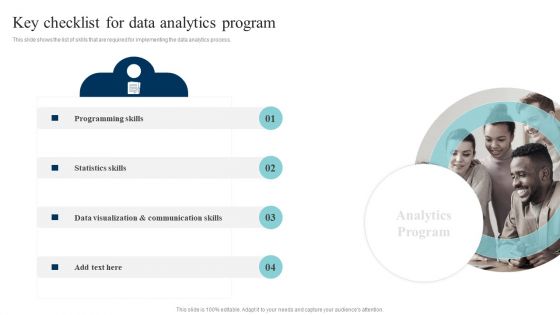
Data Evaluation And Processing Toolkit Key Checklist For Data Analytics Program Sample PDF
This slide shows the list of skills that are required for implementing the data analytics process. Are you searching for a Data Evaluation And Processing Toolkit Key Checklist For Data Analytics Program Sample PDF that is uncluttered, straightforward, and original Its easy to edit, and you can change the colors to suit your personal or business branding. For a presentation that expresses how much effort youve put in, this template is ideal With all of its features, including tables, diagrams, statistics, and lists, its perfect for a business plan presentation. Make your ideas more appealing with these professional slides. Download Data Evaluation And Processing Toolkit Key Checklist For Data Analytics Program Sample PDF from Slidegeeks today.
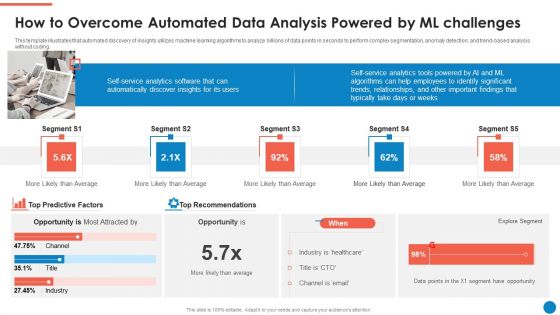
Data And Analytics Playbook How To Overcome Automated Data Analysis Powered By Ml Diagrams PDF
This template illustrates that automated discovery of insights utilizes machine learning algorithms to analyze billions of data points in seconds to perform complex segmentation, anomaly detection, and trend-based analysis without coding. This is a Data And Analytics Playbook How To Overcome Automated Data Analysis Powered By Ml Diagrams PDF template with various stages. Focus and dispense information on one stages using this creative set, that comes with editable features. It contains large content boxes to add your information on topics like Self Service Analytics Software, Top Recommendations, Explore Segment. You can also showcase facts, figures, and other relevant content using this PPT layout. Grab it now.

Data Evaluation And Processing Toolkit Value Stream Information Data Analytics Structure Themes PDF
The slides shows the stages of data analytics with reactive and proactive approach. In includes four steps collection, analysis, predictive and actions. This modern and well-arranged Data Evaluation And Processing Toolkit Value Stream Information Data Analytics Structure Themes PDF provides lots of creative possibilities. It is very simple to customize and edit with the Powerpoint Software. Just drag and drop your pictures into the shapes. All facets of this template can be edited with Powerpoint, no extra software is necessary. Add your own material, put your images in the places assigned for them, adjust the colors, and then you can show your slides to the world, with an animated slide included.
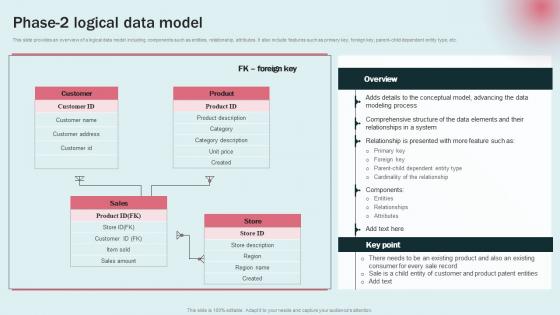
Phase 2 Logical Data Model Data Modeling Approaches For Modern Analytics Elements Pdf
This slide provides an overview of a logical data model including components such as entities, relationship, attributes. It also include features such as primary key, foreign key, parent child dependent entity type, etc. Welcome to our selection of the Phase 2 Logical Data Model Data Modeling Approaches For Modern Analytics Elements Pdf. These are designed to help you showcase your creativity and bring your sphere to life. Planning and Innovation are essential for any business that is just starting out. This collection contains the designs that you need for your everyday presentations. All of our PowerPoints are 100 percent editable, so you can customize them to suit your needs. This multi purpose template can be used in various situations. Grab these presentation templates today This slide provides an overview of a logical data model including components such as entities, relationship, attributes. It also include features such as primary key, foreign key, parent child dependent entity type, etc.
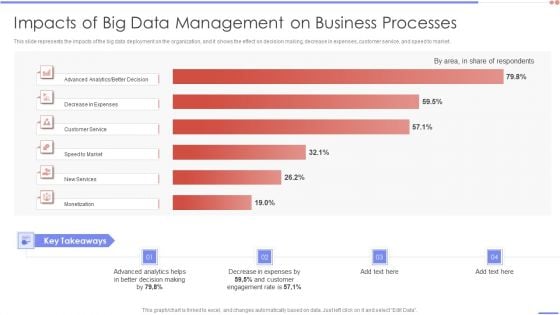
Data Analytics Management Impacts Of Big Data Management On Business Processes Sample PDF
This slide represents the impacts of the big data deployment on the organization, and it shows the effect on decision making, decrease in expenses, customer service, and speed to market.Deliver and pitch your topic in the best possible manner with this Data Analytics Management Impacts Of Big Data Management On Business Processes Sample PDF. Use them to share invaluable insights on Advanced Analytics, Decrease Expenses, Customer Service and impress your audience. This template can be altered and modified as per your expectations. So, grab it now.

Data Evaluation And Processing Toolkit Change Management Data Analytics Process Themes PDF
In this slide, we are tabulating the key processes and activities involved for data management process. It contains information on implementing the change management in data analytic framework. Get a simple yet stunning designed Data Evaluation And Processing Toolkit Change Management Data Analytics Process Themes PDF. It is the best one to establish the tone in your meetings. It is an excellent way to make your presentations highly effective. So, download this PPT today from Slidegeeks and see the positive impacts. Our easy-to-edit Data Evaluation And Processing Toolkit Change Management Data Analytics Process Themes PDF can be your go-to option for all upcoming conferences and meetings. So, what are you waiting for Grab this template today.
Data Model Performance Tracking Data Modeling Approaches For Modern Analytics Formats Pdf
This slide shows the data model performance tracking dashboard. The purpose of this slide is to represent the Information related to the change brought by data models graphically. Present like a pro with Data Model Performance Tracking Data Modeling Approaches For Modern Analytics Formats Pdf Create beautiful presentations together with your team, using our easy to use presentation slides. Share your ideas in real time and make changes on the fly by downloading our templates. So whether you are in the office, on the go, or in a remote location, you can stay in sync with your team and present your ideas with confidence. With Slidegeeks presentation got a whole lot easier. Grab these presentations today. This slide shows the data model performance tracking dashboard. The purpose of this slide is to represent the Information related to the change brought by data models graphically.
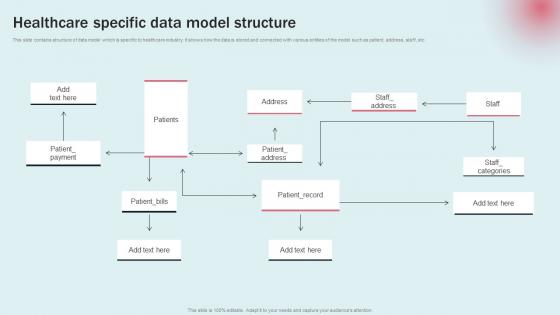
Healthcare Specific Data Model Structure Data Modeling Approaches Modern Analytics Ideas Pdf
This slide contains structure of data model which is specific to healthcare industry. It shows how the data is stored and connected with various entities of the model such as patient, address, staff, etc. If you are looking for a format to display your unique thoughts, then the professionally designed Healthcare Specific Data Model Structure Data Modeling Approaches Modern Analytics Ideas Pdf is the one for you. You can use it as a Google Slides template or a PowerPoint template. Incorporate impressive visuals, symbols, images, and other charts. Modify or reorganize the text boxes as you desire. Experiment with shade schemes and font pairings. Alter, share or cooperate with other people on your work. Download Healthcare Specific Data Model Structure Data Modeling Approaches Modern Analytics Ideas Pdf and find out how to give a successful presentation. Present a perfect display to your team and make your presentation unforgettable. This slide contains structure of data model which is specific to healthcare industry. It shows how the data is stored and connected with various entities of the model such as patient, address, staff, etc.
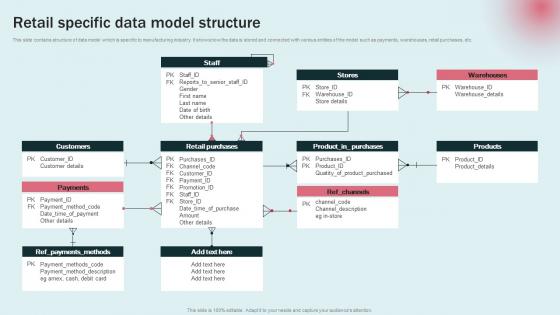
Retail Specific Data Model Structure Data Modeling Approaches For Modern Analytics Rules Pdf
This slide contains structure of data model which is specific to manufacturing industry. It shows how the data is stored and connected with various entities of the model such as payments, warehouses, retail purchases, etc. Are you searching for a Retail Specific Data Model Structure Data Modeling Approaches For Modern Analytics Rules Pdf that is uncluttered, straightforward, and original Its easy to edit, and you can change the colors to suit your personal or business branding. For a presentation that expresses how much effort you have put in, this template is ideal With all of its features, including tables, diagrams, statistics, and lists, its perfect for a business plan presentation. Make your ideas more appealing with these professional slides. Download Retail Specific Data Model Structure Data Modeling Approaches For Modern Analytics Rules Pdf from Slidegeeks today. This slide contains structure of data model which is specific to manufacturing industry. It shows how the data is stored and connected with various entities of the model such as payments, warehouses, retail purchases, etc.
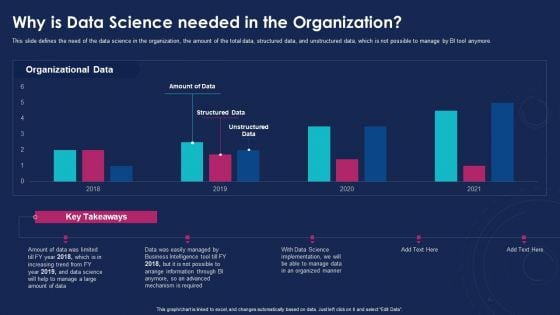
Data Analytics IT Why Is Data Science Needed In The Organization Ppt Inspiration Layout PDF
This slide defines the need of the data science in the organization, the amount of the total data, structured data, and unstructured data, which is not possible to manage by BI tool anymore. Deliver an awe inspiring pitch with this creative data analytics it why is data science needed in the organization ppt inspiration layout pdf bundle. Topics like organized, implementation, business intelligence can be discussed with this completely editable template. It is available for immediate download depending on the needs and requirements of the user.
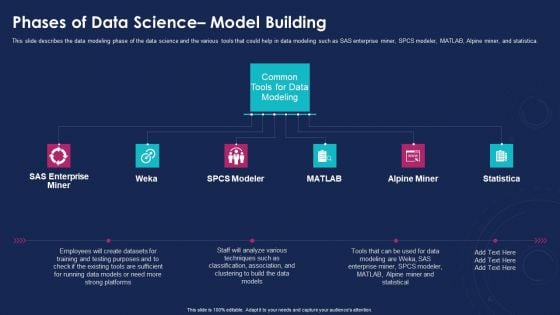
Data Analytics IT Phases Of Data Science Model Building Graphics PDF
This slide describes the data modeling phase of the data science and the various tools that could help in data modeling such as SAS enterprise miner, SPCS modeler, MATLAB, Alpine miner, and statistica. Presenting data analytics it phases of data science model building graphics pdf to provide visual cues and insights. Share and navigate important information on six stages that need your due attention. This template can be used to pitch topics like alpine miner, matlab, spcs modeler, weka, sas enterprise miner. In addtion, this PPT design contains high resolution images, graphics, etc, that are easily editable and available for immediate download.
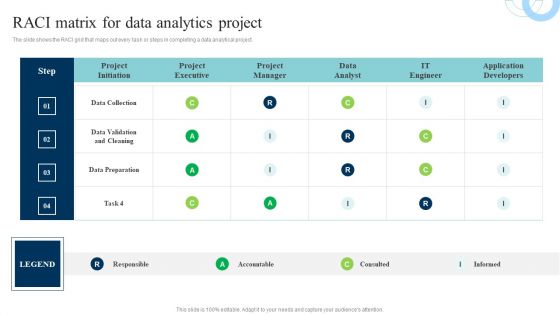
Data Evaluation And Processing Toolkit Raci Matrix For Data Analytics Project Infographics PDF
The slide shows the RACI grid that maps out every task or steps in completing a data analytical project. Whether you have daily or monthly meetings, a brilliant presentation is necessary. Data Evaluation And Processing Toolkit Raci Matrix For Data Analytics Project Infographics PDF can be your best option for delivering a presentation. Represent everything in detail using Data Evaluation And Processing Toolkit Raci Matrix For Data Analytics Project Infographics PDF and make yourself stand out in meetings. The template is versatile and follows a structure that will cater to your requirements. All the templates prepared by Slidegeeks are easy to download and edit. Our research experts have taken care of the corporate themes as well. So, give it a try and see the results.
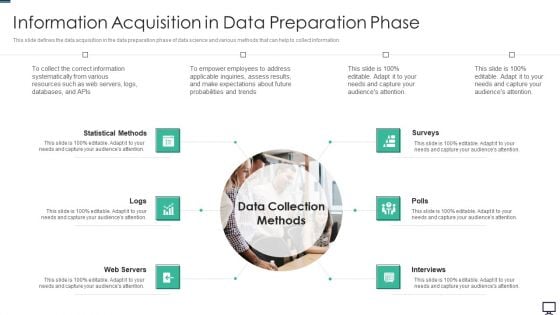
Data Analytics Information Acquisition In Data Preparation Phase Ppt Ideas Designs PDF
This slide defines the data acquisition in the data preparation phase of data science and various methods that can help to collect information. Presenting data analytics information acquisition in data preparation phase ppt ideas designs pdf to provide visual cues and insights. Share and navigate important information on six stages that need your due attention. This template can be used to pitch topics like statistical methods, web servers, interviews, surveys. In addtion, this PPT design contains high resolution images, graphics, etc, that are easily editable and available for immediate download.
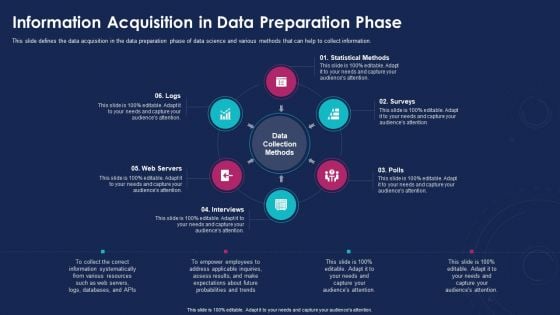
Data Analytics IT Information Acquisition In Data Preparation Phase Ppt Styles Aids PDF
This slide defines the data acquisition in the data preparation phase of data science and various methods that can help to collect information. Presenting data analytics it information acquisition in data preparation phase ppt styles aids pdf to provide visual cues and insights. Share and navigate important information on six stages that need your due attention. This template can be used to pitch topics like logs, web servers, interviews, polls, surveys. In addtion, this PPT design contains high resolution images, graphics, etc, that are easily editable and available for immediate download.
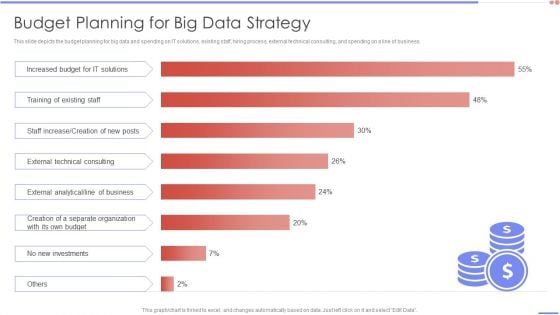
Data Analytics Management Budget Planning For Big Data Strategy Guidelines PDF
This slide depicts the budget planning for big data and spending on IT solutions, existing staff, hiring process, external technical consulting, and spending on a line of business.Deliver an awe inspiring pitch with this creative Data Analytics Management Budget Planning For Big Data Strategy Guidelines PDF bundle. Topics like Increased Budget, Training Of Existing, Increase Creation can be discussed with this completely editable template. It is available for immediate download depending on the needs and requirements of the user.
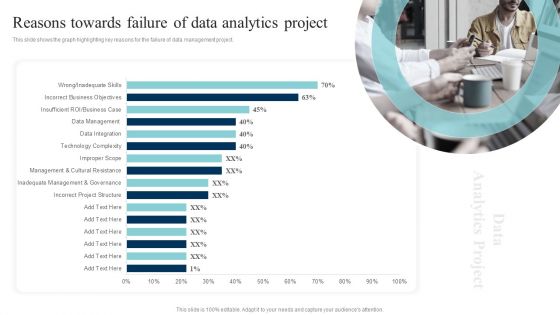
Data Evaluation And Processing Toolkit Reasons Towards Failure Of Data Analytics Project Designs PDF
This slide shows the graph highlighting key reasons for the failure of data management project. If your project calls for a presentation, then Slidegeeks is your go-to partner because we have professionally designed, easy-to-edit templates that are perfect for any presentation. After downloading, you can easily edit Data Evaluation And Processing Toolkit Reasons Towards Failure Of Data Analytics Project Designs PDF and make the changes accordingly. You can rearrange slides or fill them with different images. Check out all the handy templates.
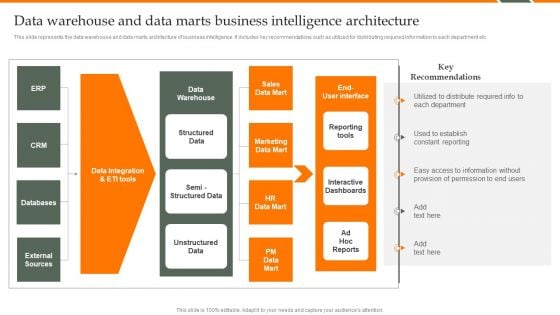
Human Resource Analytics Data Warehouse And Data Marts Business Intelligence Introduction PDF
This slide represents the data warehouse and data marts architecture of business intelligence. It includes key recommendations such as utilized for distributing required information to each department etc. If you are looking for a format to display your unique thoughts, then the professionally designed Human Resource Analytics Data Warehouse And Data Marts Business Intelligence Introduction PDF is the one for you. You can use it as a Google Slides template or a PowerPoint template. Incorporate impressive visuals, symbols, images, and other charts. Modify or reorganize the text boxes as you desire. Experiment with shade schemes and font pairings. Alter, share or cooperate with other people on your work. Download Human Resource Analytics Data Warehouse And Data Marts Business Intelligence Introduction PDF and find out how to give a successful presentation. Present a perfect display to your team and make your presentation unforgettable.
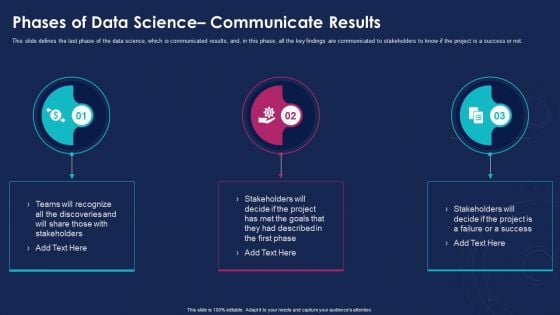
Data Analytics IT Phases Of Data Science Communicate Results Ppt Gallery Slideshow PDF
This slide defines the last phase of the data science, which is communicated results, and, in this phase, all the key findings are communicated to stakeholders to know if the project is a success or not. Presenting data analytics it phases of data science communicate results ppt gallery slideshow pdf to provide visual cues and insights. Share and navigate important information on three stages that need your due attention. This template can be used to pitch topics like phases of data science communicate results. In addtion, this PPT design contains high resolution images, graphics, etc, that are easily editable and available for immediate download.
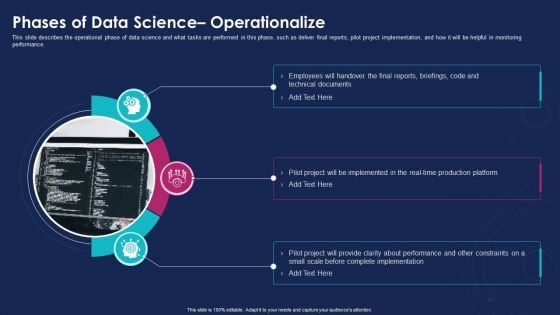
Data Analytics IT Phases Of Data Science Operationalize Ppt Summary Clipart PDF
This slide describes the operational phase of data science and what tasks are performed in this phase, such as deliver final reports, pilot project implementation, and how it will be helpful in monitoring performance. This is a data analytics it phases of data science operationalize ppt summary clipart pdf template with various stages. Focus and dispense information on three stages using this creative set, that comes with editable features. It contains large content boxes to add your information on topics like technical, implemented, performance. You can also showcase facts, figures, and other relevant content using this PPT layout. Grab it now.
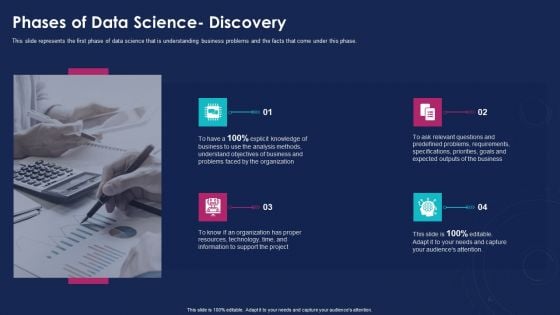
Data Analytics IT Phases Of Data Science Discovery Ppt Portfolio Skills PDF
This slide represents the first phase of data science that is understanding business problems and the facts that come under this phase. Presenting data analytics it phases of data science discovery ppt portfolio skills pdf to provide visual cues and insights. Share and navigate important information on four stages that need your due attention. This template can be used to pitch topics like resources, technology, organization, goals, business. In addtion, this PPT design contains high resolution images, graphics, etc, that are easily editable and available for immediate download.
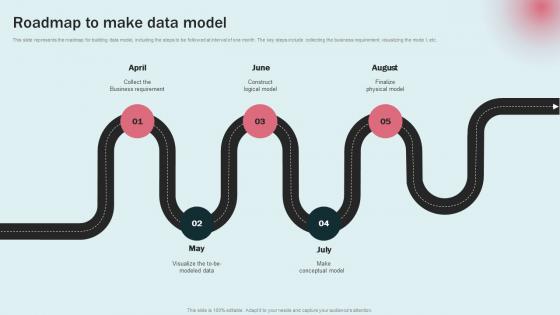
Roadmap To Make Data Model Data Modeling Approaches For Modern Analytics Guidelines Pdf
This slide represents the roadmap for building data model, including the steps to be followed at interval of one month. The key steps include collecting the business requirement, visualizing the mode l, etc. Retrieve professionally designed Roadmap To Make Data Model Data Modeling Approaches For Modern Analytics Guidelines Pdf to effectively convey your message and captivate your listeners. Save time by selecting pre made slideshows that are appropriate for various topics, from business to educational purposes. These themes come in many different styles, from creative to corporate, and all of them are easily adjustable and can be edited quickly. Access them as PowerPoint templates or as Google Slides themes. You do not have to go on a hunt for the perfect presentation because Slidegeeks got you covered from everywhere. This slide represents the roadmap for building data model, including the steps to be followed at interval of one month. The key steps include collecting the business requirement, visualizing the mode l, etc.
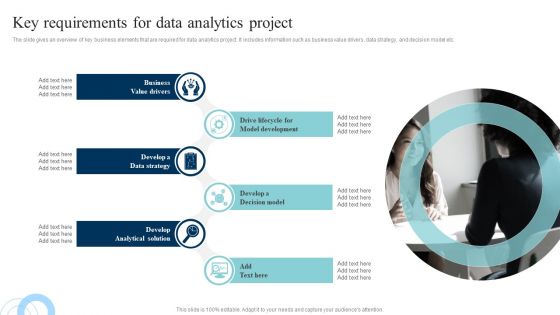
Data Evaluation And Processing Toolkit Key Requirements For Data Analytics Project Themes PDF
The slide gives an overview of key business elements that are required for data analytics project. It includes information such as business value drivers, data strategy, and decision model etc. Slidegeeks is one of the best resources for PowerPoint templates. You can download easily and regulate Data Evaluation And Processing Toolkit Key Requirements For Data Analytics Project Themes PDF for your personal presentations from our wonderful collection. A few clicks is all it takes to discover and get the most relevant and appropriate templates. Use our Templates to add a unique zing and appeal to your presentation and meetings. All the slides are easy to edit and you can use them even for advertisement purposes.
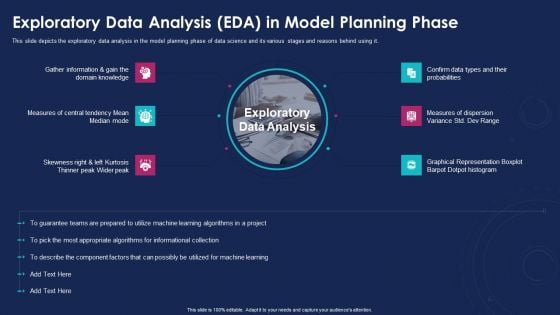
Data Analytics IT Exploratory Data Analysis EDA In Model Ppt Outline Inspiration PDF
This slide depicts the exploratory data analysis in the model planning phase of data science and its various stages and reasons behind using it. This is a data analytics it exploratory data analysis eda in model ppt outline inspiration pdf template with various stages. Focus and dispense information on six stages using this creative set, that comes with editable features. It contains large content boxes to add your information on topics like measures, probabilities, graphical representation. You can also showcase facts, figures, and other relevant content using this PPT layout. Grab it now.
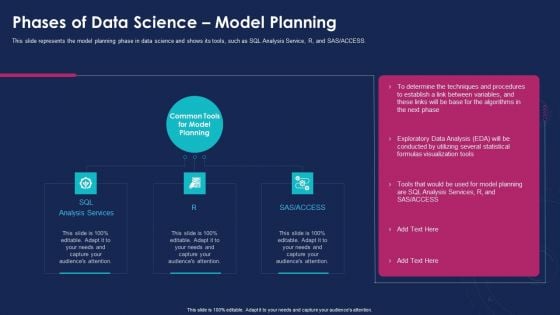
Data Analytics IT Phases Of Data Science Model Planning Ideas PDF
This slide represents the model planning phase in data science and shows its tools, such as SQL Analysis Service, R, and SAS or ACCESS. This is a data analytics it phases of data science model planning ideas pdf template with various stages. Focus and dispense information on three stages using this creative set, that comes with editable features. It contains large content boxes to add your information on topics like sql analysis services, r, sas or access. You can also showcase facts, figures, and other relevant content using this PPT layout. Grab it now.
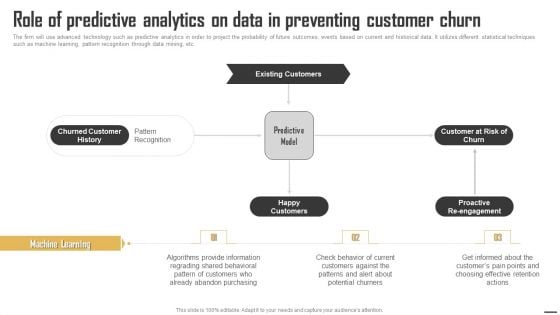
Data Monetization And Management Role Of Predictive Analytics On Data In Preventing Ideas PDF
The firm will use advanced technology such as predictive analytics in order to project the probability of future outcomes, events based on current and historical data. It utilizes different statistical techniques such as machine learning, pattern recognition through data mining, etc. Slidegeeks has constructed Data Monetization And Management Role Of Predictive Analytics On Data In Preventing Ideas PDF after conducting extensive research and examination. These presentation templates are constantly being generated and modified based on user preferences and critiques from editors. Here, you will find the most attractive templates for a range of purposes while taking into account ratings and remarks from users regarding the content. This is an excellent jumping-off point to explore our content and will give new users an insight into our top-notch PowerPoint Templates.
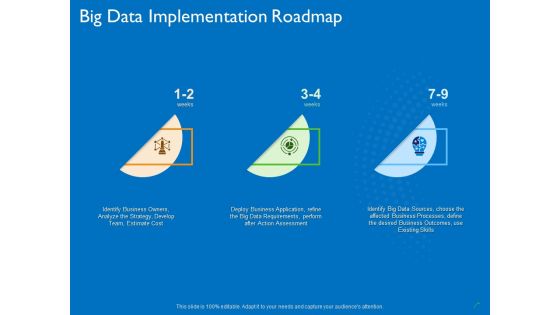
Transforming Big Data Analytics To Knowledge Big Data Implementation Roadmap Ppt Summary Diagrams PDF
This is a transforming big data analytics to knowledge big data implementation roadmap ppt summary diagrams pdf template with various stages. Focus and dispense information on three stages using this creative set, that comes with editable features. It contains large content boxes to add your information on topics like roadmap. You can also showcase facts, figures, and other relevant content using this PPT layout. Grab it now.
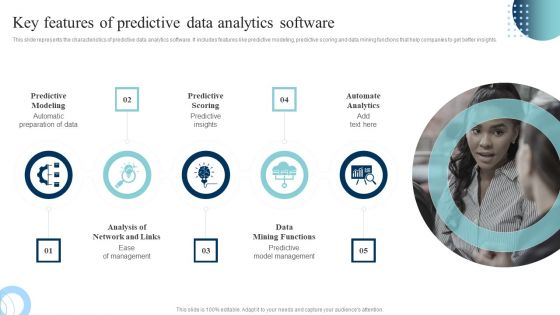
Data Evaluation And Processing Toolkit Key Features Of Predictive Data Analytics Software Ideas PDF
This slide represents the characteristics of predictive data analytics software. It includes features like predictive modeling, predictive scoring and data mining functions that help companies to get better insights. Do you know about Slidesgeeks Data Evaluation And Processing Toolkit Key Features Of Predictive Data Analytics Software Ideas PDF These are perfect for delivering any kind od presentation. Using it, create PowerPoint presentations that communicate your ideas and engage audiences. Save time and effort by using our pre-designed presentation templates that are perfect for a wide range of topic. Our vast selection of designs covers a range of styles, from creative to business, and are all highly customizable and easy to edit. Download as a PowerPoint template or use them as Google Slides themes.
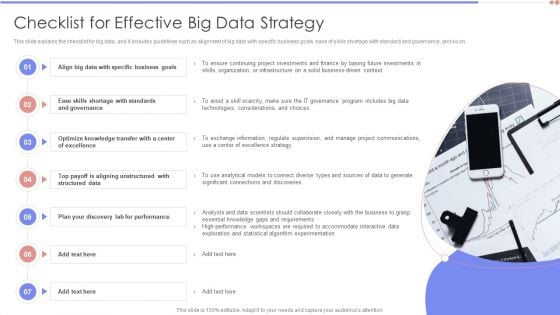
Data Analytics Management Checklist For Effective Big Data Strategy Themes PDF
This slide explains the checklist for big data, and it includes guidelines such as alignment of big data with specific business goals, ease of skills shortage with standard and governance, and so on.This is a Data Analytics Management Checklist For Effective Big Data Strategy Themes PDF template with various stages. Focus and dispense information on seven stages using this creative set, that comes with editable features. It contains large content boxes to add your information on topics like Standards Governance, Aligning Unstructured, Discovery Performance. You can also showcase facts, figures, and other relevant content using this PPT layout. Grab it now.
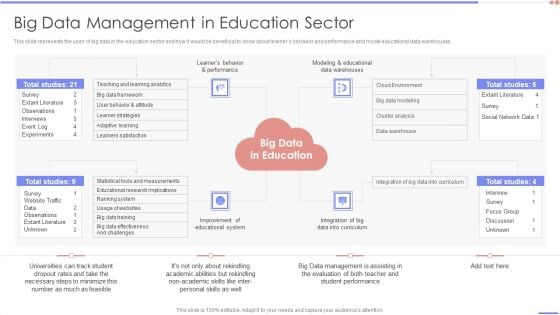
Data Analytics Management Big Data Management In Education Sector Diagrams PDF
This slide represents the uses of big data in the education sector and how it would be beneficial to know about learners behavior and performance and model educational data warehouses.This is a Data Analytics Management Big Data Management In Education Sector Diagrams PDF template with various stages. Focus and dispense information on four stages using this creative set, that comes with editable features. It contains large content boxes to add your information on topics like Extant Literature, Observations, Experiments . You can also showcase facts, figures, and other relevant content using this PPT layout. Grab it now.
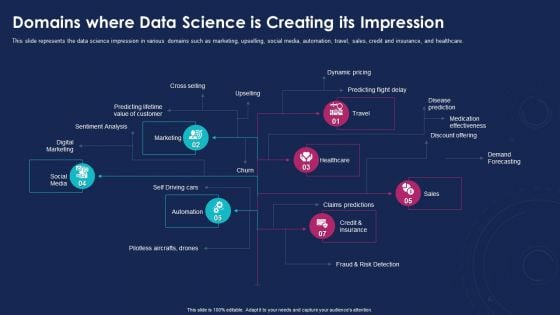
Data Analytics IT Domains Where Data Science Is Creating Its Impression Ppt Inspiration Layout Ideas PDF
This slide represents the data science impression in various domains such as marketing, upselling, social media, automation, travel, sales, credit and insurance, and healthcare. Presenting data analytics it domains where data science is creating its impression ppt inspiration layout ideas pdf to provide visual cues and insights. Share and navigate important information on seven stages that need your due attention. This template can be used to pitch topics like social media, marketing, automation, healthcare, credit and insurance. In addtion, this PPT design contains high resolution images, graphics, etc, that are easily editable and available for immediate download.
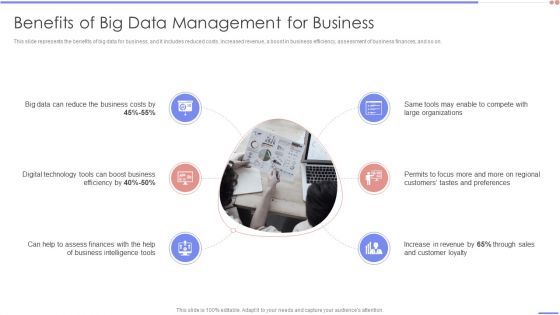
Data Analytics Management Benefits Of Big Data Management For Business Diagrams PDF
This slide represents the benefits of big data for business, and it includes reduced costs, increased revenue, a boost in business efficiency, assessment of business finances, and so on.Presenting Data Analytics Management Benefits Of Big Data Management For Business Diagrams PDF to provide visual cues and insights. Share and navigate important information on six stages that need your due attention. This template can be used to pitch topics like Digital Technology, Reduce Business, Large Organizations. In addtion, this PPT design contains high resolution images, graphics, etc, that are easily editable and available for immediate download.
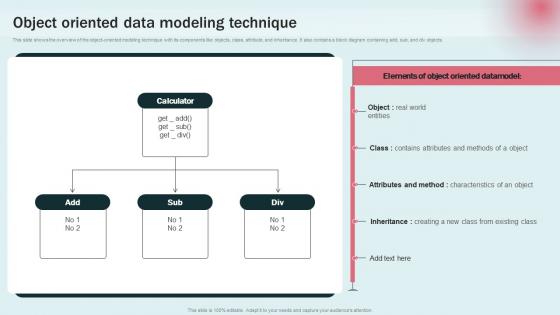
Object Oriented Data Modeling Data Modeling Approaches For Modern Analytics Infographics Pdf
This slide shows the overview of the object oriented modeling technique with its components like objects, class, attribute, and inheritance. It also contains a block diagram containing add, sub, and div objects. This modern and well arranged Object Oriented Data Modeling Data Modeling Approaches For Modern Analytics Infographics Pdf provides lots of creative possibilities. It is very simple to customize and edit with the Powerpoint Software. Just drag and drop your pictures into the shapes. All facets of this template can be edited with Powerpoint, no extra software is necessary. Add your own material, put your images in the places assigned for them, adjust the colors, and then you can show your slides to the world, with an animated slide included. This slide shows the overview of the object oriented modeling technique with its components like objects, class, attribute, and inheritance. It also contains a block diagram containing add, sub, and div objects.
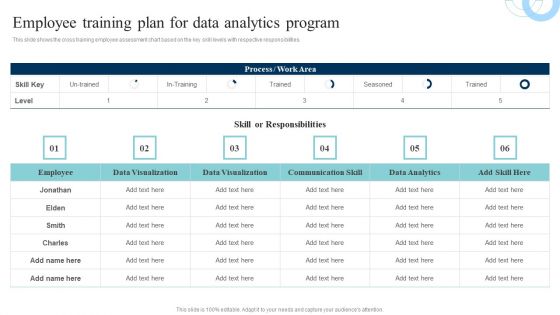
Data Evaluation And Processing Toolkit Employee Training Plan For Data Analytics Program Structure PDF
This slide shows the cross training employee assessment chart based on the key skill levels with respective responsibilities. Welcome to our selection of the Data Evaluation And Processing Toolkit Employee Training Plan For Data Analytics Program Structure PDF. These are designed to help you showcase your creativity and bring your sphere to life. Planning and Innovation are essential for any business that is just starting out. This collection contains the designs that you need for your everyday presentations. All of our PowerPoints are 100 percent editable, so you can customize them to suit your needs. This multi-purpose template can be used in various situations. Grab these presentation templates today.
SAC Planning And Implementation Deployment Options For SAP Analytics Cloud Icons PDF
The purpose of this slide is to provide an information regarding the deployment methods for SAP Analytics Cloud implementation in the business organization. It also contains details of each deployment options key features. Presenting SAC Planning And Implementation Deployment Options For SAP Analytics Cloud Icons PDF to provide visual cues and insights. Share and navigate important information on two stages that need your due attention. This template can be used to pitch topics like Deployment Option Cloud, Most Suitable, Low implementation cost. In addtion, this PPT design contains high resolution images, graphics, etc, that are easily editable and available for immediate download.
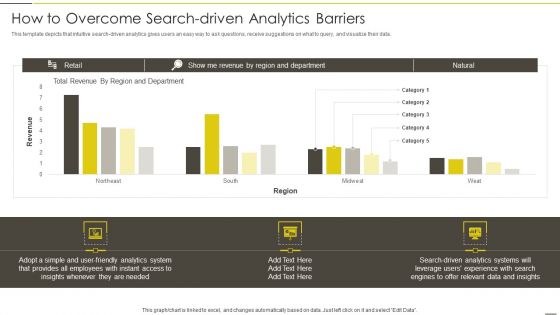
Administered Data And Analytic Quality Playbook How To Overcome Search Driven Analytics Barriers Infographics PDF
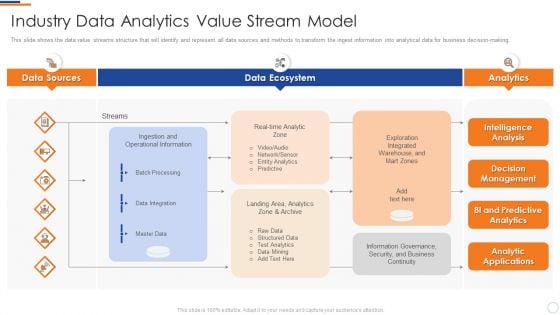
Industry Data Analytics Value Stream Model Business Intelligence And Big Inspiration PDF
This slide shows the data value streams structure that will identify and represent all data sources and methods to transform the ingest information into analytical data for business decision-making. Deliver an awe inspiring pitch with this creative industry data analytics value stream model business intelligence and big inspiration pdf bundle. Topics like data sources, data ecosystem, analytics, intelligence analysis, decision management can be discussed with this completely editable template. It is available for immediate download depending on the needs and requirements of the user.
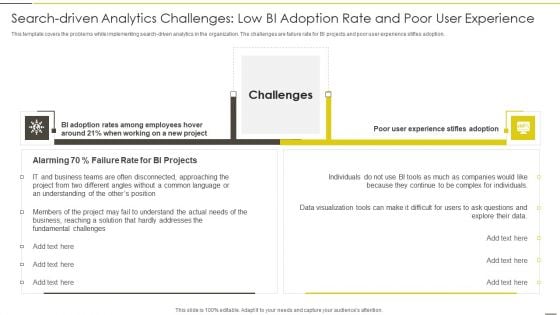
Administered Data And Analytic Quality Playbook Search Driven Analytics Challenges Low Diagrams PDF
This template covers the problems while implementing search-driven analytics in the organization. The challenges are failure rate for BI projects and poor user experience stifles adoption.Deliver an awe inspiring pitch with this creative Administered Data And Analytic Quality Playbook Search Driven Analytics Challenges Low Diagrams PDF bundle. Topics like Business Teams, Hardly Addresses, Fundamental Challenges can be discussed with this completely editable template. It is available for immediate download depending on the needs and requirements of the user.
Visual Analytics Vector Icon Ppt Powerpoint Presentation Infographics Show
This is a visual analytics vector icon ppt powerpoint presentation infographics show. This is a three stage process. The stages in this process are data visualization icon, data management icon.
Icon Showing Developing Statistical Capabilities Analytics Ppt Model Show PDF
Pitch your topic with ease and precision using this Icon Showing Developing Statistical Capabilities Analytics Ppt Model Show PDF. This layout presents information on Icon Showing, Developing Statistical, Capabilities Analytics. It is also available for immediate download and adjustment. So, changes can be made in the color, design, graphics or any other component to create a unique layout. Our Icon Showing Developing Statistical Capabilities Analytics Ppt Model Show PDF are topically designed to provide an attractive backdrop to any subject. Use them to look like a presentation pro.
Analytics Icon For New Product Launch Performance Themes Pdf
Showcasing this set of slides titled Analytics Icon For New Product Launch Performance Themes Pdf. The topics addressed in these templates are Analytics Icon, Product Launch Performance. All the content presented in this PPT design is completely editable. Download it and make adjustments in color, background, font etc. as per your unique business setting. Our Analytics Icon For New Product Launch Performance Themes Pdf are topically designed to provide an attractive backdrop to any subject. Use them to look like a presentation pro.
Internet Of Things And Edge Analytics Icon Themes Pdf
Pitch your topic with ease and precision using this Internet Of Things And Edge Analytics Icon Themes Pdf This layout presents information on Internet Things, Edge Analytics Icon It is also available for immediate download and adjustment. So, changes can be made in the color, design, graphics or any other component to create a unique layout. Our Internet Of Things And Edge Analytics Icon Themes Pdf are topically designed to provide an attractive backdrop to any subject. Use them to look like a presentation pro.
Social Media Analytics Icon For New Product Development Portrait Pdf
Pitch your topic with ease and precision using this Social Media Analytics Icon For New Product Development Portrait Pdf. This layout presents information on Social Media Analytics Icon, New Product Development. It is also available for immediate download and adjustment. So, changes can be made in the color, design, graphics or any other component to create a unique layout. Our Social Media Analytics Icon For New Product Development Portrait Pdf are topically designed to provide an attractive backdrop to any subject. Use them to look like a presentation pro.
Customer Behavior Analytics Categories Of Behavior Ppt Icon Background PDF
Rather than measuring high level metrics such as page views, companies should measure granular customer behavior metrics to get deeper understanding of their behavior. This is a customer behavior analytics categories of behavior ppt icon background pdf template with various stages. Focus and dispense information on four stages using this creative set, that comes with editable features. It contains large content boxes to add your information on topics like email engagement, purchasing history, customer experience. You can also showcase facts, figures, and other relevant content using this PPT layout. Grab it now.
HR Analytics Metrics Evaluation Checklist Icon Microsoft Pdf
Showcasing this set of slides titled HR Analytics Metrics Evaluation Checklist Icon Microsoft Pdf The topics addressed in these templates are HR Analytics Metrics, Evaluation Checklist Icon All the content presented in this PPT design is completely editable. Download it and make adjustments in color, background, font etc. as per your unique business setting. Our HR Analytics Metrics Evaluation Checklist Icon Microsoft Pdf are topically designed to provide an attractive backdrop to any subject. Use them to look like a presentation pro.
Human Resource Analytics Key Performance Indicator Icon Elements Pdf
Showcasing this set of slides titled Human Resource Analytics Key Performance Indicator Icon Elements Pdf The topics addressed in these templates are Human Resource, Analytics Key Performance, Indicator Icon All the content presented in this PPT design is completely editable. Download it and make adjustments in color, background, font etc. as per your unique business setting. Our Human Resource Analytics Key Performance Indicator Icon Elements Pdf are topically designed to provide an attractive backdrop to any subject. Use them to look like a presentation pro.
Cash Analytics Ppt PowerPoint Presentation Icon Demonstration Cpb
This is a cash analytics ppt powerpoint presentation icon demonstration cpb. This is a five stage process. The stages in this process are cash analytics.
Social Media Engagement Strategy KPI Analytics Ppt Icon Examples Pdf
This slide outlines the specific KPIs and improvement measurement that based on social media strategy and objectives. It includes various KPIs such as followers, engagement rate, reach, impressions and conversion rate. Pitch your topic with ease and precision using this Social Media Engagement Strategy KPI Analytics Ppt Icon Examples Pdf. This layout presents information on Engagement Rate, Reach, Impressions, Conversion Rate. It is also available for immediate download and adjustment. So, changes can be made in the color, design, graphics or any other component to create a unique layout. This slide outlines the specific KPIs and improvement measurement that based on social media strategy and objectives. It includes various KPIs such as followers, engagement rate, reach, impressions and conversion rate.
Project Implementation Planning Procedure Analytics Dashboard Icon Download PDF
Presenting Project Implementation Planning Procedure Analytics Dashboard Icon Download PDF to dispense important information. This template comprises two stages. It also presents valuable insights into the topics including Project Implementation Planning Procedure Analytics Dashboard Icon. This is a completely customizable PowerPoint theme that can be put to use immediately. So, download it and address the topic impactfully.
Business Management Analytics Procedure Dashboard Icon Inspiration PDF
Presenting Business Management Analytics Procedure Dashboard Icon Inspiration PDF to dispense important information. This template comprises four stages. It also presents valuable insights into the topics including Business Management Analytics, Procedure Dashboard Icon. This is a completely customizable PowerPoint theme that can be put to use immediately. So, download it and address the topic impactfully.
Project Personnel Planning Analytics Dashboard Icon Infographics PDF
Pitch your topic with ease and precision using this Project Personnel Planning Analytics Dashboard Icon Infographics PDF. This layout presents information on Project Personnel Planning, Analytics Dashboard Icon. It is also available for immediate download and adjustment. So, changes can be made in the color, design, graphics or any other component to create a unique layout.
Company Reports And Analytics Dashboard Icon Ppt Layouts Guide PDF
Presenting company reports and analytics dashboard icon ppt layouts guide pdf to dispense important information. This template comprises three stages. It also presents valuable insights into the topics including company reports and analytics dashboard icon . This is a completely customizable PowerPoint theme that can be put to use immediately. So, download it and address the topic impactfully.
Weekly Project Schedule Analytics Dashboard Icon Designs PDF
Showcasing this set of slides titled Weekly Project Schedule Analytics Dashboard Icon Designs PDF. The topics addressed in these templates are Weekly Project Schedule, Analytics Dashboard Icon. All the content presented in this PPT design is completely editable. Download it and make adjustments in color, background, font etc. as per your unique business setting.
Project Procurement Management Plan Analytics Dashboard Icon Structure PDF
Presenting project procurement management plan analytics dashboard icon structure pdf to dispense important information. This template comprises four stages. It also presents valuable insights into the topics including project procurement management plan analytics dashboard icon. This is a completely customizable PowerPoint theme that can be put to use immediately. So, download it and address the topic impactfully.
Product Launch Time Analytics And Monitoring Dashboard Icon Inspiration PDF
Presenting Product Launch Time Analytics And Monitoring Dashboard Icon Inspiration PDF to dispense important information. This template comprises three stages. It also presents valuable insights into the topics including Product Launch Time, Analytics, And Monitoring, Dashboard Icon. This is a completely customizable PowerPoint theme that can be put to use immediately. So, download it and address the topic impactfully.
Manpower Sales And Productivity Analytics Dashboard Icon Download PDF
Presenting Manpower Sales And Productivity Analytics Dashboard Icon Download PDF to dispense important information. This template comprises four stages. It also presents valuable insights into the topics including Manpower, Sales And Productivity, Analytics Dashboard, Icon. This is a completely customizable PowerPoint theme that can be put to use immediately. So, download it and address the topic impactfully.
Icon Of Change Implementation Management Process Analytics Dashboard Information PDF
Persuade your audience using this icon of change implementation management process analytics dashboard information pdf. This PPT design covers four stages, thus making it a great tool to use. It also caters to a variety of topics including icon of change implementation management process analytics dashboard. Download this PPT design now to present a convincing pitch that not only emphasizes the topic but also showcases your presentation skills.
Online Healthcare Management Platform Analytics Icon Information PDF
Presenting Online Healthcare Management Platform Analytics Icon Information PDF to dispense important information. This template comprises four stages. It also presents valuable insights into the topics including Online Healthcare Management, Platform Analytics Icon. This is a completely customizable PowerPoint theme that can be put to use immediately. So, download it and address the topic impactfully.
Icon For Real Time Warehouse Analytics Infographics PDF
Showcasing this set of slides titled Icon For Real Time Warehouse Analytics Infographics PDF. The topics addressed in these templates are Icon Real Time, Warehouse Analytics. All the content presented in this PPT design is completely editable. Download it and make adjustments in color, background, font etc. as per your unique business setting.
Mobile Search Engine Optimization Analytics Icon Professional PDF
Presenting Mobile Search Engine Optimization Analytics Icon Professional PDF to dispense important information. This template comprises three stages. It also presents valuable insights into the topics including Mobile Search Engine Optimization, Analytics Icon. This is a completely customizable PowerPoint theme that can be put to use immediately. So, download it and address the topic impactfully.
Analytics To Evaluate Customer Behavior Icon Ppt Show Portfolio PDF
Presenting Analytics To Evaluate Customer Behavior Icon Ppt Show Portfolio PDF to dispense important information. This template comprises four stages. It also presents valuable insights into the topics including Analytics To Evaluate, Customer Behavior, Icon. This is a completely customizable PowerPoint theme that can be put to use immediately. So, download it and address the topic impactfully.
Customer Behavior Analytics Icon With Desktop Ppt Slides Tips PDF
Presenting Customer Behavior Analytics Icon With Desktop Ppt Slides Tips PDF to dispense important information. This template comprises four stages. It also presents valuable insights into the topics including Customer Behavior, Analytics Icon, Desktop. This is a completely customizable PowerPoint theme that can be put to use immediately. So, download it and address the topic impactfully.
Customer Behavior Market Research Analytics Icon Ppt Outline Model PDF
Presenting Customer Behavior Market Research Analytics Icon Ppt Outline Model PDF to dispense important information. This template comprises four stages. It also presents valuable insights into the topics including Customer Behavior, Market Research, Analytics Icon. This is a completely customizable PowerPoint theme that can be put to use immediately. So, download it and address the topic impactfully.
Website Analytics Icon For Measuring Market Revenue Ideas PDF
Presenting Website Analytics Icon For Measuring Market Revenue Ideas PDF to dispense important information. This template comprises four stages. It also presents valuable insights into the topics including Website Analytics Icon, Measuring Market Revenue. This is a completely customizable PowerPoint theme that can be put to use immediately. So, download it and address the topic impactfully.

 Home
Home