Data Analytics Icons
Three Months Data Analysis Procedure Roadmap Icons
We present our three months data analysis procedure roadmap icons. This PowerPoint layout is easy to edit so you can change the font size, font type, color, and shape conveniently. In addition to this, the PowerPoint layout is Google Slides compatible, so you can share it with your audience and give them access to edit it. Therefore, download and save this well researched three months data analysis procedure roadmap icons in different formats like PDF, PNG, and JPG to smoothly execute your business plan.
Business Data Analysis Target Icons PDF
Presenting business data analysis target icons pdf to provide visual cues and insights. Share and navigate important information on four stages that need your due attention. This template can be used to pitch topics like target. In addtion, this PPT design contains high resolution images, graphics, etc, that are easily editable and available for immediate download.
Data Stewardship Platform For Stewards Data Custodianship Icons Pdf
This slide outlines the overview of the data stewardship platform for data stewards, which takes the form of a dashboard and is essential for performing tasks. This platform allows data stewards to organize their work, promote trustworthy and participatory information documentation, and so on. Slidegeeks is one of the best resources for PowerPoint templates. You can download easily and regulate Data Stewardship Platform For Stewards Data Custodianship Icons Pdf for your personal presentations from our wonderful collection. A few clicks is all it takes to discover and get the most relevant and appropriate templates. Use our Templates to add a unique zing and appeal to your presentation and meetings. All the slides are easy to edit and you can use them even for advertisement purposes. This slide outlines the overview of the data stewardship platform for data stewards, which takes the form of a dashboard and is essential for performing tasks. This platform allows data stewards to organize their work, promote trustworthy and participatory information documentation, and so on.
Data Structure IT Retail Specific Data Model Structure Icons PDF
This slide contains structure of data structure which is specific to manufacturing industry. It shows how the data is stored and connected with various entities of the model such as payments, warehouses, retail purchases, etc. Are you searching for a Data Structure IT Retail Specific Data Model Structure Icons PDF that is uncluttered, straightforward, and original. Its easy to edit, and you can change the colors to suit your personal or business branding. For a presentation that expresses how much effort you have put in, this template is ideal. With all of its features, including tables, diagrams, statistics, and lists, its perfect for a business plan presentation. Make your ideas more appealing with these professional slides. Download Data Structure IT Retail Specific Data Model Structure Icons PDF from Slidegeeks today.
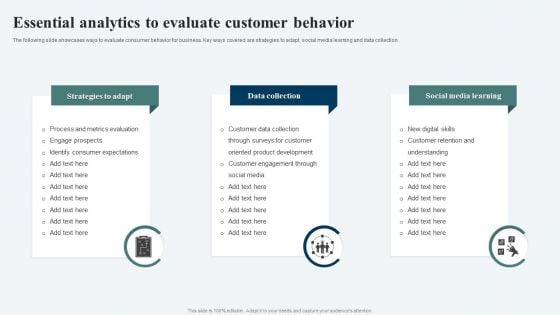
Essential Analytics To Evaluate Customer Behavior Ppt Infographics Slides PDF
The following slide showcases ways to evaluate consumer behavior for business. Key ways covered are strategies to adapt, social media learning and data collection. Presenting Essential Analytics To Evaluate Customer Behavior Ppt Infographics Slides PDF to dispense important information. This template comprises three stages. It also presents valuable insights into the topics including Strategies To Adapt, Data Collection, Social Media Learning. This is a completely customizable PowerPoint theme that can be put to use immediately. So, download it and address the topic impactfully.
Business Research And Analytics Vector Icon Ppt PowerPoint Presentation Professional Show
Presenting this set of slides with name business research and analytics vector icon ppt powerpoint presentation professional show. This is a three stage process. The stages in this process are data visualization icon, research analysis, business focus. This is a completely editable PowerPoint presentation and is available for immediate download. Download now and impress your audience.
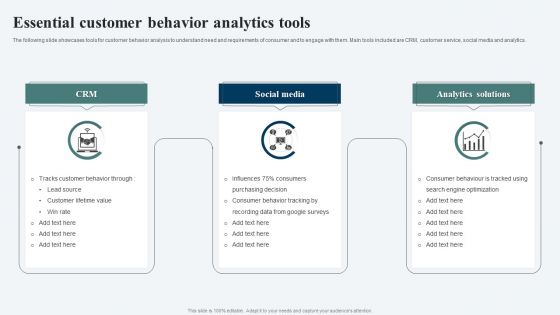
Essential Customer Behavior Analytics Tools Ppt Infographic Template Display PDF
The following slide showcases tools for customer behavior analysis to understand need and requirements of consumer and to engage with them. Main tools included are CRM, customer service, social media and analytics. Persuade your audience using this Essential Customer Behavior Analytics Tools Ppt Infographic Template Display PDF. This PPT design covers three stages, thus making it a great tool to use. It also caters to a variety of topics including CRM, Social Media, Analytics Solutions. Download this PPT design now to present a convincing pitch that not only emphasizes the topic but also showcases your presentation skills.
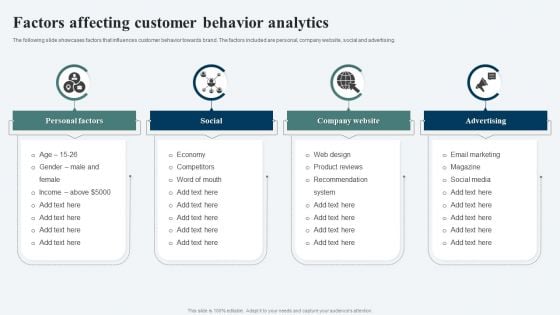
Factors Affecting Customer Behavior Analytics Ppt Layouts Display
The following slide showcases factors that influences customer behavior towards brand. The factors included are personal, company website, social and advertising. Presenting Factors Affecting Customer Behavior Analytics Ppt Layouts Display to dispense important information. This template comprises four stages. It also presents valuable insights into the topics including Personal Factors, Social, Company Website, Advertising. This is a completely customizable PowerPoint theme that can be put to use immediately. So, download it and address the topic impactfully.
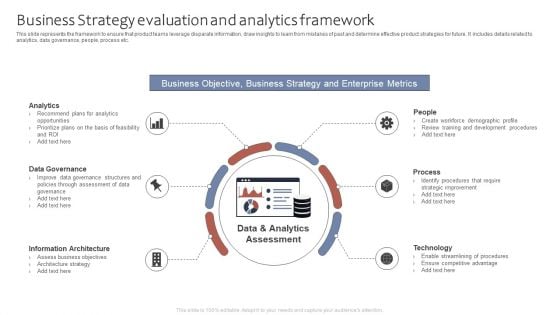
Business Strategy Evaluation And Analytics Framework Ppt Ideas Images PDF
This slide represents the framework to ensure that product teams leverage disparate information, draw insights to learn from mistakes of past and determine effective product strategies for future. It includes details related to analytics, data governance, people, process etc. Presenting Business Strategy Evaluation And Analytics Framework Ppt Ideas Images PDF to dispense important information. This template comprises six stages. It also presents valuable insights into the topics including Analytics, Data Governance, Information Architecture, People. This is a completely customizable PowerPoint theme that can be put to use immediately. So, download it and address the topic impactfully.
Business Analytics Report Vector Icon Ppt PowerPoint Presentation Icon Infographic Template PDF
Presenting this set of slides with name business analytics report vector icon ppt powerpoint presentation icon infographic template pdf. This is a three stage process. The stages in this process are business analytics report vector icon. This is a completely editable PowerPoint presentation and is available for immediate download. Download now and impress your audience.
Interactive Dashboard For Website Analytics Vector Icon Ppt PowerPoint Presentation Icon Background Images PDF
Showcasing this set of slides titled interactive dashboard for website analytics vector icon ppt powerpoint presentation icon background images pdf. The topics addressed in these templates are interactive dashboard for website analytics vector icon. All the content presented in this PPT design is completely editable. Download it and make adjustments in color, background, font etc. as per your unique business setting.
Business And Finance Analytics Marketing Business Case Icon Ppt Icon Mockup PDF
Presenting Business And Finance Analytics Marketing Business Case Icon Ppt Icon Mockup PDF to dispense important information. This template comprises three stages. It also presents valuable insights into the topics including Business And Finance, Analytics Marketing, Business Case, Icon. This is a completely customizable PowerPoint theme that can be put to use immediately. So, download it and address the topic impactfully.
Customer Behavior For Web Marketing Analytics Icon Ppt Model Icon PDF
Persuade your audience using this Customer Behavior For Web Marketing Analytics Icon Ppt Model Icon PDF. This PPT design covers four stages, thus making it a great tool to use. It also caters to a variety of topics including Customer Behavior, Web Marketing, Analytics Icon. Download this PPT design now to present a convincing pitch that not only emphasizes the topic but also showcases your presentation skills.
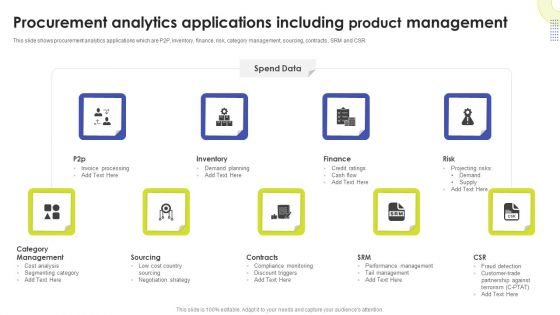
Procurement Analytics Applications Including Product Management Ppt Model Example PDF
This slide shows procurement analytics applications which are P2P, inventory, finance, risk, category management, sourcing, contracts , SRM and CSR. Presenting Procurement Analytics Applications Including Product Management Ppt Model Example PDF to dispense important information. This template comprises nine stages. It also presents valuable insights into the topics including Inventory, Finance, Risk, Contracts. This is a completely customizable PowerPoint theme that can be put to use immediately. So, download it and address the topic impactfully.
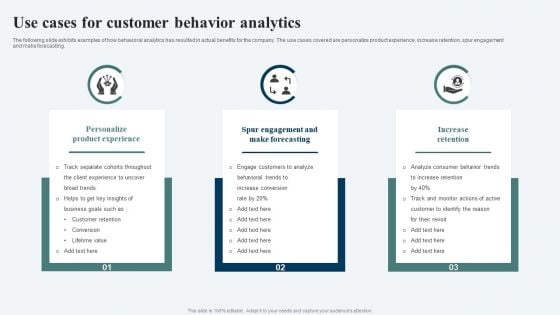
Use Cases For Customer Behavior Analytics Ppt File Inspiration PDF
The following slide exhibits examples of how behavioral analytics has resulted in actual benefits for the company. The use cases covered are personalize product experience, increase retention, spur engagement and make forecasting. Presenting Use Cases For Customer Behavior Analytics Ppt File Inspiration PDF to dispense important information. This template comprises three stages. It also presents valuable insights into the topics including Personalize Product Experience, Spur Engagement, Increase Retention. This is a completely customizable PowerPoint theme that can be put to use immediately. So, download it and address the topic impactfully.
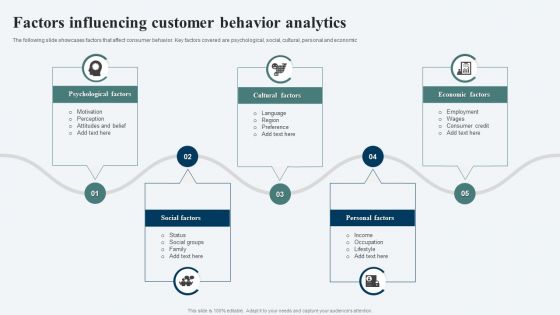
Factors Influencing Customer Behavior Analytics Ppt Infographic Template Themes PDF
The following slide showcases factors that affect consumer behavior. Key factors covered are psychological, social, cultural, personal and economic. Presenting Factors Influencing Customer Behavior Analytics Ppt Infographic Template Themes PDF to dispense important information. This template comprises five stages. It also presents valuable insights into the topics including Psychological Factors, Cultural Factors, Economic Factors, Personal Factors. This is a completely customizable PowerPoint theme that can be put to use immediately. So, download it and address the topic impactfully.
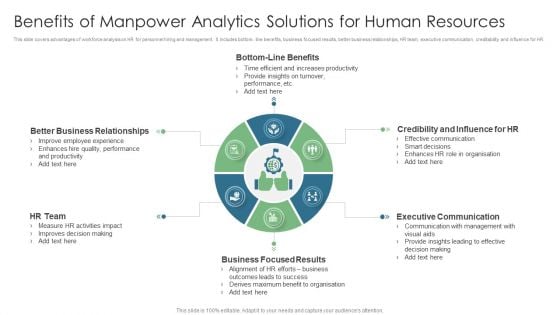
Benefits Of Manpower Analytics Solutions For Human Resources Diagrams PDF
This slide covers advantages of workforce analysis on HR for personnel hiring and management. It includes bottom- line benefits, business focused results, better business relationships, HR team, executive communication, creditability and influence for HR. Presenting Benefits Of Manpower Analytics Solutions For Human Resources Diagrams PDF to dispense important information. This template comprises six stages. It also presents valuable insights into the topics including Bottom Line Benefits, Executive Communication, Business Focused Results. This is a completely customizable PowerPoint theme that can be put to use immediately. So, download it and address the topic impactfully.
Bar Chart Business Analytics Vector Icon Ppt PowerPoint Presentation Layouts Shapes
Presenting this set of slides with name bar chart business analytics vector icon ppt powerpoint presentation layouts shapes. This is a three stage process. The stages in this process are data visualization icon, research analysis, business focus. This is a completely editable PowerPoint presentation and is available for immediate download. Download now and impress your audience.
Icon Showing Tasks Prioritization Using Analytical Abilities Icons Pdf
Pitch your topic with ease and precision using this Icon Showing Tasks Prioritization Using Analytical Abilities Icons Pdf This layout presents information on Icon Showing Tasks Prioritization, Using Analytical Abilities It is also available for immediate download and adjustment. So, changes can be made in the color, design, graphics or any other component to create a unique layout. Our Icon Showing Tasks Prioritization Using Analytical Abilities Icons Pdf are topically designed to provide an attractive backdrop to any subject. Use them to look like a presentation pro.

Key Driver Analytics Templates 1 Ppt PowerPoint Presentation Ideas
This is a key driver analytics templates 1 ppt powerpoint presentation ideas. This is a four stage process. The stages in this process are business, icons marketing, analysis, strategy, success.
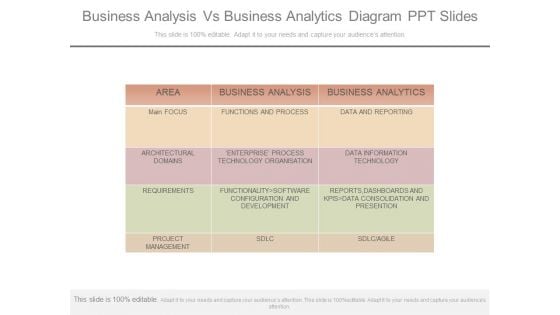
Business Analysis Vs Business Analytics Diagram Ppt Slides
This is a business analysis vs business analytics diagram ppt slides. This is a one stage process. The stages in this process are area, main focus, architectural domains, requirements, project management, business analysis, functions and process, enterprise? process technology organisation, functionality software configuration and development, sdlc, business analytics, data and reporting, data information technology, reports, dashboards and kpis data consolidation and presention, sdlc agile.
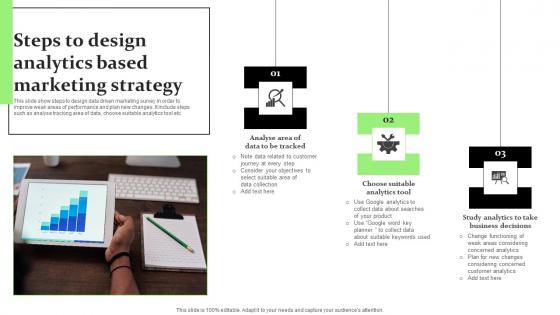
Steps To Design Analytics Based Marketing Strategy Diagrams Pdf
This slide show steps to design data driven marketing survey in order to improve weak areas of performance and plan new changes. It include steps such as analyse tracking area of data, choose suitable analytics tool etc.Pitch your topic with ease and precision using this Steps To Design Analytics Based Marketing Strategy Diagrams Pdf This layout presents information on Data Tracked, Analytics Tool, Business Decisions It is also available for immediate download and adjustment. So, changes can be made in the color, design, graphics or any other component to create a unique layout. This slide show steps to design data driven marketing survey in order to improve weak areas of performance and plan new changes. It include steps such as analyse tracking area of data, choose suitable analytics tool etc.
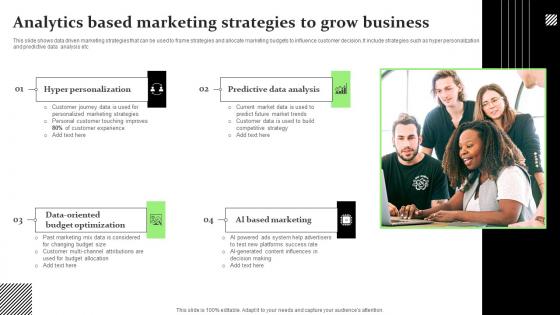
Analytics Based Marketing Strategies To Grow Business Themes Pdf
This slide shows data driven marketing strategies that can be used to frame strategies and allocate marketing budgets to influence customer decision. It include strategies such as hyper personalization and predictive data analysis etc.Showcasing this set of slides titled Analytics Based Marketing Strategies To Grow Business Themes Pdf The topics addressed in these templates are Hyper Personalization, Predictive Data Analysis, Budget Optimization All the content presented in this PPT design is completely editable. Download it and make adjustments in color, background, font etc. as per your unique business setting. This slide shows data driven marketing strategies that can be used to frame strategies and allocate marketing budgets to influence customer decision. It include strategies such as hyper personalization and predictive data analysis etc.
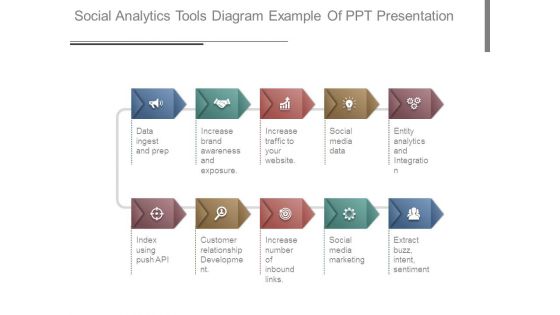
Social Analytics Tools Diagram Example Of Ppt Presentation
This is a social analytics tools diagram example of ppt presentation. This is a ten stage process. The stages in this process are data ingest and prep, increase brand awareness and exposure, increase traffic to your website, social media data, entity analytics and integration, index using push api, customer relationship development, increase number of inbound links, social media marketing, extract buzz, intent, sentiment.
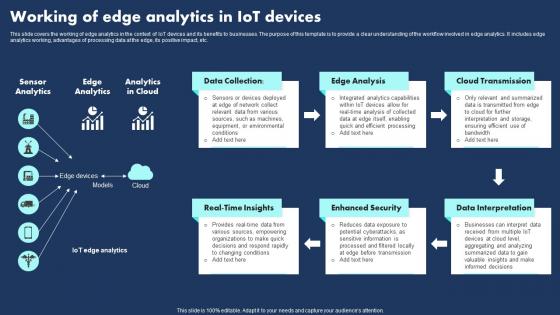
Working Of Edge Analytics In Iot Devices Themes Pdf
This slide covers the working of edge analytics in the context of IoT devices and its benefits to businesses. The purpose of this template is to provide a clear understanding of the workflow involved in edge analytics. It includes edge analytics working, advantages of processing data at the edge, its positive impact, etc.Showcasing this set of slides titled Working Of Edge Analytics In Iot Devices Themes Pdf The topics addressed in these templates are Enhanced Security, Data Interpretation, Cloud Transmission All the content presented in this PPT design is completely editable. Download it and make adjustments in color, background, font etc. as per your unique business setting. This slide covers the working of edge analytics in the context of IoT devices and its benefits to businesses. The purpose of this template is to provide a clear understanding of the workflow involved in edge analytics. It includes edge analytics working, advantages of processing data at the edge, its positive impact, etc.
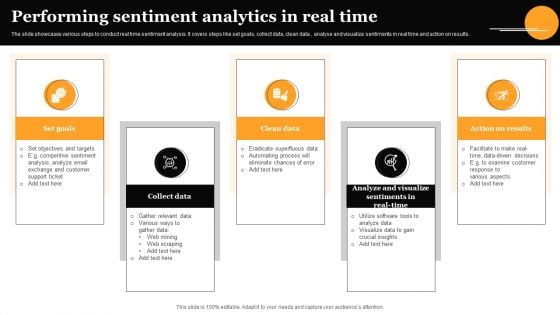
Performing Sentiment Analytics In Real Time Information PDF
The slide showcases various steps to conduct real time sentiment analysis. It covers steps like set goals, collect data, clean data , analyse and visualize sentiments in real time and action on results. Presenting Performing Sentiment Analytics In Real Time Information PDF to dispense important information. This template comprises five stages. It also presents valuable insights into the topics including Set Goals, Collect Data, Clean Data. This is a completely customizable PowerPoint theme that can be put to use immediately. So, download it and address the topic impactfully.
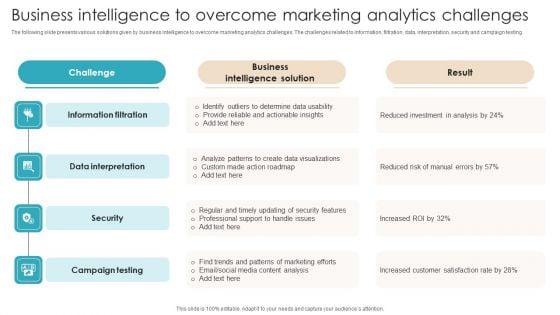
Business Intelligence To Overcome Marketing Analytics Challenges Mockup PDF
The following slide presents various solutions given by business intelligence to overcome marketing analytics challenges. The challenges related to information, filtration, data, interpretation, security and campaign testing. Presenting Business Intelligence To Overcome Marketing Analytics Challenges Mockup PDF to dispense important information. This template comprises four stages. It also presents valuable insights into the topics including Information Filtration, Data Interpretation, Security. This is a completely customizable PowerPoint theme that can be put to use immediately. So, download it and address the topic impactfully.
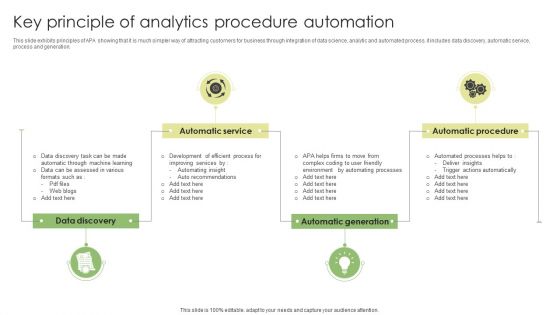
Key Principle Of Analytics Procedure Automation Demonstration PDF
This slide exhibits principles of APA showing that it is much simpler way of attracting customers for business through integration of data science, analytic and automated process. it includes data discovery, automatic service, process and generation. Presenting Key Principle Of Analytics Procedure Automation Demonstration PDF to dispense important information. This template comprises four stages. It also presents valuable insights into the topics including Data Discovery, Automatic Service, Automatic Procedure. This is a completely customizable PowerPoint theme that can be put to use immediately. So, download it and address the topic impactfully.
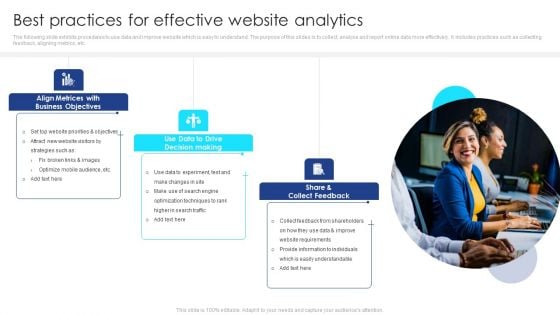
Best Practices For Effective Website Analytics Inspiration PDF
The following slide exhibits procedures to use data and improve website which is easy to understand. The purpose of this slides is to collect, analyse and report online data more effectively. It includes practices such as collecting feedback, aligning metrics, etc. Presenting Best Practices For Effective Website Analytics Inspiration PDF to dispense important information. This template comprises three stages. It also presents valuable insights into the topics including Align Metrices Business Objectives, Data Drive Decision Making, Share And Collect Feedback. This is a completely customizable PowerPoint theme that can be put to use immediately. So, download it and address the topic impactfully.
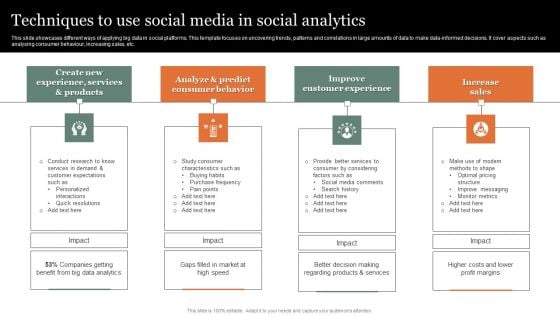
Techniques To Use Social Media In Social Analytics Structure PDF
This slide showcases different ways of applying big data in social platforms. This template focuses on uncovering trends, patterns and correlations in large amounts of data to make data informed decisions. It cover aspects such as analysing consumer behaviour, increasing sales, etc. Presenting Techniques To Use Social Media In Social Analytics Structure PDF Clipart to dispense important information. This template comprises four stages. It also presents valuable insights into the topics including Consumer Behavior, Customer Experience, Increase Sales. This is a completely customizable PowerPoint theme that can be put to use immediately. So, download it and address the topic impactfully.
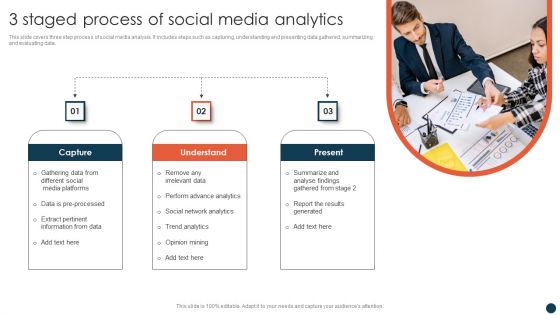
3 Staged Process Of Social Media Analytics Professional PDF
This slide covers three step process of social media analysis. It includes steps such as capturing, understanding and presenting data gathered, summarizing and evaluating data. Presenting 3 Staged Process Of Social Media Analytics Professional PDF to dispense important information. This template comprises three stages. It also presents valuable insights into the topics including Understand, Present, Capture. This is a completely customizable PowerPoint theme that can be put to use immediately. So, download it and address the topic impactfully.
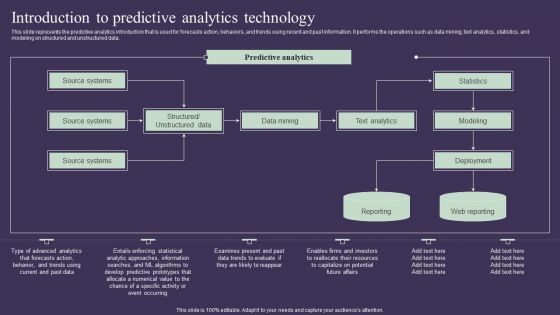
Projection Model Introduction To Predictive Analytics Technology Elements PDF
This slide represents the predictive analytics introduction that is used for forecasts action, behaviors, and trends using recent and past information. It performs the operations such as data mining, text analytics, statistics, and modeling on structured and unstructured data. Make sure to capture your audiences attention in your business displays with our gratis customizable Projection Model Introduction To Predictive Analytics Technology Elements PDF. These are great for business strategies, office conferences, capital raising or task suggestions. If you desire to acquire more customers for your tech business and ensure they stay satisfied, create your own sales presentation with these plain slides.
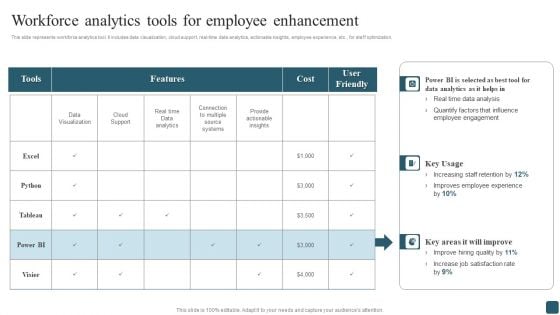
Workforce Analytics Tools For Employee Enhancement Clipart PDF
This slide represents workforce analytics tool. It includes data visualization, cloud support, real-time data analytics, actionable insights, employee experience, etc., for staff optimization. Do you know about Slidesgeeks Workforce Analytics Tools For Employee Enhancement Clipart PDF These are perfect for delivering any kind od presentation. Using it, create PowerPoint presentations that communicate your ideas and engage audiences. Save time and effort by using our pre-designed presentation templates that are perfect for a wide range of topic. Our vast selection of designs covers a range of styles, from creative to business, and are all highly customizable and easy to edit. Download as a PowerPoint template or use them as Google Slides themes.
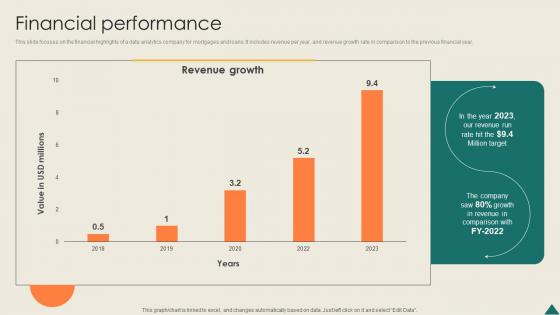
Financial Performance Financial Analytics Platform Investor Elevator Pitch Deck
This slide focuses on the financial highlights of a data analytics company for mortgages and loans. It includes revenue per year, and revenue growth rate in comparison to the previous financial year. Find a pre-designed and impeccable Financial Performance Financial Analytics Platform Investor Elevator Pitch Deck. The templates can ace your presentation without additional effort. You can download these easy-to-edit presentation templates to make your presentation stand out from others. So, what are you waiting for Download the template from Slidegeeks today and give a unique touch to your presentation. This slide focuses on the financial highlights of a data analytics company for mortgages and loans. It includes revenue per year, and revenue growth rate in comparison to the previous financial year.
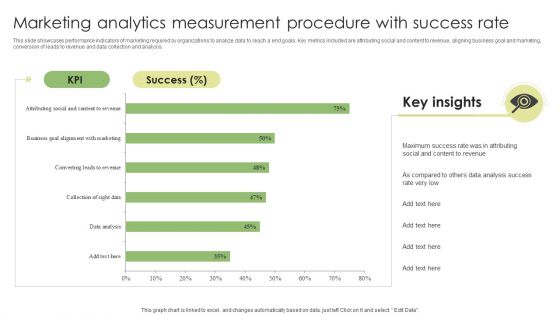
Marketing Analytics Measurement Procedure With Success Rate Guidelines PDF
This slide showcases performance indicators of marketing required by organizations to analyze data to reach a end goals. Key metrics included are attributing social and content to revenue, aligning business goal and marketing, conversion of leads to revenue and data collection and analysis. Showcasing this set of slides titled Marketing Analytics Measurement Procedure With Success Rate Guidelines PDF. The topics addressed in these templates areMarketing Analytics Measurement, Procedure With Success Rate. All the content presented in this PPT design is completely editable. Download it and make adjustments in color, background, font etc. as per your unique business setting.
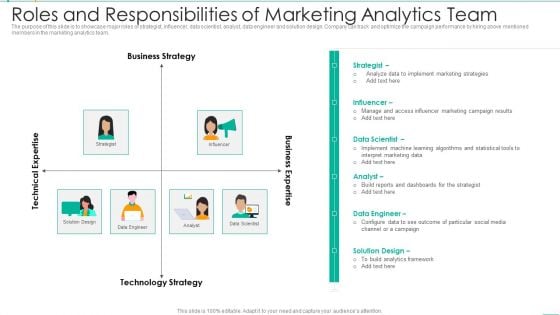
Roles And Responsibilities Of Marketing Analytics Team Mockup PDF
The purpose of this slide is to showcase major roles of strategist, influencer, data scientist, analyst, data engineer and solution design. Company can track and optimize the campaign performance by hiring above mentioned members in the marketing analytics team. Presenting Roles And Responsibilities Of Marketing Analytics Team Mockup PDF to dispense important information. This template comprises four stages. It also presents valuable insights into the topics including Business Strategy, Technical Expertise, Technology Strategy. This is a completely customizable PowerPoint theme that can be put to use immediately. So, download it and address the topic impactfully.
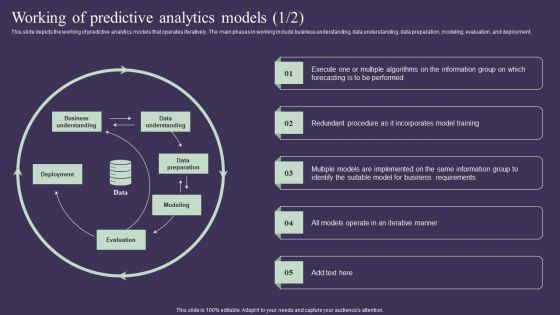
Projection Model Working Of Predictive Analytics Models Background PDF
This slide depicts the working of predictive analytics models that operates iteratively. The main phases in working include business understanding, data understanding, data preparation, modeling, evaluation, and deployment. Slidegeeks is one of the best resources for PowerPoint templates. You can download easily and regulate Projection Model Working Of Predictive Analytics Models Background PDF for your personal presentations from our wonderful collection. A few clicks is all it takes to discover and get the most relevant and appropriate templates. Use our Templates to add a unique zing and appeal to your presentation and meetings. All the slides are easy to edit and you can use them even for advertisement purposes.
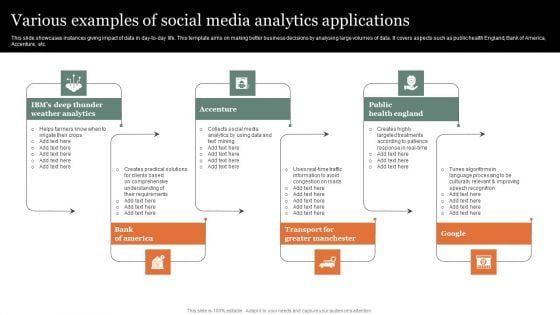
Various Examples Of Social Media Analytics Applications Mockup PDF
This slide showcases instances giving impact of data in day to day life. This template aims on making better business decisions by analysing large volumes of data. It covers aspects such as public health England, Bank of America, Accenture, etc. Presenting Various Examples Of Social Media Analytics Applications Mockup PDF Structure to dispense important information. This template comprises six stages. It also presents valuable insights into the topics including Weather Analytics, Greater Manchester, Health England. This is a completely customizable PowerPoint theme that can be put to use immediately. So, download it and address the topic impactfully.
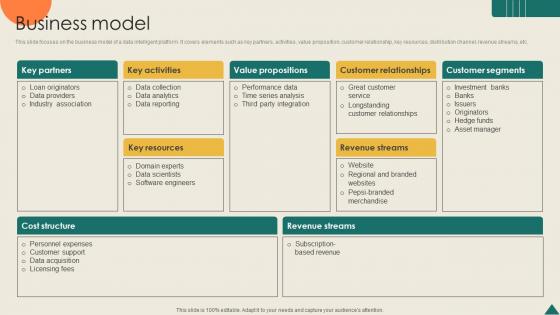
Business Model Financial Analytics Platform Investor Elevator Pitch Deck
This slide focuses on the business model of a data intelligent platform. It covers elements such as key partners, activities, value proposition, customer relationship, key resources, distribution channel, revenue streams, etc. Are you searching for a Business Model Financial Analytics Platform Investor Elevator Pitch Deck that is uncluttered, straightforward, and original Its easy to edit, and you can change the colors to suit your personal or business branding. For a presentation that expresses how much effort you have put in, this template is ideal With all of its features, including tables, diagrams, statistics, and lists, its perfect for a business plan presentation. Make your ideas more appealing with these professional slides. Download Business Model Financial Analytics Platform Investor Elevator Pitch Deck from Slidegeeks today. This slide focuses on the business model of a data intelligent platform. It covers elements such as key partners, activities, value proposition, customer relationship, key resources, distribution channel, revenue streams, etc.
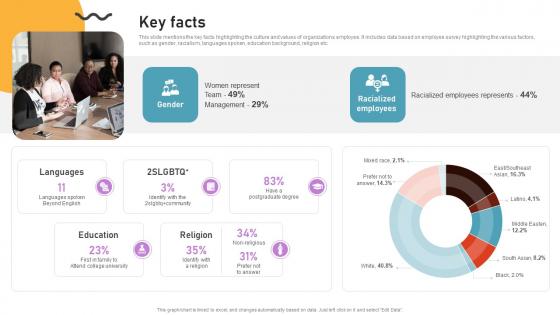
Key Facts Cloud Based Predictive Analytics Software Pitch Deck
This slide mentions the key facts highlighting the culture and values of organizations employee. It includes data based on employee survey highlighting the various factors, such as gender, racialism, languages spoken, education background, religion etc. Find highly impressive Key Facts Cloud Based Predictive Analytics Software Pitch Deck on Slidegeeks to deliver a meaningful presentation. You can save an ample amount of time using these presentation templates. No need to worry to prepare everything from scratch because Slidegeeks experts have already done a huge research and work for you. You need to download Key Facts Cloud Based Predictive Analytics Software Pitch Deck for your upcoming presentation. All the presentation templates are 100 percent editable and you can change the color and personalize the content accordingly. Download now This slide mentions the key facts highlighting the culture and values of organizations employee. It includes data based on employee survey highlighting the various factors, such as gender, racialism, languages spoken, education background, religion etc.
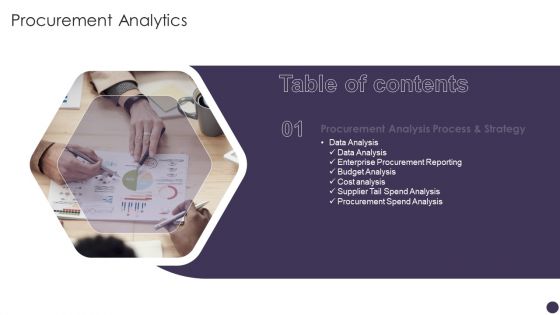
Table Of Contents Procurement Analytics Slide Diagrams PDF
Presenting Table Of Contents Procurement Analytics Slide Diagrams PDF to provide visual cues and insights. Share and navigate important information on one stage that need your due attention. This template can be used to pitch topics like Data Analysis, Enterprise Procurement, Budget Analysis. In addtion, this PPT design contains high resolution images, graphics, etc, that are easily editable and available for immediate download.
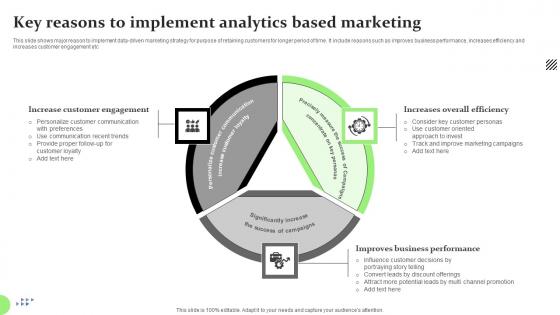
Key Reasons To Implement Analytics Based Marketing Diagrams Pdf
This slide shows major reason to implement data driven marketing strategy for purpose of retaining customers for longer period of time. It include reasons such as improves business performance, increases efficiency and increases customer engagement etc.Pitch your topic with ease and precision using this Key Reasons To Implement Analytics Based Marketing Diagrams Pdf This layout presents information on Increase Customer Engagement, Increases Overall Efficiency, Improves Business Performance It is also available for immediate download and adjustment. So, changes can be made in the color, design, graphics or any other component to create a unique layout. This slide shows major reason to implement data driven marketing strategy for purpose of retaining customers for longer period of time. It include reasons such as improves business performance, increases efficiency and increases customer engagement etc.
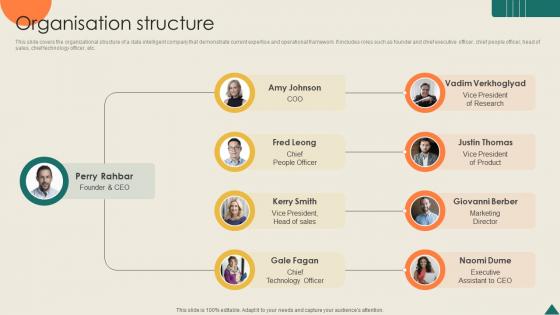
Organisation Structure Financial Analytics Platform Investor Elevator Pitch Deck
This slide covers the organizational structure of a data intelligent company that demonstrate current expertise and operational framework. It includes roles such as founder and chief executive officer, chief people officer, head of sales, chief technology officer, etc. From laying roadmaps to briefing everything in detail, our templates are perfect for you. You can set the stage with your presentation slides. All you have to do is download these easy-to-edit and customizable templates. Organisation Structure Financial Analytics Platform Investor Elevator Pitch Deck will help you deliver an outstanding performance that everyone would remember and praise you for. Do download this presentation today. This slide covers the organizational structure of a data intelligent company that demonstrate current expertise and operational framework. It includes roles such as founder and chief executive officer, chief people officer, head of sales, chief technology officer, etc.
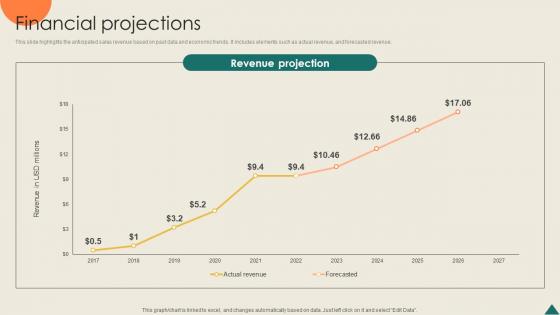
Financial Projections Financial Analytics Platform Investor Elevator Pitch Deck
This slide highlights the anticipated sales revenue based on past data and economic trends. It includes elements such as actual revenue, and forecasted revenue. Boost your pitch with our creative Financial Projections Financial Analytics Platform Investor Elevator Pitch Deck. Deliver an awe-inspiring pitch that will mesmerize everyone. Using these presentation templates you will surely catch everyones attention. You can browse the ppts collection on our website. We have researchers who are experts at creating the right content for the templates. So you do not have to invest time in any additional work. Just grab the template now and use them. This slide highlights the anticipated sales revenue based on past data and economic trends. It includes elements such as actual revenue, and forecasted revenue.
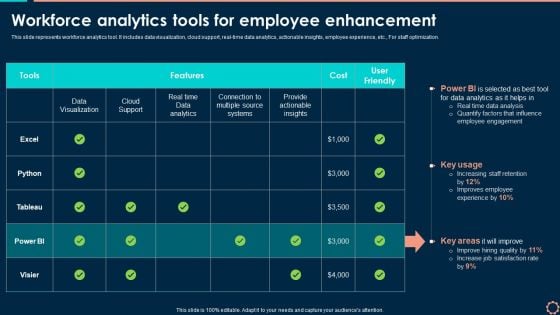
Workforce Analytics Tools For Employee Enhancement Introduction PDF
This slide represents workforce analytics tool. It includes data visualization, cloud support, real-time data analytics, actionable insights, employee experience, etc. For staff optimization. Are you searching for a Workforce Analytics Tools For Employee Enhancement Introduction PDF that is uncluttered, straightforward, and original Its easy to edit, and you can change the colors to suit your personal or business branding. For a presentation that expresses how much effort you have put in, this template is ideal With all of its features, including tables, diagrams, statistics, and lists, its perfect for a business plan presentation. Make your ideas more appealing with these professional slides. Download Workforce Analytics Tools For Employee Enhancement Introduction PDF from Slidegeeks today.
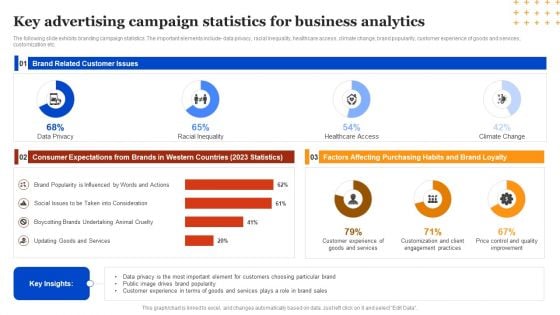
Key Advertising Campaign Statistics For Business Analytics Summary PDF
The following slide exhibits branding campaign statistics. The important elements include- data privacy, racial inequality, healthcare access, climate change, brand popularity, customer experience of goods and services, customization etc. Showcasing this set of slides titled Key Advertising Campaign Statistics For Business Analytics Summary PDF. The topics addressed in these templates are Key Insights, Analytics, Healthcare Access. All the content presented in this PPT design is completely editable. Download it and make adjustments in color, background, font etc. as per your unique business setting.
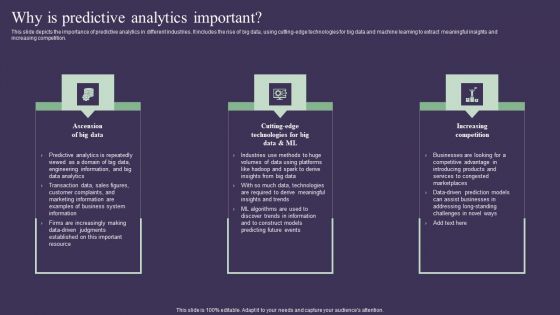
Projection Model Why Is Predictive Analytics Important Diagrams PDF
This slide depicts the importance of predictive analytics in different industries. It includes the rise of big data, using cutting-edge technologies for big data and machine learning to extract meaningful insights and increasing competition. Create an editable Projection Model Why Is Predictive Analytics Important Diagrams PDF that communicates your idea and engages your audience. Whether you are presenting a business or an educational presentation, pre-designed presentation templates help save time. Projection Model Why Is Predictive Analytics Important Diagrams PDF is highly customizable and very easy to edit, covering many different styles from creative to business presentations. Slidegeeks has creative team members who have crafted amazing templates. So, go and get them without any delay.
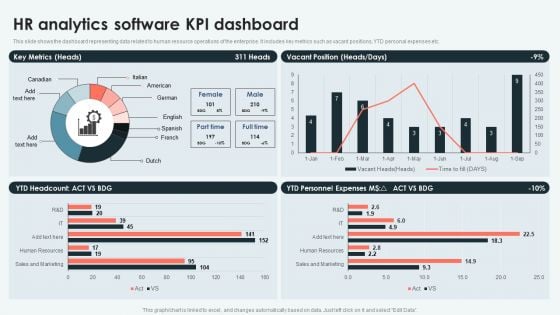
Analyzing And Deploying HR Analytics Software Kpi Dashboard Information PDF
This slide shows the dashboard representing data related to human resource operations of the enterprise. It includes key metrics such as vacant positions, YTD personal expenses etc. There are so many reasons you need a Analyzing And Deploying HR Analytics Software Kpi Dashboard Information PDF. The first reason is you cant spend time making everything from scratch, Thus, Slidegeeks has made presentation templates for you too. You can easily download these templates from our website easily.
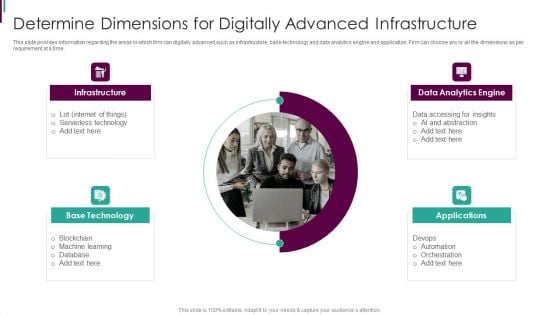
Developing Business Analytics Framework Determine Dimensions Diagrams PDF
This slide provides information regarding the areas in which firm can digitally advanced such as infrastructure, base technology and data analytics engine and application. Firm can choose any or all the dimensions as per requirement at a time. This is a Developing Business Analytics Framework Determine Dimensions Diagrams PDF template with various stages. Focus and dispense information on four stages using this creative set, that comes with editable features. It contains large content boxes to add your information on topics like Infrastructure, Analytics Engine, Base Technology You can also showcase facts, figures, and other relevant content using this PPT layout. Grab it now.
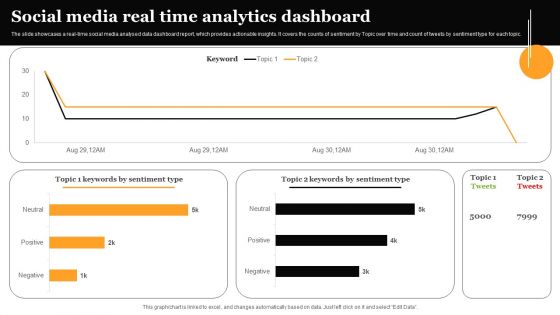
Social Media Real Time Analytics Dashboard Formats PDF
The slide showcases a real-time social media analysed data dashboard report, which provides actionable insights. It covers the counts of sentiment by Topic over time and count of tweets by sentiment type for each topic. Showcasing this set of slides titled Social Media Real Time Analytics Dashboard Formats PDF. The topics addressed in these templates are Social Media Real, Time Analytics, Dashboard. All the content presented in this PPT design is completely editable. Download it and make adjustments in color, background, font etc. as per your unique business setting.
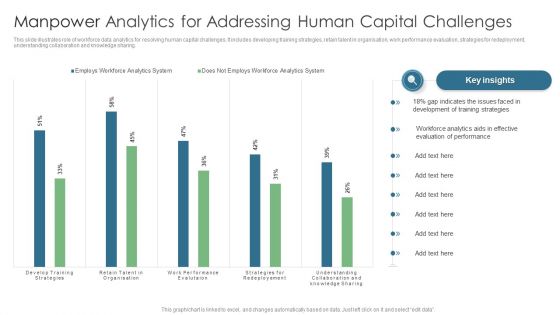
Manpower Analytics For Addressing Human Capital Challenges Diagrams PDF
This slide illustrates role of workforce data analytics for resolving human capital challenges. It includes developing training strategies, retain talent in organisation, work performance evaluation, strategies for redeployment, understanding collaboration and knowledge sharing. Showcasing this set of slides titled Manpower Analytics For Addressing Human Capital Challenges Diagrams PDF. The topics addressed in these templates are Gap Indicates, Training Strategies, Evaluation Performance. All the content presented in this PPT design is completely editable. Download it and make adjustments in color, background, font etc. as per your unique business setting.
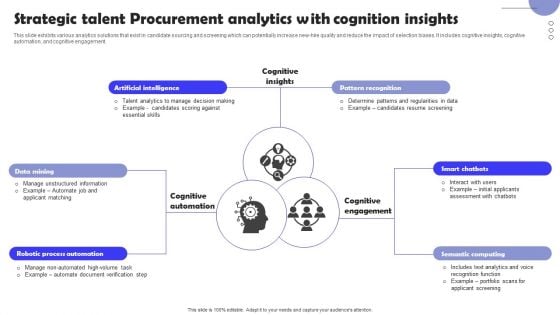
Strategic Talent Procurement Analytics With Cognition Insights Infographics PDF
This slide exhibits various analytics solutions that exist in candidate sourcing and screening which can potentially increase new-hire quality and reduce the impact of selection biases. It includes cognitive insights, cognitive automation, and cognitive engagement. Presenting Strategic Talent Procurement Analytics With Cognition Insights Infographics PDF to dispense important information. This template comprises six stages. It also presents valuable insights into the topics including Data Mining, Artificial Intelligence, Pattern Recognition, Smart Chatbots. This is a completely customizable PowerPoint theme that can be put to use immediately. So, download it and address the topic impactfully.
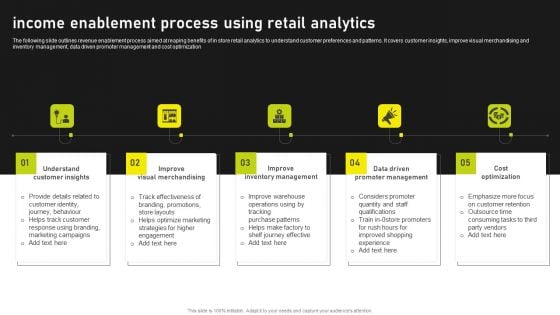
Income Enablement Process Using Retail Analytics Template PDF
The following slide outlines revenue enablement process aimed at reaping benefits of in store retail analytics to understand customer preferences and patterns. It covers customer insights, improve visual merchandising and inventory management, data driven promoter management and cost optimization. Presenting Income Enablement Process Using Retail Analytics Template PDF to dispense important information. This template comprises five stages. It also presents valuable insights into the topics including Improve Visual Merchandising, Understand Customer Insights, Improve Inventory Management. This is a completely customizable PowerPoint theme that can be put to use immediately. So, download it and address the topic impactfully.
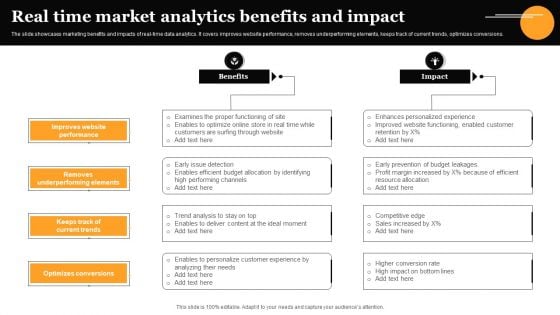
Real Time Market Analytics Benefits And Impact Infographics PDF
The slide showcases marketing benefits and impacts of real-time data analytics. It covers improves website performance, removes underperforming elements, keeps track of current trends, optimizes conversions. Presenting Real Time Market Analytics Benefits And Impact Infographics PDF to dispense important information. This template comprises four stages. It also presents valuable insights into the topics including Improves Website Performance, Removes Underperforming Elements, Optimizes Conversions. This is a completely customizable PowerPoint theme that can be put to use immediately. So, download it and address the topic impactfully.
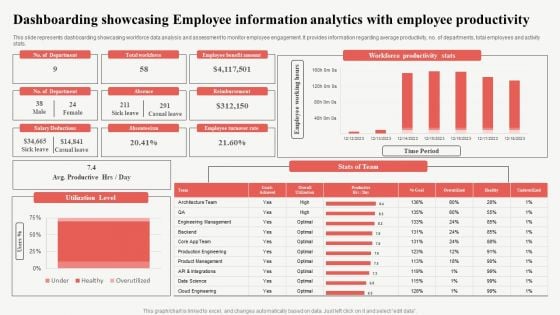
Dashboarding Showcasing Employee Information Analytics With Employee Productivity Slides PDF
This slide represents dashboarding showcasing workforce data analysis and assessment to monitor employee engagement. It provides information regarding average productivity, no. of departments, total employees and activity stats. Pitch your topic with ease and precision using this Dashboarding Showcasing Employee Information Analytics With Employee Productivity Slides PDF. This layout presents information on Reimbursement, Productive, Workforce Productivity Stats. It is also available for immediate download and adjustment. So, changes can be made in the color, design, graphics or any other component to create a unique layout.
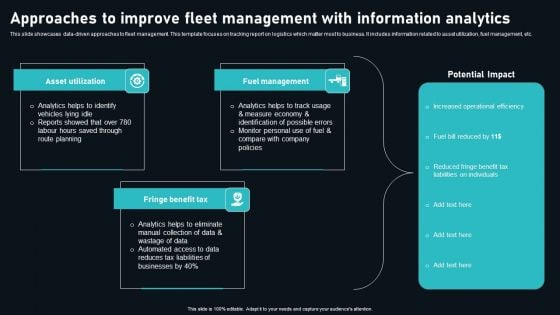
Approaches To Improve Fleet Management With Information Analytics Sample PDF
This slide showcases data driven approaches to fleet management. This template focuses on tracking report on logistics which matter most to business. It includes information related to asset utilization, fuel management, etc. Presenting Approaches To Improve Fleet Management With Information Analytics Sample PDF to dispense important information. This template comprises three stages. It also presents valuable insights into the topics including Asset Utilization, Fuel Management, Fringe Benefit Tax. This is a completely customizable PowerPoint theme that can be put to use immediately. So, download it and address the topic impactfully.
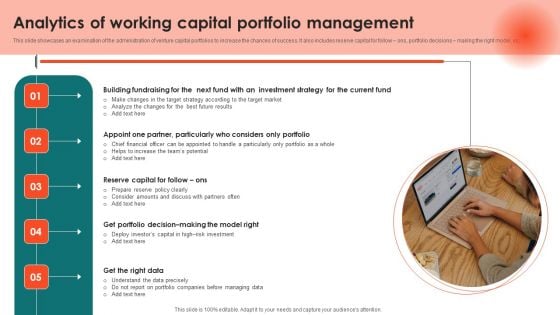
Analytics Of Working Capital Portfolio Management Rules PDF
This slide showcases an examination of the administration of venture capital portfolios to increase the chances of success. It also includes reserve capital for follow ons, portfolio decisions making the right model, etc. Presenting Analytics Of Working Capital Portfolio Management Rules PDF to dispense important information. This template comprises five stages. It also presents valuable insights into the topics including Building Fundraising, Partner, Particularly, Right Data This is a completely customizable PowerPoint theme that can be put to use immediately. So, download it and address the topic impactfully.
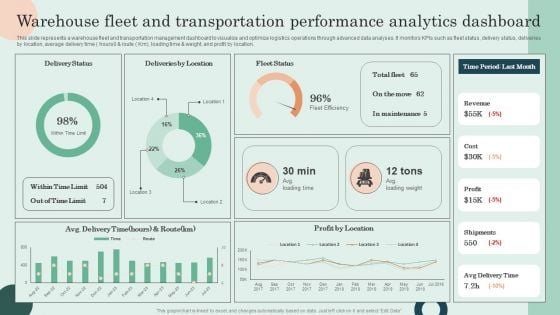
Warehouse Fleet And Transportation Performance Analytics Dashboard Pictures PDF
This slide represents a warehouse fleet and transportation management dashboard to visualize and optimize logistics operations through advanced data analyses. It monitors KPIs such as fleet status, delivery status, deliveries by location, average delivery time hours0 and route Km, loading time and weight, and profit by location. Do you have to make sure that everyone on your team knows about any specific topic I yes, then you should give Warehouse Fleet And Transportation Performance Analytics Dashboard Pictures PDF a try. Our experts have put a lot of knowledge and effort into creating this impeccable Warehouse Fleet And Transportation Performance Analytics Dashboard Pictures PDF. You can use this template for your upcoming presentations, as the slides are perfect to represent even the tiniest detail. You can download these templates from the Slidegeeks website and these are easy to edit. So grab these today
Analytics Company Investor Funding Elevator Pitch Deck Ppt Template
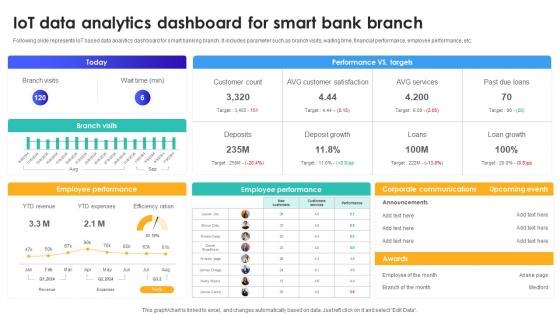
IoT Data Analytics Dashboard For Smart Bank Branch IoT In Banking For Digital Future IoT SS V
Following slide represents IoT based data analytics dashboard for smart banking branch. It includes parameter such as branch visits, waiting time, financial performance, employee performance, etc. Do you have an important presentation coming up Are you looking for something that will make your presentation stand out from the rest Look no further than IoT Data Analytics Dashboard For Smart Bank Branch IoT In Banking For Digital Future IoT SS V. With our professional designs, you can trust that your presentation will pop and make delivering it a smooth process. And with Slidegeeks, you can trust that your presentation will be unique and memorable. So why wait Grab IoT Data Analytics Dashboard For Smart Bank Branch IoT In Banking For Digital Future IoT SS V today and make your presentation stand out from the rest Following slide represents IoT based data analytics dashboard for smart banking branch. It includes parameter such as branch visits, waiting time, financial performance, employee performance, etc.
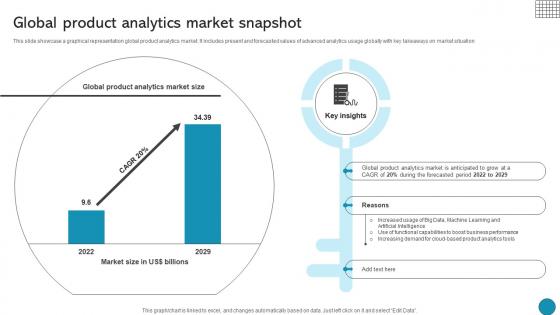
Global Product Analytics Market Snapshot Driving Business Success Integrating Product
This slide showcase a graphical representation global product analytics market. It includes present and forecasted values of advanced analytics usage globally with key takeaways on market situationThis modern and well-arranged Global Product Analytics Market Snapshot Driving Business Success Integrating Product provides lots of creative possibilities. It is very simple to customize and edit with the Powerpoint Software. Just drag and drop your pictures into the shapes. All facets of this template can be edited with Powerpoint, no extra software is necessary. Add your own material, put your images in the places assigned for them, adjust the colors, and then you can show your slides to the world, with an animated slide included. This slide showcase a graphical representation global product analytics market. It includes present and forecasted values of advanced analytics usage globally with key takeaways on market situation
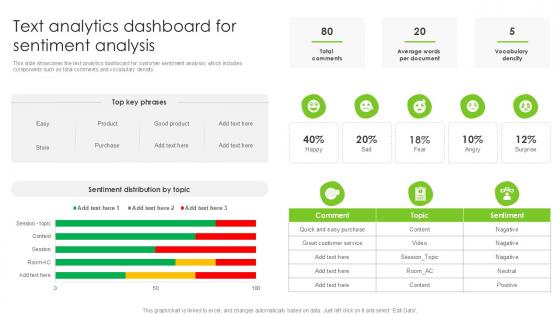
Text Analytics Dashboard For Sentiment Analysis PPT Template SS
This slide showcases the text analytics dashboard for customer sentiment analysis, which includes components such as total comments and vocabulary density. Here you can discover an assortment of the finest PowerPoint and Google Slides templates. With these templates, you can create presentations for a variety of purposes while simultaneously providing your audience with an eye-catching visual experience. Download Text Analytics Dashboard For Sentiment Analysis PPT Template SS to deliver an impeccable presentation. These templates will make your job of preparing presentations much quicker, yet still, maintain a high level of quality. Slidegeeks has experienced researchers who prepare these templates and write high-quality content for you. Later on, you can personalize the content by editing the Text Analytics Dashboard For Sentiment Analysis PPT Template SS. This slide showcases the text analytics dashboard for customer sentiment analysis, which includes components such as total comments and vocabulary density.
Computer Screen Monitor Analytics Vector Icon Ppt Powerpoint Presentation Inspiration Grid
This is a computer screen monitor analytics vector icon ppt powerpoint presentation inspiration grid. This is a one stage process. The stages in this process are data management icon, big data icon.
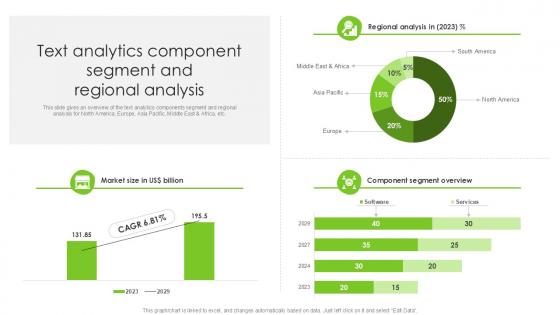
Text Analytics Component Segment And Regional Analysis PPT Template SS
This slide gives an overview of the text analytics components segment and regional analysis for North America, Europe, Asia Pacific, Middle East and Africa, etc. Presenting this PowerPoint presentation, titled Text Analytics Component Segment And Regional Analysis PPT Template SS, with topics curated by our researchers after extensive research. This editable presentation is available for immediate download and provides attractive features when used. Download now and captivate your audience. Presenting this Text Analytics Component Segment And Regional Analysis PPT Template SS. Our researchers have carefully researched and created these slides with all aspects taken into consideration. This is a completely customizable Text Analytics Component Segment And Regional Analysis PPT Template SS that is available for immediate downloading. Download now and make an impact on your audience. Highlight the attractive features available with our PPTs. This slide gives an overview of the text analytics components segment and regional analysis for North America, Europe, Asia Pacific, Middle East and Africa, etc.
Mobile With Analytics Chart Ppt PowerPoint Presentation Layouts Graphics
This is a mobile with analytics chart ppt powerpoint presentation layouts graphics. This is a four stage process. The stages in this process are mobile analytics, mobile tracking, mobile web analytics.
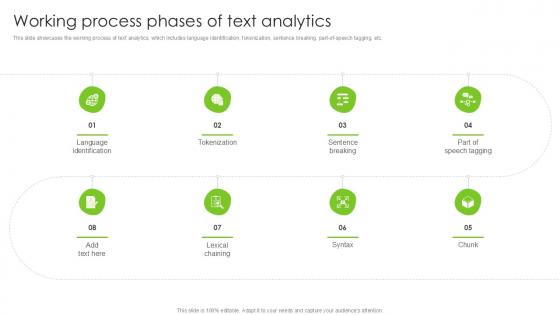
Working Process Phases Of Text Analytics PPT Slide SS
This slide showcases the working process of text analytics, which includes language identification, tokenization, sentence breaking, part-of-speech tagging, etc. Take your projects to the next level with our ultimate collection of Working Process Phases Of Text Analytics PPT Slide SS. Slidegeeks has designed a range of layouts that are perfect for representing task or activity duration, keeping track of all your deadlines at a glance. Tailor these designs to your exact needs and give them a truly corporate look with your own brand colors they will make your projects stand out from the rest This slide showcases the working process of text analytics, which includes language identification, tokenization, sentence breaking, part-of-speech tagging, etc.
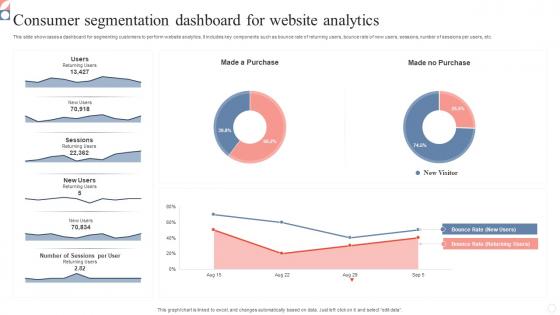
Consumer Segmentation Dashboard For Website Analytics Infographics Pdf
This slide showcases a dashboard for segmenting customers to perform website analytics. It includes key components such as bounce rate of returning users, bounce rate of new users, sessions, number of sessions per users, etc. Pitch your topic with ease and precision using this Consumer Segmentation Dashboard For Website Analytics Infographics Pdf. This layout presents information on Consumer Segmentation Dashboard, Website Analytics, Segmenting Customers. It is also available for immediate download and adjustment. So, changes can be made in the color, design, graphics or any other component to create a unique layout. This slide showcases a dashboard for segmenting customers to perform website analytics. It includes key components such as bounce rate of returning users, bounce rate of new users, sessions, number of sessions per users, etc.
Employee Engagement Analytics Ppt PowerPoint Presentation Layouts Design Templates Cpb
This is a employee engagement analytics ppt powerpoint presentation layouts design templates cpb. This is a two stage process. The stages in this process are employee engagement analytics.
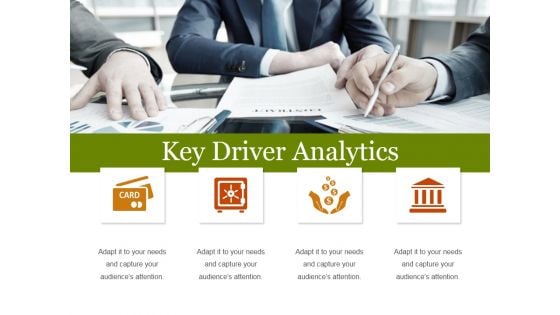
Key Driver Analytics Template 1 Ppt PowerPoint Presentation Gallery Samples
This is a key driver analytics template 1 ppt powerpoint presentation gallery samples. This is a four stage process. The stages in this process are business, icons, management, marketing, strategy, analysis.
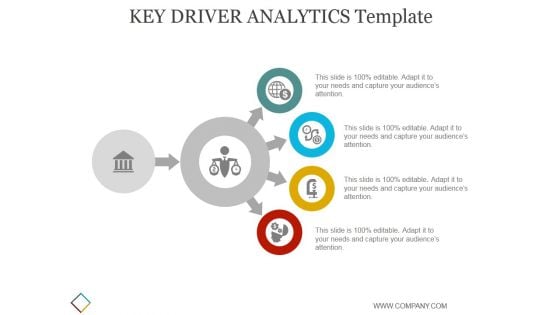
Key Driver Analytics Template 1 Ppt PowerPoint Presentation Shapes
This is a key driver analytics template 1 ppt powerpoint presentation shapes. This is a four stage process. The stages in this process are business, strategy, marketing, analysis, icons, arrow.
Key Driver Analytics Template 2 Ppt PowerPoint Presentation Summary Inspiration
This is a key driver analytics template 2 ppt powerpoint presentation summary inspiration. This is a four stage process. The stages in this process are business, icons, analysis, strategy, marketing.
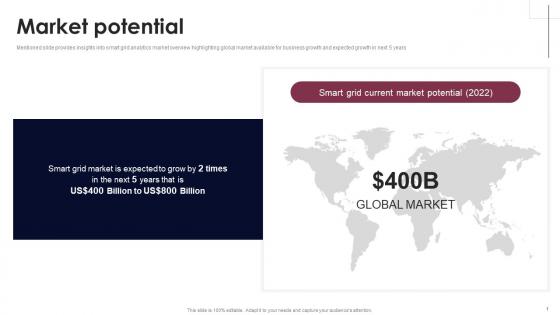
Market Potential Smart Grid Analytics Investor Fund Raising Microsoft PDF
Mentioned slide provides insights into smart grid analytics market overview highlighting global market available for business growth and expected growth in next 5 years. If you are looking for a format to display your unique thoughts, then the professionally designed Market Potential Smart Grid Analytics Investor Fund Raising Microsoft PDF is the one for you. You can use it as a Google Slides template or a PowerPoint template. Incorporate impressive visuals, symbols, images, and other charts. Modify or reorganize the text boxes as you desire. Experiment with shade schemes and font pairings. Alter, share or cooperate with other people on your work. Download Market Potential Smart Grid Analytics Investor Fund Raising Microsoft PDF and find out how to give a successful presentation. Present a perfect display to your team and make your presentation unforgettable. Mentioned slide provides insights into smart grid analytics market overview highlighting global market available for business growth and expected growth in next 5 years.
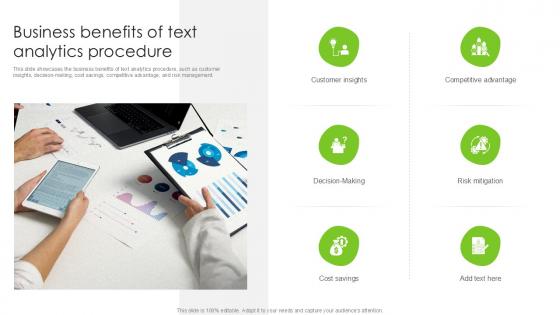
Business Benefits Of Text Analytics Procedure PPT Presentation SS
This slide showcases the business benefits of text analytics procedure, such as customer insights, decision-making, cost savings, competitive advantage, and risk management. If you are looking for a format to display your unique thoughts, then the professionally designed Business Benefits Of Text Analytics Procedure PPT Presentation SS is the one for you. You can use it as a Google Slides template or a PowerPoint template. Incorporate impressive visuals, symbols, images, and other charts. Modify or reorganize the text boxes as you desire. Experiment with shade schemes and font pairings. Alter, share or cooperate with other people on your work. Download Business Benefits Of Text Analytics Procedure PPT Presentation SS and find out how to give a successful presentation. Present a perfect display to your team and make your presentation unforgettable. This slide showcases the business benefits of text analytics procedure, such as customer insights, decision-making, cost savings, competitive advantage, and risk management.
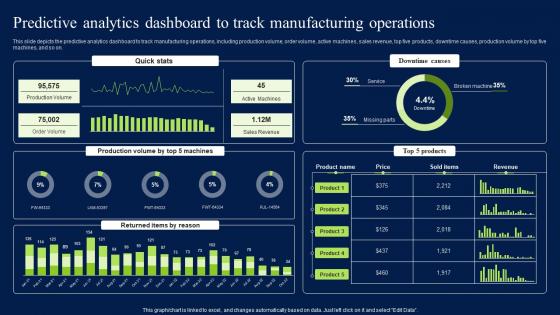
Predictive Analytics Dashboard To Track Manufacturing Operations Download PDF
This slide depicts the predictive analytics dashboard to track manufacturing operations, including production volume, order volume, active machines, sales revenue, top five products, downtime causes, production volume by top five machines, and so on. Present like a pro with Predictive Analytics Dashboard To Track Manufacturing Operations Download PDF Create beautiful presentations together with your team, using our easy-to-use presentation slides. Share your ideas in real-time and make changes on the fly by downloading our templates. So whether you are in the office, on the go, or in a remote location, you can stay in sync with your team and present your ideas with confidence. With Slidegeeks presentation got a whole lot easier. Grab these presentations today. This slide depicts the predictive analytics dashboard to track manufacturing operations, including production volume, order volume, active machines, sales revenue, top five products, downtime causes, production volume by top five machines, and so on.

Complete Guide To Launch Website Analytics Dashboard To Track Performance
This Complete Guide To Launch Website Analytics Dashboard To Track Performance is perfect for any presentation, be it in front of clients or colleagues. It is a versatile and stylish solution for organizing your meetings. The Complete Guide To Launch Website Analytics Dashboard To Track Performance features a modern design for your presentation meetings. The adjustable and customizable slides provide unlimited possibilities for acing up your presentation. Slidegeeks has done all the homework before launching the product for you. So, do not wait, grab the presentation templates today Our Complete Guide To Launch Website Analytics Dashboard To Track Performance are topically designed to provide an attractive backdrop to any subject. Use them to look like a presentation pro.
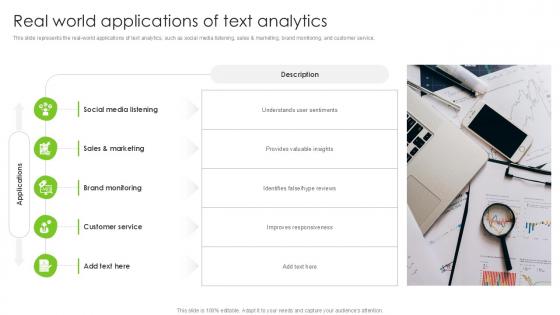
Real World Applications Of Text Analytics PPT Slide SS
This slide represents the real-world applications of text analytics, such as social media listening, sales and marketing, brand monitoring, and customer service. Retrieve professionally designed Real World Applications Of Text Analytics PPT Slide SS to effectively convey your message and captivate your listeners. Save time by selecting pre-made slideshows that are appropriate for various topics, from business to educational purposes. These themes come in many different styles, from creative to corporate, and all of them are easily adjustable and can be edited quickly. Access them as PowerPoint templates or as Google Slides themes. You do not have to go on a hunt for the perfect presentation because Slidegeeks got you covered from everywhere. This slide represents the real-world applications of text analytics, such as social media listening, sales and marketing, brand monitoring, and customer service.
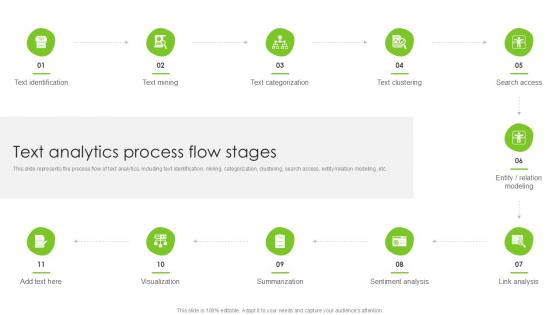
Text Analytics Process Flow Stages PPT Sample SS
This slide represents the process flow of text analytics, including text identification, mining, categorization, clustering, search access, entity relation modeling, etc. Do you know about Slidesgeeks Text Analytics Process Flow Stages PPT Sample SS These are perfect for delivering any kind od presentation. Using it, create PowerPoint presentations that communicate your ideas and engage audiences. Save time and effort by using our pre-designed presentation templates that are perfect for a wide range of topic. Our vast selection of designs covers a range of styles, from creative to business, and are all highly customizable and easy to edit. Download as a PowerPoint template or use them as Google Slides themes. This slide represents the process flow of text analytics, including text identification, mining, categorization, clustering, search access, entity relation modeling, etc.
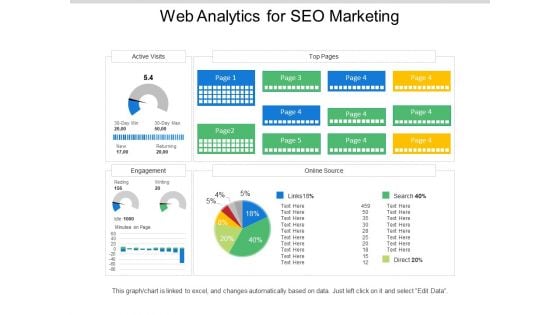
Web Analytics For Seo Marketing Ppt PowerPoint Presentation Examples
This is a web analytics for seo marketing ppt powerpoint presentation examples. This is a five stage process. The stages in this process are digital analytics, digital dashboard, marketing.
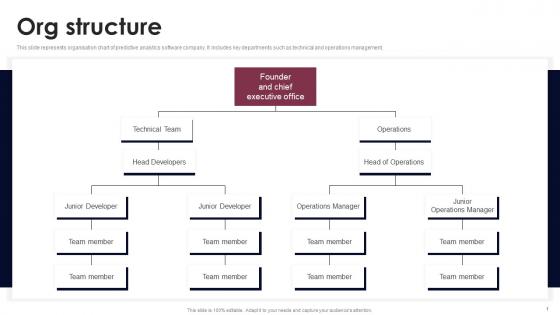
Org Structure Smart Grid Analytics Investor Fund Raising Rules PDF
This slide represents organisation chart of predictive analytics software company. It includes key departments such as technical and operations management. Are you in need of a template that can accommodate all of your creative concepts This one is crafted professionally and can be altered to fit any style. Use it with Google Slides or PowerPoint. Include striking photographs, symbols, depictions, and other visuals. Fill, move around, or remove text boxes as desired. Test out color palettes and font mixtures. Edit and save your work, or work with colleagues. Download Org Structure Smart Grid Analytics Investor Fund Raising Rules PDF and observe how to make your presentation outstanding. Give an impeccable presentation to your group and make your presentation unforgettable. This slide represents organisation chart of predictive analytics software company. It includes key departments such as technical and operations management.
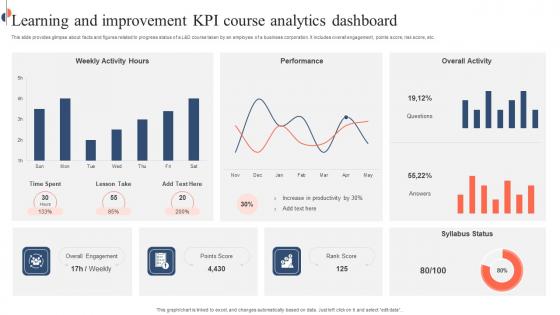
Learning And Improvement KPI Course Analytics Dashboard Inspiration Pdf
This slide provides glimpse about facts and figures related to progress status of a L and D course taken by an employee of a business corporation. It includes overall engagement, points score, risk score, etc. Showcasing this set of slides titled Learning And Improvement KPI Course Analytics Dashboard Inspiration Pdf. The topics addressed in these templates are Learning And Improvement KPI, Course Analytics Dashboard, Risk Score. All the content presented in this PPT design is completely editable. Download it and make adjustments in color, background, font etc. as per your unique business setting. This slide provides glimpse about facts and figures related to progress status of a L and D course taken by an employee of a business corporation. It includes overall engagement, points score, risk score, etc.
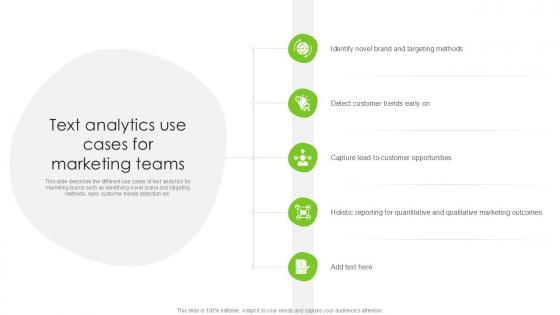
Text Analytics Use Cases For Marketing Teams PPT Sample SS
This slide describes the different use cases of text analytics for marketing teams such as identifying novel brand and targeting methods, early customer trends detection etc. Retrieve professionally designed Text Analytics Use Cases For Marketing Teams PPT Sample SS to effectively convey your message and captivate your listeners. Save time by selecting pre-made slideshows that are appropriate for various topics, from business to educational purposes. These themes come in many different styles, from creative to corporate, and all of them are easily adjustable and can be edited quickly. Access them as PowerPoint templates or as Google Slides themes. You do not have to go on a hunt for the perfect presentation because Slidegeeks got you covered from everywhere. This slide describes the different use cases of text analytics for marketing teams such as identifying novel brand and targeting methods, early customer trends detection etc.
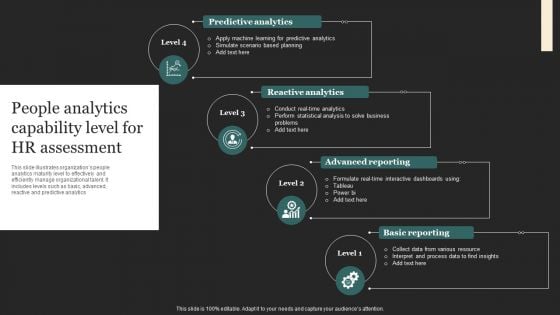
People Analytics Capability Level For HR Assessment Mockup PDF
This slide illustrates organizations people analytics maturity level to effectively and efficiently manage organizational talent. It includes levels such as basic, advanced, reactive and predictive analytics. Presenting People Analytics Capability Level For HR Assessment Mockup PDF to dispense important information. This template comprises four stages. It also presents valuable insights into the topics including Reactive Analytics, Advanced Reporting, Basic Reporting. This is a completely customizable PowerPoint theme that can be put to use immediately. So, download it and address the topic impactfully.
Major Promotional Analytics Future Trends Table Of Contents Structure Pdf
Retrieve professionally designed Major Promotional Analytics Future Trends Table Of Contents Structure Pdf to effectively convey your message and captivate your listeners. Save time by selecting pre made slideshows that are appropriate for various topics, from business to educational purposes. These themes come in many different styles, from creative to corporate, and all of them are easily adjustable and can be edited quickly. Access them as PowerPoint templates or as Google Slides themes. You do not have to go on a hunt for the perfect presentation because Slidegeeks got you covered from everywhere. Our Major Promotional Analytics Future Trends Table Of Contents Structure Pdf are topically designed to provide an attractive backdrop to any subject. Use them to look like a presentation pro.
KPI Dashboard Tracking Major Promotional Analytics Future Trends Rules Pdf
This slide covers the dashboard for analysing paid search metrics such as ad cost, clicks, impressions, click through rate, cost per conversion, conversion rate, cost per click, etc. The KPI Dashboard Tracking Major Promotional Analytics Future Trends Rules Pdf is a compilation of the most recent design trends as a series of slides. It is suitable for any subject or industry presentation, containing attractive visuals and photo spots for businesses to clearly express their messages. This template contains a variety of slides for the user to input data, such as structures to contrast two elements, bullet points, and slides for written information. Slidegeeks is prepared to create an impression. This slide covers the dashboard for analysing paid search metrics such as ad cost, clicks, impressions, click through rate, cost per conversion, conversion rate, cost per click, etc.
Dashboard Tracking Business Major Promotional Analytics Future Trends Clipart Pdf
This slide covers the dashboard for analyzing blogging KPIs such as performance, published posts, views, new blog subscribers, top blog posts by pageviews, top blog posts by CTR, etc. If you are looking for a format to display your unique thoughts, then the professionally designed Dashboard Tracking Business Major Promotional Analytics Future Trends Clipart Pdf is the one for you. You can use it as a Google Slides template or a PowerPoint template. Incorporate impressive visuals, symbols, images, and other charts. Modify or reorganize the text boxes as you desire. Experiment with shade schemes and font pairings. Alter, share or cooperate with other people on your work. Download Dashboard Tracking Business Major Promotional Analytics Future Trends Clipart Pdf and find out how to give a successful presentation. Present a perfect display to your team and make your presentation unforgettable. This slide covers the dashboard for analyzing blogging KPIs such as performance, published posts, views, new blog subscribers, top blog posts by pageviews, top blog posts by CTR, etc.
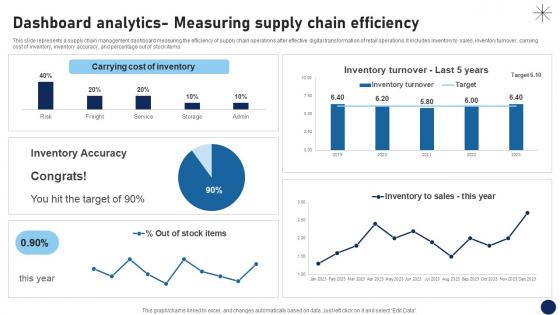
Dashboard Analytics Measuring Supply Chain Efficiency DT SS V
This slide represents a supply chain management dashboard measuring the efficiency of supply chain operations after effective digital transformation of retail operations. It includes inventory to sales, inventory turnover, carrying cost of inventory, inventory accuracy, and percentage out of stock items.If you are looking for a format to display your unique thoughts, then the professionally designed Dashboard Analytics Measuring Supply Chain Efficiency DT SS V is the one for you. You can use it as a Google Slides template or a PowerPoint template. Incorporate impressive visuals, symbols, images, and other charts. Modify or reorganize the text boxes as you desire. Experiment with shade schemes and font pairings. Alter, share or cooperate with other people on your work. Download Dashboard Analytics Measuring Supply Chain Efficiency DT SS V and find out how to give a successful presentation. Present a perfect display to your team and make your presentation unforgettable. This slide represents a supply chain management dashboard measuring the efficiency of supply chain operations after effective digital transformation of retail operations. It includes inventory to sales, inventory turnover, carrying cost of inventory, inventory accuracy, and percentage out of stock items.
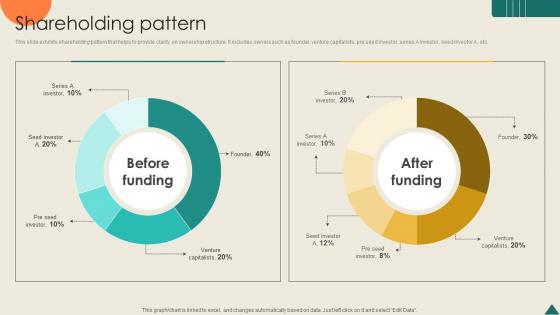
Shareholding Pattern Financial Analytics Platform Investor Elevator Pitch Deck
This slide exhibits shareholding pattern that helps to provide clarity on ownership structure. It includes owners such as founder, venture capitalists, pre seed investor, series A investor, seed investor A, etc. Find highly impressive Shareholding Pattern Financial Analytics Platform Investor Elevator Pitch Deck on Slidegeeks to deliver a meaningful presentation. You can save an ample amount of time using these presentation templates. No need to worry to prepare everything from scratch because Slidegeeks experts have already done a huge research and work for you. You need to download Shareholding Pattern Financial Analytics Platform Investor Elevator Pitch Deck for your upcoming presentation. All the presentation templates are 100 percent editable and you can change the color and personalize the content accordingly. Download now This slide exhibits shareholding pattern that helps to provide clarity on ownership structure. It includes owners such as founder, venture capitalists, pre seed investor, series A investor, seed investor A, etc.
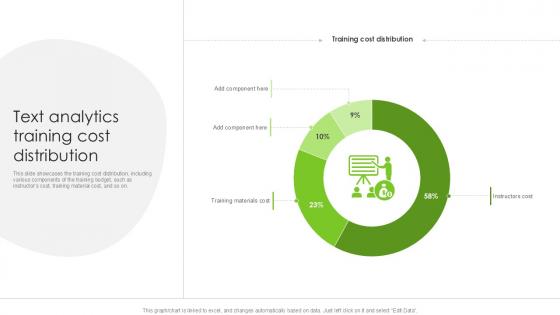
Text Analytics Training Cost Distribution PPT Sample SS
This slide showcases the training cost distribution, including various components of the training budget, such as instructors cost, training material cost, and so on. The Text Analytics Training Cost Distribution PPT Sample SS is a compilation of the most recent design trends as a series of slides. It is suitable for any subject or industry presentation, containing attractive visuals and photo spots for businesses to clearly express their messages. This template contains a variety of slides for the user to input data, such as structures to contrast two elements, bullet points, and slides for written information. Slidegeeks is prepared to create an impression. This slide showcases the training cost distribution, including various components of the training budget, such as instructors cost, training material cost, and so on.
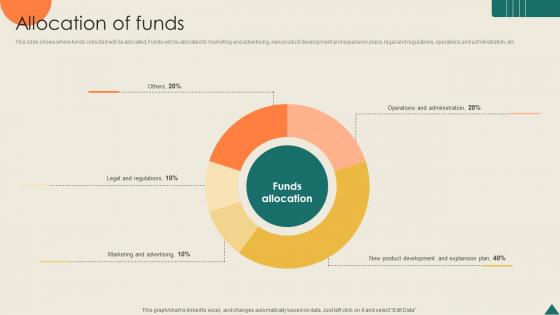
Allocation Of Funds Financial Analytics Platform Investor Elevator Pitch Deck
This slide shows where funds collected will be allocated. Funds will be allocated to marketing and advertising, new product development and expansion plans, legal and regulations, operations and administration, etc. The Allocation Of Funds Financial Analytics Platform Investor Elevator Pitch Deck is a compilation of the most recent design trends as a series of slides. It is suitable for any subject or industry presentation, containing attractive visuals and photo spots for businesses to clearly express their messages. This template contains a variety of slides for the user to input data, such as structures to contrast two elements, bullet points, and slides for written information. Slidegeeks is prepared to create an impression. This slide shows where funds collected will be allocated. Funds will be allocated to marketing and advertising, new product development and expansion plans, legal and regulations, operations and administration, etc.
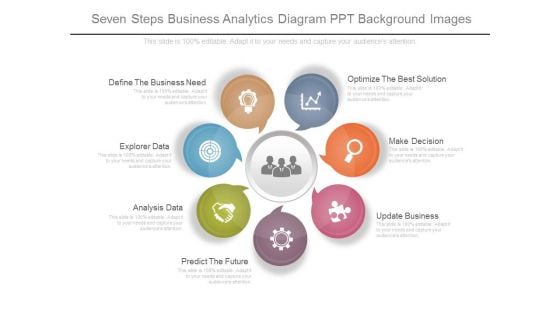
Seven Steps Business Analytics Diagram Ppt Background Images
This is a seven steps business analytics diagram ppt background images. This is a seven stage process. The stages in this process are optimize the best solution, make decision, update business, predict the future, analysis data, explorer data, define the business need.
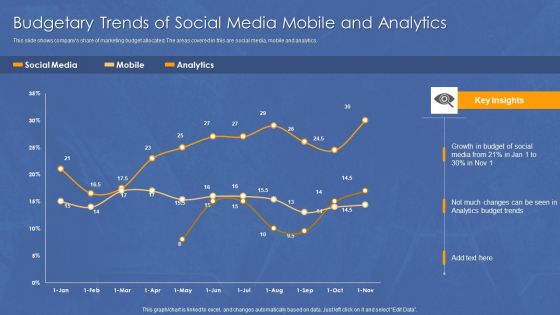
Budgetary Trends Of Social Media Mobile And Analytics Infographics PDF
This slide shows companys share of marketing budget allocated. The areas covered in this are social media, mobile and analytics.Showcasing this set of slides titled Budgetary Trends Of Social Media Mobile And Analytics Infographics PDF. The topics addressed in these templates are Growth Budget, Changes Can, Analytics Budget. All the content presented in this PPT design is completely editable. Download it and make adjustments in color, background, font etc. as per your unique business setting.
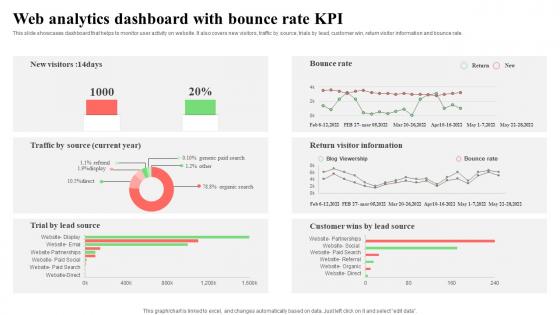
Web Analytics Dashboard With Bounce Rate KPI Elements Pdf
This slide showcases dashboard that helps to monitor user activity on website. It also covers new visitors, traffic by source, trials by lead, customer win, return visitor information and bounce rate. Showcasing this set of slides titled Web Analytics Dashboard With Bounce Rate KPI Elements Pdf. The topics addressed in these templates are Lead, Customer Win, Return Visitor Information. All the content presented in this PPT design is completely editable. Download it and make adjustments in color, background, font etc. as per your unique business setting. This slide showcases dashboard that helps to monitor user activity on website. It also covers new visitors, traffic by source, trials by lead, customer win, return visitor information and bounce rate.
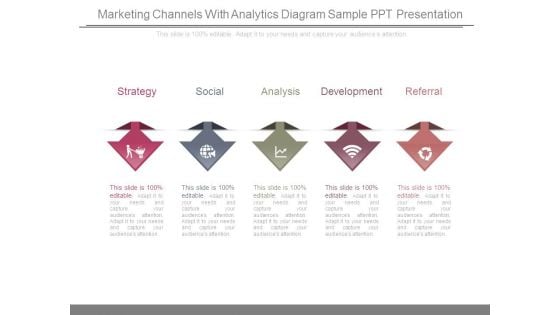
Marketing Channels With Analytics Diagram Sample Ppt Presentation
This is a marketing channels with analytics diagram sample ppt presentation. This is a five stage process. The stages in this process are strategy, social, analysis, development, referral.
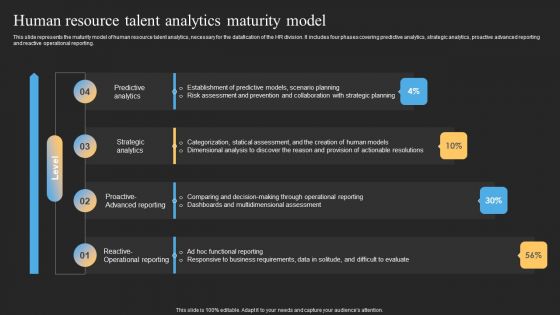
Datafy Human Resource Talent Analytics Maturity Model Microsoft PDF
This slide represents the maturity model of human resource talent analytics, necessary for the datafication of the HR division. It includes four phases covering predictive analytics, strategic analytics, proactive advanced reporting and reactive operational reporting. If your project calls for a presentation, then Slidegeeks is your go-to partner because we have professionally designed, easy-to-edit templates that are perfect for any presentation. After downloading, you can easily edit Datafy Human Resource Talent Analytics Maturity Model Microsoft PDF and make the changes accordingly. You can rearrange slides or fill them with different images. Check out all the handy templates
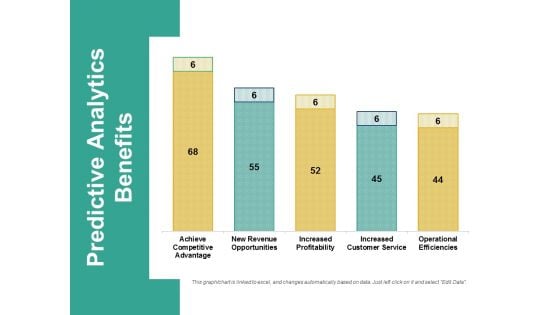
Predictive Analytics Benefits Ppt PowerPoint Presentation Professional Samples
This is a predictive analytics benefits ppt powerpoint presentation professional samples. This is a five stage process. The stages in this process are business, finance, marketing, strategy, analysis.

Edge Computing Analytics Ppt Powerpoint Presentation Complete Deck With Slides
Share a great deal of information on the topic by deploying this Edge Computing Analytics Ppt Powerpoint Presentation Complete Deck With Slides Support your ideas and thought process with this prefabricated set. It includes a set of seventeen slides, all fully modifiable and editable. Each slide can be restructured and induced with the information and content of your choice. You can add or remove large content boxes as well, to make this PPT slideshow more personalized. Its high-quality graphics and visuals help in presenting a well-coordinated pitch. This PPT template is also a resourceful tool to take visual cues from and implement the best ideas to help your business grow and expand. The main attraction of this well-formulated deck is that everything is editable, giving you the freedom to adjust it to your liking and choice. Changes can be made in the background and theme as well to deliver an outstanding pitch. Therefore, click on the download button now to gain full access to this multifunctional set. Our Edge Computing Analytics Ppt Powerpoint Presentation Complete Deck With Slides are topically designed to provide an attractive backdrop to any subject. Use them to look like a presentation pro.
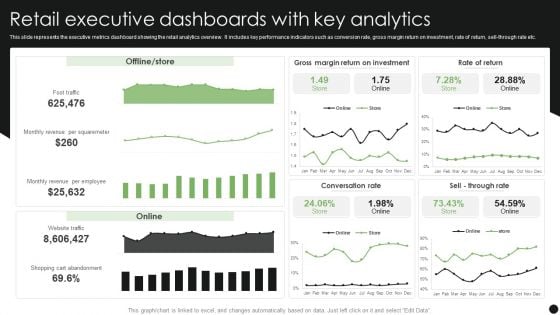
Retail Executive Dashboards With Key Analytics Guidelines PDF
Pitch your topic with ease and precision using this Retail Executive Dashboards With Key Analytics Guidelines PDF. This layout presents information on Retail Executive Dashboards, Key Analytics. It is also available for immediate download and adjustment. So, changes can be made in the color, design, graphics or any other component to create a unique layout.
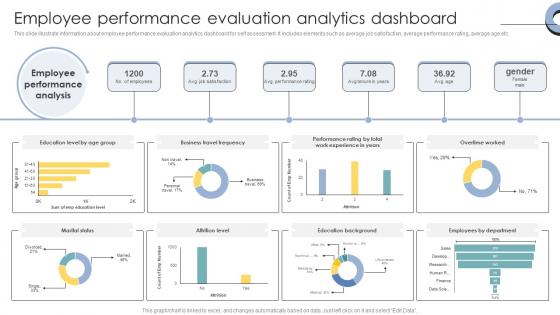
Skill Enhancement Performance Employee Performance Evaluation Analytics Dashboard
This slide illustrate information about employee performance evaluation analytics dashboard for self assessment. It includes elements such as average job satisfaction, average performance rating, average age etc. Presenting this PowerPoint presentation, titled Skill Enhancement Performance Employee Performance Evaluation Analytics Dashboard, with topics curated by our researchers after extensive research. This editable presentation is available for immediate download and provides attractive features when used. Download now and captivate your audience. Presenting this Skill Enhancement Performance Employee Performance Evaluation Analytics Dashboard. Our researchers have carefully researched and created these slides with all aspects taken into consideration. This is a completely customizable Skill Enhancement Performance Employee Performance Evaluation Analytics Dashboard that is available for immediate downloading. Download now and make an impact on your audience. Highlight the attractive features available with our PPTs. This slide illustrate information about employee performance evaluation analytics dashboard for self assessment. It includes elements such as average job satisfaction, average performance rating, average age etc.
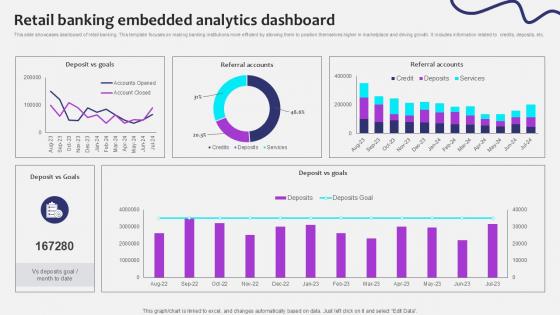
Retail Banking Embedded Analytics Initiating Globalization Of Banking Ppt Powerpoint
This slide showcases dashboard of retail banking. This template focuses on making banking institutions more efficient by allowing them to position themselves higher in marketplace and driving growth. It includes information related to credits, deposits, etc. Are you searching for a Retail Banking Embedded Analytics Initiating Globalization Of Banking Ppt Powerpoint that is uncluttered, straightforward, and original Its easy to edit, and you can change the colors to suit your personal or business branding. For a presentation that expresses how much effort you have put in, this template is ideal With all of its features, including tables, diagrams, statistics, and lists, its perfect for a business plan presentation. Make your ideas more appealing with these professional slides. Download Retail Banking Embedded Analytics Initiating Globalization Of Banking Ppt Powerpoint from Slidegeeks today. This slide showcases dashboard of retail banking. This template focuses on making banking institutions more efficient by allowing them to position themselves higher in marketplace and driving growth. It includes information related to credits, deposits, etc.
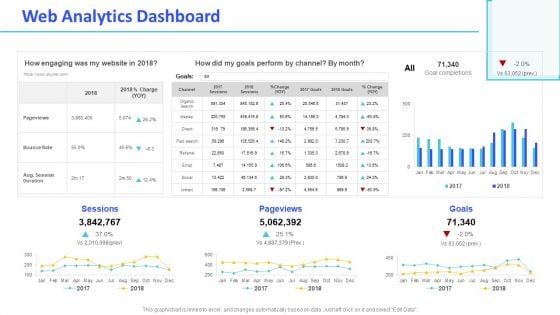
Monthly Digital Marketing Report Template Web Analytics Dashboard Mockup PDF
Deliver and pitch your topic in the best possible manner with this monthly digital marketing report template web analytics dashboard mockup pdf. Use them to share invaluable insights on web analytics dashboard and impress your audience. This template can be altered and modified as per your expectations. So, grab it now.
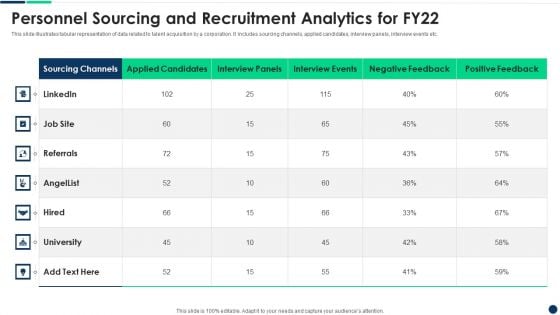
Personnel Sourcing And Recruitment Analytics For FY22 Diagrams PDF
Pitch your topic with ease and precision using this Personnel Sourcing And Recruitment Analytics For FY22 Diagrams PDF This layout presents information on Personnel Sourcing And Recruitment Analytics For Fy22 It is also available for immediate download and adjustment. So, changes can be made in the color, design, graphics or any other component to create a unique layout.
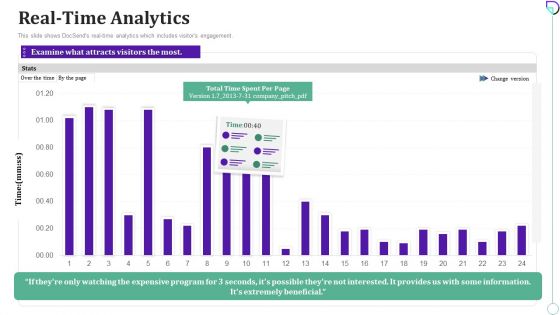
Docsend Capital Raising Pitch Deck Real Time Analytics Pictures PDF
This slide shows DocSends real time analytics which includes visitors engagement.Deliver and pitch your topic in the best possible manner with this Docsend Capital Raising Pitch Deck Real Time Analytics Pictures PDF Use them to share invaluable insights on Expensive Program, Extremely Beneficial, Provides Information and impress your audience. This template can be altered and modified as per your expectations. So, grab it now.
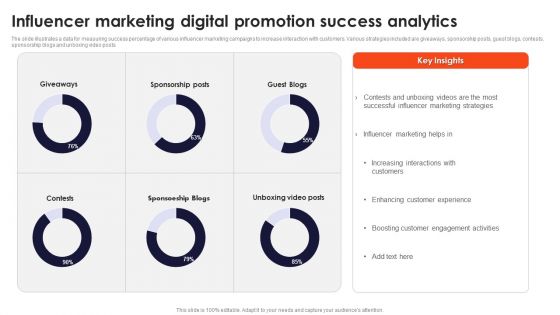
Influencer Marketing Digital Promotion Success Analytics Structure PDF
Pitch your topic with ease and precision using this Influencer Marketing Digital Promotion Success Analytics Structure PDF. This layout presents information on Digital Promotion, Success Analytics. It is also available for immediate download and adjustment. So, changes can be made in the color, design, graphics or any other component to create a unique layout.
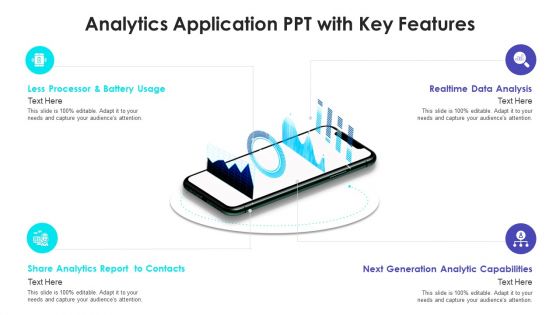
Analytics Application PPT With Key Features Infographics PDF
Presenting analytics application ppt with key features infographics pdf to dispense important information. This template comprises four stages. It also presents valuable insights into the topics including analytics application ppt with key features. This is a completely customizable PowerPoint theme that can be put to use immediately. So, download it and address the topic impactfully.
Agenda Checklist Infographic For Predictive Analytics Promotions Infographics PDF
Presenting agenda checklist infographic for predictive analytics promotions infographics pdf to dispense important information. This template comprises three stages. It also presents valuable insights into the topics including agenda checklist infographic for predictive analytics promotions. This is a completely customizable PowerPoint theme that can be put to use immediately. So, download it and address the topic impactfully.
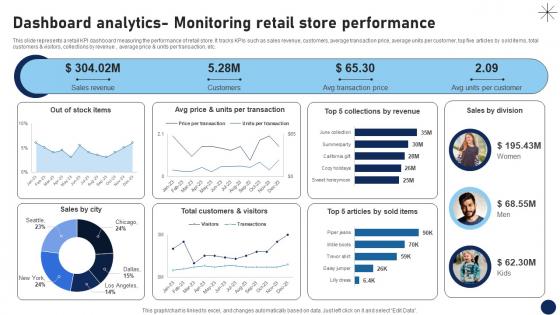
Dashboard Analytics Monitoring Retail Store Performance DT SS V
This slide represents a retail KPI dashboard measuring the performance of retail store. It tracks KPIs such as sales revenue, customers, average transaction price, average units per customer, top five articles by sold items, total customers and visitors, collections by revenue , average price and units per transaction, etc.Are you in need of a template that can accommodate all of your creative concepts This one is crafted professionally and can be altered to fit any style. Use it with Google Slides or PowerPoint. Include striking photographs, symbols, depictions, and other visuals. Fill, move around, or remove text boxes as desired. Test out color palettes and font mixtures. Edit and save your work, or work with colleagues. Download Dashboard Analytics Monitoring Retail Store Performance DT SS V and observe how to make your presentation outstanding. Give an impeccable presentation to your group and make your presentation unforgettable. This slide represents a retail KPI dashboard measuring the performance of retail store. It tracks KPIs such as sales revenue, customers, average transaction price, average units per customer, top five articles by sold items, total customers and visitors, collections by revenue , average price and units per transaction, etc.
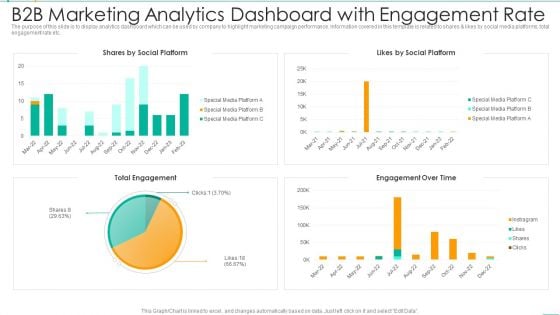
B2b Marketing Analytics Dashboard With Engagement Rate Microsoft PDF
The purpose of this slide is to display analytics dashboard which can be used by company to highlight marketing campaign performance. Information covered in this template is related to shares and likes by social media platforms, total engagement rate etc. Showcasing this set of slides titled B2b Marketing Analytics Dashboard With Engagement Rate Microsoft PDF. The topics addressed in these templates are B2b Marketing Analytics Dashboard With Engagement Rate. All the content presented in this PPT design is completely editable. Download it and make adjustments in color, background, font etc. as per your unique business setting.
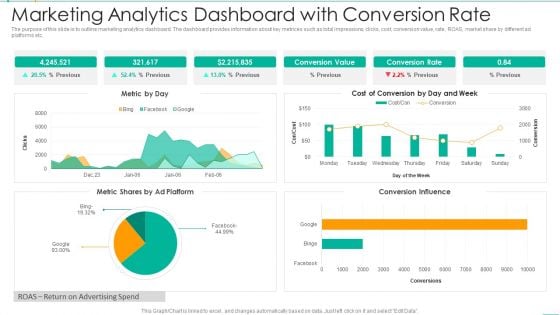
Marketing Analytics Dashboard With Conversion Rate Summary PDF
The purpose of this slide is to outline marketing analytics dashboard. The dashboard provides information about key metrices such as total impressions, clicks, cost, conversion value, rate, ROAS, market share by different ad platforms etc. Pitch your topic with ease and precision using this Marketing Analytics Dashboard With Conversion Rate Summary PDF. This layout presents information on Marketing Analytics Dashboard With Conversion Rate. It is also available for immediate download and adjustment. So, changes can be made in the color, design, graphics or any other component to create a unique layout.
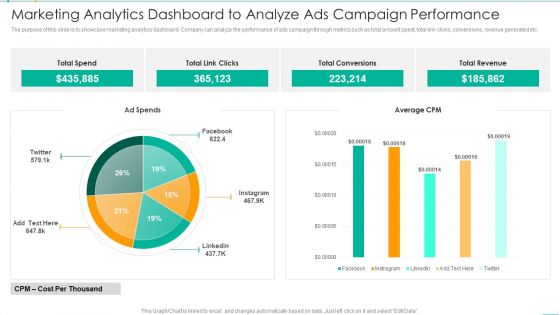
Marketing Analytics Dashboard To Analyze Ads Campaign Performance Microsoft PDF
The purpose of this slide is to showcase marketing analytics dashboard. Company can analyze the performance of ads campaign through metrics such as total amount spent, total link clicks, conversions, revenue generated etc. Showcasing this set of slides titled Marketing Analytics Dashboard To Analyze Ads Campaign Performance Microsoft PDF. The topics addressed in these templates are Marketing Analytics Dashboard To Analyze Ads Campaign Performance. All the content presented in this PPT design is completely editable. Download it and make adjustments in color, background, font etc. as per your unique business setting.
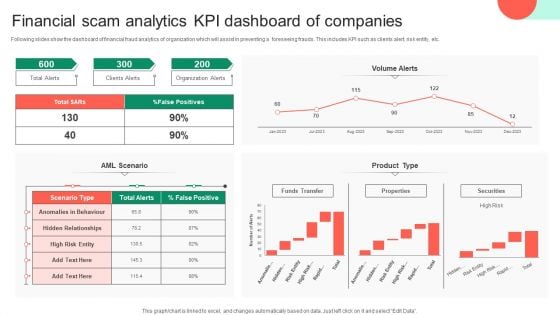
Financial Scam Analytics KPI Dashboard Of Companies Clipart PDF
Following slides show the dashboard of financial fraud analytics of organization which will assist in preventing a foreseeing frauds. This includes KPI such as clients alert, risk entity, etc. Pitch your topic with ease and precision using this Financial Scam Analytics KPI Dashboard Of Companies Clipart PDF. This layout presents information on Financial Scam Analytics, Kpi Dashboard Of Companies. It is also available for immediate download and adjustment. So, changes can be made in the color, design, graphics or any other component to create a unique layout.

Dashboard For Monthly Recruitment Metrics And Analytics Themes PDF
The slide depicts the dashboard for monthly recruitment metrics and analytics depicting monthly recruitment, recruitment by department and source, candidate feedback and offer acceptance rate.Showcasing this set of slides titled Dashboard For Monthly Recruitment Metrics And Analytics Themes PDF The topics addressed in these templates are Recruitment Department, Recruitment Source, Interview Activity All the content presented in this PPT design is completely editable. Download it and make adjustments in color, background, font etc. as per your unique business setting.
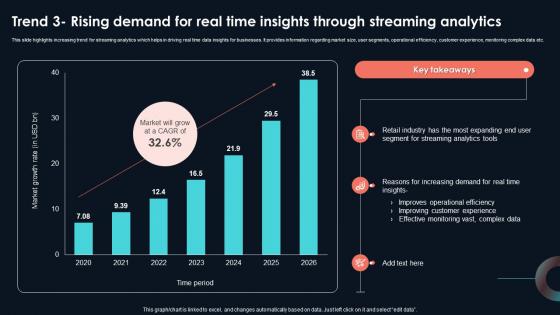
Trend 3 Rising Demand For Real Time Insights Developing Strategic Insights Using Big Data Analytics SS V
This slide highlights increasing trend for streaming analytics which helps in driving real time data insights for businesses. It provides information regarding market size, user segments, operational efficiency, customer experience, monitoring complex data etc. Take your projects to the next level with our ultimate collection of Trend 3 Rising Demand For Real Time Insights Developing Strategic Insights Using Big Data Analytics SS V. Slidegeeks has designed a range of layouts that are perfect for representing task or activity duration, keeping track of all your deadlines at a glance. Tailor these designs to your exact needs and give them a truly corporate look with your own brand colors they will make your projects stand out from the rest This slide highlights increasing trend for streaming analytics which helps in driving real time data insights for businesses. It provides information regarding market size, user segments, operational efficiency, customer experience, monitoring complex data etc.
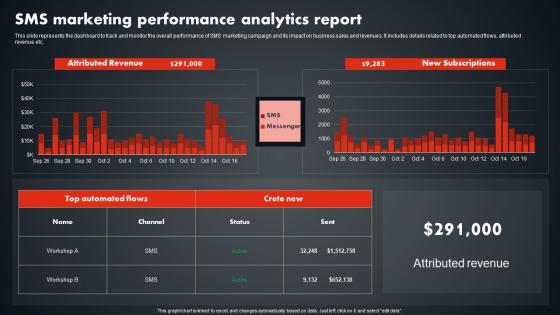
SMS Marketing Performance Analytics Report SMS Promotional Tactics Structure PDF
This slide represents the dashboard to track and monitor the overall performance of SMS marketing campaign and its impact on business sales and revenues. It includes details related to top automated flows, attributed revenue etc. From laying roadmaps to briefing everything in detail, our templates are perfect for you. You can set the stage with your presentation slides. All you have to do is download these easy-to-edit and customizable templates. SMS Marketing Performance Analytics Report SMS Promotional Tactics Structure PDF will help you deliver an outstanding performance that everyone would remember and praise you for. Do download this presentation today. This slide represents the dashboard to track and monitor the overall performance of SMS marketing campaign and its impact on business sales and revenues. It includes details related to top automated flows, attributed revenue etc.
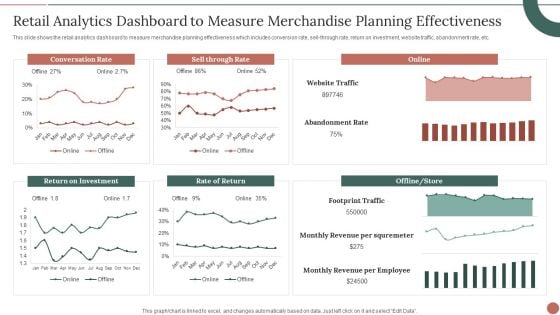
Retail Analytics Dashboard To Measure Merchandise Planning Effectiveness Information PDF
This slide shows the retail analytics dashboard to measure merchandise planning effectiveness which includes conversion rate, sell through rate, return on investment, website traffic, abandonment rate, etc. Deliver an awe inspiring pitch with this creative Retail Analytics Dashboard To Measure Merchandise Planning Effectiveness Information PDF bundle. Topics like Return On Investment, Conversation Rate, Rate Of Return can be discussed with this completely editable template. It is available for immediate download depending on the needs and requirements of the user.
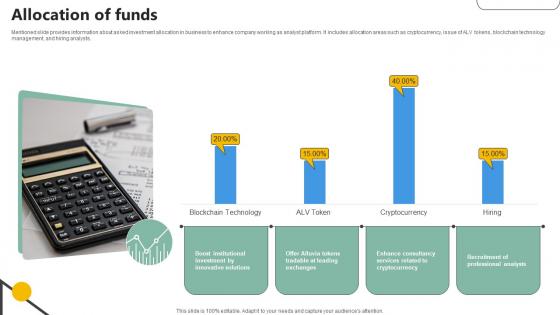
Allocation Of Funds Analytics Company Investor Funding Elevator
Mentioned slide provides information about asked investment allocation in business to enhance company working as analyst platform. It includes allocation areas such as cryptocurrency, issue of ALV tokens, blockchain technology management, and hiring analysts.Find a pre-designed and impeccable Allocation Of Funds Analytics Company Investor Funding Elevator. The templates can ace your presentation without additional effort. You can download these easy-to-edit presentation templates to make your presentation stand out from others. So, what are you waiting for Download the template from Slidegeeks today and give a unique touch to your presentation. Mentioned slide provides information about asked investment allocation in business to enhance company working as analyst platform. It includes allocation areas such as cryptocurrency, issue of ALV tokens, blockchain technology management, and hiring analysts.
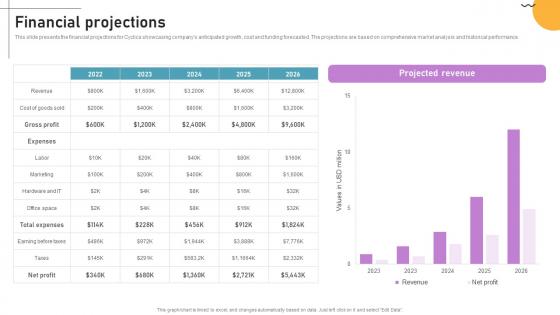
Financial Projections Cloud Based Predictive Analytics Software Pitch Deck
This slide presents the financial projections for Cyclica showcasing companys anticipated growth, cost and funding forecasted. The projections are based on comprehensive market analysis and historical performance. Present like a pro with Financial Projections Cloud Based Predictive Analytics Software Pitch Deck. Create beautiful presentations together with your team, using our easy-to-use presentation slides. Share your ideas in real-time and make changes on the fly by downloading our templates. So whether you are in the office, on the go, or in a remote location, you can stay in sync with your team and present your ideas with confidence. With Slidegeeks presentation got a whole lot easier. Grab these presentations today. This slide presents the financial projections for Cyclica showcasing companys anticipated growth, cost and funding forecasted. The projections are based on comprehensive market analysis and historical performance.
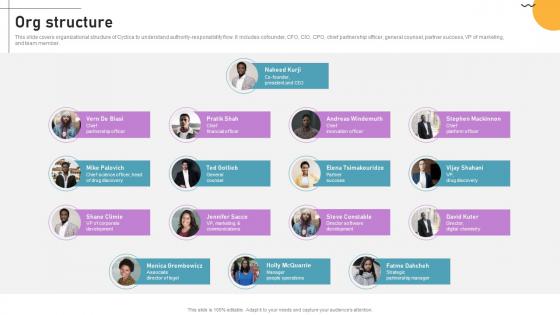
Org Structure Cloud Based Predictive Analytics Software Pitch Deck
This slide covers organizational structure of Cyclica to understand authority-responsibility flow. It includes cofounder, CFO, CIO, CPO, chief partnership officer, general counsel, partner success, VP of marketing, and team member. Are you in need of a template that can accommodate all of your creative concepts This one is crafted professionally and can be altered to fit any style. Use it with Google Slides or PowerPoint. Include striking photographs, symbols, depictions, and other visuals. Fill, move around, or remove text boxes as desired. Test out color palettes and font mixtures. Edit and save your work, or work with colleagues. Download Org Structure Cloud Based Predictive Analytics Software Pitch Deck and observe how to make your presentation outstanding. Give an impeccable presentation to your group and make your presentation unforgettable. This slide covers organizational structure of Cyclica to understand authority-responsibility flow. It includes cofounder, CFO, CIO, CPO, chief partnership officer, general counsel, partner success, VP of marketing, and team member.
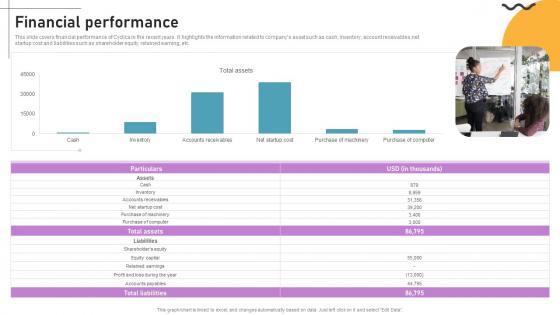
Financial Performance Cloud Based Predictive Analytics Software Pitch Deck
This slide covers financial performance of Cyclica in the recent years. It highlights the information related to companys asset such as cash, inventory, account receivables,net startup cost and liabilities such as shareholder equity, retained earning, etc. From laying roadmaps to briefing everything in detail, our templates are perfect for you. You can set the stage with your presentation slides. All you have to do is download these easy-to-edit and customizable templates. Financial Performance Cloud Based Predictive Analytics Software Pitch Deck will help you deliver an outstanding performance that everyone would remember and praise you for. Do download this presentation today. This slide covers financial performance of Cyclica in the recent years. It highlights the information related to companys asset such as cash, inventory, account receivables,net startup cost and liabilities such as shareholder equity, retained earning, etc.
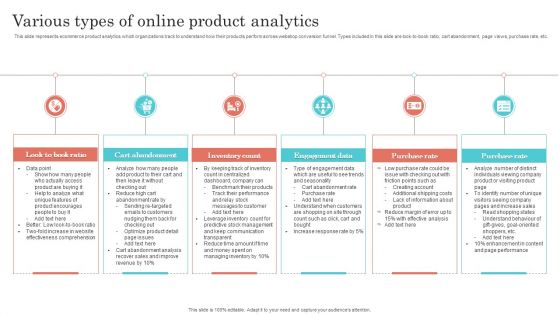
Various Types Of Online Product Analytics Diagrams PDF
This slide represents ecommerce product analytics which organizations track to understand how their products perform across webshop conversion funnel. Types included in this slide are look-to-book ratio, cart abandonment, page views, purchase rate, etc. Persuade your audience using this Various Types Of Online Product Analytics Diagrams PDF. This PPT design covers six stages, thus making it a great tool to use. It also caters to a variety of topics including Cart Abandonment, Inventory Count, Engagement Data. Download this PPT design now to present a convincing pitch that not only emphasizes the topic but also showcases your presentation skills.

Strategic B2B Marketing Agency Rollout Communication Plan Analytics Background PDF
This slide consists of a dashboard that can be used by marketing agencies for monitoring the success of client marketing strategy. Key performing indicators included in the slide are top rankings, google analytics, website audit, etc. Showcasing this set of slides titled Strategic B2B Marketing Agency Rollout Communication Plan Analytics Background PDF. The topics addressed in these templates are Top Ranking, Google Analytics, Website Audit. All the content presented in this PPT design is completely editable. Download it and make adjustments in color, background, font etc. as per your unique business setting.

 Home
Home