Data Architecture Diagram
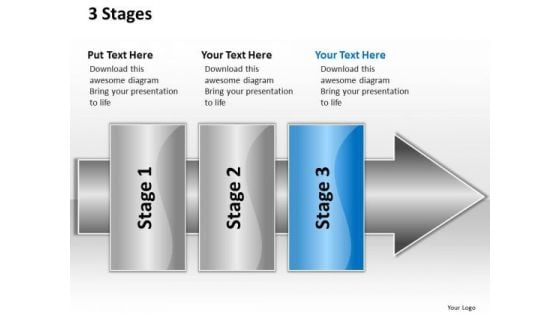
Ppt Linear Flow 3 Stages1 PowerPoint Templates
PPT linear flow 3 stages1 PowerPoint Templates-This PowerPoint Diagram can be used to represent worldwide business issues such as financial data, stock market Exchange, increase in sales, corporate presentations and more. It illustrates the blue component of this worldwide PowerPoint Diagram.-PPT linear flow 3 stages1 PowerPoint Templates-Abstract, Arrow, Blank, Business, Chart, Circular, Circulation, Concept, Conceptual, Design, Diagram, Executive, Icon, Idea, Illustration, Management, Model, Numbers, Organization, Procedure, Process, Progression, Resource, Sequence, Sequential, 3Stages, Steps, Strategy Finalise plans with our Ppt Linear Flow 3 Stages1 PowerPoint Templates. Give the final touch to your thoughts.
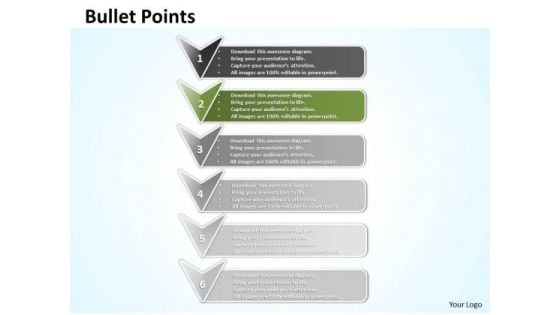
Ppt Arrows PowerPoint 2010 Pointing Vertical Downwards Templates
PPT arrows powerpoint 2010 pointing vertical downwards Templates-Arrows PowerPoint Diagram is nice for financial PowerPoint Diagram presentations as well as other analysis or business PowerPoint diagram needs. Use this graphical approach to represent global business issues such as financial data, stock market Exchange, increase in sales, corporate presentations and more.-PPT arrows powerpoint 2010 pointing vertical downwards Templates-advertising, arrow, bend, black, blue, bookmark, business, collection, control, corner, curl, customer, design, down, element, gold, green, icon, illustration, label, mark, marketing, message, new, origami, paper, product, service, set, shadow, shiny, shop, sign, site, sticker, symbol, tag Take care of your organizationwith our Ppt Arrows PowerPoint 2010 Pointing Vertical Downwards Templates. You'll deliver your best presentation yet.
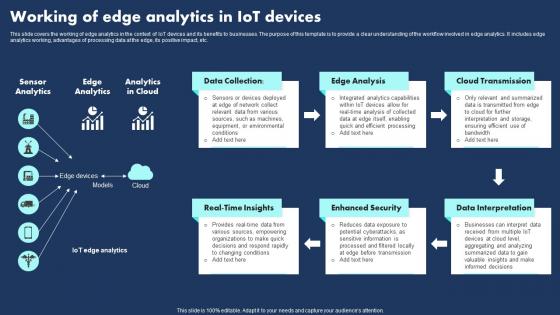
Working Of Edge Analytics In Iot Devices Themes Pdf
This slide covers the working of edge analytics in the context of IoT devices and its benefits to businesses. The purpose of this template is to provide a clear understanding of the workflow involved in edge analytics. It includes edge analytics working, advantages of processing data at the edge, its positive impact, etc.Showcasing this set of slides titled Working Of Edge Analytics In Iot Devices Themes Pdf The topics addressed in these templates are Enhanced Security, Data Interpretation, Cloud Transmission All the content presented in this PPT design is completely editable. Download it and make adjustments in color, background, font etc. as per your unique business setting. This slide covers the working of edge analytics in the context of IoT devices and its benefits to businesses. The purpose of this template is to provide a clear understanding of the workflow involved in edge analytics. It includes edge analytics working, advantages of processing data at the edge, its positive impact, etc.
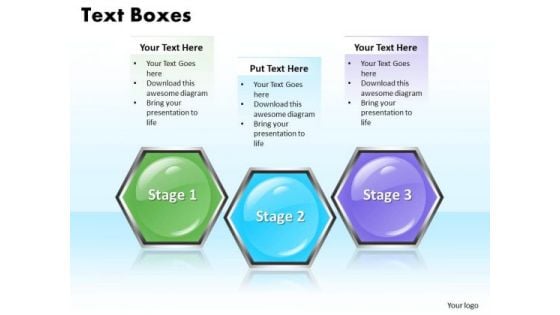
Ppt Colorful Hexagonal Text Align Boxes PowerPoint 2010 3 Process Templates
PPT colorful hexagonal text align boxes powerpoint 2010 3 process Templates-This Diagram makes information accessible throughout the organization with a collective, visible view of critical data from different perspectives and providing the tools to upcoming business scenarios and plan for change. This image has been professionally designed to emphasize the concept of sequential process using hexagonal boxes. It consists of three colorful hexagonal text boxes. -PPT colorful hexagonal text align boxes powerpoint 2010 3 process Templates-3d, Abstract, Art, Background, Clip, Clipart, Comb, Concept, Connected, Connection, Design, Different, Drawings, Graphics, Group, Hexagon, Honey, Honeycomb, Illustration, Pictures, Solution, Teamwork Assess consumer choices with our Ppt Colorful Hexagonal Text Align Boxes PowerPoint 2010 3 Process Templates. Get an idea of their buying patterns.
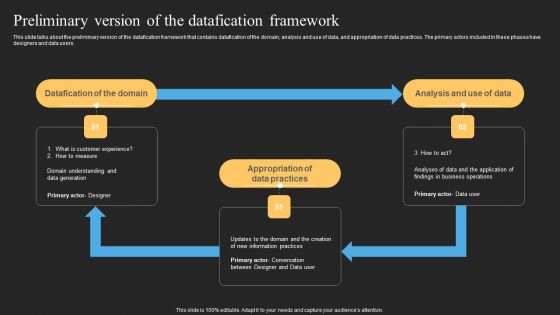
Datafy Preliminary Version Of The Datafication Framework Portrait PDF
This slide talks about the preliminary version of the datafication framework that contains datafication of the domain, analysis and use of data, and appropriation of data practices. The primary actors included in these phases have designers and data users. Are you searching for a Datafy Preliminary Version Of The Datafication Framework Portrait PDF that is uncluttered, straightforward, and original. Its easy to edit, and you can change the colors to suit your personal or business branding. For a presentation that expresses how much effort youve put in, this template is ideal With all of its features, including tables, diagrams, statistics, and lists, its perfect for a business plan presentation. Make your ideas more appealing with these professional slides. Download Datafy Preliminary Version Of The Datafication Framework Portrait PDF from Slidegeeks today.

Concept Of Locked Money Finance PowerPoint Templates And PowerPoint Themes 1012
Concept Of Locked Money Finance PowerPoint Templates And PowerPoint Themes 1012-Develop competitive advantage with our above template which contains a diagram of 3d money and lock. This image signifies the concept of data security. This image has been conceived to enable you to emphatically communicate your ideas in your Business and Financial PPT presentations on finance, protection and banking. Our PPT images are so perfectly designed that it reveals the very basis of our PPT template to make your clients understand.-Concept Of Locked Money Finance PowerPoint Templates And PowerPoint Themes 1012-This PowerPoint template can be used for presentations relating to-Money and lock, security, success, money, finance, business Describe your path to success with our Concept Of Locked Money Finance PowerPoint Templates And PowerPoint Themes 1012. You will come out on top.
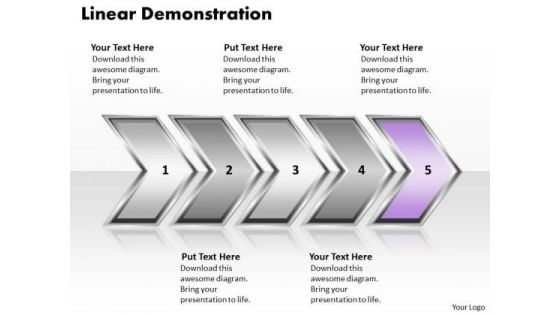
Ppt Linear Demonstration Of Process Using PowerPoint Graphics Arrows Templates
PPT linear demonstration of process using powerpoint graphics arrows Templates-This Diagram makes information accessible throughout the organization with a collective, visible view of critical data from different perspectives and providing the tools to upcoming business scenarios and plan for change. This image has been professionally designed to emphasize the concept of sequential process using curved arrows. It represents the Fifth arrow using purple color.-PPT linear demonstration of process using powerpoint graphics arrows Templates-Aim, Arrow, Arrowheads, Badge, Border, Click, Connection, Curve, Design, Direction, Download, Element, Fuchsia, Icon, Illustration, Indicator, Internet, Magenta, Mark, Object, Orientation, Pointer, Shadow, Shape, Sign Court the audience with our Ppt Linear Demonstration Of Process Using PowerPoint Graphics Arrows Templates. They will certainly be bowled over by you.
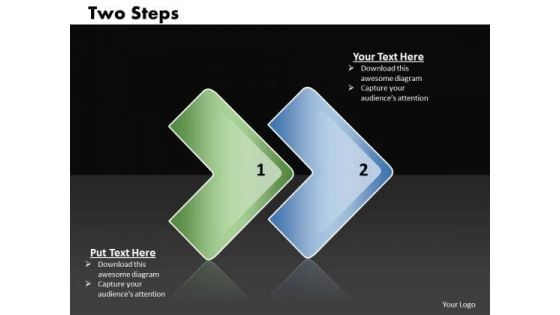
Ppt Linear Way To Represent 2 Practice The PowerPoint Macro Steps Templates
PPT linear way to represent 2 practice the powerpoint macro steps Templates-This Diagram makes information accessible throughout the organization with a collective, visible view of critical data from different perspectives and providing the tools to upcoming business scenarios and plan for change. This image has been professionally designed to emphasize the concept of sequential process using vertical arrows.-PPT linear way to represent 2 practice the powerpoint macro steps Templates-Aim, Arrow, Arrowheads, Badge, Border, Click, Connection, Curve, Design, Direction, Download, Element, Fuchsia, Icon, Illustration, Indicator, Internet, Magenta, Mark, Object, Orientation, Pointer, Shadow, Shape, Sign Our Ppt Linear Way To Represent 2 Practice The PowerPoint Macro Steps Templates are exceptionally customer-centric. They put clients before everything else.
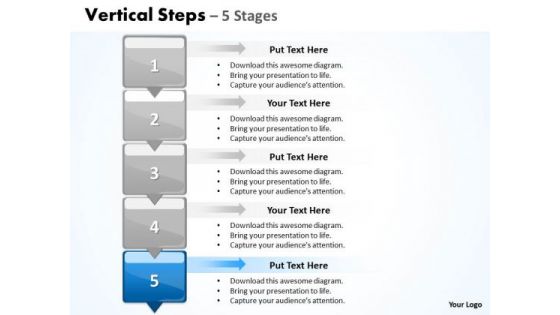
Usa Ppt Background Vertical PowerPoint Slide Numbers 5 Business Plan 6 Image
USA PPT Background vertical powerpoint slide numbers 5 business plan 6 Image-You can use this diagram to create an overview of the system or a structured design of data processing. Drive home your reasons and chart the path ahead to arrive at tour destination and achieve the goal.-USA PPT Background vertical powerpoint slide numbers 5 business plan 6 Image-Advertising, Arrow, Background, Blue, Bookmark, Card, Choice, Concept, Corporate, Creative, Design, Flow, Graphic, Illustration, Instruction, Label, Layout, Manual, Modern, Number, Options, Order, Page, Paper, Product, Progress, Progress, Concept, Progress, Report, Promotion, Sequence, Special, Step, Symbol Double your growth with our Usa Ppt Background Vertical PowerPoint Slide Numbers 5 Business Plan 6 Image. Download without worries with our money back guaranteee.
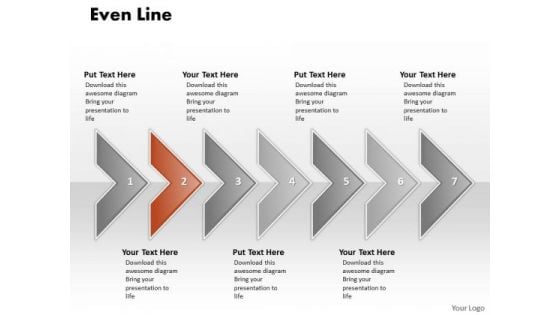
Ppt Correlated Arrows PowerPoint Templates Even Line 7 Stages
PPT correlated arrows powerpoint templates even line 7 stages-This Diagram is used to illustrate how information will move between interrelated systems in the accomplishment of a given function, task or process. The visual description of this information flow with each given level showing how data is fed into a given process step and subsequently passed along at the completion of that step.-PPT correlated arrows powerpoint templates even line 7 stages-Aim, Arrow, Badge, Border, Color, Connection, Curve, Design, Direction, Download, Icon, Illustration, Indicator, Internet, Label, Link, Magenta, Mark, Next, Object, Orientation, Paper, Peeling, Pointer, Rounded, Set, Shadow, Shape, Sign Let your ideas grow in their minds. Our Ppt Correlated Arrows PowerPoint Templates Even Line 7 Stages will act like a fertilizer.
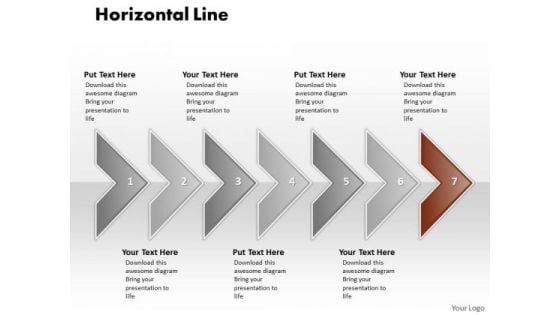
Ppt Correlated Circular Arrows PowerPoint 2010 Horizontal Line 7 Stages Templates
PPT correlated circular arrows powerpoint 2010 horizontal line 7 stages Templates-This Diagram is used to illustrate how information will move between interrelated systems in the accomplishment of a given function, task or process. The visual description of this information flow with each given level showing how data is fed into a given process step and subsequently passed along at the completion of that step.-PPT correlated circular arrows powerpoint 2010 horizontal line 7 stages Templates-Aim, Arrow, Badge, Border, Color, Connection, Curve, Design, Direction, Download, Icon, Illustration, Indicator, Internet, Label, Link, Magenta, Mark, Next, Object, Orientation, Paper, Peeling, Pointer, Rounded, Set, Shadow, Shape, Sign Pioneer changes with our Ppt Correlated Circular Arrows PowerPoint 2010 Horizontal Line 7 Stages Templates. Download without worries with our money back guaranteee.
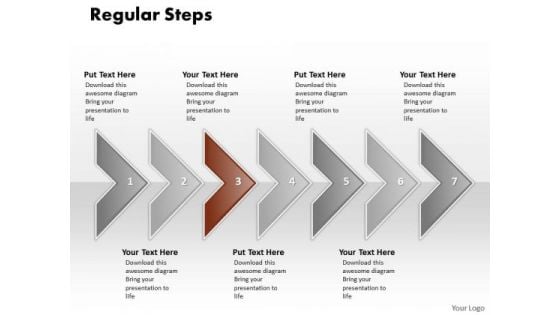
Ppt Correlated Curved Arrows PowerPoint 2010 Regular Line 7 Stages Templates
PPT correlated curved arrows powerpoint 2010 regular line 7 stages Templates-This Diagram is used to illustrate how information will move between interrelated systems in the accomplishment of a given function, task or process. The visual description of this information flow with each given level showing how data is fed into a given process step and subsequently passed along at the completion of that step.-PPT correlated curved arrows powerpoint 2010 regular line 7 stages Templates-Aim, Arrow, Badge, Border, Color, Connection, Curve, Design, Direction, Download, Icon, Illustration, Indicator, Internet, Label, Link, Magenta, Mark, Next, Object, Orientation, Paper, Peeling, Pointer, Rounded, Set, Shadow, Shape, Sign Examine every deatail with our Ppt Correlated Curved Arrows PowerPoint 2010 Regular Line 7 Stages Templates. Put each element to the test.
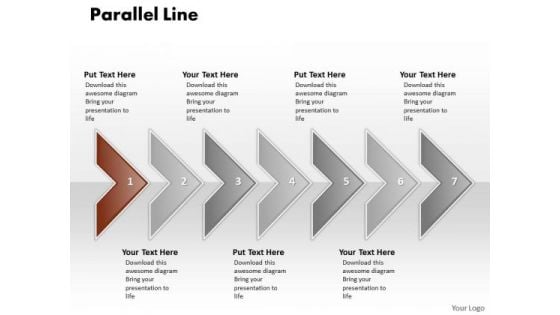
Ppt Correlated PowerPoint Graphics Arrows Parallel Line 7 Stage Templates
PPT correlated powerpoint graphics arrows parallel line 7 stage Templates-This Diagram is used to illustrate how information will move between interrelated systems in the accomplishment of a given function, task or process. The visual description of this information flow with each given level showing how data is fed into a given process step and subsequently passed along at the completion of that step.-PPT correlated powerpoint graphics arrows parallel line 7 stage Templates-Aim, Arrow, Badge, Border, Color, Connection, Curve, Design, Direction, Download, Icon, Illustration, Indicator, Internet, Label, Link, Magenta, Mark, Next, Object, Orientation, Paper, Peeling, Pointer, Rounded, Set, Shadow, Shape, Sign Analyse the effect of different factors. Our Ppt Correlated PowerPoint Graphics Arrows Parallel Line 7 Stage Templates will give them equal attention.
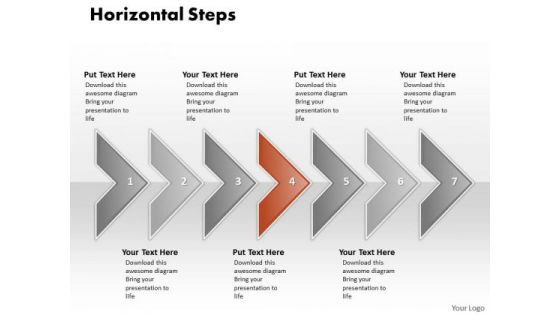
Ppt Correlated Shapes Arrows PowerPoint Horizontal Stages Templates
PPT correlated shapes arrows powerpoint horizontal stages Templates-This Diagram is used to illustrate how information will move between interrelated systems in the accomplishment of a given function, task or process. The visual description of this information flow with each given level showing how data is fed into a given process step and subsequently passed along at the completion of that step.-PPT correlated shapes arrows powerpoint horizontal stages Templates-Aim, Arrow, Badge, Border, Color, Connection, Curve, Design, Direction, Download, Icon, Illustration, Indicator, Internet, Label, Link, Magenta, Mark, Next, Object, Orientation, Paper, Peeling, Pointer, Rounded, Set, Shadow, Shape, Sign Enlist teams with our Ppt Correlated Shapes Arrows PowerPoint Horizontal Stages Templates. Download without worries with our money back guaranteee.
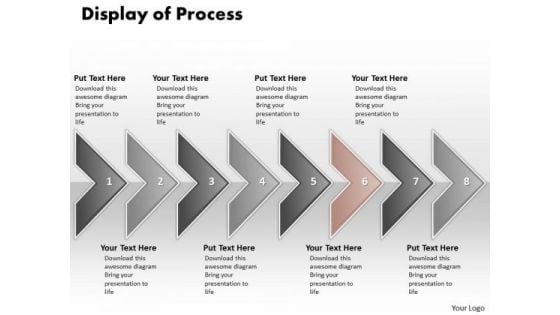
Ppt Display Of Marketing Process Using 8 Power Point Stage PowerPoint Templates
PPT display of marketing process using 8 power point stage PowerPoint Templates-This Diagram is used to illustrate how information will move between interrelated systems in the accomplishment of a given function, task or process. The visual description of this information flow with each given level showing how data is fed into a given process step and subsequently passed along at the completion of that step.-PPT display of marketing process using 8 power point stage PowerPoint Templates-Aim, Arrow, Badge, Border, Color, Connection, Curve, Design, Direction, Download, Icon, Illustration, Indicator, Internet, Label, Link, Magenta, Mark, Next, Object, Orientation, Paper, Peeling, Pointer, Rounded, Set, Shadow, Shape, Sign Solve problems with our Ppt Display Of Marketing Process Using 8 Power Point Stage PowerPoint Templates. Download without worries with our money back guaranteee.
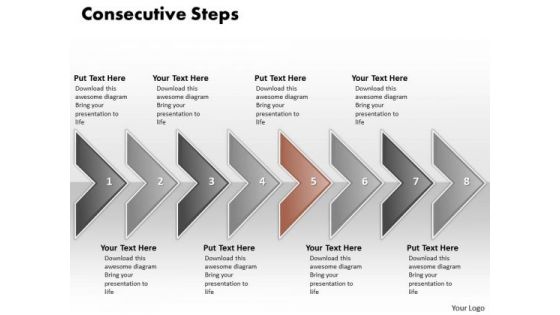
Ppt Eight Consecutive Practice The PowerPoint Macro Steps Of Marketing Process Templates
PPT eight consecutive practice the powerpoint macro steps of marketing process Templates-This Diagram is used to illustrate how information will move between interrelated systems in the accomplishment of a given function, task or process. The visual description of this information flow with each given level showing how data is fed into a given process step and subsequently passed along at the completion of that step.-PPT eight consecutive practice the powerpoint macro steps of marketing process Templates-Aim, Arrow, Badge, Border, Color, Connection, Curve, Design, Direction, Download, Icon, Illustration, Indicator, Internet, Label, Link, Magenta, Mark, Next, Object, Orientation, Paper, Peeling, Pointer, Rounded, Set, Shadow, Shape, Sign Let our Ppt Eight Consecutive Practice The PowerPoint Macro Steps Of Marketing Process Templates escort your thoughts. They will take them safely to their destination.
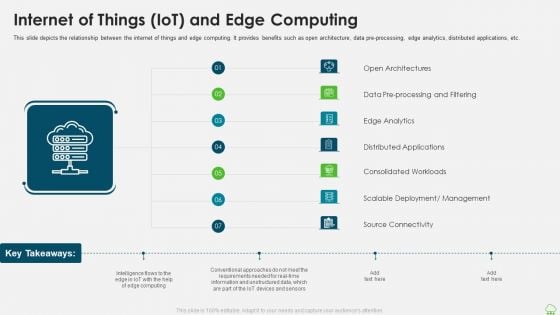
Distributed Computing IT Internet Of Things Iot And Edge Computing Download PDF
This slide depicts the relationship between the internet of things and edge computing. It provides benefits such as open architecture, data pre-processing, edge analytics, distributed applications, etc. This is a distributed computing it internet of things iot and edge computing download pdf template with various stages. Focus and dispense information on seven stages using this creative set, that comes with editable features. It contains large content boxes to add your information on topics like distributed applications, management, open architectures. You can also showcase facts, figures, and other relevant content using this PPT layout. Grab it now.
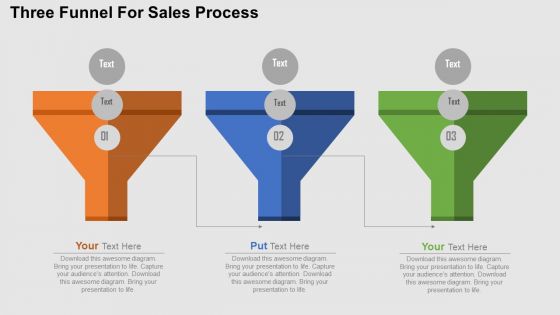
Three Funnel For Sales Process PowerPoint Templates
This multi colored creative slide has been created by our top designers and is one of the most downloaded slides. The three funnels have appropriate markings to describe the input, output and the steps involved in a process and its flow. The diagram can be effectively used to different kind of advertisements or sales strategies and the expected or received results. The PPT template can be included in the presentation to show a filtration process of some kind. It can be an effective slide in demonstrating the work of different departments as well. The slide can be edited easily to show the raw data that is received by each department, the processing done by that unit and the output produced by that unit.
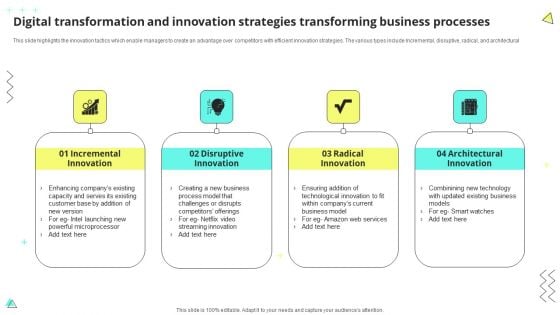
Digital Transformation And Innovation Strategies Transforming Business Processes Sample PDF
This slide highlights the innovation tactics which enable managers to create an advantage over competitors with efficient innovation strategies. The various types include Incremental, disruptive, radical, and architectural. Presenting Digital Transformation And Innovation Strategies Transforming Business Processes Sample PDF to dispense important information. This template comprises four stages. It also presents valuable insights into the topics including Disruptive Innovation, Radical Innovation, Architectural Innovation. This is a completely customizable PowerPoint theme that can be put to use immediately. So, download it and address the topic impactfully.
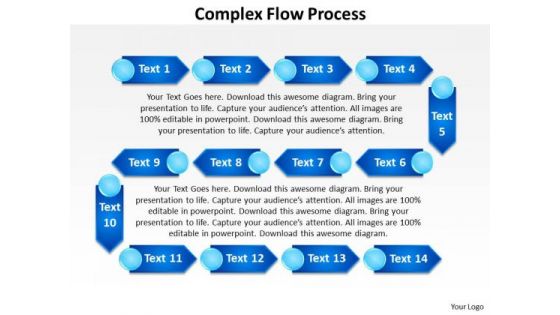
Ppt Complex Flow Process PowerPoint Templates
PPT complex flow process PowerPoint Templates-This PowerPoint Diagram shows fourteen Text Boxes together placed to form Number 2. This Diagram can be used to show complex processes. This can be used for Presentations on circuitous, complicated, composite, compound, compounded, confused, conglomerate, convoluted, elaborate, entangled etc.-PPT complex flow process PowerPoint Templates-Advice, Analyze, Arrow, Background, Blackboard, Box, Business, Chart, Complex, Concept, Creativity, Decision, Design, Determination, Diagram, Direction, Education, Flowchart, Graphic, Idea, Method, Office, Plan, Pointing, Presentation, Process, Screen, Showing, Sign, Strategy, Technology Get drawn into bliss with our Ppt Complex Flow Process PowerPoint Templates. Experience the extravagance they allow.
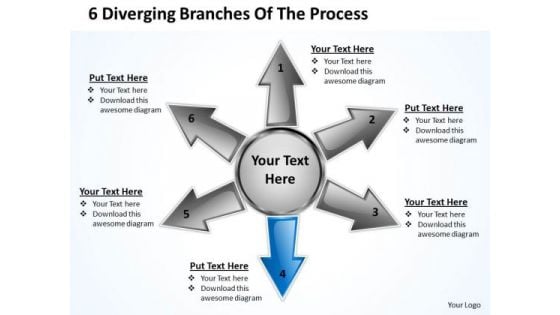
6 Diverging Branches Of The Process Relative Circular Arrow Chart PowerPoint Template
We present our 6 diverging branches of the process Relative Circular Arrow Chart PowerPoint template.Download our Communication PowerPoint Templates because you can Trigger audience minds with your interesting ideas. Present our Business PowerPoint Templates because a lot of dissimilar elements needing to gel to strike the deal. Download and present our Process and Flows PowerPoint Templates because it helps you to enlighten those around you with the value of your insight. Use our Shapes PowerPoint Templates because firing the arrows to emblazon the desired path will let you achieve anticipated results. Present our Arrows PowerPoint Templates because you have the product you are very confident of and are very sure it will prove immensely popular with clients all over your target areas.Use these PowerPoint slides for presentations relating to Arrow, Brochure, Business, Chart, Circle, Cyclic, Data, Diagram, Financial, Goal, Graph, Illustration, Info, Information, Investment, Manage, Marketing, Model, Option, Part, Pie, Presentation, Process, Result, Sphere, Statistics, Stock, Strategy, Template, Wheel. The prominent colors used in the PowerPoint template are Blue, Gray, Black. The feedback we get is that our 6 diverging branches of the process Relative Circular Arrow Chart PowerPoint template are Liberated. People tell us our Diagram PowerPoint templates and PPT Slides are visually appealing. Presenters tell us our 6 diverging branches of the process Relative Circular Arrow Chart PowerPoint template are Colorful. Use our Business PowerPoint templates and PPT Slides are Handsome. Use our 6 diverging branches of the process Relative Circular Arrow Chart PowerPoint template are the best it can get when it comes to presenting. Use our Data PowerPoint templates and PPT Slides are topically designed to provide an attractive backdrop to any subject. Acquire a flourish with our 6 Diverging Branches Of The Process Relative Circular Arrow Chart PowerPoint Template. Your thoughts will begin to flower.
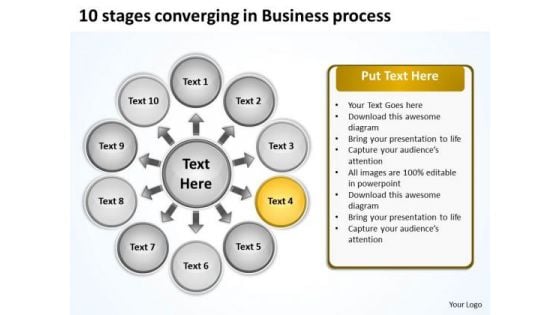
10 Stages Converging Business PowerPoint Theme Process Radial Network Slides
We present our 10 stages converging business powerpoint theme process Radial Network Slides.Use our Arrows PowerPoint Templates because this Diagram emphasizes on any critical or key factors within them. Use our Flow charts PowerPoint Templates because you can Amplify your views, ideas and thoughts from very basic aspects to the highly technical and complicated issus using this template as a tool. Download and present our Business PowerPoint Templates because this is the unerring accuracy in reaching the target. the effortless ability to launch into flight. Use our Process and Flows PowerPoint Templates because your team and you always raise a toast. Download and present our Circle charts PowerPoint Templates because this slide helps you to give your team an overview of your capability and insight into the minute details of the overall picture highlighting the interdependence at every operational level.Use these PowerPoint slides for presentations relating to Business, chart, circle, colors, concept, corporate, cycle, data, design, detail, development, diagram, engineering, graphic, ideas, illustration, image, implement, implementation, life, lifecycle, management, model, objects, organization, plan, process, product, professional, project, quality, schema, shape, stack, stage, steps, strategy, structure, success, symbol. The prominent colors used in the PowerPoint template are Yellow, White, Black. You can be sure our 10 stages converging business powerpoint theme process Radial Network Slides are Swanky. Presenters tell us our colors PowerPoint templates and PPT Slides are specially created by a professional team with vast experience. They diligently strive to come up with the right vehicle for your brilliant Ideas. We assure you our 10 stages converging business powerpoint theme process Radial Network Slides are Nice. Customers tell us our concept PowerPoint templates and PPT Slides are Delightful. Presenters tell us our 10 stages converging business powerpoint theme process Radial Network Slides are Efficacious. You can be sure our data PowerPoint templates and PPT Slides are Elevated. Attract attention with our 10 Stages Converging Business PowerPoint Theme Process Radial Network Slides. You will come out on top.
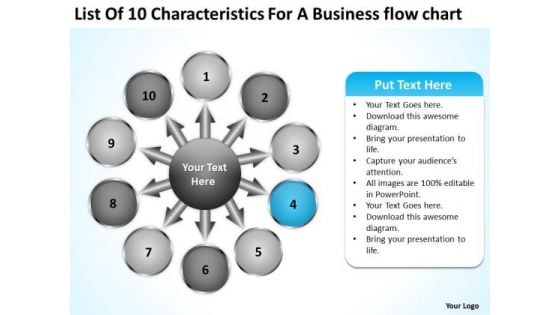
For A Free Business PowerPoint Templates Flow Chart Business Circular Process Slides
We present our for a free business powerpoint templates flow chart business Circular Process Slides.Use our Business PowerPoint Templates because this diagram can set an example to enthuse your team with the passion and fervour of your ideas. Download our Process and Flows PowerPoint Templates because you can Educate your team with the attention to be paid. Download our Ring Charts PowerPoint Templates because in this Slide Various threads are joining up and being stitched together providing necessary strength Now you have to take the last leap. Download our Shapes PowerPoint Templates because this slide shows each path to the smallest detail. Present our Circle Charts PowerPoint Templates because this Layout can explain the relevance of the different layers and stages in getting down to your core competence, ability and desired result.Use these PowerPoint slides for presentations relating to Business,chart, circle, colors, concept,contemporary, corporate, cycle, data,design, detail, development, diagram, engineering, graphic, ideas,illustration, implement, implementation,management, model, modern,organization, phase, plan, process,product, professional, project, quality,schema, set, software, stack, stage, steps, strategy, success, system, tag, team. The prominent colors used in the PowerPoint template are Blue light, Gray, Black. Customers tell us our for a free business powerpoint templates flow chart business Circular Process Slides are Lush. Customers tell us our concept PowerPoint templates and PPT Slides are Vintage. Customers tell us our for a free business powerpoint templates flow chart business Circular Process Slides are Fantastic. People tell us our corporate PowerPoint templates and PPT Slides are Fashionable. Customers tell us our for a free business powerpoint templates flow chart business Circular Process Slides will help you be quick off the draw. Just enter your specific text and see your points hit home. Customers tell us our data PowerPoint templates and PPT Slides are Breathtaking. Encapsulate your thoughts in our For A Free Business PowerPoint Templates Flow Chart Business Circular Process Slides. They will become a class apart.
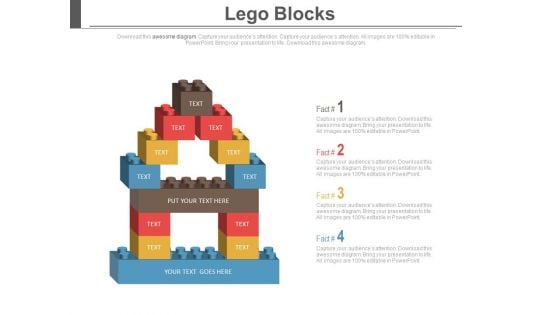
Hut Made Of Lego Blocks For Banking Solutions Powerpoint Slides
This PowerPoint template contains graphics of hut made of Lego blocks. Download this Lego slide design for management and business strategy related topics. This diagram provides an effective way of displaying information
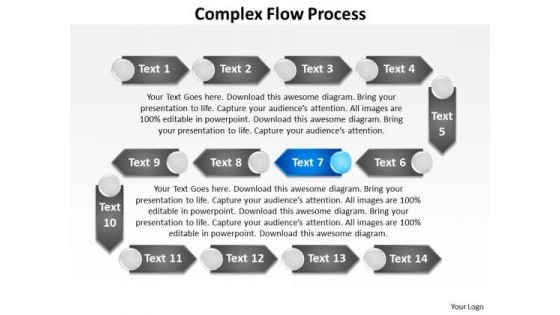
Ppt Complex Flow Change Management Process PowerPoint Presentation System Templates
PPT complex flow change management process powerpoint presentation system Templates-PowerPoint process diagram template helps you visualize your process with ease. The diagrams can be used to show looped processes, pipeline flow etc. You can portray specific models like Analyze, Plan, Implement and Review model, or any other customized processes.-PPT complex flow change management process powerpoint presentation system Templates-Advice, Analyze, Arrow, Background, Business, Chart, Concept, Creativity, Decision, Design, Determination, Diagram, Draw, Education, Flowchart, Graphic, Idea, Means, Method, Office, Plan, Pointing, Presentation, Process, Sign, Strategy, Technology Say it with feeling with our Ppt Complex Flow Change Management Process PowerPoint Presentation System Templates. Appropriate emotions will begin to emerge.
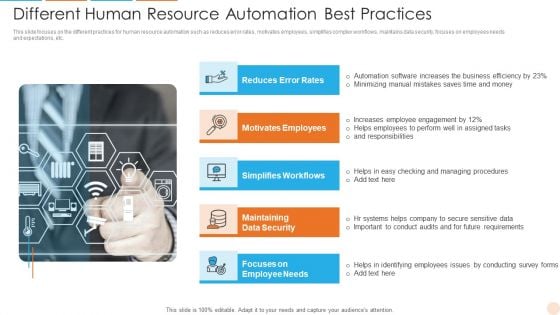
Different Human Resource Automation Best Practices Themes PDF
This slide focuses on the different practices for human resource automation such as reduces error rates, motivates employees, simplifies complex workflows, maintains data security, focuses on employees needs and expectations, etc. Persuade your audience using this Different Human Resource Automation Best Practices Themes PDF. This PPT design covers four stages, thus making it a great tool to use. It also caters to a variety of topics including Reduces Error Rates, Motivates Employees, Maintaining Data Security. Download this PPT design now to present a convincing pitch that not only emphasizes the topic but also showcases your presentation skills.
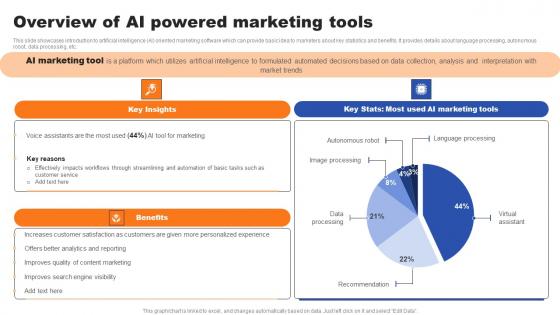
Overview Of AI Powered Marketing Tools Ppt Infographics Designs Download Pdf
This slide showcases introduction to artificial intelligence AI oriented marketing software which can provide basic idea to marketers about key statistics and benefits. It provides details about language processing, autonomous robot, data processing, etc. The Overview Of AI Powered Marketing Tools Ppt Infographics Designs Download Pdf is a compilation of the most recent design trends as a series of slides. It is suitable for any subject or industry presentation, containing attractive visuals and photo spots for businesses to clearly express their messages. This template contains a variety of slides for the user to input data, such as structures to contrast two elements, bullet points, and slides for written information. Slidegeeks is prepared to create an impression. This slide showcases introduction to artificial intelligence AI oriented marketing software which can provide basic idea to marketers about key statistics and benefits. It provides details about language processing, autonomous robot, data processing, etc.
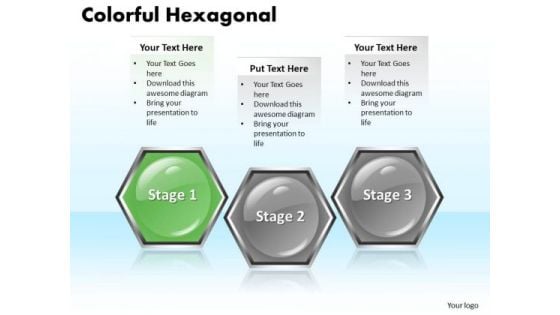
Ppt Colorful PowerPoint Templates Free Download Hexagonal Text Boxes 3 Stages
PPT colorful powerpoint templates free download hexagonal text boxes 3 stages-This is a professional-look process steps diagram. This Process steps diagram is widely used to show sequence of actions. Use this linear process diagram to emphasize direction of movement and interconnections of stages in a flow.-PPT colorful powerpoint templates free download hexagonal text boxes 3 stages-3d, Abstract, Art, Background, Clip, Clipart, Comb, Concept, Connected, Connection, Design, Different, Drawings, Graphics, Group, Hexagon, Honey, Honeycomb, Illustration, Pictures, Solution, Teamwork Belong to an elite club with our Ppt Colorful PowerPoint Templates Free Download Hexagonal Text Boxes 3 Stages. You will come out on top.
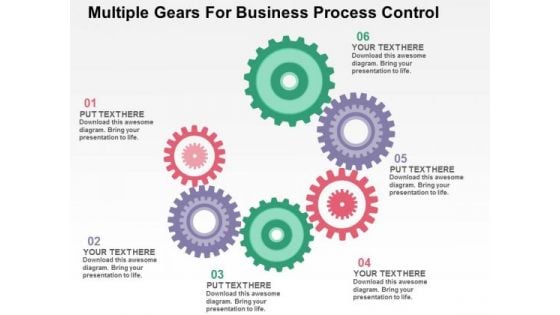
Multiple Gears For Business Process Control PowerPoint Template
This business diagram has been designed with multiple gears. It may use to display task management and process control. Prove the viability of your ideas to help your organization to achieve the quality and success required.
Offshore Vs Outsourced Call Center Comparative Analysis Icons Pdf
The following slide highlights points like labor cost, service quality, communication, data security, time zone and customer feedback to show offshore vs onshore call center comparative analysis. It helps organization to make informed decision between offshore and onshore call center outsourcing based on important factors. Pitch your topic with ease and precision using this Offshore Vs Outsourced Call Center Comparative Analysis Icons Pdf. This layout presents information on Service Quality, Communication, Data Security, Customer Feedback. It is also available for immediate download and adjustment. So, changes can be made in the color, design, graphics or any other component to create a unique layout. The following slide highlights points like labor cost, service quality, communication, data security, time zone and customer feedback to show offshore vs onshore call center comparative analysis. It helps organization to make informed decision between offshore and onshore call center outsourcing based on important factors.
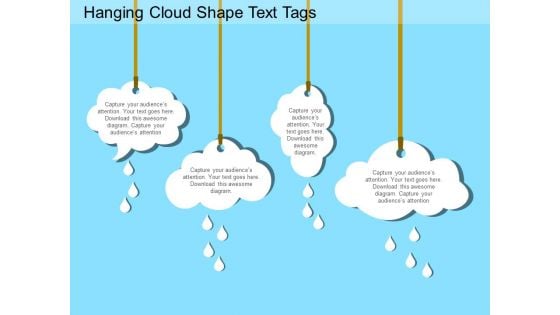
Hanging Cloud Shape Text Tags Powerpoint Templates
This business slide contains graphics of hanging cloud shape text tags. This diagram is suitable to present cloud technology. Visual effect of this slide helps in maintaining the flow of the discussion and provides more clarity to the subject.
User Experience Service Transformation Technology Icons Pdf
This slide highlights the use of technology in enhancing the customer service which helps to provide an improved and efficient user experience. Ways of development include Data processing, self-serving portals and automation. Pitch your topic with ease and precision using this User Experience Service Transformation Technology Icons Pdf. This layout presents information on Data Processing, Self Serving Portals, Automation. It is also available for immediate download and adjustment. So, changes can be made in the color, design, graphics or any other component to create a unique layout. This slide highlights the use of technology in enhancing the customer service which helps to provide an improved and efficient user experience. Ways of development include Data processing, self-serving portals and automation.
Market Statistical Analysis Vector Icon Ppt Powerpoint Presentation File Design Inspiration
This is a market statistical analysis vector icon ppt powerpoint presentation file design inspiration. The topics discussed in this diagram are market growth, market opportunity, market profitability. This is a completely editable PowerPoint presentation, and is available for immediate download.

Datafy Framework Of Datafication Technology Infographics PDF
This slide represents the framework of datafication technology, and it includes two cycles such as design data and data use. The design data further contains four elements, including domain, domain model, implementation and appropriation, and design. Whether you have daily or monthly meetings, a brilliant presentation is necessary. Datafy Framework Of Datafication Technology Infographics PDF can be your best option for delivering a presentation. Represent everything in detail using Datafy Framework Of Datafication Technology Infographics PDF and make yourself stand out in meetings. The template is versatile and follows a structure that will cater to your requirements. All the templates prepared by Slidegeeks are easy to download and edit. Our research experts have taken care of the corporate themes as well. So, give it a try and see the results.
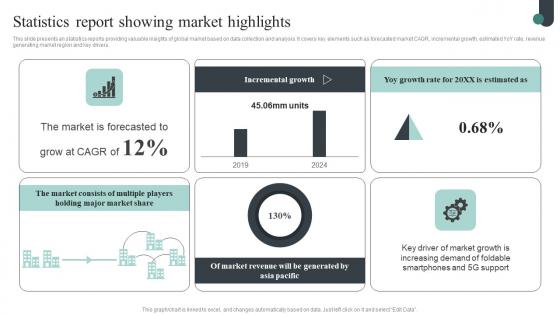
Competitive Intelligence Guide To Determine Market Statistics Report Showing Introduction Pdf
This slide presents an statistics reports providing valuable insights of global market based on data collection and analysis. It covers key elements such as forecasted market CAGR, incremental growth, estimated YoY rate, revenue generating market region and key drivers. The Competitive Intelligence Guide To Determine Market Statistics Report Showing Introduction Pdf is a compilation of the most recent design trends as a series of slides. It is suitable for any subject or industry presentation, containing attractive visuals and photo spots for businesses to clearly express their messages. This template contains a variety of slides for the user to input data, such as structures to contrast two elements, bullet points, and slides for written information. Slidegeeks is prepared to create an impression. This slide presents an statistics reports providing valuable insights of global market based on data collection and analysis. It covers key elements such as forecasted market CAGR, incremental growth, estimated YoY rate, revenue generating market region and key drivers.
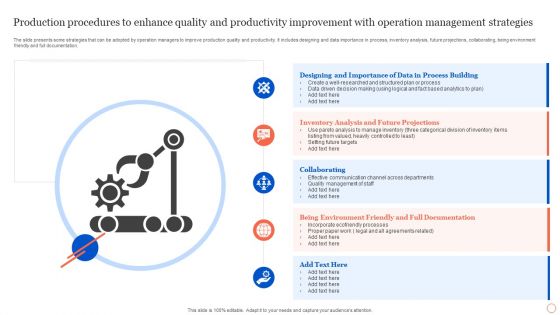
Production Procedures To Enhance Quality And Productivity Improvement With Operation Management Strategies Rules PDF
The slide presents some strategies that can be adopted by operation managers to improve production quality and productivity. it includes designing and data importance in process, inventory analysis, future projections, collaborating, being environment friendly and full documentation. Persuade your audience using this Production Procedures To Enhance Quality And Productivity Improvement With Operation Management Strategies Rules PDF. This PPT design covers five stages, thus making it a great tool to use. It also caters to a variety of topics including Designing And Importance, Data Process Building, Collaborating, Being Environment Friendly. Download this PPT design now to present a convincing pitch that not only emphasizes the topic but also showcases your presentation skills.
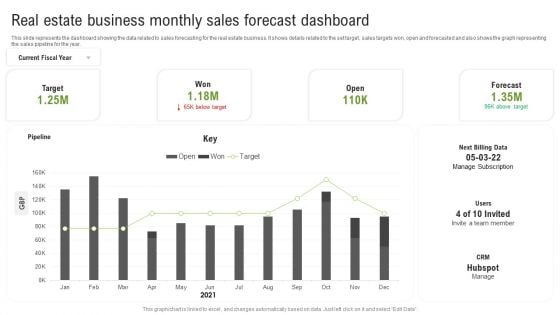
Real Estate Business Monthly Sales Forecast Dashboard Ppt Layouts Grid PDF
This slide represents the dashboard showing the data related to sales forecasting for the real estate business. It shows details related to the set target, sales targets won, open and forecasted and also shows the graph representing the sales pipeline for the year. Showcasing this set of slides titled Real Estate Business Monthly Sales Forecast Dashboard Ppt Layouts Grid PDF. The topics addressed in these templates are Next Billing Data, Pipeline, Current Fiscal Year. All the content presented in this PPT design is completely editable. Download it and make adjustments in color, background, font etc. as per your unique business setting.
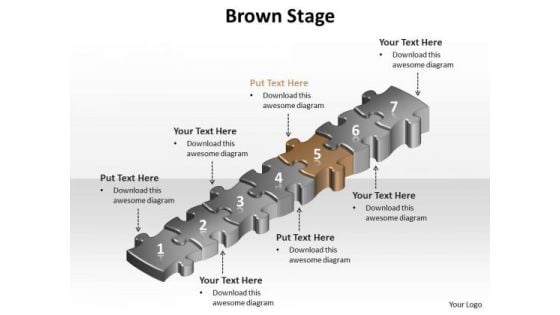
Ppt Brown Success Step PowerPoint Templates
PPT brown success step PowerPoint Templates-This diagram helps you to analyze all the connected ideas and also can be used to show seven aspects of an issue. This PowerPoint Linear process diagram is used to show interrelated ideas or concepts. This diagram is useful in just about any type of presentation.-PPT brown success step PowerPoint Templates-achievement, activity, adversity, bridge, built, business, cartoon, challenge, character, computer, concept, construction, creativity, decisions, figure, games, goal, graphic, icon, idea, intelligence, organization, people, planning, problems, puzzle, solution, stick, strategy, success Amity assists in cementing bonds. Advocate it with our Ppt Brown Success Step PowerPoint Templates.
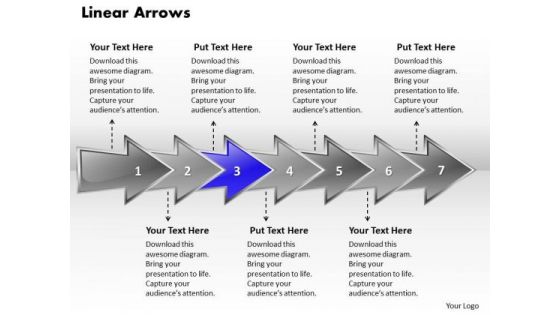
Ppt Linear 3d Arrows PowerPoint Describing Seven Aspects Templates
PPT linear 3d arrows powerpoint describing seven aspects Templates-This diagram shows an organized view of business services and processes. This diagram provides an overview of the interactions of different factors in a company. Use this diagram to present your contents in a clear and structured manner.-PPT linear 3d arrows powerpoint describing seven aspects Templates-analysis, arrow, background, business, chart, communication, concept, construction, delivery, design, development, engineering, fabrication, feasibiliti, generated, growth, idea, industry, making, production, products, science, sequence, shape Be the chief with our Ppt Linear 3d Arrows PowerPoint Describing Seven Aspects Templates. Just download, type and present.
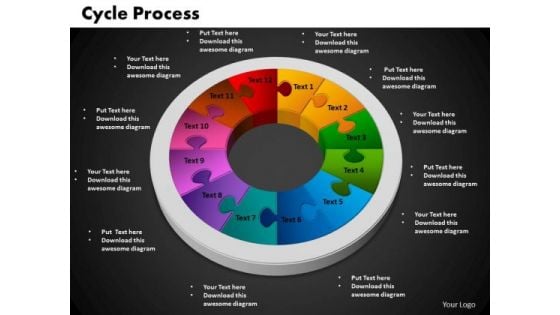
PowerPoint Backgrounds Cycle Process Chart Ppt Designs
PowerPoint Backgrounds Cycle Process Chart PPT Designs-This Cycle Diagram is a type of graphics that shows how items are related to one another in a repeating cycle. In a cycle diagram, you can explain the main events in the cycle, how they interact, and how the cycle repeats. -PowerPoint Backgrounds Cycle Process Chart PPT Designs-Business, Chart, Circle, Cycle, Marketing, Manage, Investment, Information, Growth, Graph, Flow, Process, Progress, Recycle, Rotation, Sequence, Sphere, Plan, Diagram, Direction Label your success story with our PowerPoint Backgrounds Cycle Process Chart Ppt Designs. Make sure your presentation gets the attention it deserves.
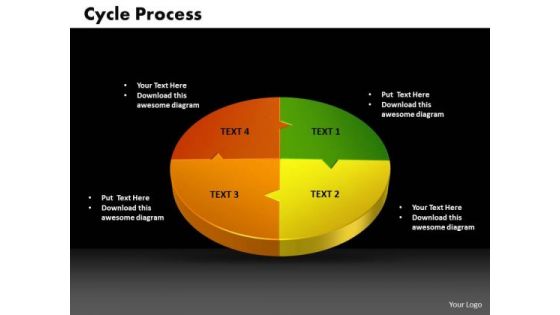
PowerPoint Backgrounds Cycle Growth Ppt Designs
PowerPoint Backgrounds Cycle Growth PPT Designs-This Cycle Diagram is a type of graphics that shows how items are related to one another in a repeating cycle. In a cycle diagram, you can explain the main events in the cycle, how they interact, and how the cycle repeats. -PowerPoint Backgrounds Cycle Growth PPT Designs-Business, Chart, Circle, Cycle, Marketing, Manage, Investment, Information, Growth, Graph, Flow, Process, Progress, Recycle, Rotation, Sequence, Sphere, Plan, Diagram, Direction Brake for no one with our PowerPoint Backgrounds Cycle Growth Ppt Designs. You will come out on top.
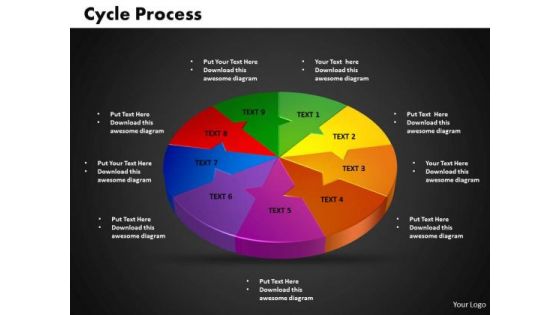
PowerPoint Backgrounds Cycle Teamwork Ppt Design
PowerPoint Backgrounds Cycle Teamwork PPT Design-This Cycle Diagram is a type of graphics that shows how items are related to one another in a repeating cycle. In a cycle diagram, you can explain the main events in the cycle, how they interact, and how the cycle repeats. -PowerPoint Backgrounds Cycle Teamwork PPT Design-Business, Chart, Circle, Cycle, Marketing, Manage, Investment, Information, Growth, Graph, Flow, Process, Progress, Recycle, Rotation, Sequence, Sphere, Plan, Diagram, Direction Foster good ethics with our PowerPoint Backgrounds Cycle Teamwork Ppt Design. Your thoughts will set an impeccable example.
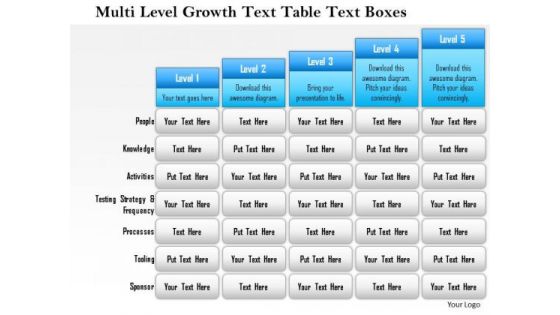
Business Framework Multi Level Growth Text Table Text Boxes 2 PowerPoint Presentation
Five staged text box style chart in bar graph design has been used to decorate this power point template slide. This diagram slide contains the multilevel growth concept. Use this PPT slide for financial growth and result analysis related topics.
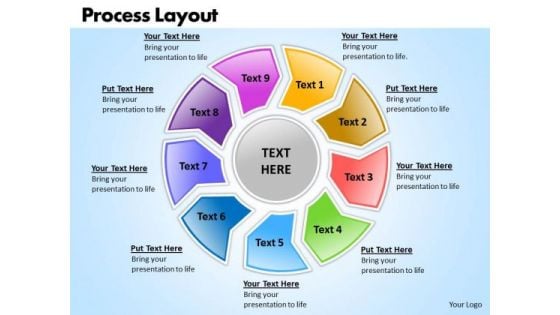
Ppt Circular Nursing Process PowerPoint Presentation Layout Templates
PPT circular nursing process powerpoint presentation layout Templates-This PowerPoint Diagram shows nine Text Boxes together placed to form a circle. This Diagram can be used to show complex processes. This can be used for Presentations on circuitous, complicated, composite, compound, compounded, confused, conglomerate, convoluted, elaborate, entangled etc. An excellent graphic to attract the attention of your audience to improve earnings.-PPT circular nursing process powerpoint presentation layout Templates-Arrow, Art, Blue, Business, Button, Circular, Clip, Design, Diagram, Drop, Element, Glowing, Graph, Graphic, Icon, Illustration, Isolated, Process, Round, Set, Shadow, Sphere, Symbol Give your audience the feast they deserve. Our Ppt Circular Nursing Process PowerPoint Presentation Layout Templates will lay out a delicious spread.
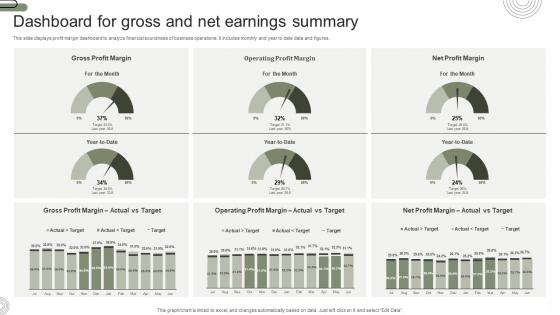
Dashboard For Gross And Net Earnings Summary Designs Pdf
This slide displays profit margin dashboard to analyze financial soundness of business operations. It includes monthly and year to date data and figures. Showcasing this set of slides titled Dashboard For Gross And Net Earnings Summary Designs Pdf. The topics addressed in these templates are Dashboard For Gross, Net Earnings Summary, Financial Soundness. All the content presented in this PPT design is completely editable. Download it and make adjustments in color, background, font etc. as per your unique business setting. This slide displays profit margin dashboard to analyze financial soundness of business operations. It includes monthly and year to date data and figures.
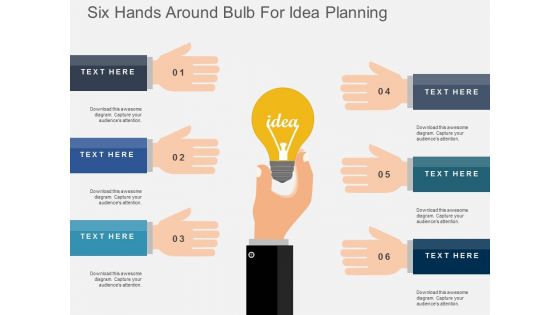
Six Hands Around Bulb For Idea Planning Powerpoint Templates
This business diagram has been crafted with graphic of five tags icons. This slide helps to display business steps in visual manner. Download this PowerPoint template to build unique presentations.
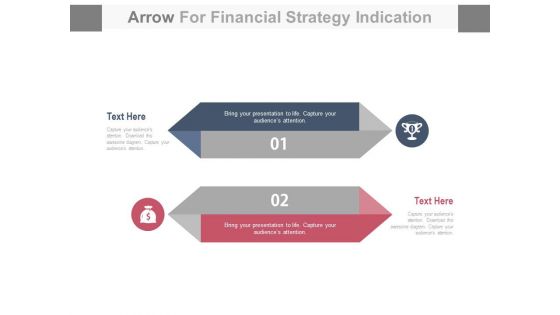
Two Arrows Tags For Financial1 Success Strategy PowerPoint Slides
This PowerPoint Template can be used for multiple purposes. The slide can be a part of your presentation and because of its modern and creative design, it is bound to leave an everlasting impression on the audience. The two figures are vertical diamonds and relevant text and icons can be placed on each side to explain any process. Similarly, you can use the diagram to describe the raw materials and in the diagram, you can explain the process. At the end of the diagram an icon or symbol of the finished or the final product can be placed to explain the conclusion of the process. \n
Idea Bulb With Eight Icons Powerpoint Templates

Three Numeric Tags For Text Representation Powerpoint Template
This PPT slide has been designed with graphics of three numeric tags. Download this PowerPoint template to exhibit entrepreneurship statistics. Accelerate the impact of your ideas using this PowerPoint diagram slide.
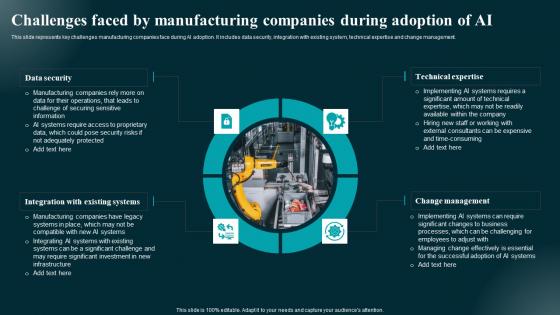
Challenges Faced By Manufacturing Companies Applications And Impact Themes Pdf
This slide represents key challenges manufacturing companies face during AI adoption. It includes data security, integration with existing system, technical expertise and change management. The Challenges Faced By Manufacturing Companies Applications And Impact Themes Pdf is a compilation of the most recent design trends as a series of slides. It is suitable for any subject or industry presentation, containing attractive visuals and photo spots for businesses to clearly express their messages. This template contains a variety of slides for the user to input data, such as structures to contrast two elements, bullet points, and slides for written information. Slidegeeks is prepared to create an impression. This slide represents key challenges manufacturing companies face during AI adoption. It includes data security, integration with existing system, technical expertise and change management.
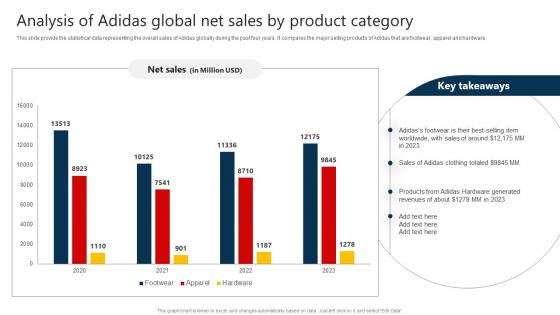
The Marketing Mix Of Analysis Of Adidas Global Net Sales By Product Category Strategy SS V
This slide provide the statistical data representing the overall sales of Adidas globally during the past four years. It compares the major selling products of Adidas that are footwear, apparel and hardware. The The Marketing Mix Of Analysis Of Adidas Global Net Sales By Product Category Strategy SS V is a compilation of the most recent design trends as a series of slides. It is suitable for any subject or industry presentation, containing attractive visuals and photo spots for businesses to clearly express their messages. This template contains a variety of slides for the user to input data, such as structures to contrast two elements, bullet points, and slides for written information. Slidegeeks is prepared to create an impression. This slide provide the statistical data representing the overall sales of Adidas globally during the past four years. It compares the major selling products of Adidas that are footwear, apparel and hardware.
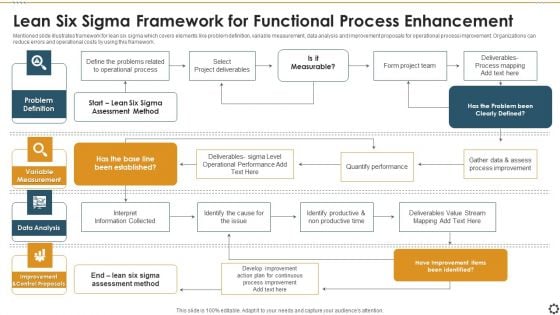
Lean Six Sigma Framework For Functional Process Enhancement Slides PDF
Mentioned slide illustrates framework for lean six sigma which covers elements like problem definition, variable measurement, data analysis and improvement proposals for operational process improvement. Organizations can reduce errors and operational costs by using this framework. Presenting lean six sigma framework for functional process enhancement slides pdf to dispense important information. This template comprises four stages. It also presents valuable insights into the topics including problem definition, variable measurement, data analysis, improvement and control proposals. This is a completely customizable PowerPoint theme that can be put to use immediately. So, download it and address the topic impactfully.
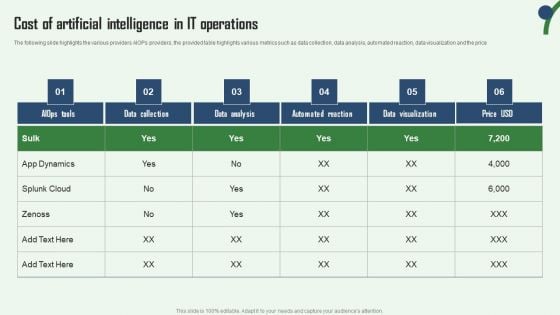
Cost Of Artificial Intelligence In IT Operations Aiops Integration Summary Report Themes PDF
The following slide highlights the various providers AIOPs providers, the provided table highlights various metrics such as data collection, data analysis, automated reaction, data visualization and the price. Formulating a presentation can take up a lot of effort and time, so the content and message should always be the primary focus. The visuals of the PowerPoint can enhance the presenters message, so our Cost Of Artificial Intelligence In IT Operations Aiops Integration Summary Report Themes PDF was created to help save time. Instead of worrying about the design, the presenter can concentrate on the message while our designers work on creating the ideal templates for whatever situation is needed. Slidegeeks has experts for everything from amazing designs to valuable content, we have put everything into Cost Of Artificial Intelligence In IT Operations Aiops Integration Summary Report Themes PDF.
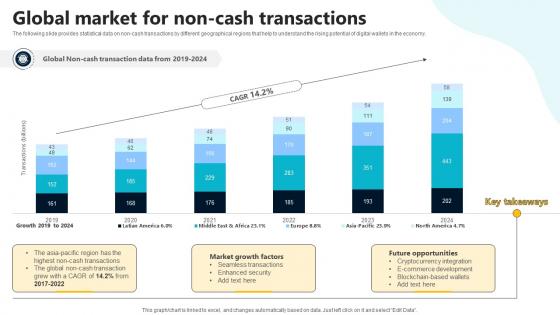
Global Market For Non Cash Transactions In Depth Guide To Digital Wallets Fin SS V
The following slide provides statistical data on non-cash transactions by different geographical regions that help to understand the rising potential of digital wallets in the economy. The Global Market For Non Cash Transactions In Depth Guide To Digital Wallets Fin SS V is a compilation of the most recent design trends as a series of slides. It is suitable for any subject or industry presentation, containing attractive visuals and photo spots for businesses to clearly express their messages. This template contains a variety of slides for the user to input data, such as structures to contrast two elements, bullet points, and slides for written information. Slidegeeks is prepared to create an impression. The following slide provides statistical data on non-cash transactions by different geographical regions that help to understand the rising potential of digital wallets in the economy.
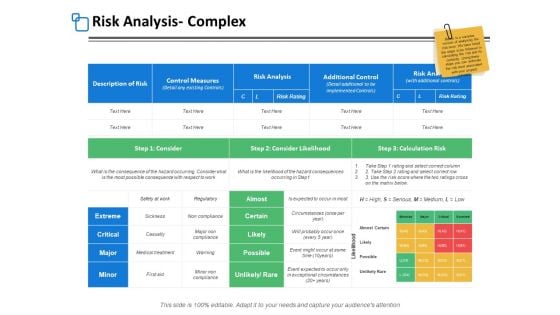
Risk Analysis Complex Marketing Ppt PowerPoint Presentation Ideas Example File
This is a risk analysis complex marketing ppt powerpoint presentation ideas example file. The topics discussed in this diagram are marketing, business, management, planning, strategy This is a completely editable PowerPoint presentation, and is available for immediate download
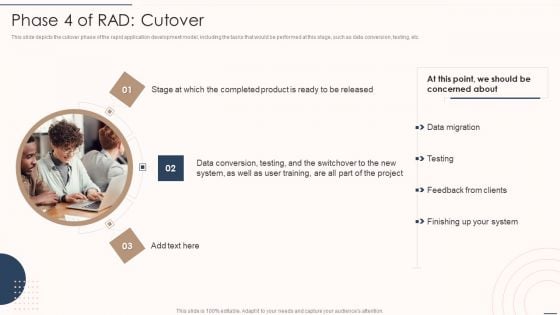
Rapid Application Building Framework Phase 4 Of RAD Cutover Download PDF
This slide depicts the cutover phase of the rapid application development model, including the tasks that would be performed at this stage, such as data conversion, testing, etc.Presenting Rapid Application Building Framework Phase 4 Of RAD Cutover Download PDF to provide visual cues and insights. Share and navigate important information on three stages that need your due attention. This template can be used to pitch topics like Completed Product, Data Migration, Concerned About. In addtion, this PPT design contains high resolution images, graphics, etc, that are easily editable and available for immediate download.
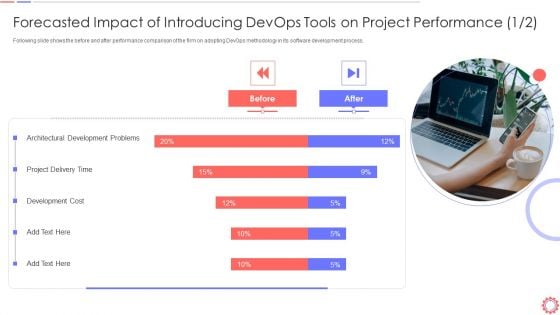
Forecasted Impact Of Introducing Devops Tools On Developer Operations Automated Tools Information PDF
Deliver an awe inspiring pitch with this creative forecasted impact of introducing devops tools on developer operations automated tools information pdf bundle. Topics like project delivery time, development cost, architectural development problems can be discussed with this completely editable template. It is available for immediate download depending on the needs and requirements of the user.
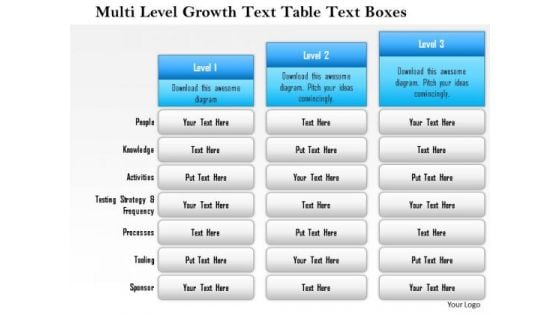
Business Framework Multi Level Growth Text Table Text Boxes PowerPoint Presentation
Three columns text boxes are used to design this Power point template slide. This PPT diagram slide contains the multilevel growth. Use this PPT slide for your business and sales growth related topics in any presentation.

PowerPoint Designs Marketing 3d 2x2 Missing Puzzle Piece Ppt Themes
PowerPoint Designs Marketing 3D 2X2 Missing Puzzle Piece PPT Themes-This 3D PowerPoint diagram shows one Missing Puzzle from 2x2 Matrix Diagram. There is a lot of space available for writing your text. You can easily edit the size, position, text, color. -PowerPoint Designs Marketing 3D 2X2 Missing Puzzle Piece PPT Themes Our PowerPoint Designs Marketing 3d 2x2 Missing Puzzle Piece Ppt Themes have a feel for it. They automatically create an ambience.

Ppt Composite Flow Decision Making Process PowerPoint Presentation Templates
PPT composite flow decision making process powerpoint presentation Templates-This Diagram is simple mapping tool that shows the sequence of actions within a process. This type of diagram is widely used in business, education and economic presentations to help the audience visualize the content better, or to find flaws in a process.-PPT composite flow decision making process powerpoint presentation Templates-Advice, Analyze, Arrow, Background, Business, Chart, Concept, Creativity, Decision, Design, Determination, Diagram, Draw, Education, Flowchart, Graphic, Idea, Means, Method, Office, Plan, Pointing, Presentation, Process, Sign, Strategy, Technology Well begun is half done. Get a dream beginning with our Ppt Composite Flow Decision Making Process PowerPoint Presentation Templates.


 Continue with Email

 Home
Home


