Data Architecture Diagram

Machine To Machine Communication How Iot Works Themes PDF
The slide highlights detailed functionality of IOT.Presenting machine to machine communication how iot works themes pdf. to provide visual cues and insights. Share and navigate important information on four stages that need your due attention. This template can be used to pitch topics like iot device sensors, data store, data processing, user interface. In addtion, this PPT design contains high resolution images, graphics, etc, that are easily editable and available for immediate download.
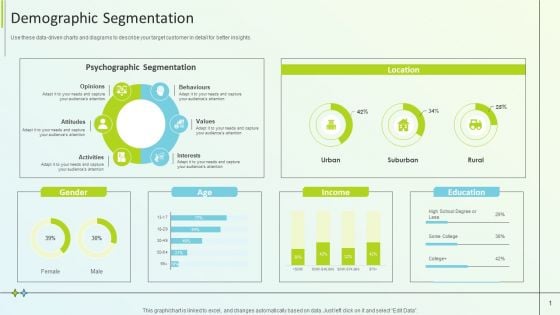
B2B Online Marketing Strategy Demographic Segmentation Designs PDF
Use these data driven charts and diagrams to describe your target customer in detail for better insights.Deliver and pitch your topic in the best possible manner with this B2B Online Marketing Strategy Demographic Segmentation Designs PDF. Use them to share invaluable insights on Psychographic Segmentation, Behaviours, Opinions and impress your audience. This template can be altered and modified as per your expectations. So, grab it now.
5 Months Digital Migration Roadmap Icons PDF
This slide shows six months strategic timeline which can be used in migration of data. It includes stages such as plan, data preparation, migration design, execution, testing and maintenance. Presenting 5 Months Digital Migration Roadmap Icons PDF to dispense important information. This template comprises six stages. It also presents valuable insights into the topics including Plan, Migration Design, Testing. This is a completely customizable PowerPoint theme that can be put to use immediately. So, download it and address the topic impactfully.
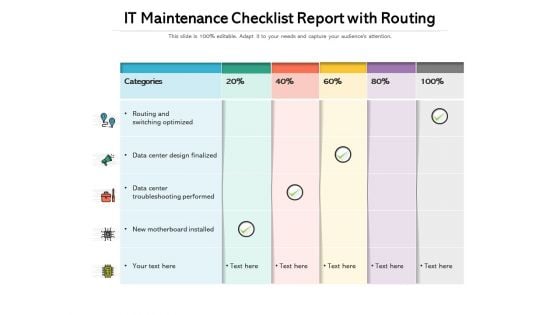
It Maintenance Checklist Report With Routing Ppt PowerPoint Presentation Professional Themes PDF
Showcasing this set of slides titled it maintenance checklist report with routing ppt powerpoint presentation professional themes pdf. The topics addressed in these templates are routing and switching optimized, data center design finalized, data center troubleshooting performed, new motherboard installed. All the content presented in this PPT design is completely editable. Download it and make adjustments in color, background, font etc. as per your unique business setting.
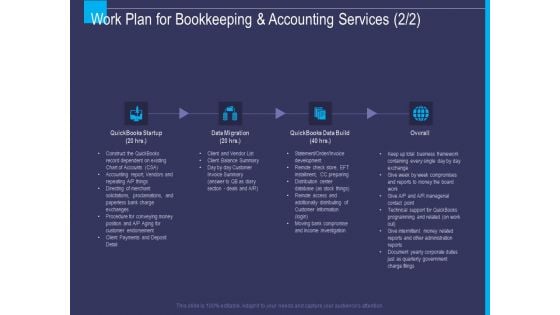
Accounting Bookkeeping Service Work Plan For Bookkeeping And Accounting Ppt Model Themes PDF
Presenting accounting bookkeeping service work plan for bookkeeping and accounting ppt model themes pdf to provide visual cues and insights. Share and navigate important information on four stages that need your due attention. This template can be used to pitch topics like overall, quickbooks startup, quickbooks data build, data migration. In addition, this PPT design contains high-resolution images, graphics, etc, that are easily editable and available for immediate download.
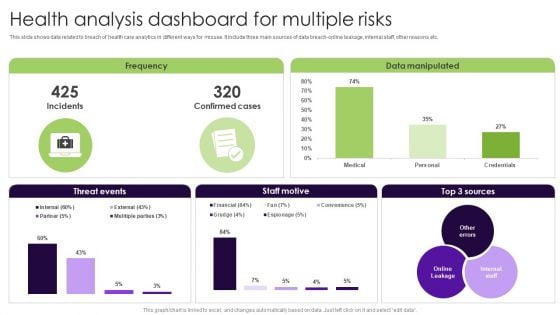
Health Analysis Dashboard For Multiple Risks Elements PDF
This slide shows data related to breach of health care analytics in different ways for misuse. It include three main sources of data breach-online leakage, internal staff, other reasons etc. Showcasing this set of slides titled Health Analysis Dashboard For Multiple Risks Elements PDF. The topics addressed in these templates are Health Analysis Dashboard, Multiple Risks. All the content presented in this PPT design is completely editable. Download it and make adjustments in color, background, font etc. as per your unique business setting.
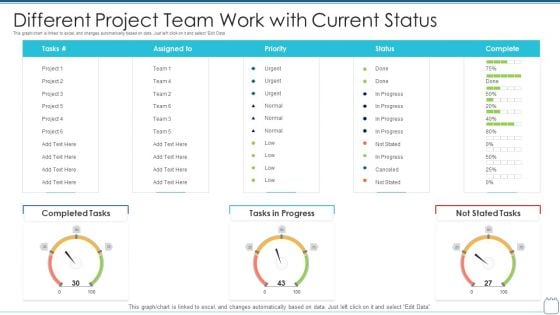
Different Project Team Work With Current Status Graphics PDF
This graph chart is linked to excel, and changes automatically based on data. Just left click on it and select Edit Data Showcasing this set of slides titled different project team work with current status graphics pdf . The topics addressed in these templates are different project team work with current status . All the content presented in this PPT design is completely editable. Download it and make adjustments in color, background, font etc. as per your unique business setting.
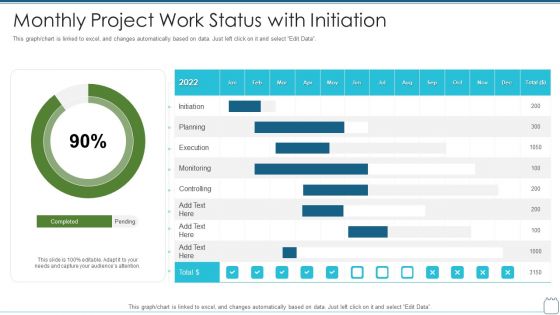
Monthly Project Work Status With Initiation Graphics PDF
This graph chart is linked to excel, and changes automatically based on data. Just left click on it and select Edit Data Showcasing this set of slides titled monthly project work status with initiation graphics pdf . The topics addressed in these templates are monthly project work status with initiation . All the content presented in this PPT design is completely editable. Download it and make adjustments in color, background, font etc. as per your unique business setting.
Enterprise Thesis Business Dissertation Methodology Proposal Ppt Pictures Icon PDF
Presenting enterprise thesis business dissertation methodology proposal ppt pictures icon pdf to provide visual cues and insights. Share and navigate important information on four stages that need your due attention. This template can be used to pitch topics like list of resources used in study, methods for data analysis, different approaches of data collection. In addition, this PPT design contains high-resolution images, graphics, etc, that are easily editable and available for immediate download.
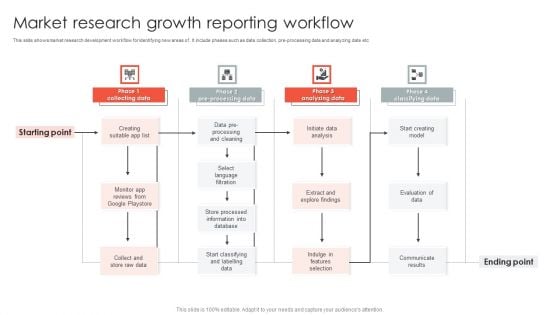
Market Research Growth Reporting Workflow Infographics PDF
This slide shows market research development workflow for identifying new areas of . It include phases such as data collection, pre-processing data and analyzing date etc. Showcasing this set of slides titled Market Research Growth Reporting Workflow Infographics PDF. The topics addressed in these templates are Processing Cleaning, Language Filtration, Information Database. All the content presented in this PPT design is completely editable. Download it and make adjustments in color, background, font etc. as per your unique business setting.
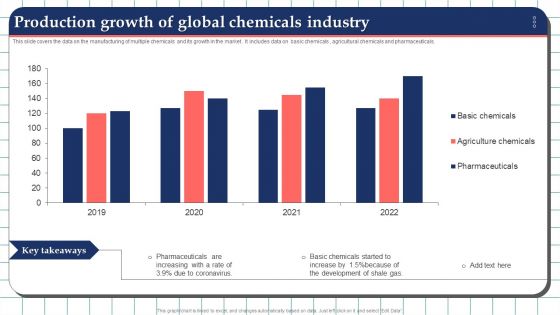
Production Growth Of Global Chemicals Industry Elements PDF
This slide covers the data on the manufacturing of multiple chemicals and its growth in the market . It includes data on basic chemicals , agricultural chemicals and pharmaceuticals. Showcasing this set of slides titled Production Growth Of Global Chemicals Industry Elements PDF. The topics addressed in these templates are Production Growth, Global Chemicals Industry. All the content presented in this PPT design is completely editable. Download it and make adjustments in color, background, font etc. as per your unique business setting.
Key Elements Of Health Management Information Flow With Icons Ppt PowerPoint Presentation Summary Introduction PDF
Persuade your audience using this key elements of health management information flow with icons ppt powerpoint presentation summary introduction pdf. This PPT design covers five stages, thus making it a great tool to use. It also caters to a variety of topics including data sources, visualization tools, decision support tools , information flow, data management systems, interoperability tools. Download this PPT design now to present a convincing pitch that not only emphasizes the topic but also showcases your presentation skills.
Project Roll Out Plan With Goals And Processes Ppt PowerPoint Presentation Icon Slide PDF
Persuade your audience using this project roll out plan with goals and processes ppt powerpoint presentation icon slide pdf. This PPT design covers four stages, thus making it a great tool to use. It also caters to a variety of topics including Successful Installation, Data Collaboration, Clean Data In The System. Download this PPT design now to present a convincing pitch that not only emphasizes the topic but also showcases your presentation skills.
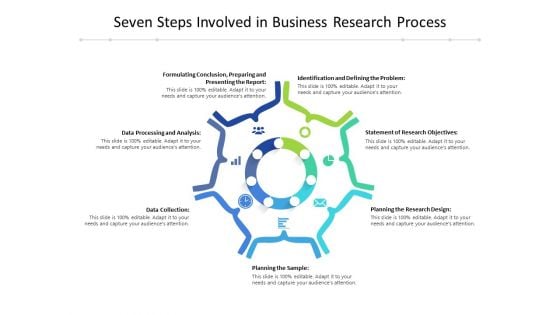
Seven Steps Involved In Business Research Process Ppt PowerPoint Presentation Ideas Pictures PDF
Presenting seven steps involved in business research process ppt powerpoint presentation ideas pictures pdf to dispense important information. This template comprises seven stages. It also presents valuable insights into the topics including identification and defining the problem, statement of research objectives, planning the research design, data collection, planning the sample, data processing and analysis, formulating conclusion, preparing and presenting the report. This is a completely customizable PowerPoint theme that can be put to use immediately. So, download it and address the topic impactfully.
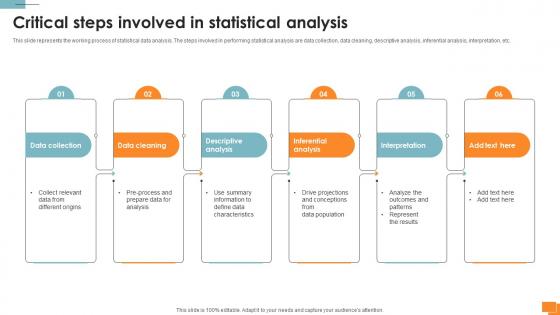
Statistical Tools For Evidence Critical Steps Involved In Statistical Analysis
This slide represents the working process of statistical data analysis. The steps involved in performing statistical analysis are data collection, data cleaning, descriptive analysis, inferential analysis, interpretation, etc. If you are looking for a format to display your unique thoughts, then the professionally designed Statistical Tools For Evidence Critical Steps Involved In Statistical Analysis is the one for you. You can use it as a Google Slides template or a PowerPoint template. Incorporate impressive visuals, symbols, images, and other charts. Modify or reorganize the text boxes as you desire. Experiment with shade schemes and font pairings. Alter, share or cooperate with other people on your work. Download Statistical Tools For Evidence Critical Steps Involved In Statistical Analysis and find out how to give a successful presentation. Present a perfect display to your team and make your presentation unforgettable. This slide represents the working process of statistical data analysis. The steps involved in performing statistical analysis are data collection, data cleaning, descriptive analysis, inferential analysis, interpretation, etc.
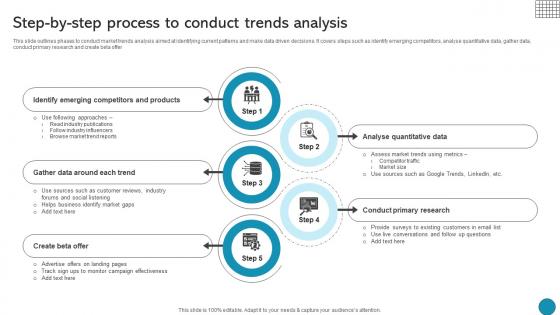
Step By Step Process To Conduct Trends Analysis Driving Business Success Integrating Product
This slide outlines phases to conduct market trends analysis aimed at identifying current patterns and make data driven decisions. It covers steps such as identify emerging competitors, analyse quantitative data, gather data, conduct primary research and create beta offerThis modern and well-arranged Step By Step Process To Conduct Trends Analysis Driving Business Success Integrating Product provides lots of creative possibilities. It is very simple to customize and edit with the Powerpoint Software. Just drag and drop your pictures into the shapes. All facets of this template can be edited with Powerpoint, no extra software is necessary. Add your own material, put your images in the places assigned for them, adjust the colors, and then you can show your slides to the world, with an animated slide included. This slide outlines phases to conduct market trends analysis aimed at identifying current patterns and make data driven decisions. It covers steps such as identify emerging competitors, analyse quantitative data, gather data, conduct primary research and create beta offer
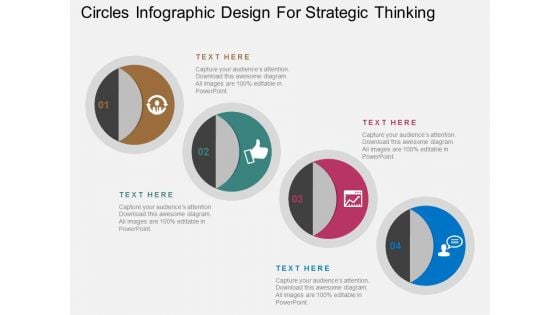
Circles Infographic Design For Strategic Thinking Powerpoint Template
This PowerPoint template has been designed with circles infographic diagram. You may use this slide to display strategic thinking process. This diagram provides an effective way of displaying information you can edit text, color, shade and style as per you need.
Business Framework Highway Sign Board With Editable Text PowerPoint Presentation
This Power Point diagram template has been designed with graphic of highway and board. This board has been designed over the road. This editable board text box can be used to display your desired text. Use this PPT diagram for your timeline and achievement related presentation.
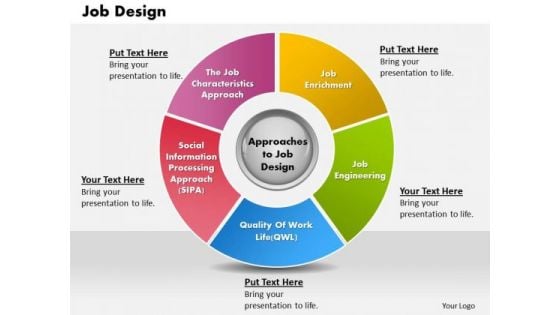
Business Framework Job Design PowerPoint Presentation
This slide displays business framework for job design. This contains circular diagram with five segments depicting approaches in job design. These five approaches are job enrichment, job engineering, quality of work, social information processing approach and the job characteristics approach. Use this professional and customized business diagram in your PowerPoint presentations.
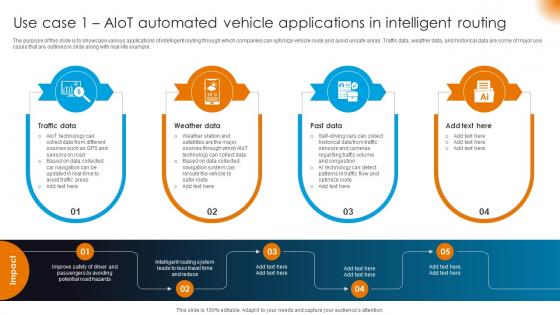
Integrating AI With IoT Use Case 1 AIoT Automated Vehicle Applications In Intelligent Routing IoT SS V
The purpose of this slide is to showcase various applications of intelligent routing through which companies can optimize vehicle route and avoid unsafe areas. Traffic data, weather data, and historical data are some of major use cases that are outlined in slide along with real-life example. If you are looking for a format to display your unique thoughts, then the professionally designed Integrating AI With IoT Use Case 1 AIoT Automated Vehicle Applications In Intelligent Routing IoT SS V is the one for you. You can use it as a Google Slides template or a PowerPoint template. Incorporate impressive visuals, symbols, images, and other charts. Modify or reorganize the text boxes as you desire. Experiment with shade schemes and font pairings. Alter, share or cooperate with other people on your work. Download Integrating AI With IoT Use Case 1 AIoT Automated Vehicle Applications In Intelligent Routing IoT SS V and find out how to give a successful presentation. Present a perfect display to your team and make your presentation unforgettable. The purpose of this slide is to showcase various applications of intelligent routing through which companies can optimize vehicle route and avoid unsafe areas. Traffic data, weather data, and historical data are some of major use cases that are outlined in slide along with real-life example.
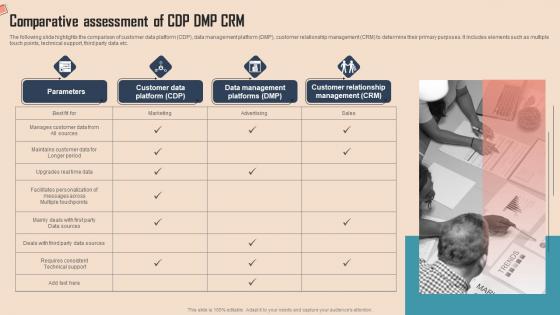
Comparative Assessment Of CDP DMP Comprehensive CDP Guide For Promoters Guidelines Pdf
The following slide highlights the comparison of customer data platform CDP, data management platform DMP, customer relationship management CRM to determine their primary purposes. It includes elements such as multiple touch points, technical support, third party data etc.Do you know about Slidesgeeks Comparative Assessment Of CDP DMP Comprehensive CDP Guide For Promoters Guidelines Pdf These are perfect for delivering any kind od presentation. Using it, create PowerPoint presentations that communicate your ideas and engage audiences. Save time and effort by using our pre-designed presentation templates that are perfect for a wide range of topic. Our vast selection of designs covers a range of styles, from creative to business, and are all highly customizable and easy to edit. Download as a PowerPoint template or use them as Google Slides themes. The following slide highlights the comparison of customer data platform CDP, data management platform DMP, customer relationship management CRM to determine their primary purposes. It includes elements such as multiple touch points, technical support, third party data etc.
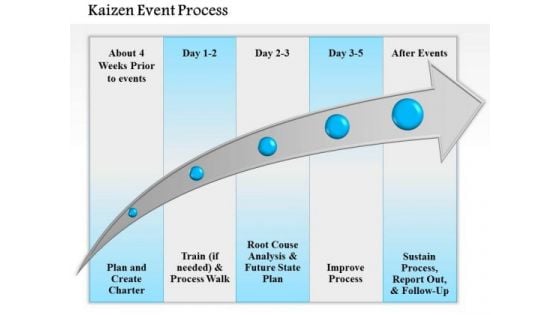
Business Framework Kaizen Event Process PowerPoint Presentation
This slide displays framework of kaizen event process. It contains rectangle with five sections and one arrow in center. This diagram depicts sequence of events like plan and create charter, train and process walk, root cause analysis and future state plan, improve process, sustain process, report out and follow-up. Download this diagram as a tool for business presentations.
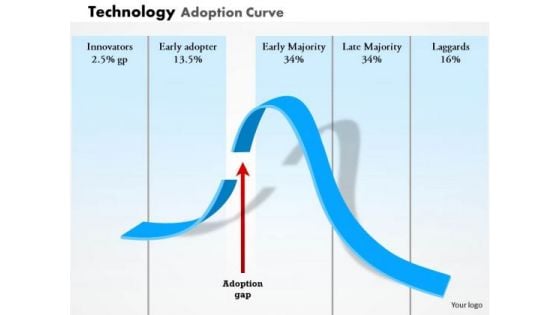
Business Framework Technology Adoption Curve PowerPoint Presentation
This business diagram displays framework of technology adoption curve. It contains curved graph of adoption gap depicting percentage ratio of innovators, early adopter, early majority, late majority and laggards. This diagram enables the users to create their own display of the required processes in an easy way.
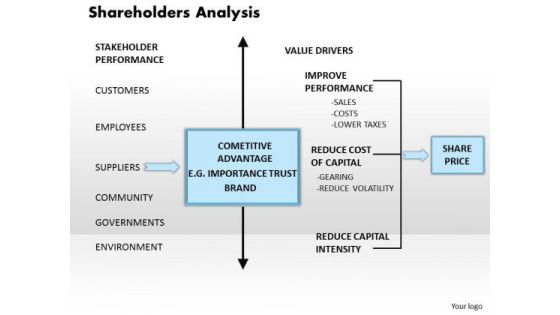
Business Framework Shareholders Analysis PowerPoint Presentation
Explain the concept of shareholder analysis with this innovative graphic template. This power point template contains the graphic of blue colored text box and arrow. This diagram shows the various state of analysis. Use this diagram and build innovative presentation for share and finance related topics.
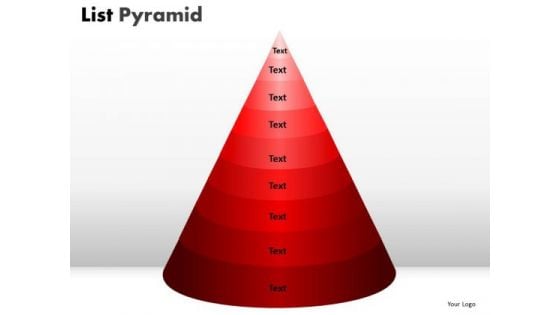
PowerPoint Design List Pyramid Finance Ppt Template
PowerPoint Design List Pyramid Finance PPT Template-The PowerPoint Presentations with pyramid diagrams can be to their best use when items in the template are arranged in such a way to represent the proportional, interconnected and hierarchical structure, quantity and size. -PowerPoint Design List Pyramid Finance PPT Template-Business, Chart, Color, Cone, Cone Shape, Construction, Conus, Data Cone, Diagram, Graph, Group, Growth, Hierarchy, Illustration, Layer, Layered, Layered Cone, Layered Pyramid, Level, Multicolor, Object, Performance, Presentation, Progress, Pyramid, Rank, Reflection, Set, Shape, Stage, Structure, support, symbol, System, Top, Triangle File it with our PowerPoint Design List Pyramid Finance Ppt Template. Get all the information together.
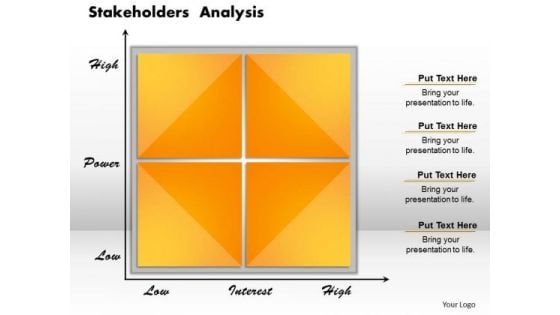
Business Framework Stakeholders Analysis PowerPoint Presentation
This Business framework Power Point template diagram has been crafted with graphic of yellow colored two axis graph. This graph can be used for displaying stakeholder analysis. Use this PPT diagram in your business and finance related presentations. Define marketing management and planning on the basis of this stakeholder analysis.
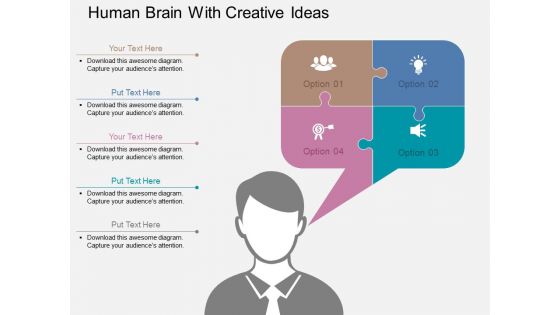
Human Brain With Creative Ideas Powerpoint Templates
This slide illustrates diagram of human brain. You may use it to represent concepts like creative and innovative ideas. This diagram is suitable to display business information and also helps to keep your audience interested till the end of your presentation.
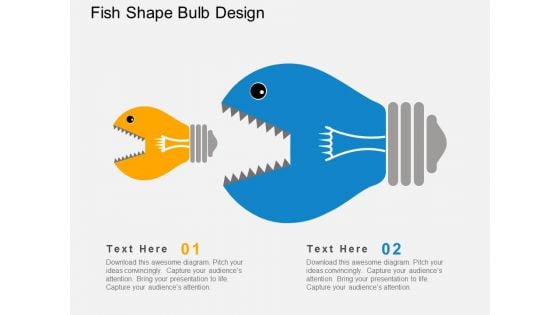
Fish Shape Bulb Design Powerpoint Templates
This PowerPoint template contains graphics of fish shape bulb design. Download this diagram slide to display business ideas and planning. This diagram provides an effective way of displaying information you can edit text, color, shade and style as per you need.

Business Framework Leadership Core Competencies PowerPoint Presentation
This business diagram displays framework for leadership core competencies. It contains structure of human face in segments. It defines leadership core competencies like motivation, self-esteem commitment, interpersonal awareness, decision making and empathy. Use this professional and customized business diagram in your PowerPoint presentations.
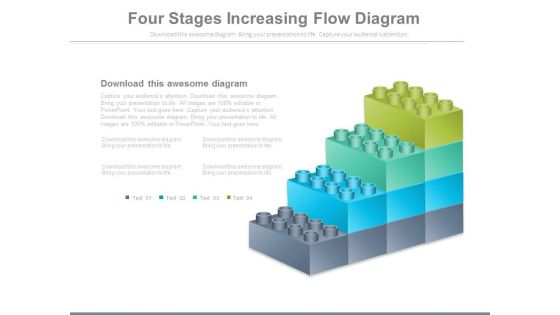
Four Growth Steps Lego Blocks Design Powerpoint Slides
This PowerPoint template has been designed with Lego blocks design. You can use this diagram to display four growth steps. This diagram provides an effective way of displaying information you can edit text, color, shade and style as per you need.
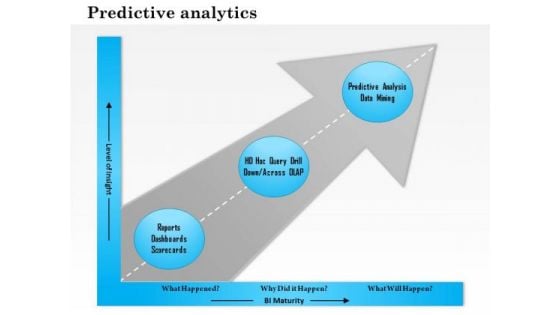
Business Framework Predictive Analytics PowerPoint Presentation
Explain the concept of predictive analytics in any presentation with this unique PPT slide. This PPT diagram slide contains the graphic of arrow diagram with three text boxes on a graph. This PPT slide shows the growth analysis an make a professional presentation.

Business Framework Emotional Intelligence Competencies PowerPoint Presentation
This Power Point template is a business framework . This business PPT contain the graphic of text boxes. This business text box diagram is used to display emotional intelligence. Use this PPT diagram for your self and social awareness related presentations.
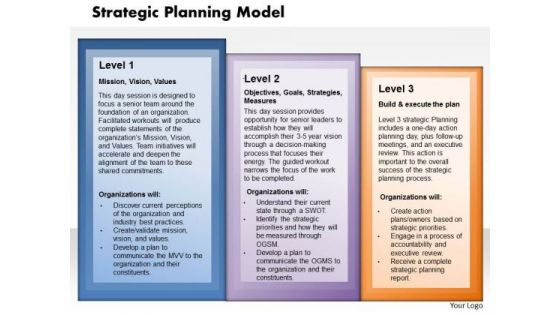
Business Framework Strategy Planning Model PowerPoint Presentation
This business framework power point diagram template has been designed for strategy planning process flow representations. This diagram has been designed with text boxes and flow chart graphic in a vertical sequence. Display sequential process flow for any business and management related presentations.
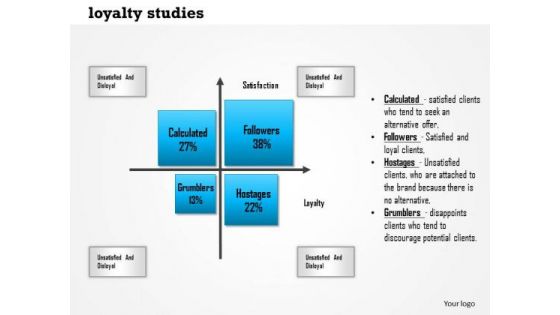
Business Framework Loyalty Studies PowerPoint Presentation
This Power point template diagram slide has been designed with graphic of four text boxes on the same axis. This graphic diagram slide contains the concept of loyalty study. This PPT slide is useful for personal quality and organizational study related topics.
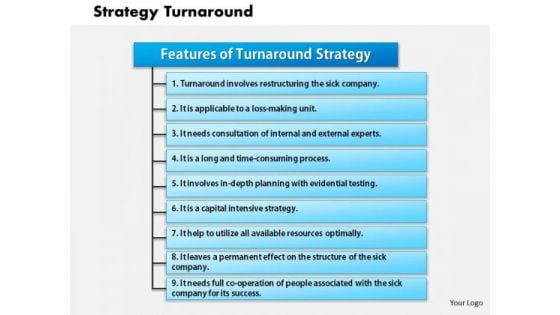
Business Framework Strategy Turnaround PowerPoint Presentation
This business framework power point template has been designed with graphic of text boxes in a vertical order. This diagram template is useful for defining Autonomous Strategic Behaviour and Induced Strategic Behaviour. You can also explain concept of corporate strategy with this exclusive diagram.
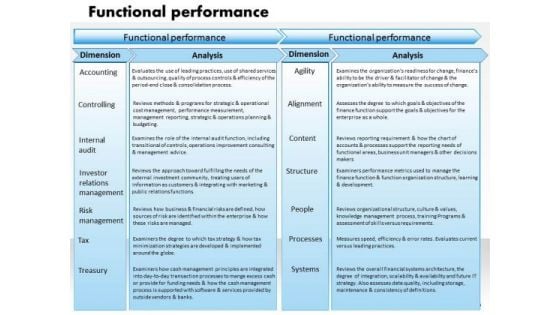
Business Framework Functional Performance PowerPoint Presentation
This image slide has been designed to displays functional performance diagram. This image slide has been designed with textboxes horizontal process diagram with functional performance, dimensions and analysis attributes. Use this image slide in business and marketing presentations to depict accounting, risk management, tax and various dimensions of business. This image slide will enhance the quality of your presentations.
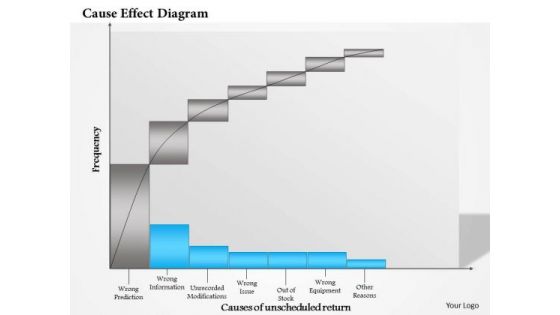
Business Framework Cause Effect PowerPoint Presentation
Discuss the process of root cause analysis with this exclusive PPT. This diagram PPT has been crafted with cause effect or fishbone diagram. This is a Japanese practice for finding the root cause of problem. Use this PPT in your business and production related presentations.
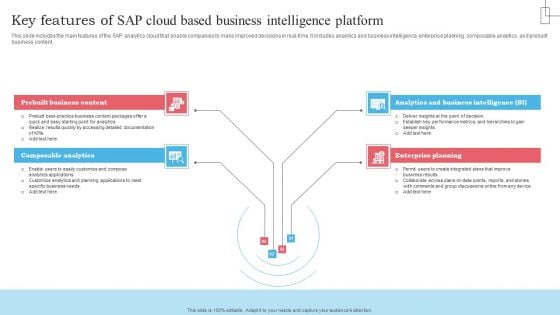
Key Features Of SAP Cloud Based Business Intelligence Platform Download PDF
This slide includes key elements for the successful implementation of the SAP analytics cloud that helps an organization to have a successful project. It includes vision and strategy, data and architecture, use cases and road map, project readiness, etc. Presenting Key Features Of SAP Cloud Based Business Intelligence Platform Download PDF to dispense important information. This template comprises five stages. It also presents valuable insights into the topics including Vision Strategy, Date Architecture, Project Readiness. This is a completely customizable PowerPoint theme that can be put to use immediately. So, download it and address the topic impactfully.
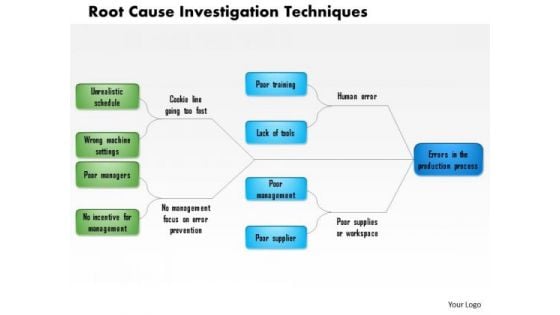
Business Framework Root Cause Investigation Techniques PowerPoint Presentation
A linear flow chart has been used to design this Power Point template slide. This diagram slide contains the concept of root cause analysis and investigation techniques. Use this diagram slide for your business and marketing presentation and show root cause analysis.
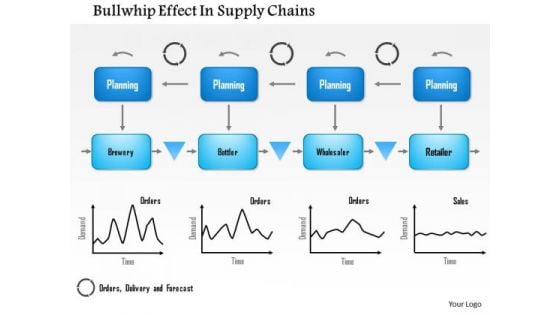
Business Framework Bullwhip Effect In Supply Chains PowerPoint Presentation
Explain the effect of bullwhip condition on larger inventories with this innovative power point diagram slide. This slide contains the graphic of this bullwhip effect with x-y chart for total effect on SCM. This effect is based on customer demand which creates larger swings on inventories. Use this diagram for SCM related presentations.
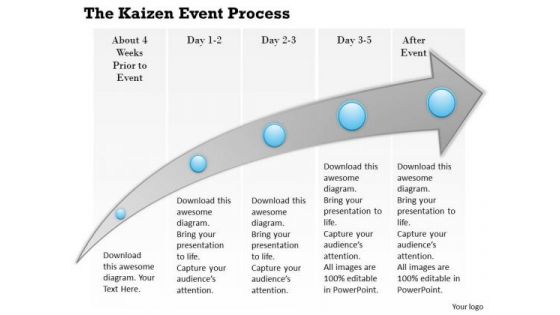
Business Framework The Kaizen Event Process PowerPoint Presentation
This slide displays framework of kaizen event process. It five sections on an arrow. This diagram depicts sequence of events like plan and create charter, train and process walk, root cause analysis and future state plan, improve process, sustain process, report out and follow-up. Download this diagram as a tool for business presentations.
Icons Around Mobile For Communication Powerpoint Slides
This PowerPoint template has been designed with mobile infographic diagram. You may use this slide to display portfolio management and communication. This diagram provides an effective way of displaying information you can edit text, color, shade and style as per you need.
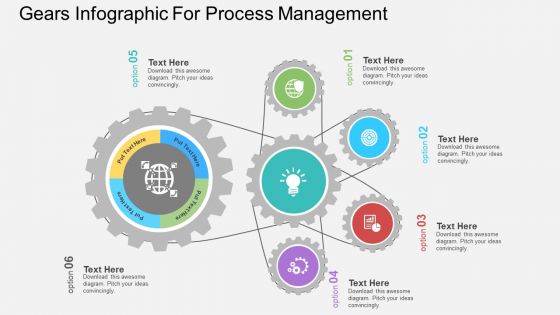
Gears Infographic For Process Management Powerpoint Templates
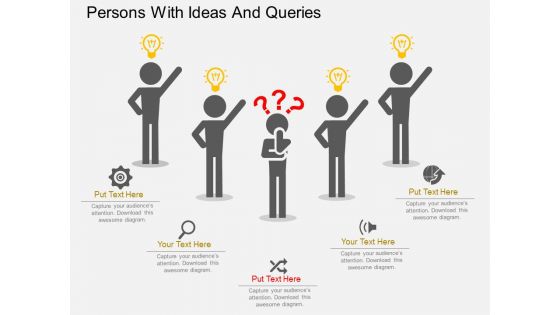
Persons With Ideas And Queries Powerpoint Templates
This business slide has been designed with graphics of 3d men with bulbs and question marks. Download this diagram to exhibit ideas and queries. This diagram slide will?link your ideas into a chain of thought and increase the strength of your overall concept.
Four Connected Circle Chart With Icons Powerpoint Template
This PowerPoint template has been designed with diagram of footprints with smiley. Download this PPT slide to depict success steps. This diagram provides an effective way of displaying information you can edit text, color, shade and style as per you need.
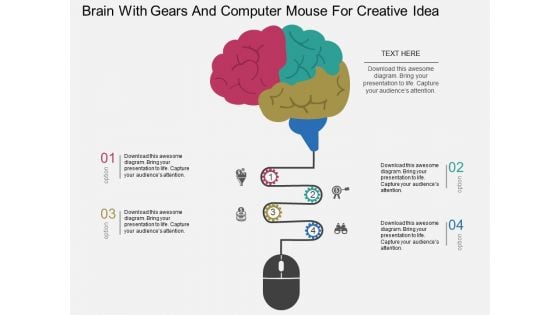
Brain With Gears And Computer Mouse For Creative Idea Powerpoint Template
Our above business diagram has been designed with graphics of brain with gears and computer mouse. This slide is suitable to present creative ideas and technology. Use this business diagram to present your work in a more smart and precise manner.
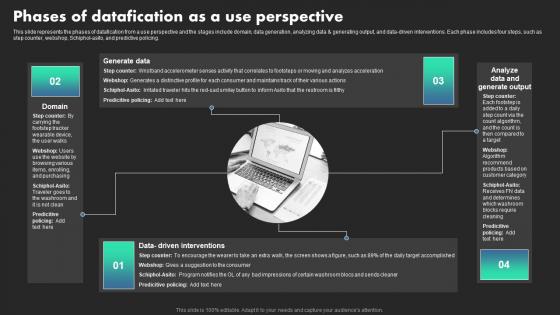
Phases Of Datafication As A Use Perspective Ethical Dimensions Of Datafication Elements Pdf
This slide represents the phases of datafication from a use perspective and the stages include domain, data generation, analyzing data and generating output, and data-driven interventions. Each phase includes four steps, such as step counter, webshop, Schiphol-asito, and predictive policing. Create an editable Phases Of Datafication As A Use Perspective Ethical Dimensions Of Datafication Elements Pdf that communicates your idea and engages your audience. Whether you are presenting a business or an educational presentation, pre-designed presentation templates help save time. Phases Of Datafication As A Use Perspective Ethical Dimensions Of Datafication Elements Pdf is highly customizable and very easy to edit, covering many different styles from creative to business presentations. Slidegeeks has creative team members who have crafted amazing templates. So, go and get them without any delay. This slide represents the phases of datafication from a use perspective and the stages include domain, data generation, analyzing data and generating output, and data-driven interventions. Each phase includes four steps, such as step counter, webshop, Schiphol-asito, and predictive policing.
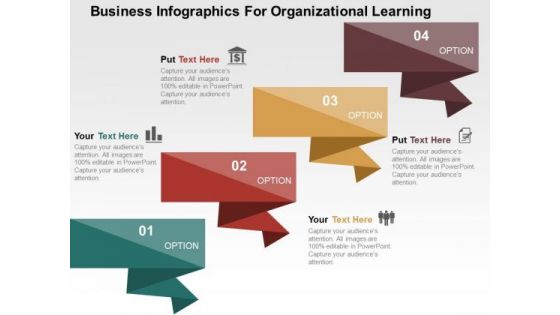
Business Infographics For Organizational Learning PowerPoint Template
This business diagram has been designed with four steps infographic chart. You may use this slide to display infographic for organizational learning. This diagram provides an effective way of displaying information you can edit text, color, shade and style as per you need.
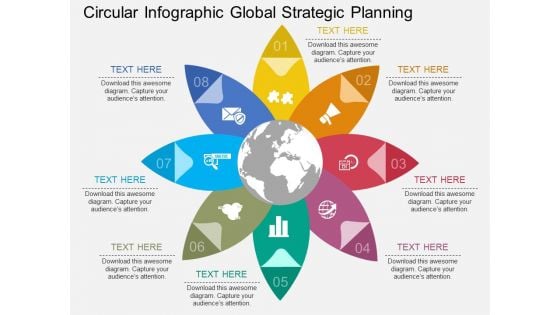
Circular Infographic Global Strategic Planning Powerpoint Template
This business slide has been designed with circular infographic diagram. You may use this slide to display global strategic planning. This diagram provides an effective way of displaying information you can edit text, color, shade and style as per you need.
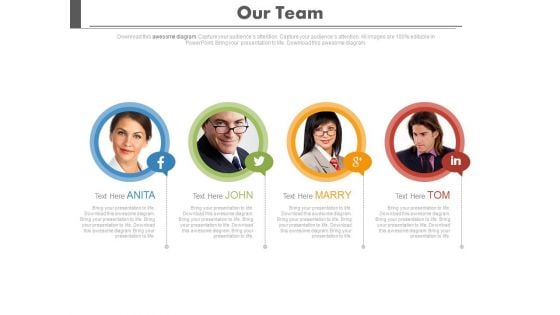
Four Members Of Work Group Powerpoint Slides
Our above PPT slide has been designed with linear graphics with team pictures. You may download this diagram to display working of marketing intelligence team. This diagram provides an effective way of displaying information you can edit text, color, shade and style as per you need.
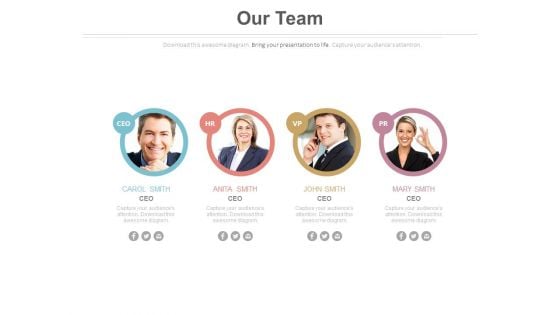
Four Stages Of Team Development Powerpoint Slides
Our above PPT slide has been designed with linear graphics with team pictures. You may download this diagram to display working of marketing intelligence team. This diagram provides an effective way of displaying information you can edit text, color, shade and style as per you need.
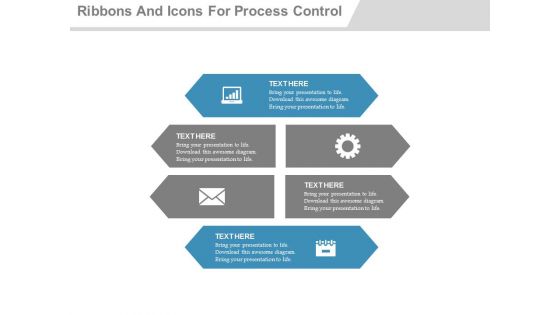
Six Steps For Total Productive Maintenance Powerpoint Template
Our above business diagram has been designed with six text tags with icons. This PPT slide may be used to present concept of total productive maintenance. Use this business diagram to present your work in a more smart and precise manner.
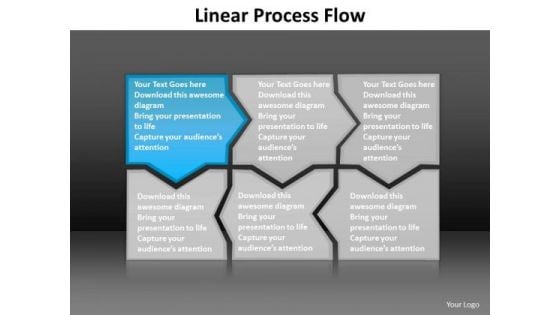
Ppt Blue Piece Connected In Linear Forging Process PowerPoint Slides Flow Templates
PPT blue piece connected in linear forging process powerpoint slides flow Templates-This PowerPoint Diagram shows the blue piece out of all connected pieces to describe the part of the process in Linear Flow. It signifies beeline, continuous, even, horizontal, in bee line, in straight line, linear , nonstop, point-blank, right, shortest, straight, straight ahead, straightaway, through, true, unbroken etc.-Can be used for presentations on abstract, algorithm, arrow, arrow chart, block, block diagram, business, chart, color, connection, design, development, diagram, direction, element, flow, flow chart, flow diagram, flowchart, graph, kind of diagram, linear, linear diagram, management, model, module, motion, organization, plan, process, process arrows, process chart, process diagram, process flow, program, section, segment, set, sign, solution, strategy, symbol, technology, vector, vibrant, workflow, workflow chart, workflow diagram-PPT blue piece connected in linear forging process powerpoint slides flow Templates Aim for the acme with our Ppt Blue Piece Connected In Linear Forging Process PowerPoint Slides Flow Templates. They will carry you to the apex of your career.
Essential IT System Capability For Information Technology Utilization Icons PDF
The following slide highlights the essential system capabilities for information technology utilization illustrating key headings which includes leadership, business system intelligence, architectural planning, technology, informed buying and contract monitoring. Presenting Essential IT System Capability For Information Technology Utilization Icons PDF to dispense important information. This template comprises six stages. It also presents valuable insights into the topics including Business System Intelligence, Architectural Planning, Technology. This is a completely customizable PowerPoint theme that can be put to use immediately. So, download it and address the topic impactfully.
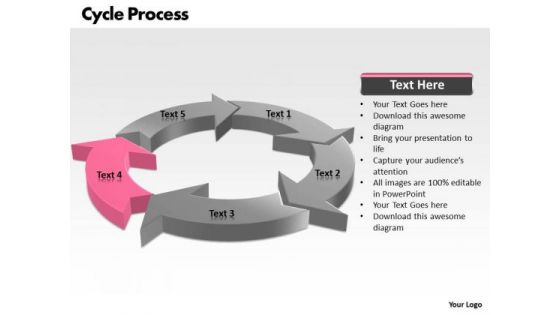
Ppt Circular Arrrow Flow Nursing Process PowerPoint Presentation 5 Stages Templates
PPT circular arrrow flow nursing process powerpoint presentation 5 stages Templates-This diagram helps you to analyze all the connected ideas and also can be used to show five aspects of an issue. This Diagram shows blue aspect of the issue. This PowerPoint Linear process diagram is used to show interrelated ideas or concepts. This diagram is useful in just about any type of presentation. Use this diagram to present your contents in a clear and structured manner.-PPT circular arrrow flow nursing process powerpoint presentation 5 stages Templates-Arrow, Art, Background, Beautiful, Bright, Business, Circle, Collection, Color, Colorful, Concentric, Concept, Connection, Contrast, Creative, Decoration, Design, Effect, Element, Graphic, Green, Group, Icon, Illustration, Image, Isolated, Light, Pattern, Pie, Red, Render, Round, Sample, Shape, Solution, Style, Success, Symbol, Technology, Wheel, White, Yellow Go aerial with our Ppt Circular Arrrow Flow Nursing Process PowerPoint Presentation 5 Stages Templates. Give them a bird's eye view of the conditions.

Ppt Colorful Arrows PowerPoint Slide Text Explaining Seven Aspects Templates
PPT colorful arrows powerpoint slide text explaining seven aspects Templates-Arrows PowerPoint Diagram is nice for financial PowerPoint Diagram presentations as well as other analysis or business PowerPoint diagram needs. Use this graphical approach to represent global business issues such as financial data, stock market Exchange, increase in sales, corporate presentations and more.-PPT colorful arrows powerpoint slide text explaining seven aspects Templates-analysis, arrow, background, business, chart, communication, concept, construction, delivery, design, development, engineering, fabrication, feasibiliti, generated, growth, idea, industry, making, production, products, science, sequence, shape Knit a great story with our Ppt Colorful Arrows PowerPoint Slide Text Explaining Seven Aspects Templates. Make sure your presentation gets the attention it deserves.
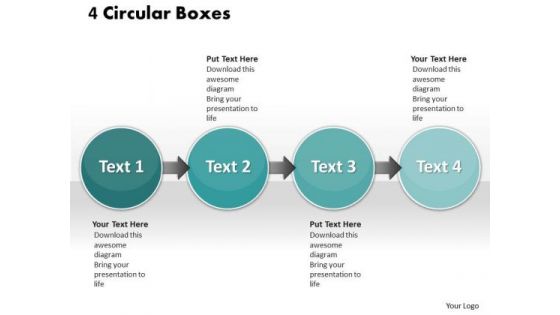
Ppt Straight Execution Of 4 PowerPoint Slide Numbers Templates
PPT straight execution of 4 powerpoint slide numbers Templates-Visually support your ideas and emphatically define your message with our above Diagram. This Diagram is designed to help bullet-point your views and thoughts.-PPT straight execution of 4 powerpoint slide numbers Templates-3d, activity, arrow, art, artwork, box, bubble, business, chart, chat, circular, clip, collection, colorful, communication, company, concept, construction, cursor, data, decoration, design, diagram, download, glossy, graph, graphic, icon, ideas, illustration, recycle, set, shiny, sign, star, style, symbol Convert customers with our Ppt Straight Execution Of 4 PowerPoint Slide Numbers Templates. Download without worries with our money back guaranteee.
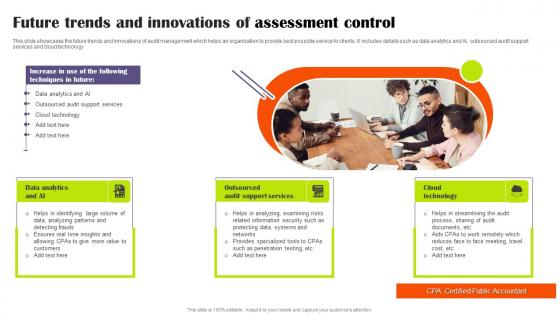
Future Trends And Innovations Of Assessment Control Themes Pdf
This slide showcases the future trends and innovations of audit management which helps an organization to provide best possible service to clients. It includes details such as data analytics and AI, outsourced audit support services and cloud technology Pitch your topic with ease and precision using this Future Trends And Innovations Of Assessment Control Themes Pdf This layout presents information on Data Analytics, Outsourced Audit, Support Services It is also available for immediate download and adjustment. So, changes can be made in the color, design, graphics or any other component to create a unique layout. This slide showcases the future trends and innovations of audit management which helps an organization to provide best possible service to clients. It includes details such as data analytics and AI, outsourced audit support services and cloud technology
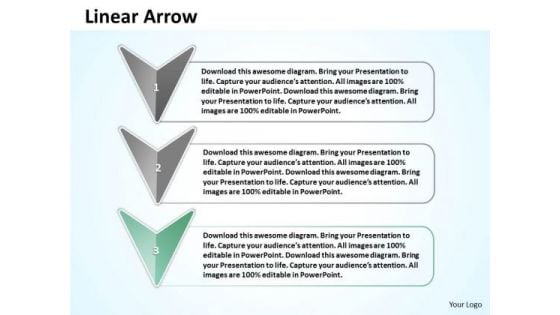
Ppt Linear Arrow With Text Align Boxes PowerPoint 2010 Templates
PPT linear arrow with text align boxes powerpoint 2010 Templates-This arrow diagram can be applied to chronological events and sequence diagrams. Added with an inbuilt text box, they lend a very clear understanding of the arrow diagram. Deliver amazing presentations to mesmerize your audience.-PPT linear arrow with text align boxes powerpoint 2010 Templates-Abstract, Arrow, Art, Artistic, Background, Business, Colorful, Communication, Computer-Graphics, Concept, Creation, Data, Decoration, Decorative, Design, Design-Element, Digital, Direction, Effect, Elegance, Element, Energy, Flow, Go, Idea, Illustration, Modern, Movement, Network, Symbol Transfer knowledge with our Ppt Linear Arrow With Text Align Boxes PowerPoint 2010 Templates. Download without worries with our money back guaranteee.
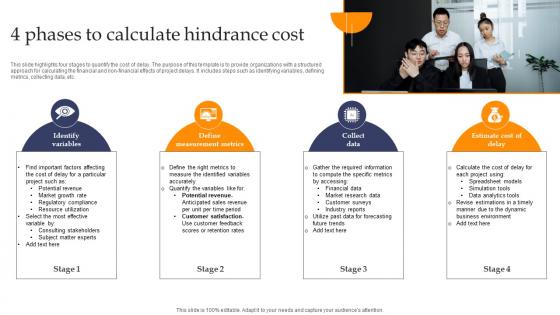
4 Phases To Calculate Hindrance Cost Structure pdf
This slide highlights four stages to quantify the cost of delay. The purpose of this template is to provide organizations with a structured approach for calculating the financial and non-financial effects of project delays. It includes steps such as identifying variables, defining metrics, collecting data, etc. Pitch your topic with ease and precision using this 4 Phases To Calculate Hindrance Cost Structure pdf. This layout presents information on Identify Variables, Define Measurement Metrics, Collect Data . It is also available for immediate download and adjustment. So, changes can be made in the color, design, graphics or any other component to create a unique layout. This slide highlights four stages to quantify the cost of delay. The purpose of this template is to provide organizations with a structured approach for calculating the financial and non-financial effects of project delays. It includes steps such as identifying variables, defining metrics, collecting data, etc.


 Continue with Email

 Home
Home


