Data Chart
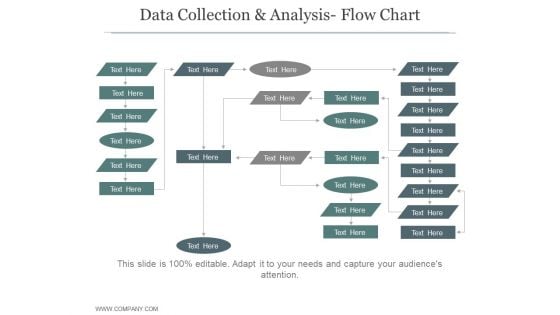
Data Collection And Analysis Flow Chart Ppt PowerPoint Presentation Sample
This is a data collection and analysis flow chart ppt powerpoint presentation sample. This is a five stage process. The stages in this process are business, strategy, marketing, process, growth strategy, finance.
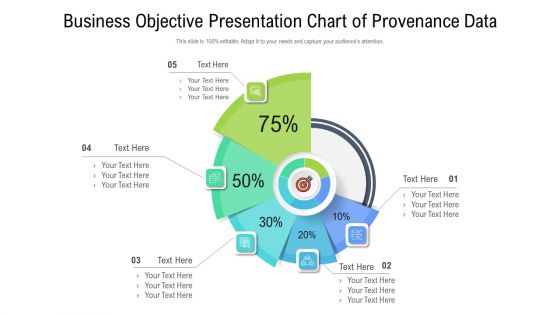
Business Objective Presentation Chart Of Provenance Data Download PDF
Presenting business objective presentation chart of provenance data download pdf to dispense important information. This template comprises five stages. It also presents valuable insights into the topics including business objective presentation chart of provenance data. This is a completely customizable PowerPoint theme that can be put to use immediately. So, download it and address the topic impactfully.
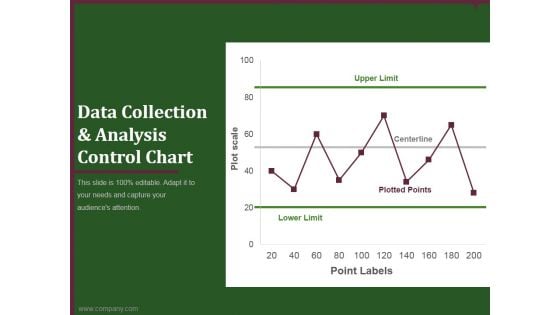
data collection and analysis control chart ppt powerpoint presentation styles
This is a data collection and analysis control chart ppt powerpoint presentation styles. This is a one stage process. The stages in this process are upper limit, centerline, plotted points, lower limit, point labels.
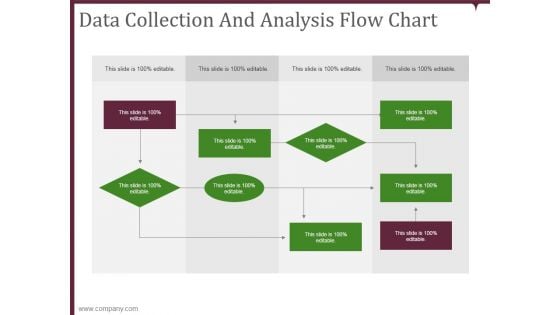
data collection and analysis flow chart ppt powerpoint presentation microsoft
This is a data collection and analysis flow chart ppt powerpoint presentation microsoft. This is a nine stage process. The stages in this process are business, planning, marketing, strategy, management.
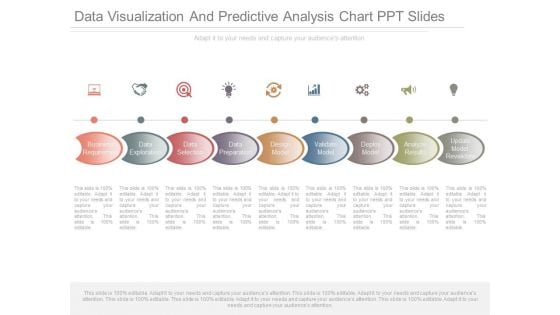
Data Visualization And Predictive Analysis Chart Ppt Slides
This is a data visualization and predictive analysis chart ppt slides. This is a nine stage process. The stages in this process are business requirement, data exploration, data selection, data preparation, design model, validate model, deploy model, analyze results, update model, revalidate.
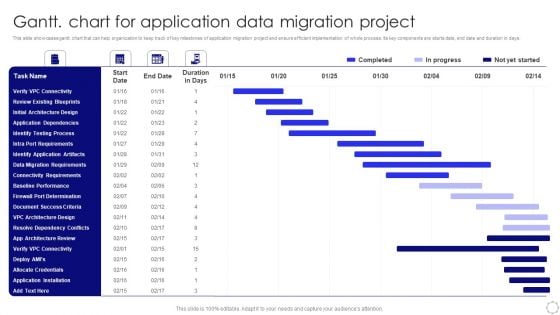
Gantt Chart For Application Data Migration Project Elements PDF
This slide showcases gantt. chart that can help organization to keep track of key milestones of application migration project and ensure efficient implementation of whole process. Its key components are starts date, end date and duration in days. Pitch your topic with ease and precision using this Gantt Chart For Application Data Migration Project Elements PDF. This layout presents information on Data Migration Requirements, Application Dependencies, Application Installation. It is also available for immediate download and adjustment. So, changes can be made in the color, design, graphics or any other component to create a unique layout.
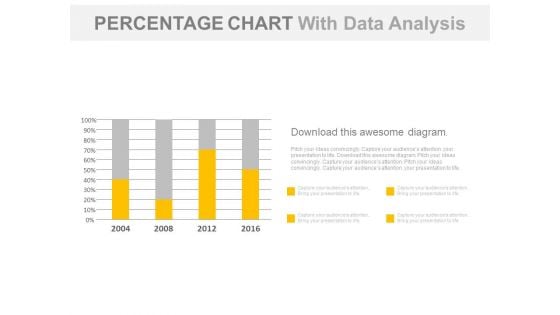
Year Based Chart With Percentage Data Analysis Powerpoint Slides
Our above business slide contains year based statistical chart. This PowerPoint template can be used to display percentage data analysis. Capture the attention of your audience with this slide.
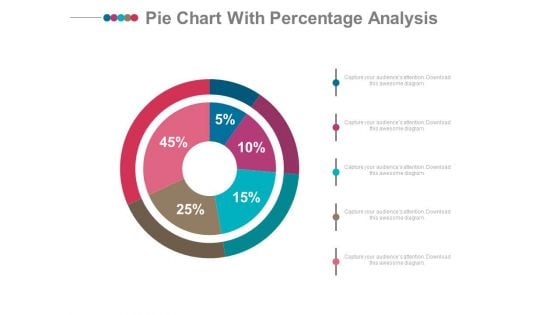
Pie Chart With Financial Data Comparison Powerpoint Slides
Emphatically define your message with our above template which contains graphics of pie chart. This PowerPoint template may be used to display financial data comparison. Grab the attention of your listeners with this slide.
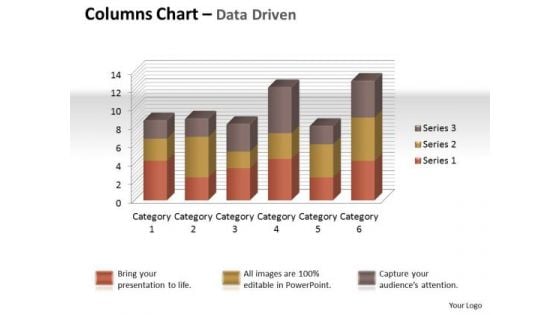
Excel Data Analysis Data Tools Data Methods Statistical Tool Chart PowerPoint Templates
Give Your Thoughts Some Durability. Coat Them With Our excel data analysis data tools data methods statistical tool chart Powerpoint Templates .
Customer Voice Service Data Flow Charts Ppt PowerPoint Presentation Icon Styles PDF
This slide presents a data flow charts, which includes visual data about the inputs and outputs of entities and processes illustrating the flow of information between client voice services and data verse. it covers procedures including create project, distribute survey, respond to survey and analyse results. Presenting Customer Voice Service Data Flow Charts Ppt PowerPoint Presentation Icon Styles PDF to dispense important information. This template comprises one stages. It also presents valuable insights into the topics including Create Project, Distribute Survey, Analyze Results, Project Information. This is a completely customizable PowerPoint theme that can be put to use immediately. So, download it and address the topic impactfully.
Data Flow Charts For Social Media Application Icons Ppt PowerPoint Presentation Gallery Slide Portrait PDF
Presenting Data Flow Charts For Social Media Application Icons Ppt PowerPoint Presentation Gallery Slide Portrait PDF to dispense important information. This template comprises three stages. It also presents valuable insights into the topics including Data Flow Charts, Social Media Application, Icons. This is a completely customizable PowerPoint theme that can be put to use immediately. So, download it and address the topic impactfully.
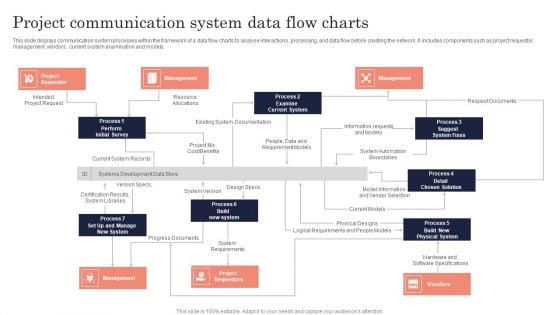
Project Communication System Data Flow Charts Ppt PowerPoint Presentation Gallery Background Images PDF
This slide displays communication system processes within the framework of a data flow charts to analyse interactions, processing, and data flow before creating the network. it includes components such as project requestor, management, vendors, current system examination and models. Presenting Project Communication System Data Flow Charts Ppt PowerPoint Presentation Gallery Background Images PDF to dispense important information. This template comprises six stages. It also presents valuable insights into the topics including Project Requestor, Management, Vendors. This is a completely customizable PowerPoint theme that can be put to use immediately. So, download it and address the topic impactfully.
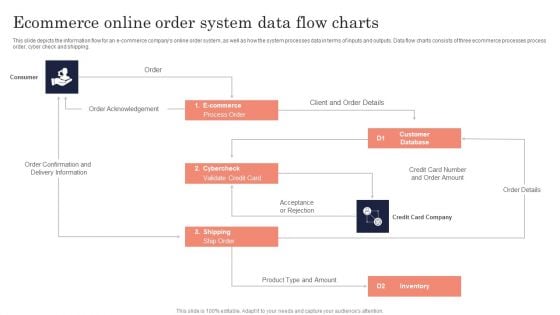
Ecommerce Online Order System Data Flow Charts Ppt PowerPoint Presentation File Slides PDF
This slide depicts the information flow for an e-commerce companys online order system, as well as how the system processes data in terms of inputs and outputs. Data flow charts consists of three ecommerce processes process order, cyber check and shipping. Presenting Ecommerce Online Order System Data Flow Charts Ppt PowerPoint Presentation File Slides PDF to dispense important information. This template comprises two stages. It also presents valuable insights into the topics including Customer, Database Inventory, Cybercheck. This is a completely customizable PowerPoint theme that can be put to use immediately. So, download it and address the topic impactfully.
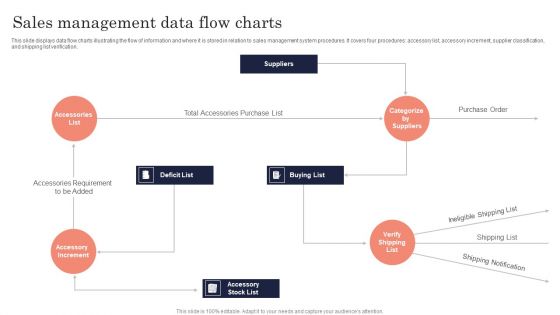
Sales Management Data Flow Charts Ppt PowerPoint Presentation File Slide Portrait PDF
This slide displays data flow charts illustrating the flow of information and where it is stored in relation to sales management system procedures. it covers four procedures accessory list, accessory increment, supplier classification, and shipping list verification. Persuade your audience using this Sales Management Data Flow Charts Ppt PowerPoint Presentation File Slide Portrait PDF. This PPT design covers three stages, thus making it a great tool to use. It also caters to a variety of topics including Deficit List, Buying List, Accessory Stock List. Download this PPT design now to present a convincing pitch that not only emphasizes the topic but also showcases your presentation skills.
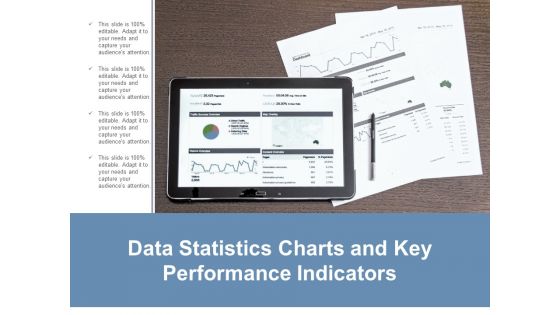
Data Statistics Charts And Key Performance Indicators Ppt Powerpoint Presentation Layouts Guide
This is a data statistics charts and key performance indicators ppt powerpoint presentation layouts guide. This is a four stage process. The stages in this process are business metrics, business kpi, business dashboard.
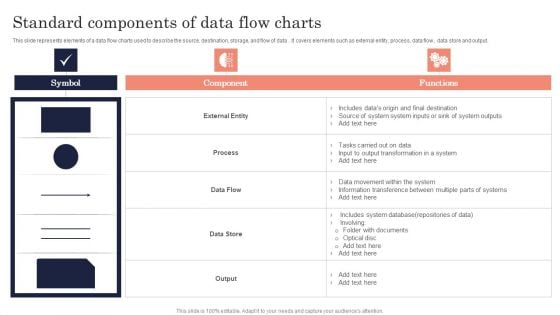
Standard Components Of Data Flow Charts Ppt PowerPoint Presentation File Pictures PDF
this slide represents elements of a data flow charts used to describe the source, destination, storage, and flow of data. it covers elements such as external entity, process, data flow, data store and output. Showcasing this set of slides titled Standard Components Of Data Flow Charts Ppt PowerPoint Presentation File Pictures PDF. The topics addressed in these templates are Symbol, Component, Functions. All the content presented in this PPT design is completely editable. Download it and make adjustments in color, background, font etc. as per your unique business setting.
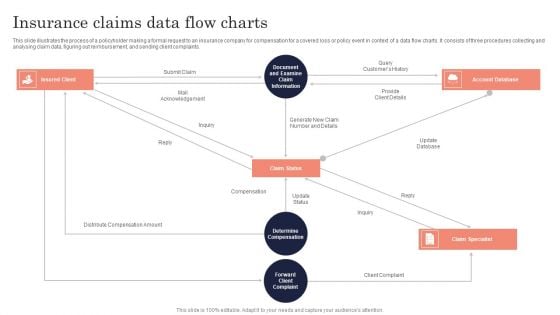
Insurance Claims Data Flow Charts Ppt PowerPoint Presentation File Formats PDF
This slide illustrates the process of a policyholder making a formal request to an insurance company for compensation for a covered loss or policy event in context of a data flow charts. It consists of three procedures collecting and analysing claim data, figuring out reimbursement, and sending client complaints. Persuade your audience using this Insurance Claims Data Flow Charts Ppt PowerPoint Presentation File Formats PDF. This PPT design covers three stages, thus making it a great tool to use. It also caters to a variety of topics including Insured Client, Claim Status, Account Database. Download this PPT design now to present a convincing pitch that not only emphasizes the topic but also showcases your presentation skills.
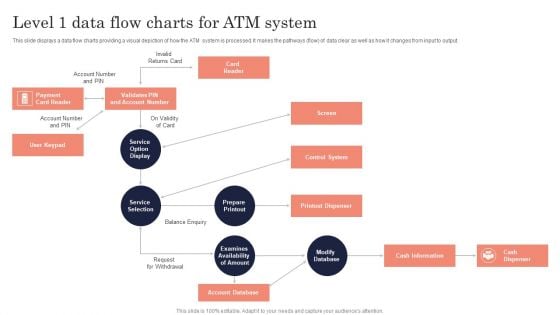
Level 1 Data Flow Charts For ATM System Ppt PowerPoint Presentation Gallery Visual Aids PDF
Presenting Level 1 Data Flow Charts For ATM System Ppt PowerPoint Presentation Gallery Visual Aids PDF to dispense important information. This template comprises two stages. It also presents valuable insights into the topics including Payment Card Reader, User Keypad, Control System, Printout Dispenser. This is a completely customizable PowerPoint theme that can be put to use immediately. So, download it and address the topic impactfully.
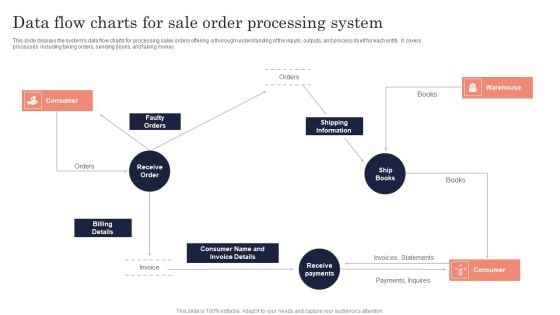
Data Flow Charts For Sale Order Processing System Ppt PowerPoint Presentation File Introduction PDF
Persuade your audience using this Data Flow Charts For Sale Order Processing System Ppt PowerPoint Presentation File Introduction PDF. This PPT design covers three stages, thus making it a great tool to use. It also caters to a variety of topics including Consumer, Faulty Orders, Billing Details. Download this PPT design now to present a convincing pitch that not only emphasizes the topic but also showcases your presentation skills.
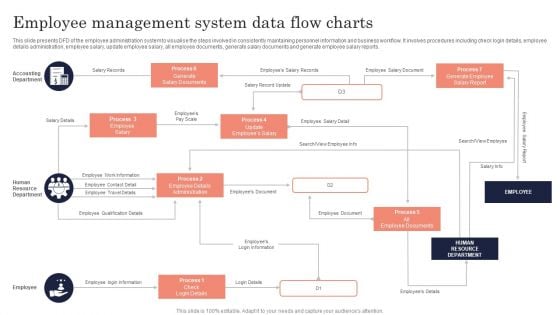
Employee Management System Data Flow Charts Ppt PowerPoint Presentation File Clipart Images PDF
Persuade your audience using this Employee Management System Data Flow Charts Ppt PowerPoint Presentation File Clipart Images PDF. This PPT design covers three stages, thus making it a great tool to use. It also caters to a variety of topics including Accounting Department, Human Resource Department, Employee. Download this PPT design now to present a convincing pitch that not only emphasizes the topic but also showcases your presentation skills.
Securities Trading Platform Data Flow Charts Ppt PowerPoint Presentation Gallery Icons PDF
This Slides displays a thorough data flow chartsthat graphically illustrates the operations of a securities trading platform, as well as the sources and recipients of the information. It includes five processes such as open account, verify transaction, deposit cash, withdraw cash and place order. Presenting Securities Trading Platform Data Flow Charts Ppt PowerPoint Presentation Gallery Icons PDF to dispense important information. This template comprises six stages. It also presents valuable insights into the topics including Account, Transaction, Consumer Service Assistant, Client. This is a completely customizable PowerPoint theme that can be put to use immediately. So, download it and address the topic impactfully.
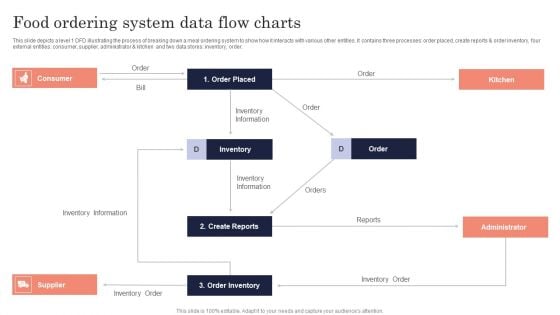
Food Ordering System Data Flow Charts Ppt PowerPoint Presentation File Pictures PDF
This slide depicts a level 1 DFD illustrating the process of breaking down a meal ordering system to show how it interacts with various other entities. It contains three processes order placed, create reports and order inventory, four external entities consumer, supplier, administrator and kitchen and two data stores inventory, order. Presenting Food Ordering System Data Flow Charts Ppt PowerPoint Presentation File Pictures PDF to dispense important information. This template comprises one stages. It also presents valuable insights into the topics including Consumer, Order Placed, Administrator, Inventory. This is a completely customizable PowerPoint theme that can be put to use immediately. So, download it and address the topic impactfully.
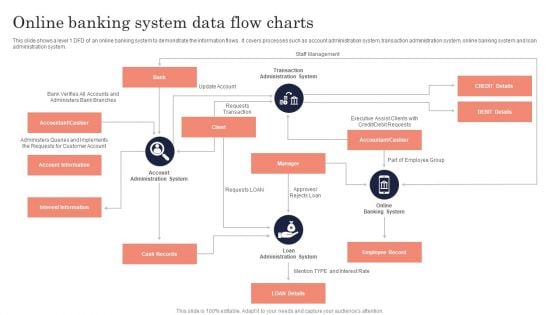
Online Banking System Data Flow Charts Ppt PowerPoint Presentation File Layout Ideas PDF
this slide shows a level 1 dfd of an online banking system to demonstrate the information flows. it covers processes such as account administration system, transaction administration system, online banking system and loan administration system. Persuade your audience using this Online Banking System Data Flow Charts Ppt PowerPoint Presentation File Layout Ideas PDF. This PPT design covers four stages, thus making it a great tool to use. It also caters to a variety of topics including Transaction Administration System, Accountant, Cashier, Employee Record. Download this PPT design now to present a convincing pitch that not only emphasizes the topic but also showcases your presentation skills.
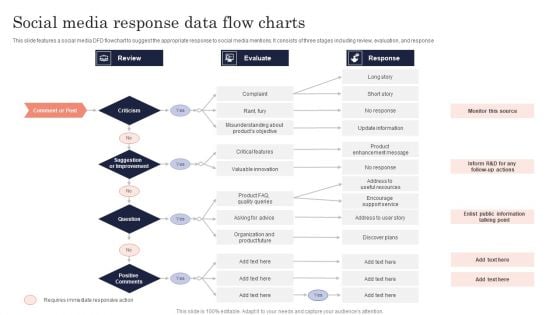
Social Media Response Data Flow Charts Ppt PowerPoint Presentation Gallery Background Designs PDF
This slide features a social media dfd flowchart to suggest the appropriate response to social media mentions. it consists of three stages including review, evaluation, and response. Persuade your audience using this Social Media Response Data Flow Charts Ppt PowerPoint Presentation Gallery Background Designs PDF. This PPT design covers three stages, thus making it a great tool to use. It also caters to a variety of topics including Review, Evaluate, Response, Comment Or Post. Download this PPT design now to present a convincing pitch that not only emphasizes the topic but also showcases your presentation skills.
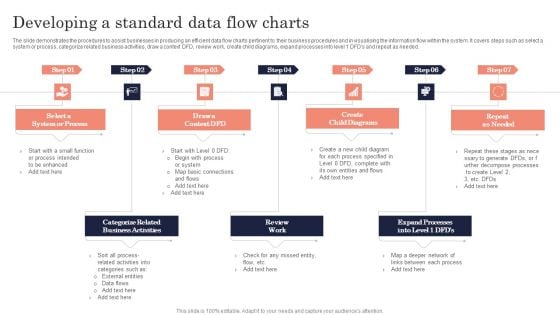
Developing A Standard Data Flow Charts Ppt PowerPoint Presentation File Clipart PDF
The slide demonstrates the procedures to assist businesses in producing an efficient data flow chartspertinent to their business procedures and in visualising the information flow within the system. it covers steps such as select a system or process, categorize related business activities, draw a context dfd, review work, create child diagrams, expand processes into level 1 dfds and repeat as needed. Persuade your audience using this Developing A Standard Data Flow Charts Ppt PowerPoint Presentation File Clipart PDF. This PPT design covers seven stages, thus making it a great tool to use. It also caters to a variety of topics including Create Child Diagrams, Repeat As Needed, Review Work. Download this PPT design now to present a convincing pitch that not only emphasizes the topic but also showcases your presentation skills.
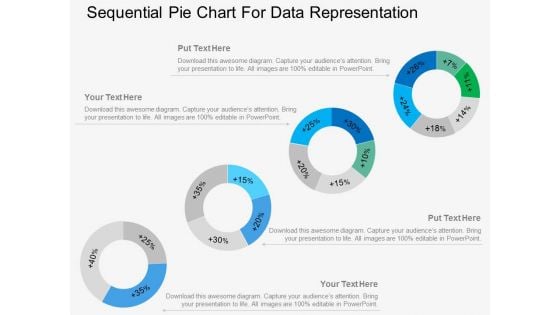
Four Sequential Pie Charts For Data Representation Powerpoint Template
Our above PowerPoint template displays infographic diagram of sequential pie chart. This diagram slide may be used for data representation in visual manner. Above slide provide ideal backdrop to make business presentations.
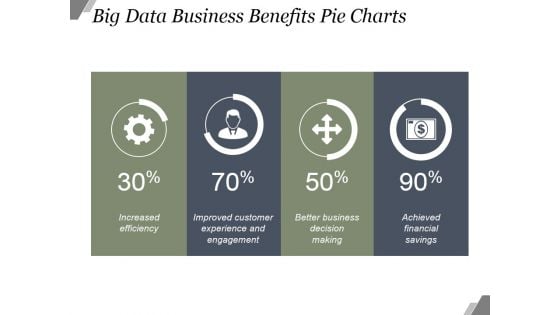
Big Data Business Benefits Pie Charts Ppt PowerPoint Presentation Backgrounds
This is a big data business benefits pie charts ppt powerpoint presentation backgrounds. This is a four stage process. The stages in this process are business, marketing, icons, strategy, management.
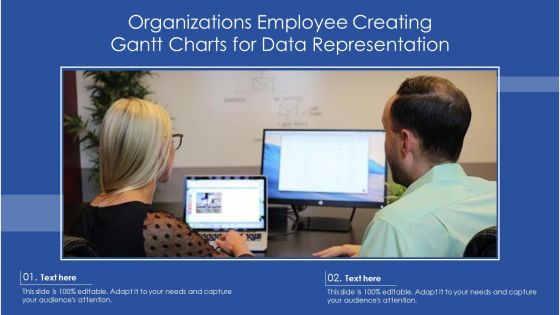
Organizations Employee Creating Gantt Charts For Data Representation Download PDF
Persuade your audience using this organizations employee creating gantt charts for data representation download pdf. This PPT design covers two stages, thus making it a great tool to use. It also caters to a variety of topics including organizations employee creating gantt charts for data representation. Download this PPT design now to present a convincing pitch that not only emphasizes the topic but also showcases your presentation skills.

Data Analysis Excel Categorical Statistics Doughnut Chart PowerPoint Templates
Establish Your Dominion With Our data analysis excel categorical statistics doughnut chart Powerpoint Templates. Rule The Stage With Your Thoughts.
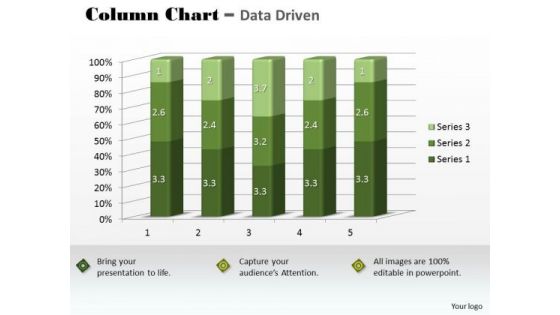
Marketing Data Analysis 3d Statistical Quality Control Chart PowerPoint Templates
Our marketing data analysis 3d statistical quality control chart Powerpoint Templates Abhor Doodling. They Never Let The Interest Flag.
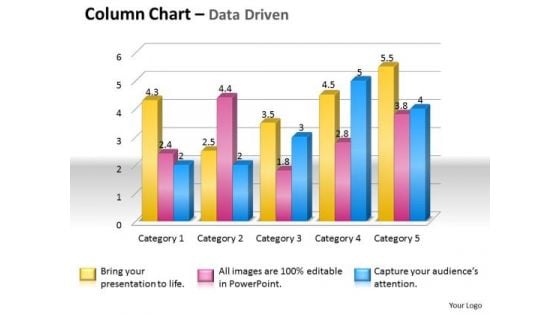
Data Analysis Techniques 3d Grouped Bar Chart PowerPoint Templates
Place The Orders With Your Thoughts. Our data analysis techniques 3d grouped bar chart Powerpoint Templates Know The Drill.
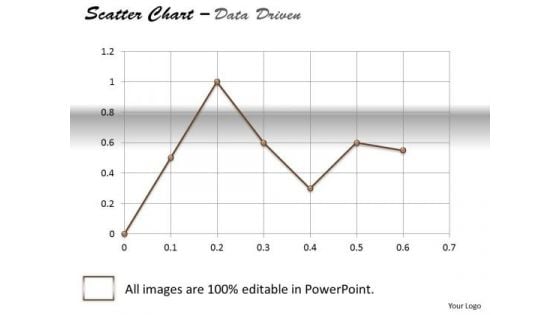
Data Analysis Excel Business Tool Scatter Chart PowerPoint Templates
Dominate Proceedings With Your Ideas. Our data analysis excel business tool scatter chart Powerpoint Templates Will Empower Your Thoughts.
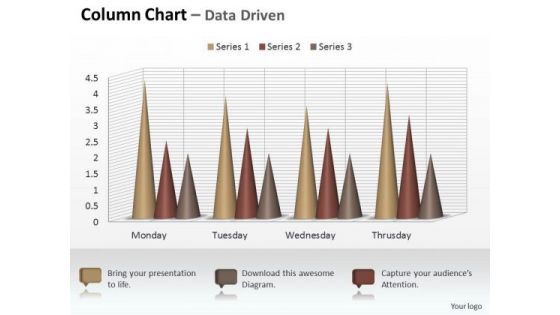
Marketing Data Analysis 3d Sets Of Column Chart PowerPoint Templates
Your Listeners Will Never Doodle. Our marketing data analysis 3d sets of column chart Powerpoint Templates Will Hold Their Concentration.

Data Analysis Techniques 3d Effective Display Chart PowerPoint Templates
Dribble Away With Our data analysis techniques 3d effective display chart Powerpoint Templates . Score A Goal With Your Ideas.
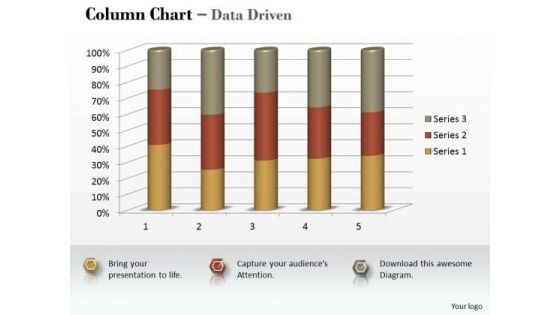
Marketing Data Analysis 3d Statistical Process Column Chart PowerPoint Templates
Be A Donor Of Great Ideas. Display Your Charity On Our marketing data analysis 3d statistical process column chart Powerpoint Templates .
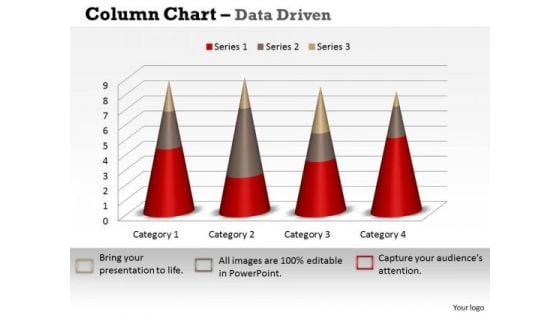
Marketing Data Analysis 3d Statistical Process Control Chart PowerPoint Templates
Open Up Doors That Lead To Success. Our marketing data analysis 3d statistical process control chart Powerpoint Templates Provide The Handles.
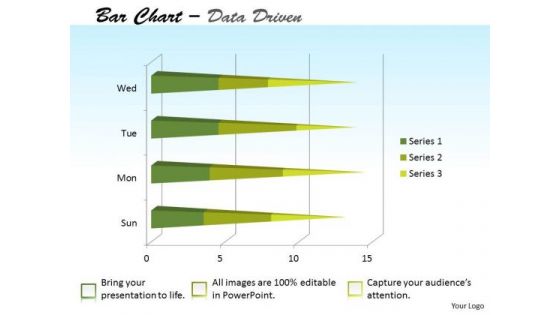
Data Analysis Template Forex Market Bar Chart PowerPoint Templates
Attract A Crowd With Our data analysis template forex market bar chart Powerpoint Templates . They Will Drop It All And Come To Hear You.
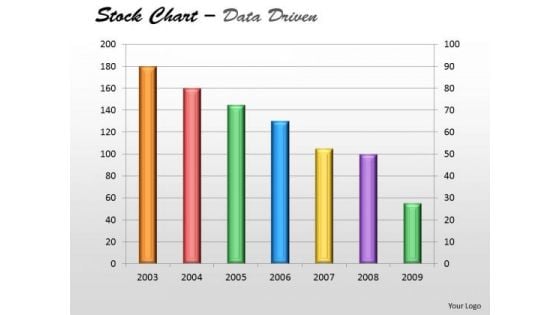
Data Analysis In Excel Of Stock Chart PowerPoint Templates
Plan Your Storyboard With Our data analysis in excel of stock chart Powerpoint Templates . Give An Outline To The Solutions You Have.
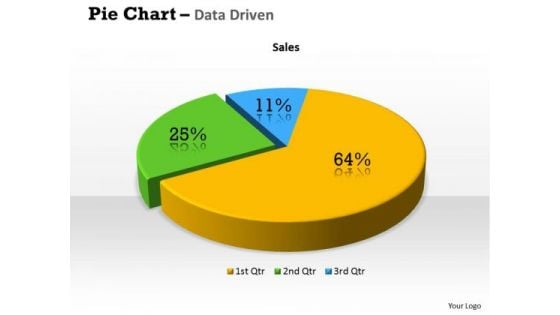
Quantitative Data Analysis 3d Percentage Ratio Pie Chart PowerPoint Templates
Plan Your Storyboard With Our quantitative data analysis 3d percentage ratio pie chart Powerpoint Templates . Give An Outline To The Solutions You Have.
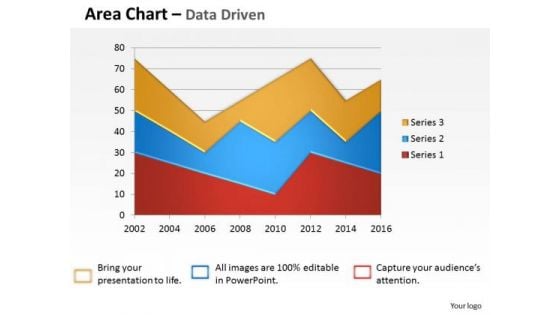
Data Analysis Template Driven Visualization Area Chart PowerPoint Slides Templates
Draw On The Energy Of Our data analysis template driven visualization area chart powerpoint slides Templates . Your Thoughts Will Perk Up.
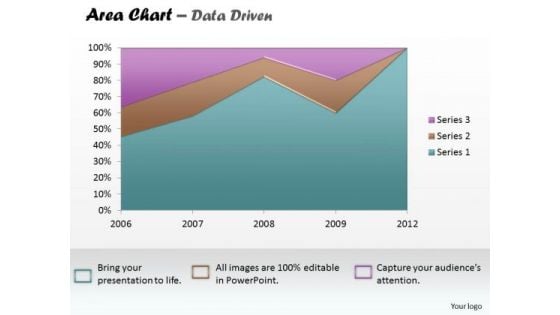
Data Analysis Excel Business Reporting Area Chart PowerPoint Templates
Establish The Dominance Of Your Ideas. Our data analysis excel business reporting area chart Powerpoint Templates Will Put Them On Top.
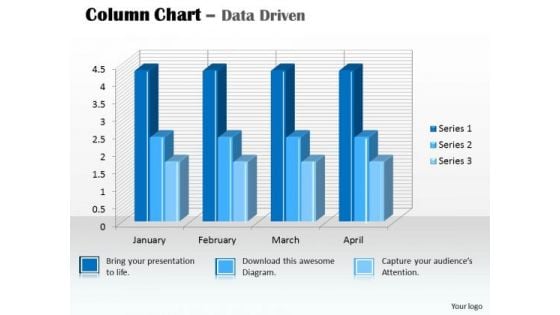
Data Analysis In Excel 3d Column Chart For PowerPoint Templates
Our data analysis in excel 3d column chart for Powerpoint Templates And Your Ideas Make A Great Doubles Pair. Play The Net With Assured Hands.
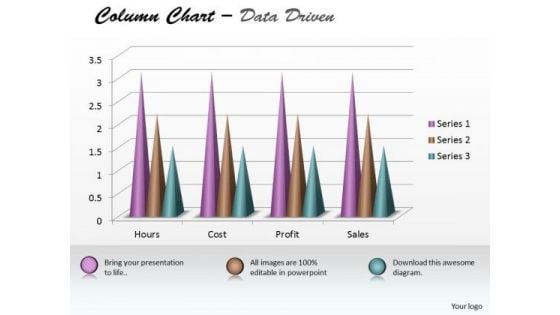
Excel Data Analysis Data Tools Data Methods Statistical Tool Survey Chart PowerPoint Templates
Analyze Ailments On Our excel data analysis data tools data methods statistical tool survey chart Powerpoint Templates . Bring Out The Thinking Doctor In You. Dock Your Thoughts With Our Excel Data Analysis . They Will Launch Them Into Orbit.
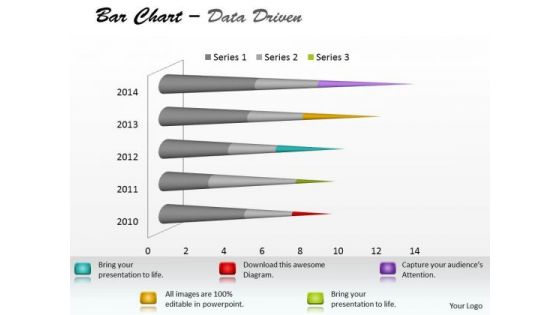
Microsoft Excel Data Analysis Bar Chart To Communicate Information PowerPoint Templates
With Our microsoft excel data analysis bar chart to communicate information Powerpoint Templates You Will Be Doubly Sure. They Possess That Stamp Of Authority.
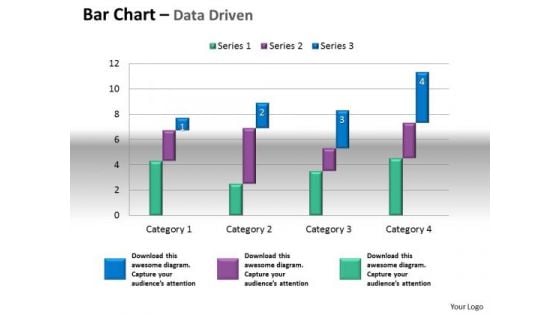
Microsoft Excel Data Analysis Bar Chart To Compare Quantities PowerPoint Templates
Our microsoft excel data analysis bar chart to compare quantities Powerpoint Templates Leave No One In Doubt. Provide A Certainty To Your Views.
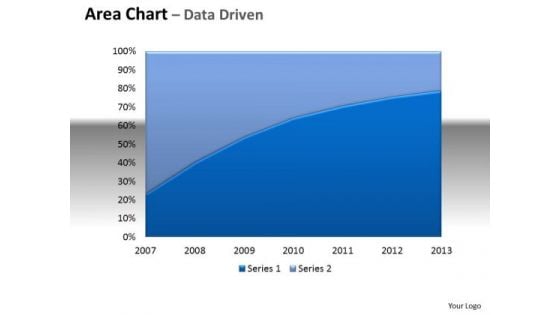
Financial Data Analysis Area Chart With Plotted Line Center PowerPoint Templates
Be The Doer With Our financial data analysis area chart with plotted line center Powerpoint Templates . Put Your Thoughts Into Practice.
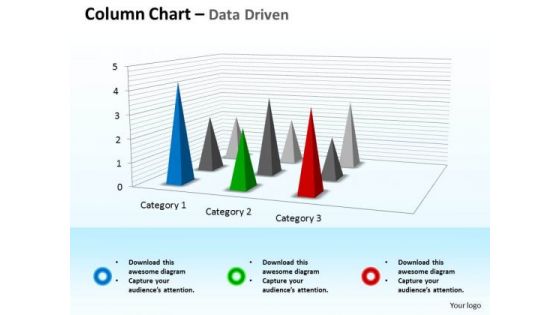
Microsoft Excel Data Analysis 3d Chart For Business Observation PowerPoint Templates
Double Up Our microsoft excel data analysis 3d chart for business observation Powerpoint Templates With Your Thoughts. They Will Make An Awesome Pair.
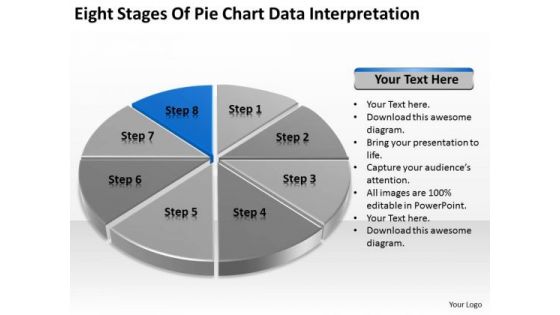
Eight Stages Of Pie Chart Data Interpretation Detailed Business Plan PowerPoint Templates
We present our eight stages of pie chart data interpretation detailed business plan PowerPoint templates.Download and present our Competition PowerPoint Templates because You can Stir your ideas in the cauldron of our PowerPoint Templates and Slides. Cast a magic spell on your audience. Download and present our Marketing PowerPoint Templates because You should Kick up a storm with our PowerPoint Templates and Slides. The heads of your listeners will swirl with your ideas. Download and present our Arrows PowerPoint Templates because Your ideas provide food for thought. Our PowerPoint Templates and Slides will help you create a dish to tickle the most discerning palate. Present our Circle Charts PowerPoint Templates because You can Stir your ideas in the cauldron of our PowerPoint Templates and Slides. Cast a magic spell on your audience. Download our Business PowerPoint Templates because You can Score a slam dunk with our PowerPoint Templates and Slides. Watch your audience hang onto your every word.Use these PowerPoint slides for presentations relating to chart, graph, pie, 3d, diagram, graphic, icon, control, business, data, profit, market, sales, display, corporate, concept, render, success, presentation, finance, report, marketing, accounting, management, piece, strategy, money, growth, company, competition, progress, account, sheet, part, information, investment, improvement, banking, index, financial, reflect, results, performance, exchange. The prominent colors used in the PowerPoint template are Blue, Black, Gray. Exult in the comfort of our Eight Stages Of Pie Chart Data Interpretation Detailed Business Plan PowerPoint Templates. Experience the convenience they deliver.
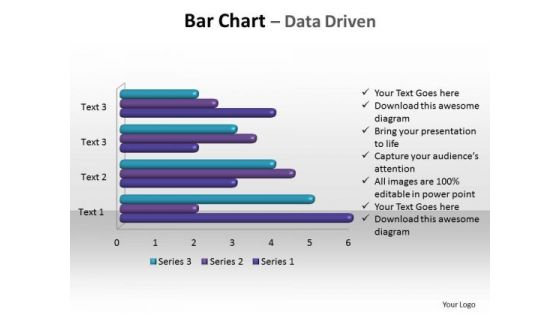
Business Sales PowerPoint Templates Business Bar Chart Data Driven Ppt Slides
Business Sales PowerPoint Templates Business bar chart data driven PPT Slides-This PowerPoint d Editable Data-Driven Chart is for visualizing your figures and data. Business Sales PowerPoint Templates Business bar chart data driven PPT Slides-This ppt can be used for concepts relating to-Chat, Illustration, data driven, figures, charts and Graphs. Set the audience alight with our Business Sales PowerPoint Templates Business Bar Chart Data Driven Ppt Slides. You will come up with a cracker of an idea.
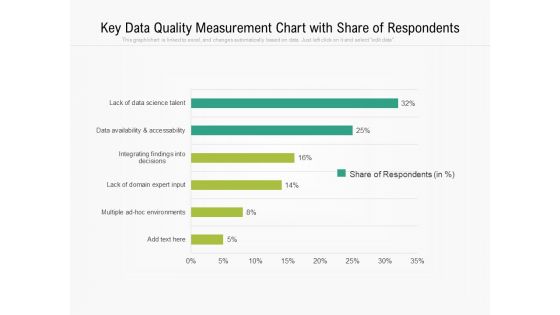
Key Data Quality Measurement Chart With Share Of Respondents Ppt PowerPoint Presentation Model Good PDF
Showcasing this set of slides titled key data quality measurement chart with share of respondents ppt powerpoint presentation model good pdf. The topics addressed in these templates are key data quality measurement chart with share of respondents. All the content presented in this PPT design is completely editable. Download it and make adjustments in color, background, font etc. as per your unique business setting.
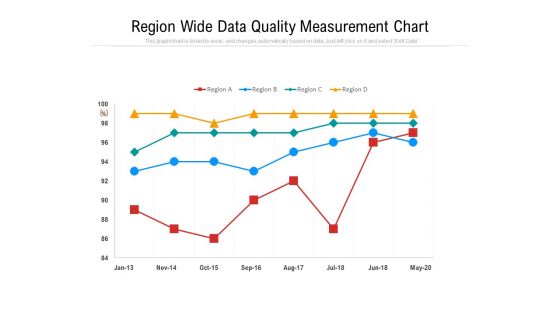
Region Wide Data Quality Measurement Chart Ppt PowerPoint Presentation Layouts Background Image PDF
Showcasing this set of slides titled region wide data quality measurement chart ppt powerpoint presentation layouts background image pdf. The topics addressed in these templates are region wide data quality measurement chart. All the content presented in this PPT design is completely editable. Download it and make adjustments in color, background, font etc. as per your unique business setting.

Business Diagram Data Driven Pie Chart Inside The Magnifier PowerPoint Slide
This business slide displays 3d colorful pie graph with magnifier. This diagram is a data visualization tool that gives you a simple way to present statistical information. This slide helps your audience examine and interpret the data you present.
Data Analysis Bar Chart With Magnifying Glass Icon Ppt PowerPoint Presentation Icon Layouts PDF
Presenting this set of slides with name data analysis bar chart with magnifying glass icon ppt powerpoint presentation icon layouts pdf. This is a three stage process. The stages in this process are data analysis bar chart with magnifying glass icon. This is a completely editable PowerPoint presentation and is available for immediate download. Download now and impress your audience.
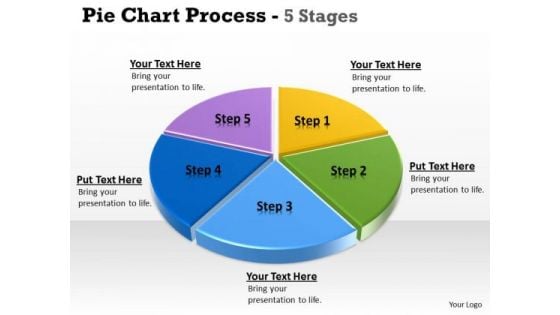
Strategic Management 3d Illustration Of Pie Chart Data 1 Business Cycle Diagram
Get The Doers Into Action. Activate Them With Our Strategic Management 3D Illustration Of Pie Chart Data 1 Business Cycle Diagram Powerpoint Templates.

Mba Models And Frameworks Eight Stages Of Pie Chart Data Interpretation 8 Stages Consulting Diagram
Be The Doer With Our MBA Models And Frameworks Eight Stages Of Pie Chart Data Interpretation 8 Stages Consulting Diagram Powerpoint Templates. Put Your Thoughts Into Practice.
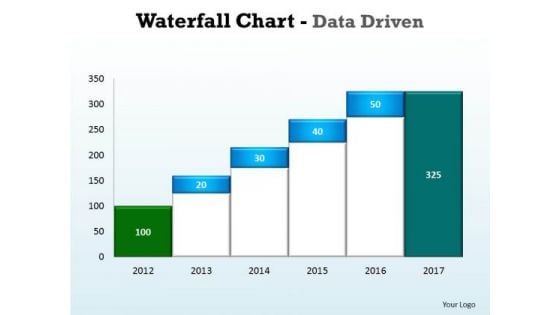
Business Graphic PowerPoint Templates Business Waterfall Chart Data Driven Ppt Slides
Business Graphic PowerPoint Templates Business waterfall chart data driven PPT Slides- This Water Fall chart can display continuous data over time, set against a common scale, and are therefore ideal for showing trends in data at equal intervals-This ppt can be used for concepts relating to-chart,, graph, growth, investment, , market, percentage, , presentation report, results, statistics, stock, success and business. Expose your team to a brave new world. Challenge preset boundaries with our Business Graphic PowerPoint Templates Business Waterfall Chart Data Driven Ppt Slides.
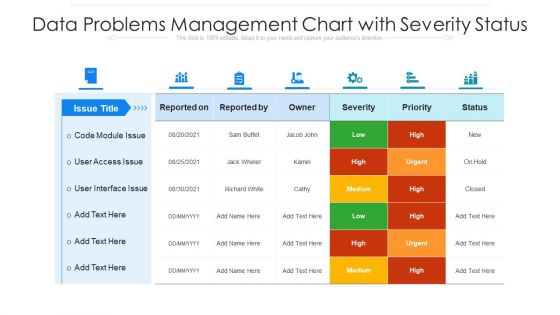
Data Problems Management Chart With Severity Status Ppt PowerPoint Presentation Gallery Template PDF
Pitch your topic with ease and precision using this data problems management chart with severity status ppt powerpoint presentation gallery template pdf. This layout presents information on data problems management chart with severity status. It is also available for immediate download and adjustment. So, changes can be made in the color, design, graphics or any other component to create a unique layout.
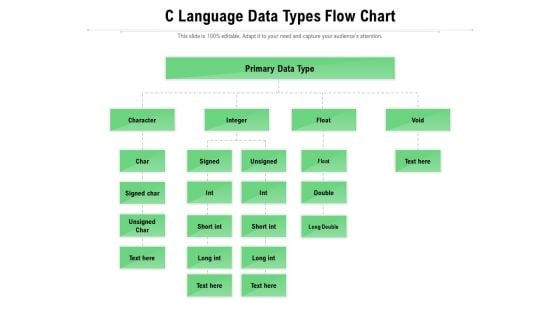
C Language Data Types Flow Chart Ppt PowerPoint Presentation File Slide Portrait PDF
Persuade your audience using this c language data types flow chart ppt powerpoint presentation file slide portrait pdf. This PPT design covers six stages, thus making it a great tool to use. It also caters to a variety of topics including c language data types flow chart. Download this PPT design now to present a convincing pitch that not only emphasizes the topic but also showcases your presentation skills.
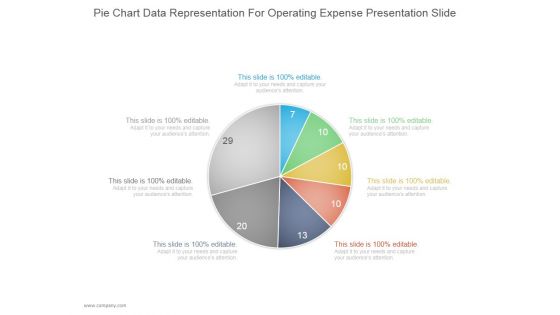
Pie Chart Data Representation For Operating Expense Ppt PowerPoint Presentation Deck
This is a pie chart data representation for operating expense ppt powerpoint presentation deck. This is a seven stage process. The stages in this process are business, strategy, marketing, pie chart, management.
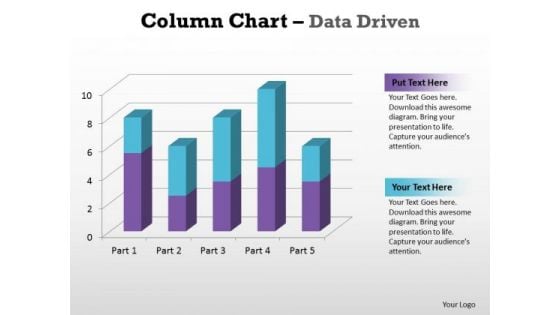
Business Graphic PowerPoint Templates Business Column Chart Data Driven Ppt Slides
Business Graphic PowerPoint Templates Business column chart data driven PPT Slides-With help of visual aids like this template you can capture the attention of the audience and make the presentation very interactive and lively.-Business Graphic PowerPoint Templates Business column chart data driven PPT Slides-This ppt can be used for concepts relating to-chart,, graph, growth, investment, , market, percentage, , presentation report, results, statistics, stock, success and business. Attain stardom with our Business Graphic PowerPoint Templates Business Column Chart Data Driven Ppt Slides. You will come out on top.

 Home
Home