Data Chart
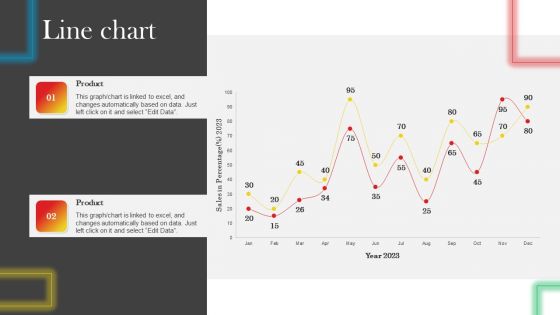
Line Chart Data Driven Promotional Guide To Increase Return On Investment Slides PDF
Find highly impressive Line Chart Data Driven Promotional Guide To Increase Return On Investment Slides PDF on Slidegeeks to deliver a meaningful presentation. You can save an ample amount of time using these presentation templates. No need to worry to prepare everything from scratch because Slidegeeks experts have already done a huge research and work for you. You need to download Line Chart Data Driven Promotional Guide To Increase Return On Investment Slides PDF for your upcoming presentation. All the presentation templates are 100 percent editable and you can change the color and personalize the content accordingly. Download now
Data Consumption Pie Chart With Arrows Vector Icon Ppt PowerPoint Presentation File Example Introduction PDF
Persuade your audience using this data consumption pie chart with arrows vector icon ppt powerpoint presentation file example introduction pdf. This PPT design covers three stages, thus making it a great tool to use. It also caters to a variety of topics including data consumption pie chart with arrows vector icon. Download this PPT design now to present a convincing pitch that not only emphasizes the topic but also showcases your presentation skills.
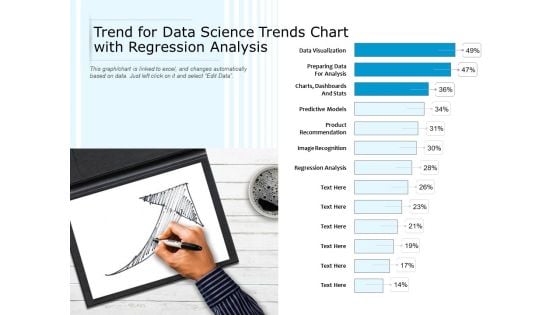
Trend For Data Science Trends Chart With Regression Analysis Ppt PowerPoint Presentation Visual Aids Layouts PDF
Showcasing this set of slides titled trend for data science trends chart with regression analysis ppt powerpoint presentation visual aids layouts pdf. The topics addressed in these templates are data visualization, preparing data for analysis, dashboards and stats, predictive models. All the content presented in this PPT design is completely editable. Download it and make adjustments in color, background, font etc. as per your unique business setting.

Business Data Validation Workflow Chart With Initiate And Identify Ppt PowerPoint Presentation Portfolio Graphics Download PDF
Presenting business data validation workflow chart with initiate and identify ppt powerpoint presentation portfolio graphics download pdf to dispense important information. This template comprises eight stages. It also presents valuable insights into the topics including initiate, data, cleansing requirement, identify data, field for cleansing, accelerate process of data cleaning, change data, cleansing status, the abnormal data list, data trend validation. This is a completely customizable PowerPoint theme that can be put to use immediately. So, download it and address the topic impactfully.
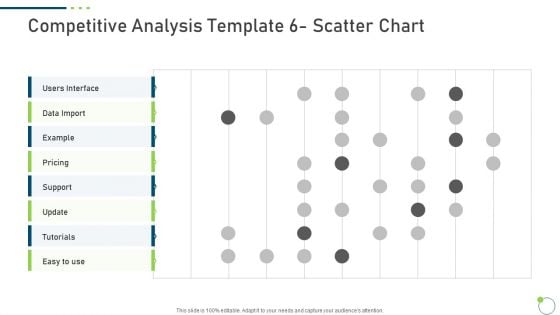
Investor Pitch Deck New Venture Capital Raising Competitive Analysis Template 6 Scatter Chart Data Sample PDF
Deliver and pitch your topic in the best possible manner with this investor pitch deck new venture capital raising competitive analysis template 6 scatter chart data sample pdf. Use them to share invaluable insights on pricing, tutorials, data import, support and impress your audience. This template can be altered and modified as per your expectations. So, grab it now.
Asset Data Verification Workflow Chart Ppt PowerPoint Presentation Icon Files PDF
Presenting asset data verification workflow chart ppt powerpoint presentation icon files pdf to dispense important information. This template comprises one stages. It also presents valuable insights into the topics including database, inventory, data approved. This is a completely customizable PowerPoint theme that can be put to use immediately. So, download it and address the topic impactfully.
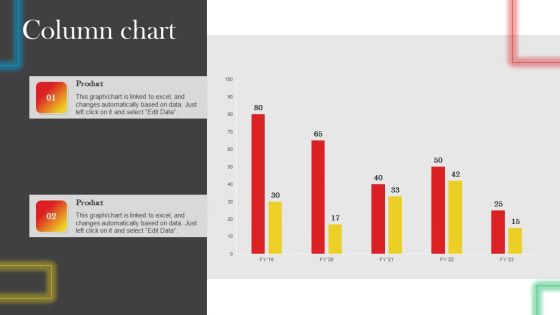
Column Chart Data Driven Promotional Guide To Increase Return On Investment Microsoft PDF
Want to ace your presentation in front of a live audience Our Column Chart Data Driven Promotional Guide To Increase Return On Investment Microsoft PDF can help you do that by engaging all the users towards you. Slidegeeks experts have put their efforts and expertise into creating these impeccable powerpoint presentations so that you can communicate your ideas clearly. Moreover, all the templates are customizable, and easy-to-edit and downloadable. Use these for both personal and commercial use.
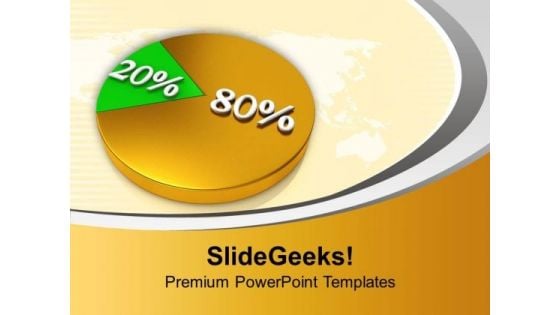
Data Interpretation Pie Chart Marketing PowerPoint Templates Ppt Backgrounds For Slides 0313
We present our Data Interpretation Pie Chart Marketing PowerPoint Templates PPT Backgrounds For Slides 0313.Use our Business PowerPoint Templates because you should Whip up a frenzy with our PowerPoint Templates and Slides. They will fuel the excitement of your team. Use our Marketing PowerPoint Templates because You can Double your output with our PowerPoint Templates and Slides. They make beating deadlines a piece of cake. Download our Pie Charts PowerPoint Templates because It will Raise the bar of your Thoughts. They are programmed to take you to the next level. Download and present our Circle Charts PowerPoint Templates because Timeline crunches are a fact of life. Meet all deadlines using our PowerPoint Templates and Slides. Use our Shapes PowerPoint Templates because you should Experience excellence with our PowerPoint Templates and Slides. They will take your breath away.Use these PowerPoint slides for presentations relating to Pie chart resolution marketing, business, marketing, pie charts, shapes, circle charts. The prominent colors used in the PowerPoint template are Yellow, Green, White. Attract attention with our Data Interpretation Pie Chart Marketing PowerPoint Templates Ppt Backgrounds For Slides 0313. You will come out on top.
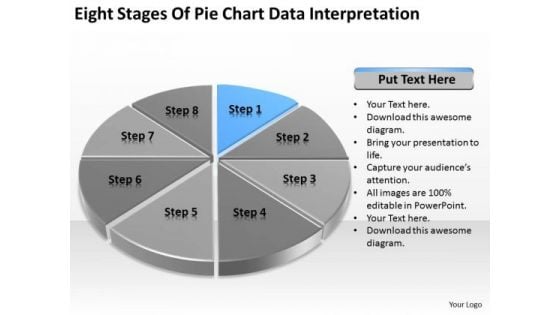
Eight Stages Of Pie Chart Data Interpretation Business Plan PowerPoint Templates
We present our eight stages of pie chart data interpretation business plan PowerPoint templates.Download and present our Competition PowerPoint Templates because Our PowerPoint Templates and Slides will embellish your thoughts. See them provide the desired motivation to your team. Download and present our Marketing PowerPoint Templates because You should Press the right buttons with our PowerPoint Templates and Slides. They will take your ideas down the perfect channel. Download our Arrows PowerPoint Templates because Your ideas provide food for thought. Our PowerPoint Templates and Slides will help you create a dish to tickle the most discerning palate. Use our Circle Charts PowerPoint Templates because You can Raise a toast with our PowerPoint Templates and Slides. Spread good cheer amongst your audience. Download and present our Business PowerPoint Templates because Our PowerPoint Templates and Slides will let your ideas bloom. Create a bed of roses for your audience.Use these PowerPoint slides for presentations relating to chart, graph, pie, 3d, diagram, graphic, icon, control, business, data, profit, market, sales, display, corporate, concept, render, success, presentation, finance, report, marketing, accounting, management, piece, strategy, money, growth, company, competition, progress, account, sheet, part, information, investment, improvement, banking, index, financial, reflect, results, performance, exchange. The prominent colors used in the PowerPoint template are Blue, Black, Gray. Our Eight Stages Of Pie Chart Data Interpretation Business Plan PowerPoint Templates capture the attention of your audience. With our money back guarantee you have nothing to lose.
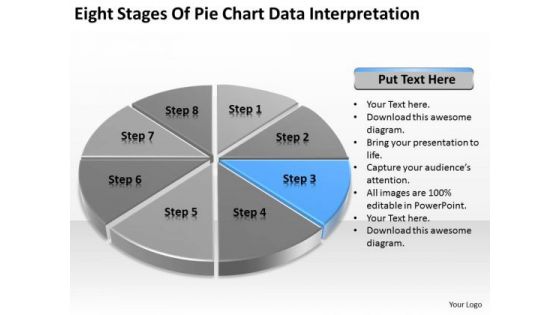
Eight Stages Of Pie Chart Data Interpretation Business Plan PowerPoint Slides
We present our eight stages of pie chart data interpretation business plan PowerPoint Slides.Use our Competition PowerPoint Templates because Our PowerPoint Templates and Slides will let you Clearly mark the path for others to follow. Download and present our Marketing PowerPoint Templates because Our PowerPoint Templates and Slides will weave a web of your great ideas. They are gauranteed to attract even the most critical of your colleagues. Present our Arrows PowerPoint Templates because Our PowerPoint Templates and Slides will let you Hit the target. Go the full distance with ease and elan. Use our Circle Charts PowerPoint Templates because You have gained great respect for your brilliant ideas. Use our PowerPoint Templates and Slides to strengthen and enhance your reputation. Download our Business PowerPoint Templates because You are an avid believer in ethical practices. Highlight the benefits that accrue with our PowerPoint Templates and Slides.Use these PowerPoint slides for presentations relating to chart, graph, pie, 3d, diagram, graphic, icon, control, business, data, profit, market, sales, display, corporate, concept, render, success, presentation, finance, report, marketing, accounting, management, piece, strategy, money, growth, company, competition, progress, account, sheet, part, information, investment, improvement, banking, index, financial, reflect, results, performance, exchange. The prominent colors used in the PowerPoint template are Blue, Black, Gray. Great presentations happen with our Eight Stages Of Pie Chart Data Interpretation Business Plan PowerPoint Slides. Try us out and see what a difference our templates make.
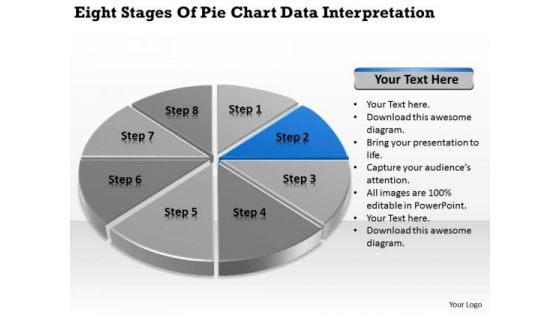
Stages Of Pie Chart Data Interpretation Vending Machine Business Plan PowerPoint Slides
We present our stages of pie chart data interpretation vending machine business plan PowerPoint Slides.Present our Circle Charts PowerPoint Templates because You should Bet on your luck with our PowerPoint Templates and Slides. Be assured that you will hit the jackpot. Present our Marketing PowerPoint Templates because Our PowerPoint Templates and Slides will provide you the cutting edge. Slice through the doubts in the minds of your listeners. Download our Business PowerPoint Templates because you should Experience excellence with our PowerPoint Templates and Slides. They will take your breath away. Download our Shapes PowerPoint Templates because It will Raise the bar of your Thoughts. They are programmed to take you to the next level. Present our Process and Flows PowerPoint Templates because Our PowerPoint Templates and Slides will give good value for money. They also have respect for the value of your time.Use these PowerPoint slides for presentations relating to achievement, analysis, background, bank, banking, business, calculation, chart, circle, commerce, commercial, commission, concept, credit, crisis, debt, deposit, design, detail, diagram, earnings, economics, economy, element, finance, goal, gold, golden, graph, graphic, growth, icon, idea, illustration, income, increase, invest, isolated, level, loss, market, marketing, metal, modern, money, new, object, part, percent, percentage, pie, plot, politics, profit, progress, ratio, reflection, reflective. The prominent colors used in the PowerPoint template are Blue, Gray, Black. Our Stages Of Pie Chart Data Interpretation Vending Machine Business Plan PowerPoint Slides come at a comfortable cost. They are definitely an economical choice.

Stages Of Pie Chart Data Interpretation Business Plan Template PowerPoint Templates
We present our stages of pie chart data interpretation business plan template PowerPoint templates.Download and present our Circle Charts PowerPoint Templates because You can Stir your ideas in the cauldron of our PowerPoint Templates and Slides. Cast a magic spell on your audience. Download our Marketing PowerPoint Templates because Our PowerPoint Templates and Slides will let you Hit the target. Go the full distance with ease and elan. Use our Business PowerPoint Templates because Our PowerPoint Templates and Slides are truly out of this world. Even the MIB duo has been keeping tabs on our team. Download our Shapes PowerPoint Templates because Watching this your Audience will Grab their eyeballs, they wont even blink. Download our Process and Flows PowerPoint Templates because It will Give impetus to the hopes of your colleagues. Our PowerPoint Templates and Slides will aid you in winning their trust.Use these PowerPoint slides for presentations relating to achievement, analysis, background, bank, banking, business, calculation, chart, circle, commerce, commercial, commission, concept, credit, crisis, debt, deposit, design, detail, diagram, earnings, economics, economy, element, finance, goal, gold, golden, graph, graphic, growth, icon, idea, illustration, income, increase, invest, isolated, level, loss, market, marketing, metal, modern, money, new, object, part, percent, percentage, pie, plot, politics, profit, progress, ratio, reflection, reflective. The prominent colors used in the PowerPoint template are Blue, Gray, Black. Feed their curiosity with our Stages Of Pie Chart Data Interpretation Business Plan Template PowerPoint Templates. Arouse expectations with your thoughts.
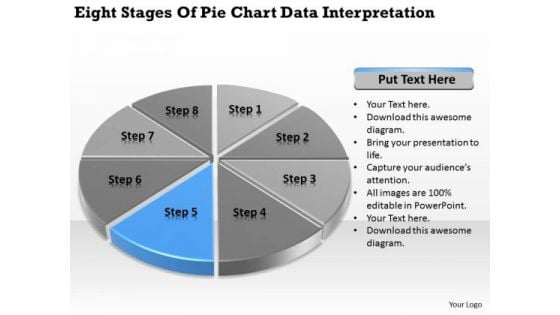
Stages Of Pie Chart Data Interpretation How To Write Business Plan PowerPoint Templates
We present our stages of pie chart data interpretation how to write business plan PowerPoint templates.Present our Circle Charts PowerPoint Templates because Our PowerPoint Templates and Slides will provide you a launch platform. Give a lift off to your ideas and send them into orbit. Present our Marketing PowerPoint Templates because Our PowerPoint Templates and Slides will let you Hit the right notes. Watch your audience start singing to your tune. Use our Business PowerPoint Templates because Our PowerPoint Templates and Slides come in all colours, shades and hues. They help highlight every nuance of your views. Download our Shapes PowerPoint Templates because It can Leverage your style with our PowerPoint Templates and Slides. Charm your audience with your ability. Use our Process and Flows PowerPoint Templates because You can Connect the dots. Fan expectations as the whole picture emerges.Use these PowerPoint slides for presentations relating to achievement, analysis, background, bank, banking, business, calculation, chart, circle, commerce, commercial, commission, concept, credit, crisis, debt, deposit, design, detail, diagram, earnings, economics, economy, element, finance, goal, gold, golden, graph, graphic, growth, icon, idea, illustration, income, increase, invest, isolated, level, loss, market, marketing, metal, modern, money, new, object, part, percent, percentage, pie, plot, politics, profit, progress, ratio, reflection, reflective. The prominent colors used in the PowerPoint template are Blue, Gray, Black. Our Stages Of Pie Chart Data Interpretation How To Write Business Plan PowerPoint Templates avoid exaggerations. They keep you away from any farce.
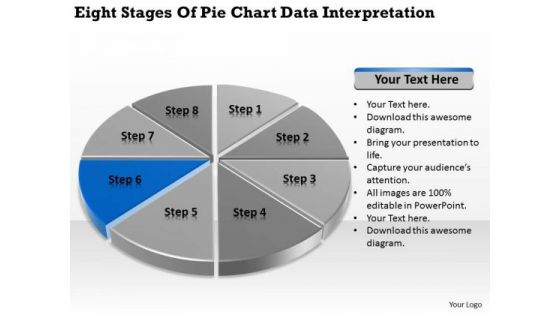
Stages Of Pie Chart Data Interpretation Example Business Plan PowerPoint Slides
We present our stages of pie chart data interpretation example business plan PowerPoint Slides.Download and present our Circle Charts PowerPoint Templates because It will let you Set new benchmarks with our PowerPoint Templates and Slides. They will keep your prospects well above par. Download our Marketing PowerPoint Templates because Our PowerPoint Templates and Slides will weave a web of your great ideas. They are gauranteed to attract even the most critical of your colleagues. Use our Business PowerPoint Templates because It will Strengthen your hand with your thoughts. They have all the aces you need to win the day. Present our Shapes PowerPoint Templates because It will get your audience in sync. Present our Process and Flows PowerPoint Templates because Our PowerPoint Templates and Slides will generate and maintain the level of interest you desire. They will create the impression you want to imprint on your audience.Use these PowerPoint slides for presentations relating to achievement, analysis, background, bank, banking, business, calculation, chart, circle, commerce, commercial, commission, concept, credit, crisis, debt, deposit, design, detail, diagram, earnings, economics, economy, element, finance, goal, gold, golden, graph, graphic, growth, icon, idea, illustration, income, increase, invest, isolated, level, loss, market, marketing, metal, modern, money, new, object, part, percent, percentage, pie, plot, politics, profit, progress, ratio, reflection, reflective. The prominent colors used in the PowerPoint template are Blue navy, Gray, Black. Add emphasis to your ideas with our Stages Of Pie Chart Data Interpretation Example Business Plan PowerPoint Slides. Lend greater credence to your expression.
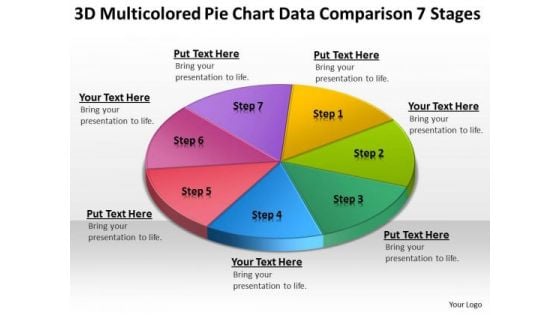
Chart Data Comparison 7 Stages Examples Of Business Plans For PowerPoint Slides
We present our chart data comparison 7 stages examples of business plans for PowerPoint Slides.Download and present our Circle Charts PowerPoint Templates because You are well armed with penetrative ideas. Our PowerPoint Templates and Slides will provide the gunpowder you need. Use our Business PowerPoint Templates because It can be used to Set your controls for the heart of the sun. Our PowerPoint Templates and Slides will be the propellant to get you there. Present our Shapes PowerPoint Templates because You will get more than you ever bargained for. Download and present our Signs PowerPoint Templates because Our PowerPoint Templates and Slides are truly out of this world. Even the MIB duo has been keeping tabs on our team. Present our Metaphors-Visual Concepts PowerPoint Templates because Our PowerPoint Templates and Slides will bullet point your ideas. See them fall into place one by one.Use these PowerPoint slides for presentations relating to business, chart, circle, circular, diagram, economy, finance, framework, graph, isolated, percentage, pie chart, results, scheme, statistics, stats, strategy, success. The prominent colors used in the PowerPoint template are Red, Pink, Green. Become a genius with our Chart Data Comparison 7 Stages Examples Of Business Plans For PowerPoint Slides. You will come out on top.
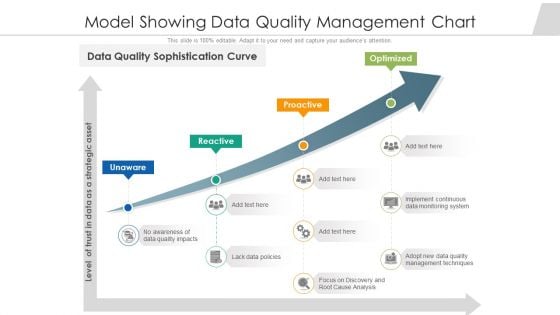
Model Showing Data Quality Management Chart Ppt PowerPoint Presentation Show Slide Download PDF
Persuade your audience using this model showing data quality management chart ppt powerpoint presentation show slide download pdf. This PPT design covers four stages, thus making it a great tool to use. It also caters to a variety of topics including implement continuous data monitoring system, management techniques, strategic asset. Download this PPT design now to present a convincing pitch that not only emphasizes the topic but also showcases your presentation skills.
Data Protection Flow Chart For Business Safety Ppt PowerPoint Presentation Icon Example File PDF
Persuade your audience using this data protection flow chart for business safety ppt powerpoint presentation icon example file pdf. This PPT design covers one stages, thus making it a great tool to use. It also caters to a variety of topics including access network, traffic mirroring, access. Download this PPT design now to present a convincing pitch that not only emphasizes the topic but also showcases your presentation skills.
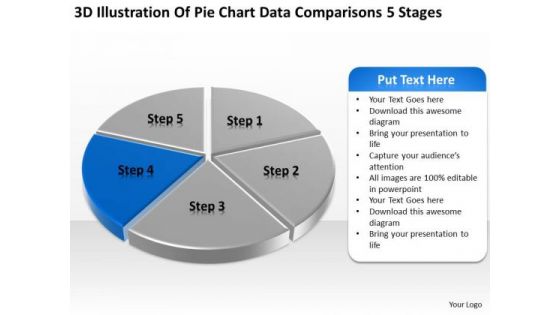
Pie Chart Data Comparisons 5 Stages How To Develop Business Plan PowerPoint Templates
We present our pie chart data comparisons 5 stages how to develop business plan PowerPoint templates.Present our Marketing PowerPoint Templates because You can Be the star of the show with our PowerPoint Templates and Slides. Rock the stage with your ideas. Download and present our Finance PowerPoint Templates because Timeline crunches are a fact of life. Meet all deadlines using our PowerPoint Templates and Slides. Use our Business PowerPoint Templates because You can Be the puppeteer with our PowerPoint Templates and Slides as your strings. Lead your team through the steps of your script. Download and present our Sales PowerPoint Templates because Our PowerPoint Templates and Slides are a sure bet. Gauranteed to win against all odds. Download our Success PowerPoint Templates because Our PowerPoint Templates and Slides will provide weight to your words. They will bring out the depth of your thought process.Use these PowerPoint slides for presentations relating to Analysis, Analyzing, Brands, Business, Chart, Colorful, Commerce, Compare, Comparison, Data, Economical, Finance, Financial, Grow, Growth, Market, Market Share, Marketing, Measure, Pen, Pie, Pie Chart, Presentation, Profit, Revenue, Sales, Sales Chat, Sales Increase, Share, Statistical, Success, Successful. The prominent colors used in the PowerPoint template are Blue, Gray, White. Motivate your team to excellent performances. Nurture their abilities through our Pie Chart Data Comparisons 5 Stages How To Develop Business Plan PowerPoint Templates.
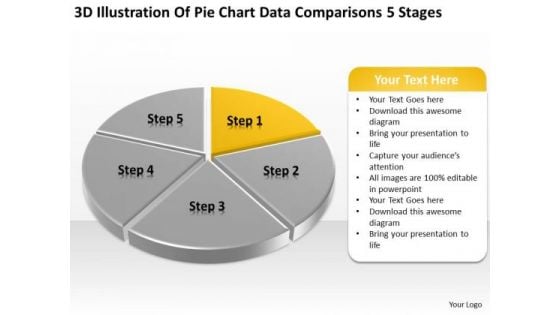
Pie Chart Data Comparisons 5 Stages Examples Small Business Plans PowerPoint Slides
We present our pie chart data comparisons 5 stages examples small business plans PowerPoint Slides.Download our Marketing PowerPoint Templates because you can Set pulses racing with our PowerPoint Templates and Slides. They will raise the expectations of your team. Present our Finance PowerPoint Templates because Our PowerPoint Templates and Slides are the chords of your song. String them along and provide the lilt to your views. Download and present our Business PowerPoint Templates because It will Raise the bar of your Thoughts. They are programmed to take you to the next level. Download our Sales PowerPoint Templates because Our PowerPoint Templates and Slides will fulfill your every need. Use them and effectively satisfy the desires of your audience. Present our Success PowerPoint Templates because You can Be the puppeteer with our PowerPoint Templates and Slides as your strings. Lead your team through the steps of your script.Use these PowerPoint slides for presentations relating to Analysis, Analyzing, Brands, Business, Chart, Colorful, Commerce, Compare, Comparison, Data, Economical, Finance, Financial, Grow, Growth, Market, Market Share, Marketing, Measure, Pen, Pie, Pie Chart, Presentation, Profit, Revenue, Sales, Sales Chat, Sales Increase, Share, Statistical, Success, Successful. The prominent colors used in the PowerPoint template are Yellow, Gray, White. Ambiguity can be exasperating. Give definite answers with our Pie Chart Data Comparisons 5 Stages Examples Small Business Plans PowerPoint Slides.
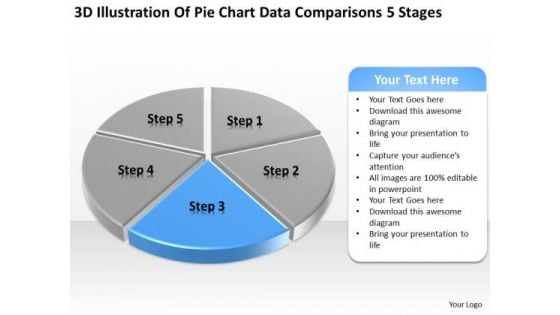
Pie Chart Data Comparisons 5 Stages Business Plan Templates PowerPoint Slides
We present our pie chart data comparisons 5 stages business plan templates PowerPoint Slides.Present our Marketing PowerPoint Templates because Our PowerPoint Templates and Slides are Clear and concise. Use them and dispel any doubts your team may have. Present our Finance PowerPoint Templates because You can Create a matrix with our PowerPoint Templates and Slides. Feel the strength of your ideas click into place. Download our Business PowerPoint Templates because You can Inspire your team with our PowerPoint Templates and Slides. Let the force of your ideas flow into their minds. Present our Sales PowerPoint Templates because Our PowerPoint Templates and Slides are aesthetically designed to attract attention. We gaurantee that they will grab all the eyeballs you need. Present our Success PowerPoint Templates because Our PowerPoint Templates and Slides are specially created by a professional team with vast experience. They diligently strive to come up with the right vehicle for your brilliant Ideas. Use these PowerPoint slides for presentations relating to Analysis, Analyzing, Brands, Business, Chart, Colorful, Commerce, Compare, Comparison, Data, Economical, Finance, Financial, Grow, Growth, Market, Market Share, Marketing, Measure, Pen, Pie, Pie Chart, Presentation, Profit, Revenue, Sales, Sales Chat, Sales Increase, Share, Statistical, Success, Successful. The prominent colors used in the PowerPoint template are Blue, Gray, White. Start a company with our Pie Chart Data Comparisons 5 Stages Business Plan Templates PowerPoint Slides. Just download, type and present.
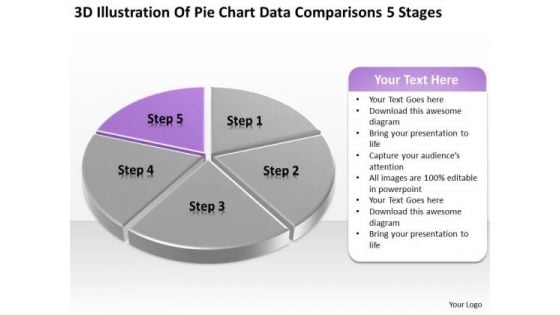
Pie Chart Data Comparisons 5 Stages Ppt Designing Business Plan PowerPoint Templates
We present our pie chart data comparisons 5 stages ppt designing business plan PowerPoint templates.Use our Marketing PowerPoint Templates because Our PowerPoint Templates and Slides are innately eco-friendly. Their high recall value negate the need for paper handouts. Download our Finance PowerPoint Templates because Our PowerPoint Templates and Slides are truly out of this world. Even the MIB duo has been keeping tabs on our team. Use our Business PowerPoint Templates because You should Bet on your luck with our PowerPoint Templates and Slides. Be assured that you will hit the jackpot. Present our Sales PowerPoint Templates because Our PowerPoint Templates and Slides are created with admirable insight. Use them and give your group a sense of your logical mind. Present our Success PowerPoint Templates because Our PowerPoint Templates and Slides are focused like a searchlight beam. They highlight your ideas for your target audience.Use these PowerPoint slides for presentations relating to Analysis, Analyzing, Brands, Business, Chart, Colorful, Commerce, Compare, Comparison, Data, Economical, Finance, Financial, Grow, Growth, Market, Market Share, Marketing, Measure, Pen, Pie, Pie Chart, Presentation, Profit, Revenue, Sales, Sales Chat, Sales Increase, Share, Statistical, Success, Successful. The prominent colors used in the PowerPoint template are Purple, Gray, White. Make instructive presentations with our Pie Chart Data Comparisons 5 Stages Ppt Designing Business Plan PowerPoint Templates. Dont waste time struggling with PowerPoint. Let us do it for you.
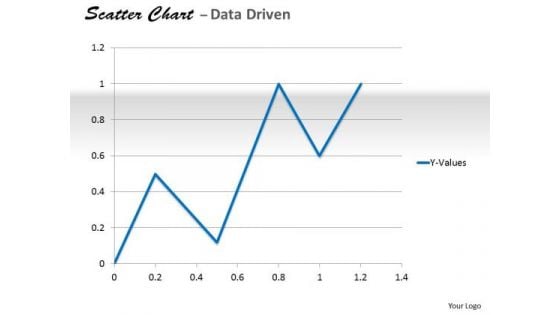
Data Analysis In Excel Analyzing Of Relationship Chart PowerPoint Templates
Delight Them With Our data analysis in excel analyzing of relationship chart Powerpoint Templates .
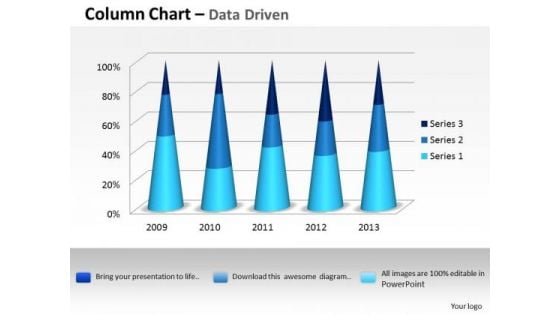
Data Analysis Excel 3d Process Variation Column Chart PowerPoint Templates
Put In A Dollop Of Our data analysis excel 3d process variation column chart Powerpoint Templates. Give Your Thoughts A Distinctive Flavor.
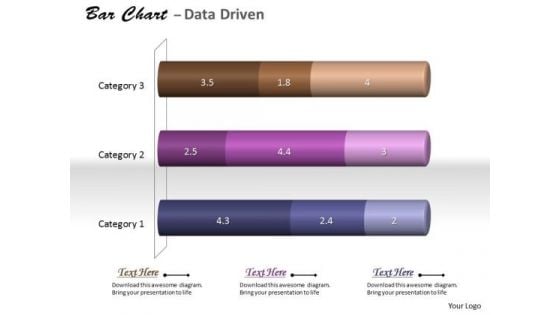
Data Analysis In Excel 3d Classification Of Chart PowerPoint Templates
With Our data analysis in excel 3d classification of chart Powerpoint Templates You Will Be Doubly Sure. They Possess That Stamp Of Authority.
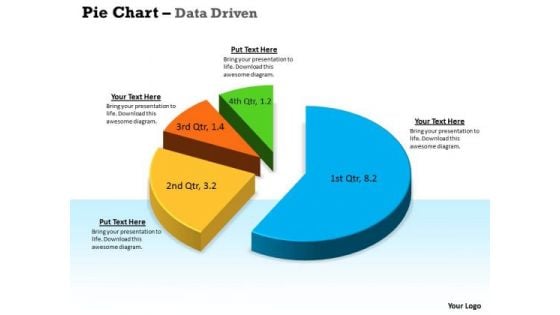
Data Analysis Techniques 3d In Segments Pie Chart PowerPoint Templates
Drink To The Success Of Your Campaign. Our data analysis techniques 3d in segments pie chart Powerpoint Templates Will Raise A Toast.
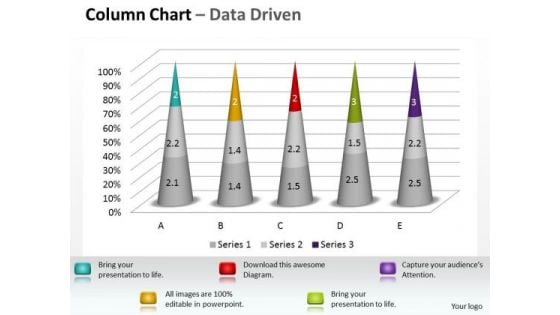
Excel Data Analysis Data Tools Data Methods Statistical Tool Survey 3d Chart PowerPoint Templates
Dumbfound Them With Our excel data analysis data tools data methods statistical tool survey 3d chart Powerpoint Templates . Your Audience Will Be Astounded With Your Ideas.
Charts Representing Business Data Analysis Icon Introduction PDF
Presenting charts representing business data analysis icon introduction pdf. to dispense important information. This template comprises three stages. It also presents valuable insights into the topics including charts representing business data analysis icon. This is a completely customizable PowerPoint theme that can be put to use immediately. So, download it and address the topic impactfully.
Google Charts Tool For Data Visualization Rules PDF
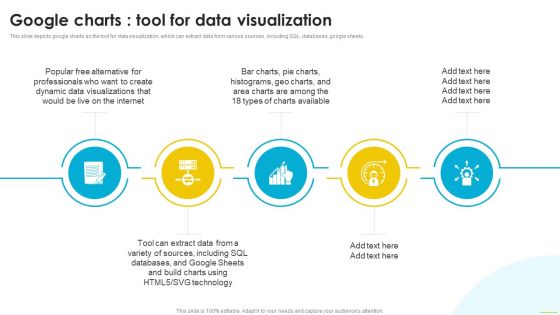
This slide depicts google charts as the tool for data visualization, which can extract data from various sources, including SQL, databases, google sheets. From laying roadmaps to briefing everything in detail, our templates are perfect for you. You can set the stage with your presentation slides. All you have to do is download these easy to edit and customizable templates. Google Charts Tool For Data Visualization Rules PDF will help you deliver an outstanding performance that everyone would remember and praise you for. Do download this presentation today.
Two Table Charts For Business Data Powerpoint Slides
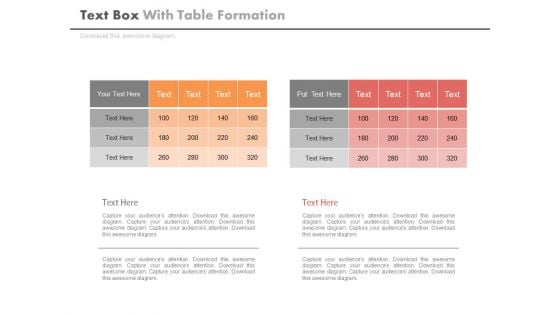
This PowerPoint template contains two tables chart. You may download this PPT slide to display statistical analysis. You can easily customize this template to make it more unique as per your need.
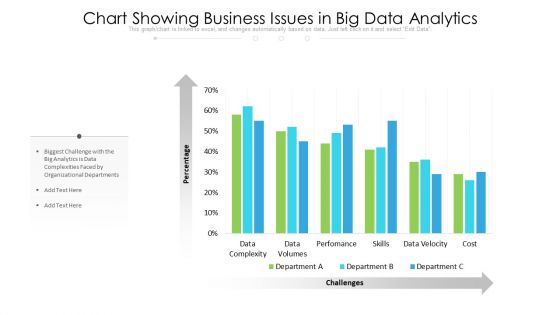
Chart Showing Business Issues In Big Data Analytics Diagrams PDF
Pitch your topic with ease and precision using this chart showing business issues in big data analytics diagrams pdf. This layout presents information on data complexity, data volumes, performance, skills. It is also available for immediate download and adjustment. So, changes can be made in the color, design, graphics or any other component to create a unique layout.
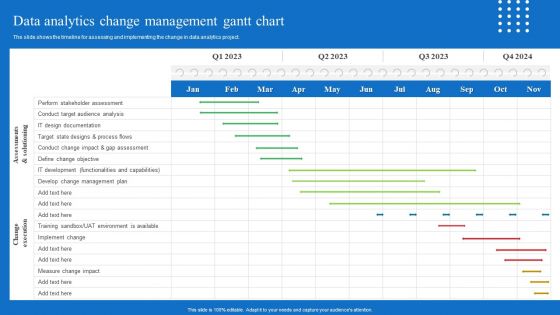
Toolkit For Data Science And Analytics Transition Data Analytics Change Management Gantt Chart Portrait PDF
The slide shows the timeline for assessing and implementing the change in data analytics project. Get a simple yet stunning designed Toolkit For Data Science And Analytics Transition Data Analytics Change Management Gantt Chart Portrait PDF It is the best one to establish the tone in your meetings. It is an excellent way to make your presentations highly effective. So, download this PPT today from Slidegeeks and see the positive impacts. Our easy to edit Toolkit For Data Science And Analytics Transition Data Analytics Change Management Gantt Chart Portrait PDF can be your go to option for all upcoming conferences and meetings. So, what are you waiting for Grab this template today.
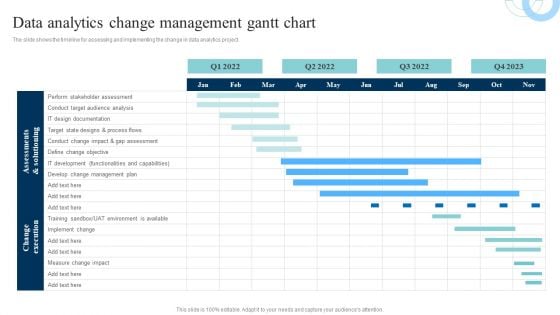
Data Evaluation And Processing Toolkit Data Analytics Change Management Gantt Chart Elements PDF
The slide shows the timeline for assessing and implementing the change in data analytics project. If your project calls for a presentation, then Slidegeeks is your go-to partner because we have professionally designed, easy-to-edit templates that are perfect for any presentation. After downloading, you can easily edit Data Evaluation And Processing Toolkit Data Analytics Change Management Gantt Chart Elements PDF and make the changes accordingly. You can rearrange slides or fill them with different images. Check out all the handy templates.
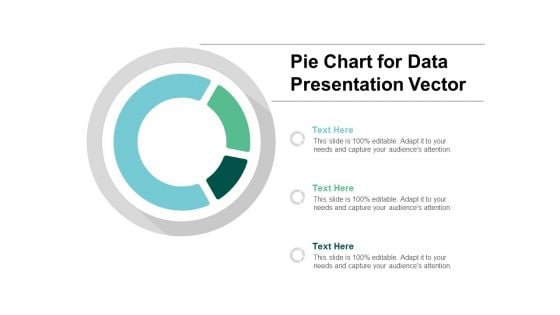
Pie Chart For Data Presentation Vector Ppt PowerPoint Presentation Summary Files
Presenting this set of slides with name pie chart for data presentation vector ppt powerpoint presentation summary files. The topics discussed in these slides are data visualization icon, research analysis, business focus. This is a completely editable PowerPoint presentation and is available for immediate download. Download now and impress your audience.
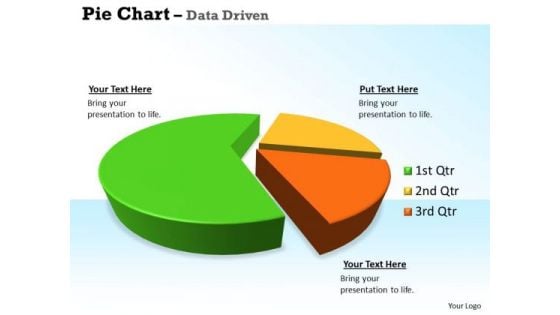
Quantitative Data Analysis 3d Pie Chart For Business Statistics PowerPoint Templates
Our quantitative data analysis 3d pie chart for business statistics Powerpoint Templates Allow You To Do It With Ease. Just Like Picking The Low Hanging Fruit.
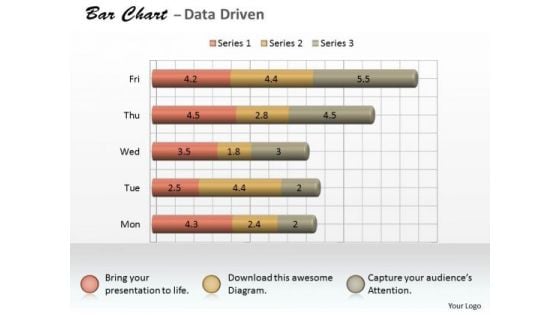
Microsoft Excel Data Analysis 3d Bar Chart As Research Tool PowerPoint Templates
Knock On The Door To Success With Our microsoft excel data analysis 3d bar chart as research tool Powerpoint Templates . Be Assured Of Gaining Entry.
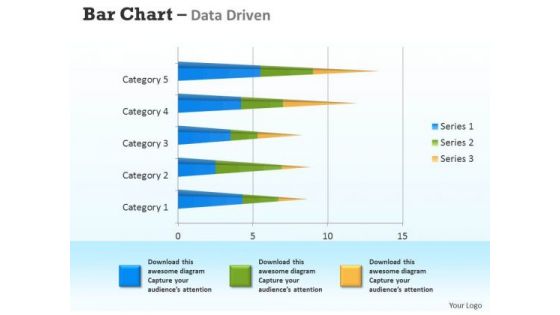
Microsoft Excel Data Analysis 3d Bar Chart For Analyzing Survey PowerPoint Templates
Connect The Dots With Our microsoft excel data analysis 3d bar chart for analyzing survey Powerpoint Templates . Watch The Whole Picture Clearly Emerge.
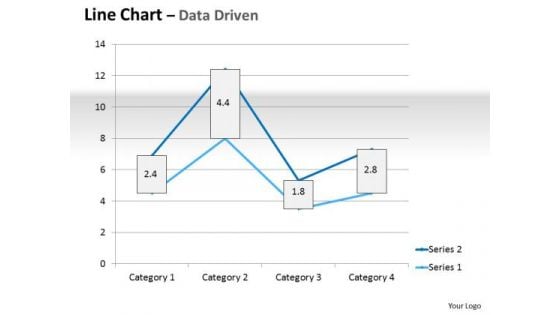
Multivariate Data Analysis Driven Line Chart Market Graph PowerPoint Slides Templates
Plan For All Contingencies With Our multivariate data analysis driven line chart market graph powerpoint slides Templates . Douse The Fire Before It Catches.
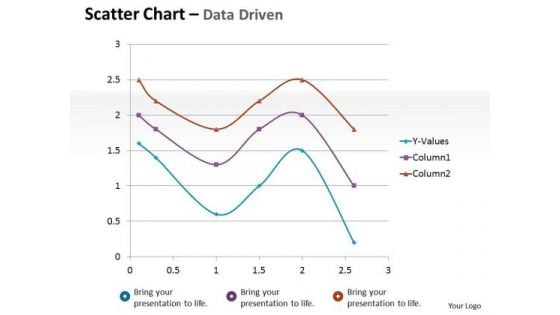
Financial Data Analysis Driven Scatter Chart Mathematical Diagram PowerPoint Slides Templates
Dominate Proceedings With Your Ideas. Our financial data analysis driven scatter chart mathematical diagram powerpoint slides Templates Will Empower Your Thoughts.
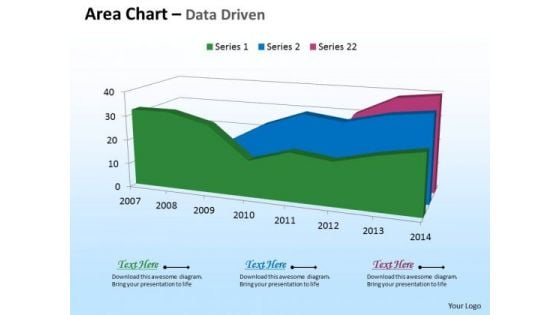
Microsoft Excel Data Analysis 3d Area Chart For Time Based PowerPoint Templates
Deliver The Right Dose With Our microsoft excel data analysis 3d area chart for time based Powerpoint Templates . Your Ideas Will Get The Correct Illumination.
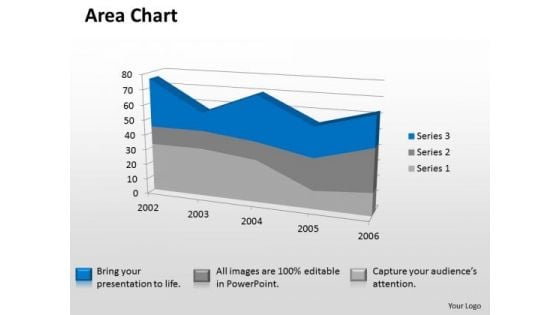
Microsoft Excel Data Analysis 3d Area Chart Showimg Change In Values PowerPoint Templates
Our microsoft excel data analysis 3d area chart showimg change in values Powerpoint Templates Deliver At Your Doorstep. Let Them In For A Wonderful Experience.
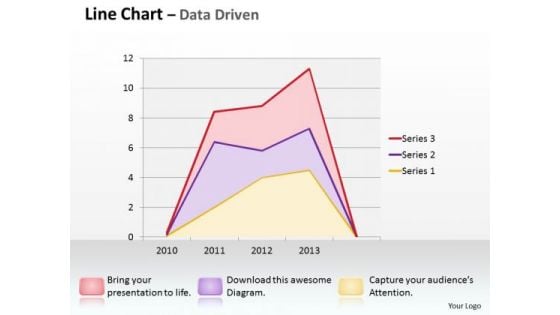
Multivariate Data Analysis Driven Line Chart Shows Revenue Trends PowerPoint Slides Templates
Good Camaraderie Is A Key To Teamwork. Our multivariate data analysis driven line chart shows revenue trends powerpoint slides Templates Can Be A Cementing Force.
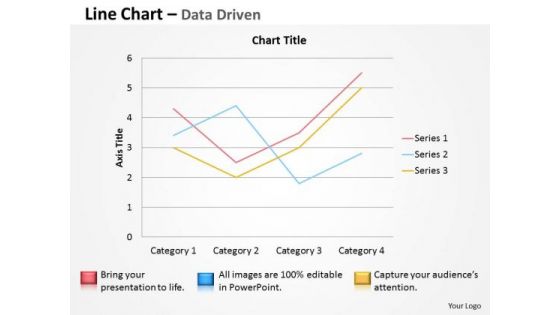
Multivariate Data Analysis Driven Line Chart To Demonstrate PowerPoint Slides Templates
Brace Yourself, Arm Your Thoughts. Prepare For The Hustle With Our multivariate data analysis driven line chart to demonstrate powerpoint slides Templates .
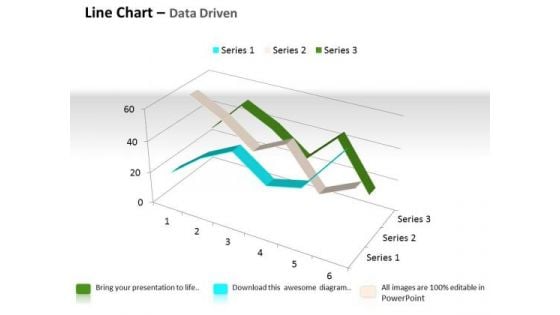
Quantitative Data Analysis 3d Line Chart For Comparison Of PowerPoint Templates
Touch Base With Our quantitative data analysis 3d line chart for comparison of Powerpoint Templates . Review Your Growth With Your Audience.

Quantitative Data Analysis 3d Pie Chart For Business Process PowerPoint Templates
Put Them On The Same Page With Our quantitative data analysis 3d pie chart for business process Powerpoint Templates . Your Team Will Sing From The Same Sheet.

Various Stages Data Extraction Process Flow Chart Ppt PowerPoint Presentation Pictures Show PDF
Persuade your audience using this various stages data extraction process flow chart ppt powerpoint presentation pictures show pdf. This PPT design covers five stages, thus making it a great tool to use. It also caters to a variety of topics including interpretation evaluation, data mining, transformation, preprocessing, selection, target data, preprocessed data, transformed data, patterns, knowledge. Download this PPT design now to present a convincing pitch that not only emphasizes the topic but also showcases your presentation skills.
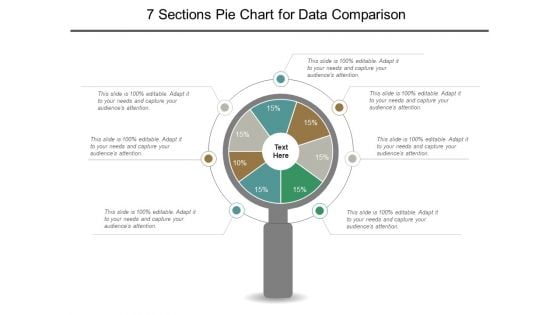
7 Sections Pie Chart For Data Comparison Ppt PowerPoint Presentation File Graphics Template
This is a 7 sections pie chart for data comparison ppt powerpoint presentation file graphics template. This is a seven stage process. The stages in this process are 6 piece pie chart, 6 segment pie chart, 6 parts pie chart.
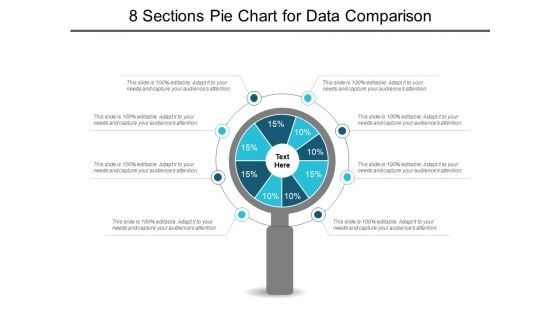
8 Sections Pie Chart For Data Comparison Ppt PowerPoint Presentation Show Slideshow
This is a 8 sections pie chart for data comparison ppt powerpoint presentation show slideshow. This is a eight stage process. The stages in this process are 6 piece pie chart, 6 segment pie chart, 6 parts pie chart.
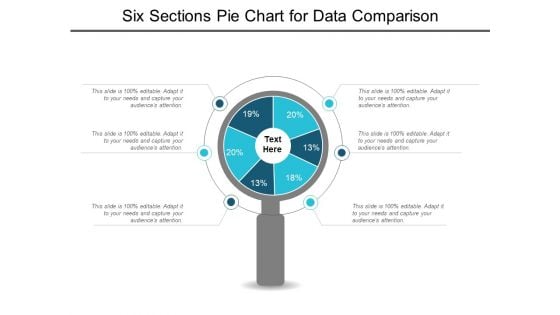
Six Sections Pie Chart For Data Comparison Ppt PowerPoint Presentation Styles Graphics Example
This is a six sections pie chart for data comparison ppt powerpoint presentation styles graphics example. This is a six stage process. The stages in this process are 6 piece pie chart, 6 segment pie chart, 6 parts pie chart.
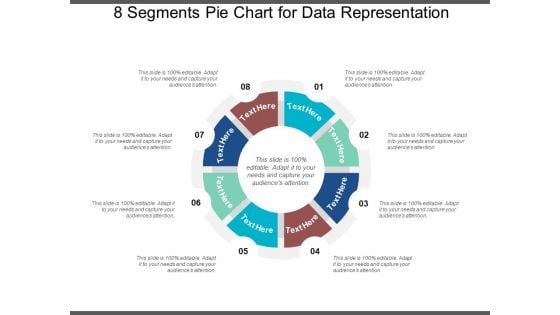
8 Segments Pie Chart For Data Representation Ppt PowerPoint Presentation Infographics Design Templates
This is a 8 segments pie chart for data representation ppt powerpoint presentation infographics design templates. This is a eight stage process. The stages in this process are 6 piece pie chart, 6 segment pie chart, 6 parts pie chart.
6 Segments Pie Chart For Data Representation Ppt PowerPoint Presentation Icon Graphics
This is a 6 segments pie chart for data representation ppt powerpoint presentation icon graphics. This is a six stage process. The stages in this process are 6 piece pie chart, 6 segment pie chart, 6 parts pie chart.
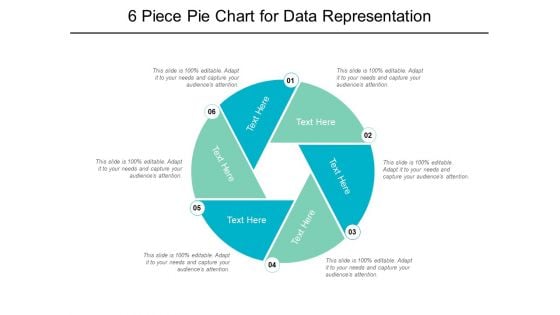
6 Piece Pie Chart For Data Representation Ppt PowerPoint Presentation Professional Brochure
This is a 6 piece pie chart for data representation ppt powerpoint presentation professional brochure. This is a six stage process. The stages in this process are 6 piece pie chart, 6 segment pie chart, 6 parts pie chart.
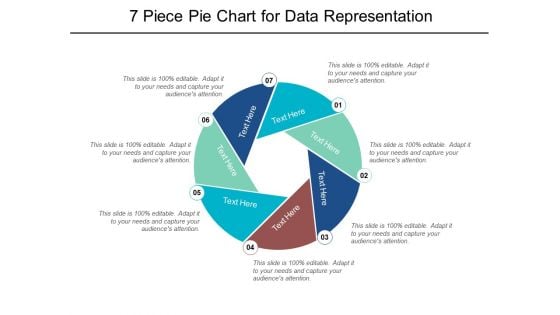
7 Piece Pie Chart For Data Representation Ppt PowerPoint Presentation Portfolio Graphics
This is a 7 piece pie chart for data representation ppt powerpoint presentation portfolio graphics. This is a seven stage process. The stages in this process are 6 piece pie chart, 6 segment pie chart, 6 parts pie chart.
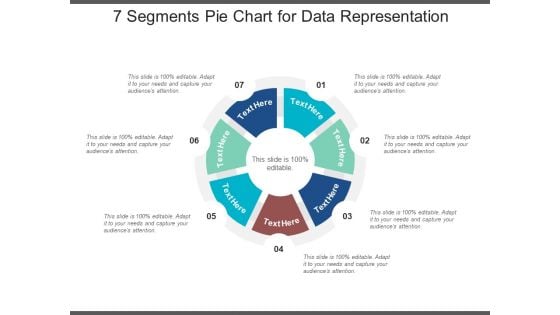
7 Segments Pie Chart For Data Representation Ppt PowerPoint Presentation Styles Summary
This is a 7 segments pie chart for data representation ppt powerpoint presentation styles summary. This is a seven stage process. The stages in this process are 6 piece pie chart, 6 segment pie chart, 6 parts pie chart.
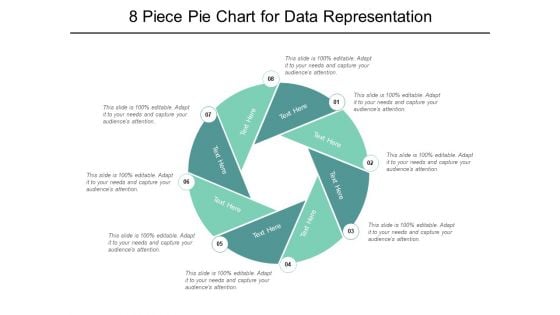
8 Piece Pie Chart For Data Representation Ppt PowerPoint Presentation Ideas
This is a 8 piece pie chart for data representation ppt powerpoint presentation ideas. This is a eight stage process. The stages in this process are 6 piece pie chart, 6 segment pie chart, 6 parts pie chart.
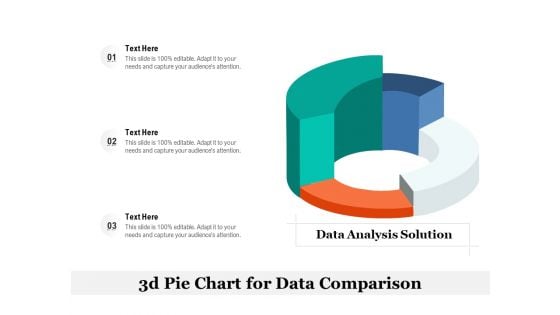
3D Pie Chart For Data Comparison Ppt Infographic Template Vector PDF
Presenting 3d pie chart for data comparison ppt infographic template vector pdf. to dispense important information. This template comprises three stages. It also presents valuable insights into the topics including data analysis solution, 3d pie chart for data comparison. This is a completely customizable PowerPoint theme that can be put to use immediately. So, download it and address the topic impactfully.
Bar Chart Showing Data Segmentation Anylysis Ppt PowerPoint Presentation Icon Examples PDF
Presenting this set of slides with name bar chart showing data segmentation anylysis ppt powerpoint presentation icon examples pdf. The topics discussed in these slide is bar chart showing data segmentation anylysis. This is a completely editable PowerPoint presentation and is available for immediate download. Download now and impress your audience.

Business Diagram Four Pie Chart For Data Driven Result Analysis Of Business PowerPoint Slide
This business diagram displays graphic of pie charts in shape of flasks. This business slide is suitable to present and compare business data. Use this diagram to build professional presentations for your viewers.
Data Analysis With Bar Chart In Magnifying Glass Vector Icon Ppt PowerPoint Presentation File Model PDF
Presenting this set of slides with name data analysis with bar chart in magnifying glass vector icon ppt powerpoint presentation file model pdf. This is a one stage process. The stages in this process is data analysis with bar chart in magnifying glass vector icon. This is a completely editable PowerPoint presentation and is available for immediate download. Download now and impress your audience.
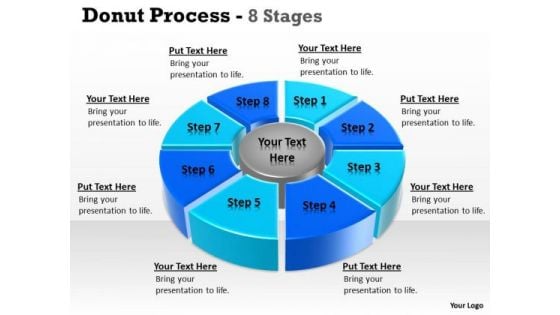
Strategic Management Donut Pie Chart For Data Comparisons 8 Stages Sales Diagram
Be The Doer With Our Strategic Management Donut Pie Chart For Data Comparisons 8 Stages Sales Diagram Powerpoint Templates. Put Your Thoughts Into Practice.
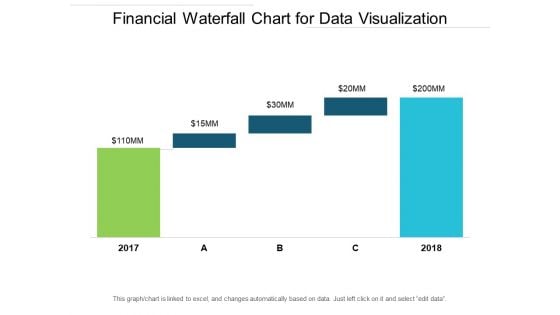
Financial Waterfall Chart For Data Visualization Ppt PowerPoint Presentation Ideas Elements
This is a financial waterfall chart for data visualization ppt powerpoint presentation ideas elements. This is a five stage process. The stages in this process are sales waterfall, waterfall chart, business.

 Home
Home