Data Collection Icon
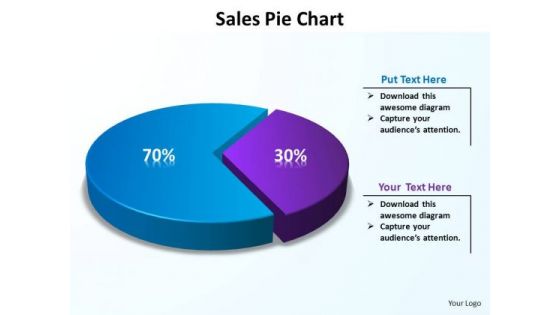
PowerPoint Layouts Growth Data Driven Pie Chart Ppt Designs
PowerPoint Layouts Growth Data Driven Pie Chart PPT Designs Business Power Points--These amazing PowerPoint pre-designed slides and PowerPoint templates have been carefully created by our team of experts to help you impress your audience. Our stunning collection of Powerpoint slides are 100% editable and can easily fit in any PowerPoint presentations. By using these animations and graphics in PowerPoint and you can easily make professional presentations. Any text can be entered at any point in the PowerPoint template or slide. Just DOWNLOAD our awesome PowerPoint templates and you are ready to go. Get the best backing available. It'll be difficult to beat your thoughts and our PowerPoint Layouts Growth Data Driven Pie Chart Ppt Designs.
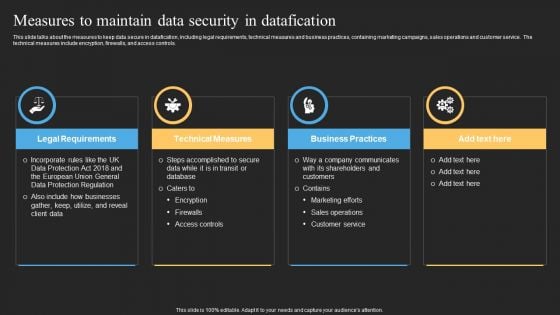
Datafy Measures To Maintain Data Security In Datafication Diagrams PDF
This slide talks about the measures to keep data secure in datafication, including legal requirements, technical measures and business practices, containing marketing campaigns, sales operations and customer service. The technical measures include encryption, firewalls, and access controls. Welcome to our selection of the Datafy Measures To Maintain Data Security In Datafication Diagrams PDF. These are designed to help you showcase your creativity and bring your sphere to life. Planning and Innovation are essential for any business that is just starting out. This collection contains the designs that you need for your everyday presentations. All of our PowerPoints are 100 percent editable, so you can customize them to suit your needs. This multi-purpose template can be used in various situations. Grab these presentation templates today.
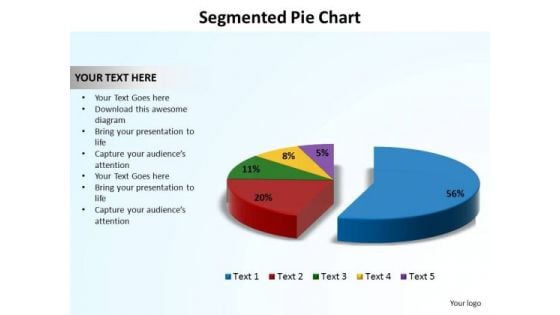
PowerPoint Process Data Driven Segmented Piechart Ppt Design Slides
PowerPoint Process Data Driven Segmented PieChart PPT Design Slides-The Circle of Life - a concept emmbedded in our minds and hence easy to comprehend. Life and Business is made up of processes comprising stages that flow from one to another. An excellent graphic to attract the attention of and understanding by your audience to improve earnings.-These amazing PowerPoint pre-designed slides and PowerPoint templates have been carefully created by our team of experts to help you impress your audience. Our stunning collection of Powerpoint slides are 100% editable and can easily fit in any PowerPoint presentations. By using these animations and graphics in PowerPoint and you can easily make professional presentations. Any text can be entered at any point in the PowerPoint template or slide. Just DOWNLOAD our awesome PowerPoint templates and you are ready to go. Our PowerPoint Process Data Driven Segmented Piechart Ppt Design Slides empower educators. Conveying concepts and ideas becomes easier.
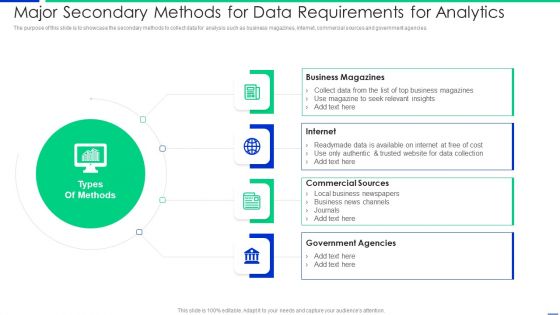
Major Secondary Methods For Data Requirements For Analytics Mockup PDF
The purpose of this slide is to showcase the secondary methods to collect data for analysis such as business magazines, internet, commercial sources and government agencies. Presenting major secondary methods for data requirements for analytics mockup pdf to dispense important information. This template comprises four stages. It also presents valuable insights into the topics including business magazines, internet, commercial sources. This is a completely customizable PowerPoint theme that can be put to use immediately. So, download it and address the topic impactfully.
Checklist To Gather Data For How To Conduct Competitive Assessment Icons Pdf
The following slide highlights a checklist showing data to be collected to assess competitor effectively. It showcases elements such as product, price, place, promotion, positioning, people, partnership and reputation. Present like a pro with Checklist To Gather Data For How To Conduct Competitive Assessment Icons Pdf Create beautiful presentations together with your team, using our easy to use presentation slides. Share your ideas in real time and make changes on the fly by downloading our templates. So whether you are in the office, on the go, or in a remote location, you can stay in sync with your team and present your ideas with confidence. With Slidegeeks presentation got a whole lot easier. Grab these presentations today. The following slide highlights a checklist showing data to be collected to assess competitor effectively. It showcases elements such as product, price, place, promotion, positioning, people, partnership and reputation.
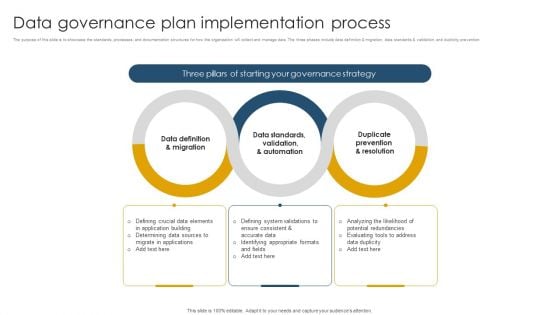
Data Governance Plan Implementation Process Ppt Example PDF
The purpose of this slide is to showcase the standards, processes, and documentation structures for how the organization will collect and manage data. The three phases include data definition and migration, data standards and validation, and duplicity prevention. Presenting Data Governance Plan Implementation Process Ppt Example PDF to dispense important information. This template comprises three stages. It also presents valuable insights into the topics including Duplicate Prevention, Data Standards, Validation And Automation. This is a completely customizable PowerPoint theme that can be put to use immediately. So, download it and address the topic impactfully.
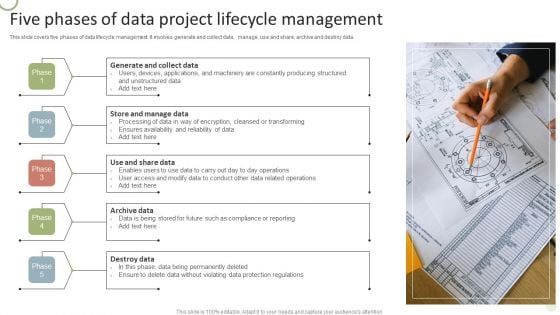
Five Phases Of Data Project Lifecycle Management Formats PDF
This slide covers five phases of data lifecycle management. It involves generate and collect data, manage, use and share, archive and destroy data.Persuade your audience using this Five Phases Of Data Project Lifecycle Management Formats PDF. This PPT design covers five stages, thus making it a great tool to use. It also caters to a variety of topics including Constantly Producing, Encryption Cleansed, Protection Regulations. Download this PPT design now to present a convincing pitch that not only emphasizes the topic but also showcases your presentation skills.
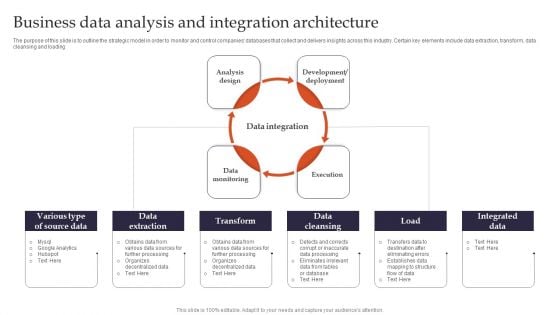
Business Data Analysis And Integration Architecture Brochure PDF
The purpose of this slide is to outline the strategic model in order to monitor and control companies databases that collect and delivers insights across this industry. Certain key elements include data extraction, transform, data cleansing and loading. Presenting Business Data Analysis And Integration Architecture Brochure PDF to dispense important information. This template comprises four stages. It also presents valuable insights into the topics including Analysis Design, Development Or Deployment, Data Monitoring. This is a completely customizable PowerPoint theme that can be put to use immediately. So, download it and address the topic impactfully.

Data Analysis Steps For Online Marketing Professional PDF
Transformation Toolkit Competitive Intelligence Information Analysis Data Change Management Plan With Value Icons PDF
This slide shows the value change management lifecycle. It includes the process of collecting and publicize the data and afterwards adopting change management approach for obtaining the data driven outcomes. If your project calls for a presentation, then Slidegeeks is your go to partner because we have professionally designed, easy to edit templates that are perfect for any presentation. After downloading, you can easily edit Transformation Toolkit Competitive Intelligence Information Analysis Data Change Management Plan With Value Icons PDF and make the changes accordingly. You can rearrange slides or fill them with different images. Check out all the handy templates.
Strategies To Effectively Manage Internal And External Data Sources Icons PDF
This slide covers the techniques to be adopted by businesses to effectively manage the collected data and maximize the use of business intelligence. It includes strategies for effective management of internal and external data sources such as start at end, customization increases power and put policies in place. Pitch your topic with ease and precision using this Strategies To Effectively Manage Internal And External Data Sources Icons PDF. This layout presents information on Customization Increases Power, Policies In Place. It is also available for immediate download and adjustment. So, changes can be made in the color, design, graphics or any other component to create a unique layout.
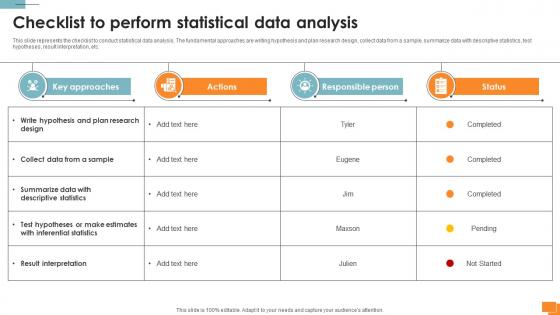
Statistical Tools For Evidence Checklist To Perform Statistical Data Analysis
This slide represents the checklist to conduct statistical data analysis. The fundamental approaches are writing hypothesis and plan research design, collect data from a sample, summarize data with descriptive statistics, test hypotheses, result interpretation, etc. Whether you have daily or monthly meetings, a brilliant presentation is necessary. Statistical Tools For Evidence Checklist To Perform Statistical Data Analysis can be your best option for delivering a presentation. Represent everything in detail using Statistical Tools For Evidence Checklist To Perform Statistical Data Analysis and make yourself stand out in meetings. The template is versatile and follows a structure that will cater to your requirements. All the templates prepared by Slidegeeks are easy to download and edit. Our research experts have taken care of the corporate themes as well. So, give it a try and see the results. This slide represents the checklist to conduct statistical data analysis. The fundamental approaches are writing hypothesis and plan research design, collect data from a sample, summarize data with descriptive statistics, test hypotheses, result interpretation, etc.
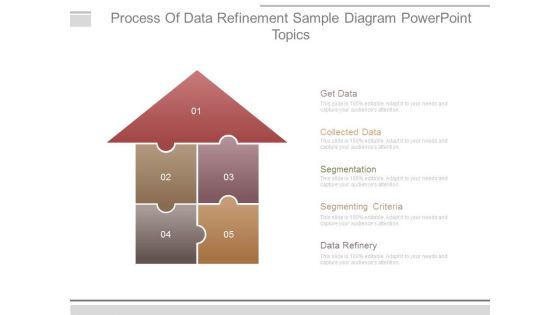
Process Of Data Refinement Sample Diagram Powerpoint Topics
This is a process of data refinement sample diagram powerpoint topics. This is a five stage process. The stages in this process are get data, collected data, segmentation, segmenting criteria, data refinery.

Healthcare Big Data Assessment Dashboard Slide2 Introduction PDF
This slide covers the records about the patients used to describe massive volumes of information created by the adoption of digital technologies that collect patients records and help in managing hospital performance. Showcasing this set of slides titled Healthcare Big Data Assessment Dashboard Slide2 Introduction PDF. The topics addressed in these templates are Forecasted Patient Turnover, Service Indicators, Occupancy. All the content presented in this PPT design is completely editable. Download it and make adjustments in color, background, font etc. as per your unique business setting.
Data Management Linear Flow Chart With Icons Ppt PowerPoint Presentation Gallery Graphic Tips PDF
Presenting data management linear flow chart with icons ppt powerpoint presentation gallery graphic tips pdf to dispense important information. This template comprises five stages. It also presents valuable insights into the topics including data collection, data input, data storage. This is a completely customizable PowerPoint theme that can be put to use immediately. So, download it and address the topic impactfully.
Key Stages Of Data Analytics Infrastructure To Analyze Information Icons PDF
This slide includes key stages in the data project life cycle that enable organizations to collect, store, analyse, and leverage data. It includes sensing, collection, wrangling, analysis, and storage. Presenting Key Stages Of Data Analytics Infrastructure To Analyze Information Icons PDF to dispense important information. This template comprises five stages. It also presents valuable insights into the topics including Sensing, Collection, Wrangling, Analysis, Storage. This is a completely customizable PowerPoint theme that can be put to use immediately. So, download it and address the topic impactfully.
Forward Strategy For Data Governance With Icons Ppt PowerPoint Presentation Gallery Show PDF
Persuade your audience using this forward strategy for data governance with icons ppt powerpoint presentation gallery show pdf. This PPT design covers four stages, thus making it a great tool to use. It also caters to a variety of topics including data collection, data processing, data input. Download this PPT design now to present a convincing pitch that not only emphasizes the topic but also showcases your presentation skills.
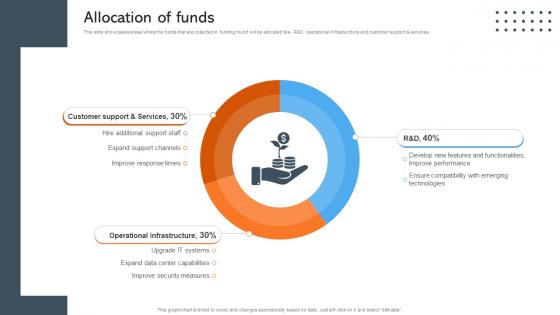
Allocation Of Funds Data Management Company Investor Funding Pitch Deck
This slide showcases areas where the funds that are collected in funding round will be allocated like- R and D, operational infrasturcture and customer support and services. Find a pre-designed and impeccable Allocation Of Funds Data Management Company Investor Funding Pitch Deck. The templates can ace your presentation without additional effort. You can download these easy-to-edit presentation templates to make your presentation stand out from others. So, what are you waiting for Download the template from Slidegeeks today and give a unique touch to your presentation. This slide showcases areas where the funds that are collected in funding round will be allocated like- R and D, operational infrasturcture and customer support and services.
Process Of Business Data Management With Icons Ppt PowerPoint Presentation Summary Design Inspiration PDF
Presenting this set of slides with name process of business data management with icons ppt powerpoint presentation summary design inspiration pdf. This is a six stage process. The stages in this process are storage, output, processing, input, preparation, collection. This is a completely editable PowerPoint presentation and is available for immediate download. Download now and impress your audience.
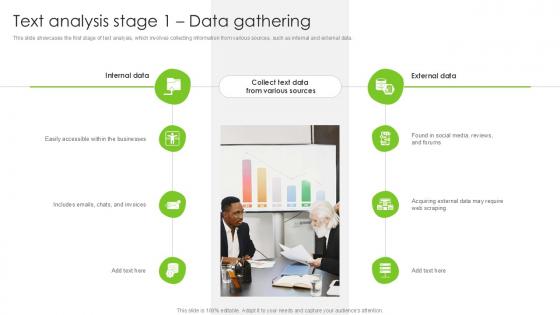
Text Analysis Stage 1 Data Gathering PPT Slide SS
This slide showcases the first stage of text analysis, which involves collecting information from various sources, such as internal and external data. Are you searching for a Text Analysis Stage 1 Data Gathering PPT Slide SS that is uncluttered, straightforward, and original Its easy to edit, and you can change the colors to suit your personal or business branding. For a presentation that expresses how much effort you have put in, this template is ideal With all of its features, including tables, diagrams, statistics, and lists, its perfect for a business plan presentation. Make your ideas more appealing with these professional slides. Download Text Analysis Stage 1 Data Gathering PPT Slide SS from Slidegeeks today. This slide showcases the first stage of text analysis, which involves collecting information from various sources, such as internal and external data.
Play 13 Enable Developing Services And Data Publishing Openly Public Sector Digital Solutions Icons Pdf
This slide provides information regarding digital services play which helps analyze publishing data in open-source platform. It helps in building services by simplifying public access to government services, allow the reusage of services by non-profits, agencies, entrepreneurs or public. Slidegeeks is one of the best resources for PowerPoint templates. You can download easily and regulate Play 13 Enable Developing Services And Data Publishing Openly Public Sector Digital Solutions Icons Pdf for your personal presentations from our wonderful collection. A few clicks is all it takes to discover and get the most relevant and appropriate templates. Use our Templates to add a unique zing and appeal to your presentation and meetings. All the slides are easy to edit and you can use them even for advertisement purposes. This slide provides information regarding digital services play which helps analyze publishing data in open-source platform. It helps in building services by simplifying public access to government services, allow the reusage of services by non-profits, agencies, entrepreneurs or public.
BI Technique For Data Informed Decisions Deployment Options For Sap Analytics Cloud Icons PDF
The purpose of this slide is to provide an information regarding the deployment methods for SAP Analytics Cloud implementation in the business organization. It also contains details of each deployment options key features. Slidegeeks is one of the best resources for PowerPoint templates. You can download easily and regulate BI Technique For Data Informed Decisions Deployment Options For Sap Analytics Cloud Icons PDF for your personal presentations from our wonderful collection. A few clicks is all it takes to discover and get the most relevant and appropriate templates. Use our Templates to add a unique zing and appeal to your presentation and meetings. All the slides are easy to edit and you can use them even for advertisement purposes.
AI And ML Driving Monetary Value For Organization Required Manpower Skills Set Data Icons PDF
Following slide shows details about required manpower skills set. Skills set covered are domain knowledge, machine learning, data visualization and hacking. Deliver and pitch your topic in the best possible manner with this ai and ml driving monetary value for organization required manpower skills set data icons pdf. Use them to share invaluable insights on data engineer, data scientist, devops engineer, data visualization, machine learning and impress your audience. This template can be altered and modified as per your expectations. So, grab it now.
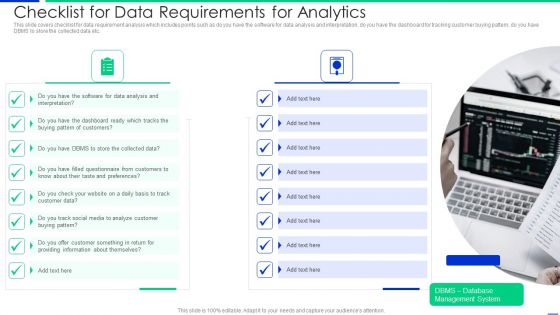
Checklist For Data Requirements For Analytics Information PDF
This slide covers checklist for data requirement analysis which includes points such as do you have the software for data analysis and interpretation, do you have the dashboard for tracking customer buying pattern, do you have DBMS to store the collected data etc. Presenting checklist for data requirements for analytics information pdf to dispense important information. This template comprises two stages. It also presents valuable insights into the topics including analysis, customers, dashboard. This is a completely customizable PowerPoint theme that can be put to use immediately. So, download it and address the topic impactfully.
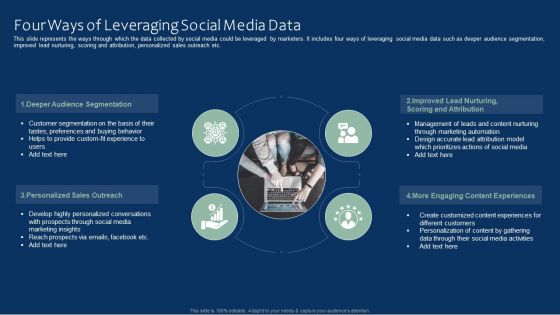
Four Ways Of Leveraging Social Media Data Information PDF
This slide represents the ways through which the data collected by social media could be leveraged by marketers. It includes four ways of leveraging social media data such as deeper audience segmentation, improved lead nurturing, scoring and attribution, personalized sales outreach etc. Presenting Four Ways Of Leveraging Social Media Data Information PDF to dispense important information. This template comprises four stages. It also presents valuable insights into the topics including Deeper Audience Segmentation, Personalized Sales Outreach, Engaging Content Experiences. This is a completely customizable PowerPoint theme that can be put to use immediately. So, download it and address the topic impactfully.
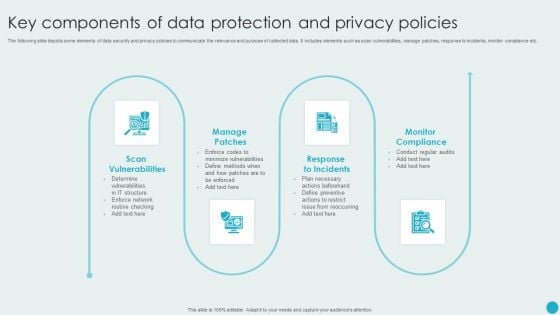
Key Components Of Data Protection And Privacy Policies Graphics PDF
The following slide depicts some elements of data security and privacy policies to communicate the relevance and purpose of collected data. It includes elements such as scan vulnerabilities, manage patches, response to incidents, monitor compliance etc. Presenting Key Components Of Data Protection And Privacy Policies Graphics PDF to dispense important information. This template comprises four stages. It also presents valuable insights into the topics including Manage Patches, Response To Incidents, Monitor Compliance. This is a completely customizable PowerPoint theme that can be put to use immediately. So, download it and address the topic impactfully.
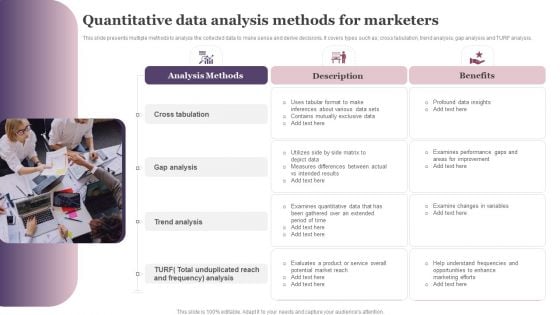
Quantitative Data Analysis Methods For Marketers Ppt Pictures Aids PDF
This slide presents multiple methods to analyze the collected data to make sense and derive decisions. It covers types such as, cross tabulation, trend analysis, gap analysis and TURF analysis. Presenting Quantitative Data Analysis Methods For Marketers Ppt Pictures Aids PDF to dispense important information. This template comprises three stages. It also presents valuable insights into the topics including Cross Tabulation, Gap Analysis, Trend Analysis. This is a completely customizable PowerPoint theme that can be put to use immediately. So, download it and address the topic impactfully.
Horizontal Scaling Technique For Information Team Structure For Data Management System Expansion Icons PDF
This slide represents the team structure for the data repository expansion project. It provides details regarding core and support team members in terms of job role and employee name.Deliver and pitch your topic in the best possible manner with this Horizontal Scaling Technique For Information Team Structure For Data Management System Expansion Icons PDF Use them to share invaluable insights on Documentation Information, Security Engineer, Information Security Engineer and impress your audience. This template can be altered and modified as per your expectations. So, grab it now.
Information Science Different Types Of Data Scientists Ppt PowerPoint Presentation Model Icons PDF
This slide represents the different types of data scientists, including vertical experts, stat DS managers, generalists, legends, statisticians, ML engineers, and dabblers.Presenting Information Science Different Types Of Data Scientists Ppt PowerPoint Presentation Model Icons PDF to provide visual cues and insights. Share and navigate important information on seven stages that need your due attention. This template can be used to pitch topics like Vertical Experts, Information Consistently, Roadblocks Tooling. In addtion, this PPT design contains high resolution images, graphics, etc, that are easily editable and available for immediate download.
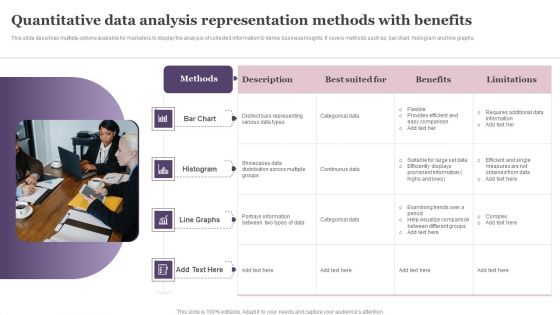
Quantitative Data Analysis Representation Methods With Benefits Template PDF
This slide describes multiple options available for marketers to display the analysis of collected information to derive business insights. It covers methods such as, bar chart, histogram and line graphs. Persuade your audience using this Quantitative Data Analysis Representation Methods With Benefits Template PDF. This PPT design covers four stages, thus making it a great tool to use. It also caters to a variety of topics including Bar Chart, Histogram, Line Graphs. Download this PPT design now to present a convincing pitch that not only emphasizes the topic but also showcases your presentation skills.
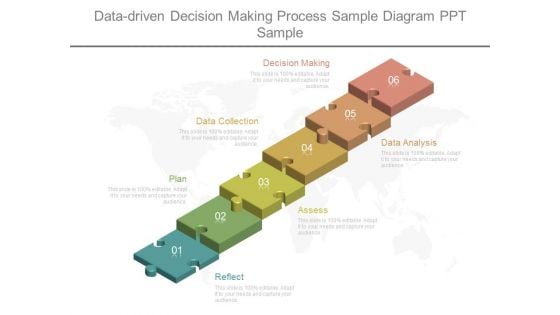
Data Driven Decision Making Process Sample Diagram Ppt Sample
This is a data driven decision making process sample diagram ppt sample. This is a six stage process. The stages in this process are decision making, data collection, plan, reflect, assess, data analysis.
Using Data Science Technologies For Business Transformation Tasks And Skills Of Machine Learning Engineer Icons PDF
This slide represents the machine learning engineers tasks and skills, including a deep knowledge of machine learning, ML algorithms, and Python and C. Coming up with a presentation necessitates that the majority of the effort goes into the content and the message you intend to convey. The visuals of a PowerPoint presentation can only be effective if it supplements and supports the story that is being told. Keeping this in mind our experts created Using Data Science Technologies For Business Transformation Tasks And Skills Of Machine Learning Engineer Icons PDF to reduce the time that goes into designing the presentation. This way, you can concentrate on the message while our designers take care of providing you with the right template for the situation.
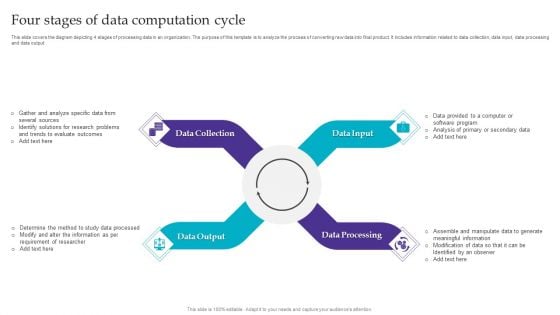
Four Stages Of Data Computation Cycle Graphics PDF
This slide covers the diagram depicting 4 stages of processing data in an organization. The purpose of this template is to analyze the process of converting raw data into final product. It includes information related to data collection, data input, data processing and data output. Persuade your audience using this Four Stages Of Data Computation Cycle Graphics PDF. This PPT design covers four stages, thus making it a great tool to use. It also caters to a variety of topics including Data Collection, Data Input, Data Processing. Download this PPT design now to present a convincing pitch that not only emphasizes the topic but also showcases your presentation skills.

Four Components Of Big Data And Analytics Framework Diagrams PDF
This slide illustrate four different components of data and analytics architecture that enable people and teams to store and analyze organizations data. It includes components such as data collection, transformation, data storage and analytics Persuade your audience using this Four Components Of Big Data And Analytics Framework Diagrams PDF. This PPT design covers four stages, thus making it a great tool to use. It also caters to a variety of topics including Data Collection, Transformation, Data Storage. Download this PPT design now to present a convincing pitch that not only emphasizes the topic but also showcases your presentation skills.
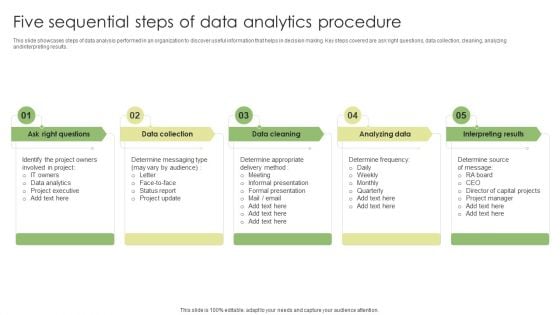
Five Sequential Steps Of Data Analytics Procedure Diagrams PDF
This slide showcases steps of data analysis performed in an organization to discover useful information that helps in decision making. Key steps covered are ask right questions, data collection, cleaning, analyzing and interpreting results. Persuade your audience using this Five Sequential Steps Of Data Analytics Procedure Diagrams PDF. This PPT design covers five stages, thus making it a great tool to use. It also caters to a variety of topics including Data Collection, Analyzing Data, Interpreting Results. Download this PPT design now to present a convincing pitch that not only emphasizes the topic but also showcases your presentation skills.
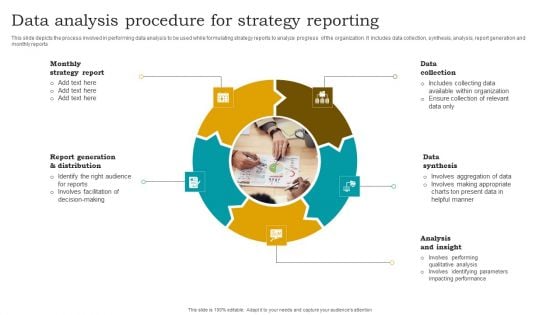
Data Analysis Procedure For Strategy Reporting Designs PDF
This slide depicts the process involved in performing data analysis to be used while formulating strategy reports to analyze progress of the organization. It includes data collection, synthesis, analysis, report generation and monthly reports. Presenting Data Analysis Procedure For Strategy Reporting Designs PDF to dispense important information. This template comprises five stages. It also presents valuable insights into the topics including Data Collection, Data Synthesis, Analysis And Insight. This is a completely customizable PowerPoint theme that can be put to use immediately. So, download it and address the topic impactfully.
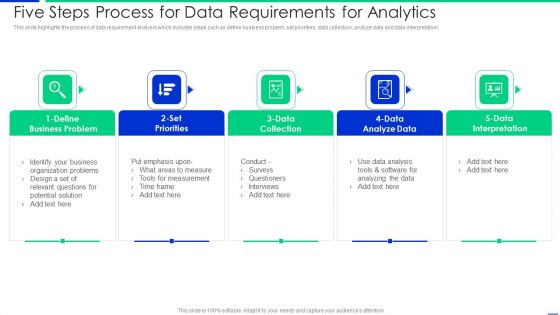
Five Steps Process For Data Requirements For Analytics Rules PDF
This slide highlights the process of data requirement analysis which includes steps such as define business problem, set priorities, data collection, analyze data and data interpretation. Presenting five steps process for data requirements for analytics rules pdf to dispense important information. This template comprises five stages. It also presents valuable insights into the topics including surveys, data analysis, interpretation. This is a completely customizable PowerPoint theme that can be put to use immediately. So, download it and address the topic impactfully.
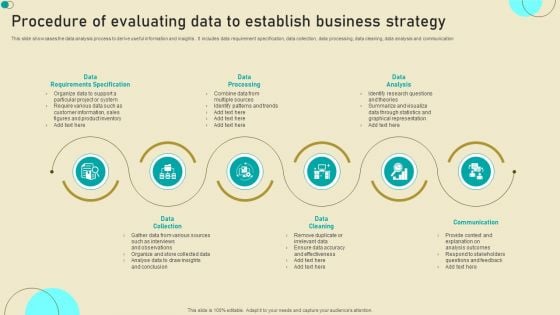
Procedure Of Evaluating Data To Establish Business Strategy Clipart PDF
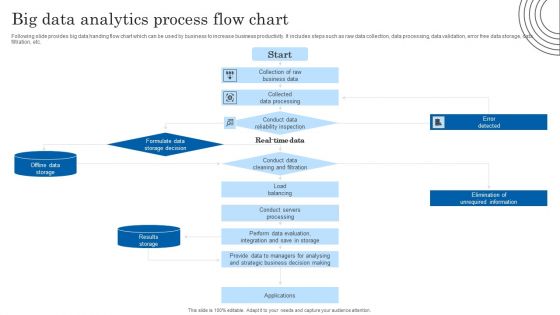
Big Data Analytics Process Flow Chart Topics PDF
Following slide provides big data handing flow chart which can be used by business to increase business productivity. It includes steps such as raw data collection, data processing, data validation, error free data storage, data filtration, etc. Showcasing this set of slides titled Big Data Analytics Process Flow Chart Topics PDF. The topics addressed in these templates are Conduct Data, Information, Evaluation. All the content presented in this PPT design is completely editable. Download it and make adjustments in color, background, font etc. as per your unique business setting.
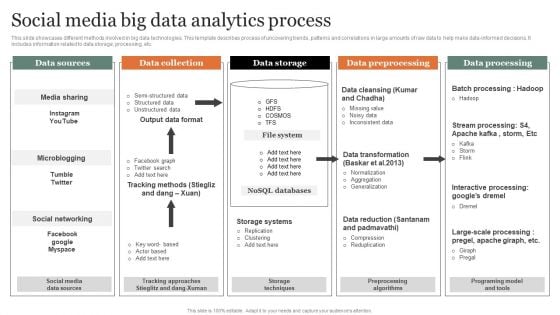
Social Media Big Data Analytics Process Diagrams PDF
This slide showcases different methods involved in big data technologies. This template describes process of uncovering trends, patterns and correlations in large amounts of raw data to help make data informed decisions. It includes information related to data storage, processing, etc. Showcasing this set of slides titled Social Media Big Data Analytics Process Diagrams PDF Microsoft. The topics addressed in these templates are Data Collection, Data Storage, Data Preprocessing. All the content presented in this PPT design is completely editable. Download it and make adjustments in color, background, font etc. as per your unique business setting.
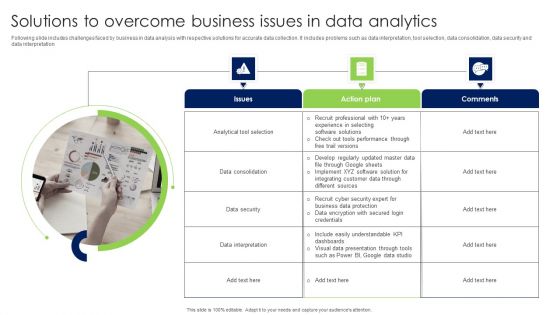
Solutions To Overcome Business Issues In Data Analytics Infographics PDF
Following slide includes challenges faced by business in data analysis with respective solutions for accurate data collection. It includes problems such as data interpretation, tool selection, data consolidation, data security and data interpretation Presenting Solutions To Overcome Business Issues In Data Analytics Infographics PDF to dispense important information. This template comprises Three stages. It also presents valuable insights into the topics including Issues, Action Plan, Comments. This is a completely customizable PowerPoint theme that can be put to use immediately. So, download it and address the topic impactfully.

Challenges Of Big Data In Health Industry Diagrams PDF
The following slide showcases challenges that healthcare organizations face while implementing big data. It include problems such as capturing data, high implementation cost, ensuring data privacy and security, and lack of appropriate staff. Presenting Challenges Of Big Data In Health Industry Diagrams PDF to dispense important information. This template comprises four stages. It also presents valuable insights into the topics including Data Collection, Implementation Costs, Security. This is a completely customizable PowerPoint theme that can be put to use immediately. So, download it and address the topic impactfully.
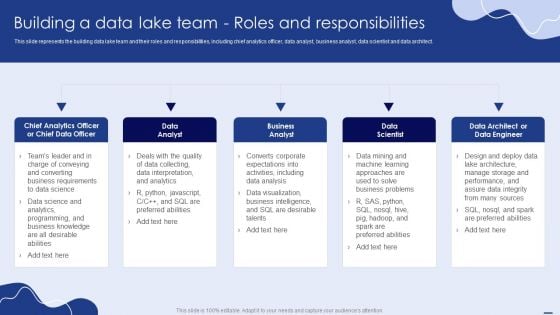
Building A Data Lake Team Roles And Responsibilities Themes PDF
This slide represents the building data lake team and their roles and responsibilities, including chief analytics officer, data analyst, business analyst, data scientist and data architect. Slidegeeks is one of the best resources for PowerPoint templates. You can download easily and regulate Building A Data Lake Team Roles And Responsibilities Themes PDF for your personal presentations from our wonderful collection. A few clicks is all it takes to discover and get the most relevant and appropriate templates. Use our Templates to add a unique zing and appeal to your presentation and meetings. All the slides are easy to edit and you can use them even for advertisement purposes.
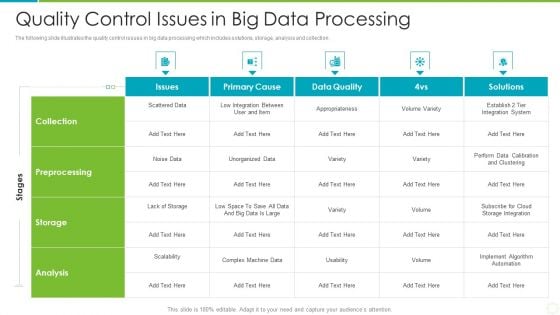
Quality Control Issues In Big Data Processing Themes PDF
The following slide illustrates the quality control issues in big data processing which includes solutions, storage, analysis and collection. Pitch your topic with ease and precision using this quality control issues in big data processing themes pdf. This layout presents information on preprocessing, storage, analysis. It is also available for immediate download and adjustment. So, changes can be made in the color, design, graphics or any other component to create a unique layout
Security Breach Events Tracking Dashboard Data Breach Prevention Themes Pdf
Slidegeeks is one of the best resources for PowerPoint templates. You can download easily and regulate Security Breach Events Tracking Dashboard Data Breach Prevention Themes Pdf for your personal presentations from our wonderful collection. A few clicks is all it takes to discover and get the most relevant and appropriate templates. Use our Templates to add a unique zing and appeal to your presentation and meetings. All the slides are easy to edit and you can use them even for advertisement purposes. This slide represents the dashboard to track data breach attacks. The purpose of this slide is to provide a graphical representation of cyber attacks that occurred in a specific period. It also depicts the overview of different types of attacks.
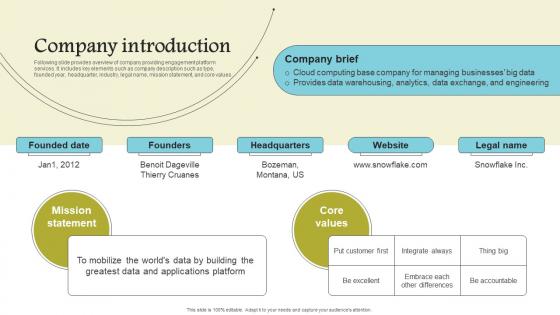
Company Introduction Cloud Data Computing Company Fund Raising Diagrams PDF
Following slide provides overview of company providing engagement platform services. It includes key elements such as company description such as type, founded year, headquarter, industry, legal name, mission statement, and core values. Slidegeeks is one of the best resources for PowerPoint templates. You can download easily and regulate Company Introduction Cloud Data Computing Company Fund Raising Diagrams PDF for your personal presentations from our wonderful collection. A few clicks is all it takes to discover and get the most relevant and appropriate templates. Use our Templates to add a unique zing and appeal to your presentation and meetings. All the slides are easy to edit and you can use them even for advertisement purposes. Following slide provides overview of company providing engagement platform services. It includes key elements such as company description such as type, founded year, headquarter, industry, legal name, mission statement, and core values.
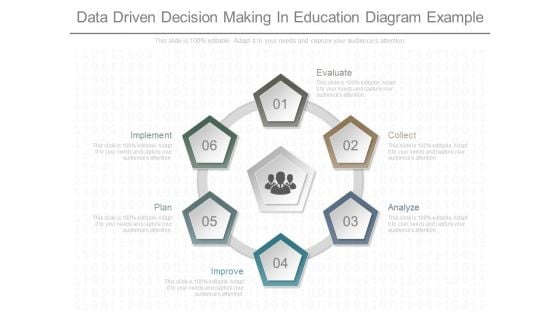
Data Driven Decision Making In Education Diagram Example
This is a data driven decision making in education diagram example. This is a six stage process. The stages in this process are evaluate, collect, analyze, improve, plan, implement.
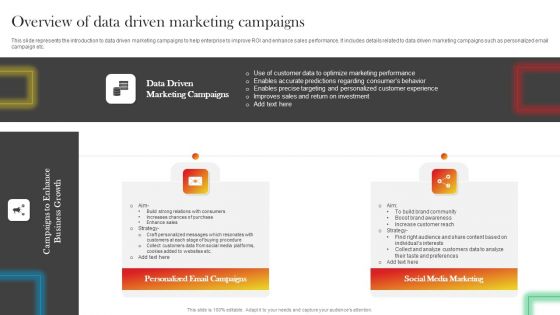
Overview Of Data Driven Marketing Campaigns Diagrams PDF
This slide represents the introduction to data driven marketing campaigns to help enterprise to improve ROI and enhance sales performance. It includes details related to data driven marketing campaigns such as personalized email campaign etc. Slidegeeks is one of the best resources for PowerPoint templates. You can download easily and regulate Overview Of Data Driven Marketing Campaigns Diagrams PDF for your personal presentations from our wonderful collection. A few clicks is all it takes to discover and get the most relevant and appropriate templates. Use our Templates to add a unique zing and appeal to your presentation and meetings. All the slides are easy to edit and you can use them even for advertisement purposes.
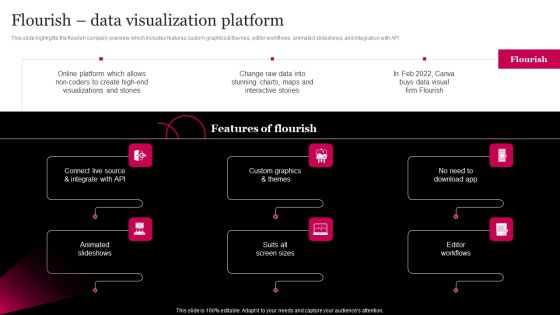
Picture Editing Company Outline Flourish Data Visualization Platform Graphics PDF
This slide highlights the flourish company overview which includes features custom graphics and themes, editor workflows, animated slideshows, and integration with API Slidegeeks is one of the best resources for PowerPoint templates. You can download easily and regulate Picture Editing Company Outline Flourish Data Visualization Platform Graphics PDF for your personal presentations from our wonderful collection. A few clicks is all it takes to discover and get the most relevant and appropriate templates. Use our Templates to add a unique zing and appeal to your presentation and meetings. All the slides are easy to edit and you can use them even for advertisement purposes.
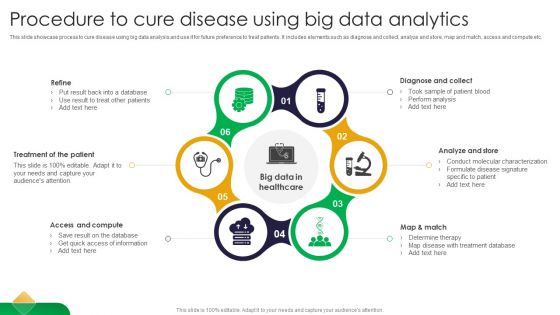
Procedure To Cure Disease Using Big Data Analytics Designs PDF
This slide showcase process to cure disease using big data analysis and use it for future preference to treat patients. It includes elements such as diagnose and collect, analyze and store, map and match, access and compute etc. Presenting Procedure To Cure Disease Using Big Data Analytics Designs PDF to dispense important information. This template comprises five stages. It also presents valuable insights into the topics including Patient, Compute, Collect. This is a completely customizable PowerPoint theme that can be put to use immediately. So, download it and address the topic impactfully.
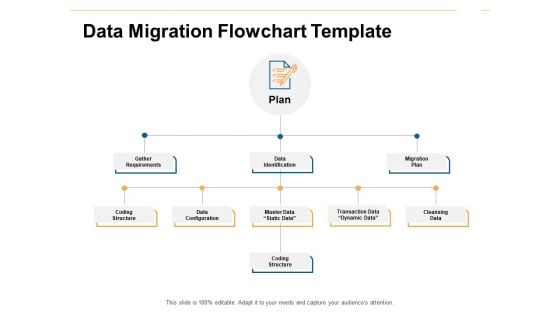
Data Migration Flowchart Template Ppt PowerPoint Presentation Summary Structure
Presenting this set of slides with name data migration flowchart template ppt powerpoint presentation summary structure. This is a four stage process. The stages in this process are plan, gather requirements, data identification, migration plan, data configuration, cleansing data, coding structure. This is a completely editable PowerPoint presentation and is available for immediate download. Download now and impress your audience.
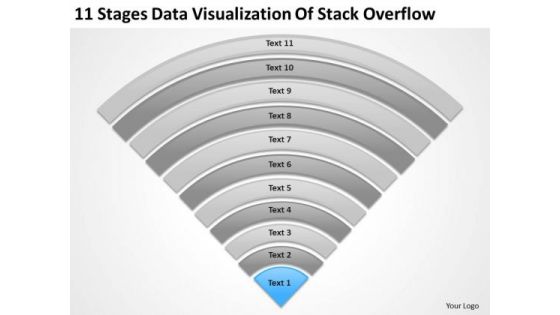
Data Visualization Of Stack Overflow Simple Business Plan PowerPoint Templates
We present our data visualization of stack overflow simple business plan PowerPoint templates.Present our Business PowerPoint Templates because Our PowerPoint Templates and Slides are effectively colour coded to prioritise your plans They automatically highlight the sequence of events you desire. Use our Process and Flows PowerPoint Templates because Our PowerPoint Templates and Slides will weave a web of your great ideas. They are gauranteed to attract even the most critical of your colleagues. Present our Flow Charts PowerPoint Templates because You can Stir your ideas in the cauldron of our PowerPoint Templates and Slides. Cast a magic spell on your audience. Download and present our Shapes PowerPoint Templates because Our PowerPoint Templates and Slides provide you with a vast range of viable options. Select the appropriate ones and just fill in your text. Use our Triangles PowerPoint Templates because You aspire to touch the sky with glory. Let our PowerPoint Templates and Slides provide the fuel for your ascent.Use these PowerPoint slides for presentations relating to Saturation, strip, saturated, line, spectrum, pantone, bright, diagram, circle, sampler, guide, element, paint, scale,shape, ten, multicolored, palette, illustration, spectral, guidance, chart, collection, abstraction, selection, choice, visible, variation, painter, contrast, ,gradient, pattern, chooser, analyzer. The prominent colors used in the PowerPoint template are Blue light, Gray, White. Father them through testing times. Bear the burden with our Data Visualization Of Stack Overflow Simple Business Plan PowerPoint Templates.
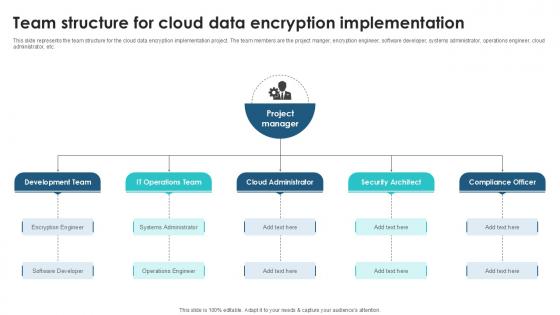
Team Structure For Cloud Data Client Side Encryption PPT Presentation
This slide represents the team structure for the cloud data encryption implementation project. The team members are the project manger, encryption engineer, software developer, systems administrator, operations engineer, cloud administrator, etc. Retrieve professionally designed Team Structure For Cloud Data Client Side Encryption PPT Presentation to effectively convey your message and captivate your listeners. Save time by selecting pre-made slideshows that are appropriate for various topics, from business to educational purposes. These themes come in many different styles, from creative to corporate, and all of them are easily adjustable and can be edited quickly. Access them as PowerPoint templates or as Google Slides themes. You do not have to go on a hunt for the perfect presentation because Slidegeeks got you covered from everywhere. This slide represents the team structure for the cloud data encryption implementation project. The team members are the project manger, encryption engineer, software developer, systems administrator, operations engineer, cloud administrator, etc.
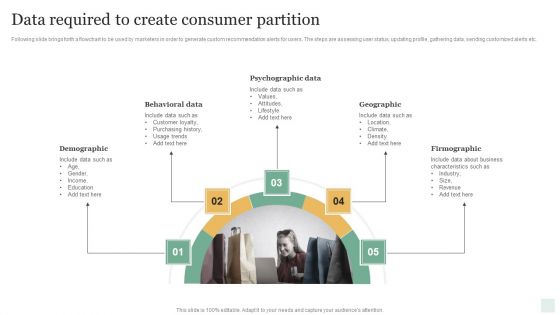
Data Required To Create Consumer Partition Summary PDF
Following slide brings forth a flowchart to be used by marketers in order to generate custom recommendation alerts for users. The steps are assessing user status, updating profile, gathering data, sending customized alerts etc. Presenting Data Required To Create Consumer Partition Summary PDF to dispense important information. This template comprises five stages. It also presents valuable insights into the topics including Demographic, Behavioral Data, Psychographic Data, Geographic, Firmographic. This is a completely customizable PowerPoint theme that can be put to use immediately. So, download it and address the topic impactfully.
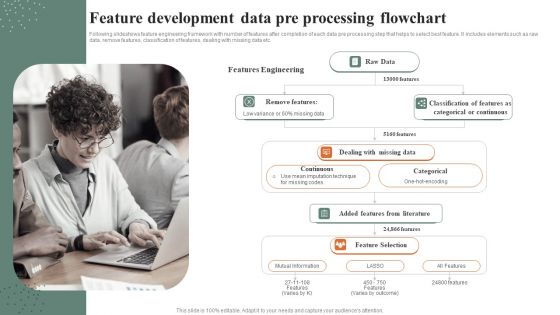
Feature Development Data Pre Processing Flowchart Demonstration PDF
Following slideshows feature engineering framework with number of features after completion of each data pre processing step that helps to select best feature. It includes elements such as raw data, remove features, classification of features, dealing with missing data etc. Presenting Feature Development Data Pre Processing Flowchart Demonstration PDF to dispense important information. This template comprises one stages. It also presents valuable insights into the topics including Features Engineering, Raw Data, Feature Selection. This is a completely customizable PowerPoint theme that can be put to use immediately. So, download it and address the topic impactfully.
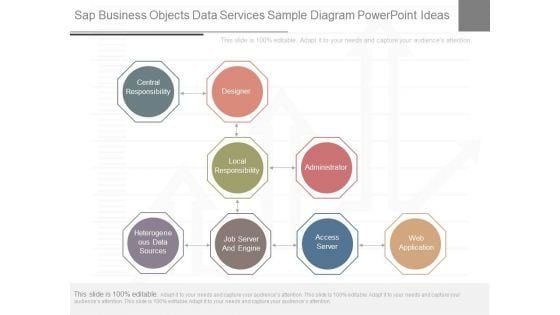
Sap Business Objects Data Services Sample Diagram Powerpoint Ideas
This is a sap business objects data services sample diagram powerpoint ideas. This is a three stage process. The stages in this process are central responsibility, designer, local responsibility, administrator, heterogeneous data sources, job server and engine, access server, web application.
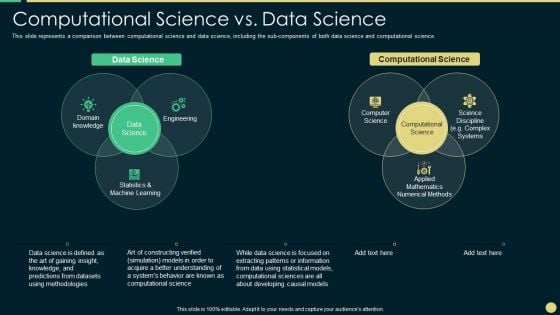
Scientific Computing IT Computational Science Vs Data Science Introduction PDF
This slide represents a comparison between computational science and data science, including the sub-components of both data science and computational science.Presenting scientific computing it computational science vs data science introduction pdf to provide visual cues and insights. Share and navigate important information on three stages that need your due attention. This template can be used to pitch topics like domain knowledge, statistics and machine learning, engineering In addtion, this PPT design contains high resolution images, graphics, etc, that are easily editable and available for immediate download.

Quarterly Data Analytics Career Roadmap For Engineering Professional Diagrams
Presenting our innovatively-structured quarterly data analytics career roadmap for engineering professional diagrams Template. Showcase your roadmap process in different formats like PDF, PNG, and JPG by clicking the download button below. This PPT design is available in both Standard Screen and Widescreen aspect ratios. It can also be easily personalized and presented with modified font size, font type, color, and shapes to measure your progress in a clear way.
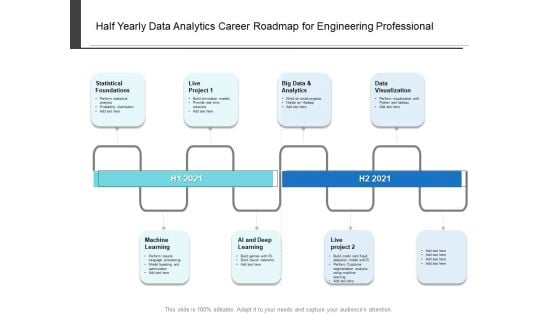
Half Yearly Data Analytics Career Roadmap For Engineering Professional Themes
Presenting our innovatively-structured half yearly data analytics career roadmap for engineering professional themes Template. Showcase your roadmap process in different formats like PDF, PNG, and JPG by clicking the download button below. This PPT design is available in both Standard Screen and Widescreen aspect ratios. It can also be easily personalized and presented with modified font size, font type, color, and shapes to measure your progress in a clear way.
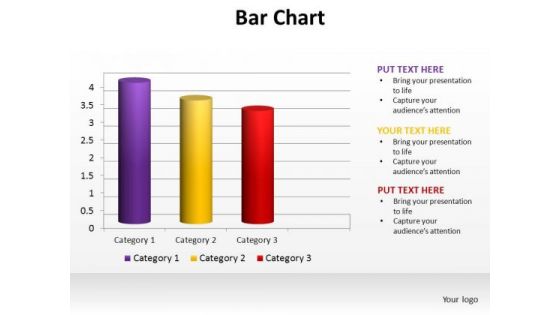
PowerPoint Slide Designs Data Driven Bar Chart Ppt Template
PowerPoint Slide Designs Data Driven Bar Chart PPT Template-These high quality powerpoint pre-designed slides and powerpoint templates have been carefully created by our professional team to help you impress your audience. All slides have been created and are 100% editable in powerpoint. Each and every property of any graphic - color, size, orientation, shading, outline etc. can be modified to help you build an effective powerpoint presentation. Any text can be entered at any point in the powerpoint template or slide. Simply DOWNLOAD, TYPE and PRESENT! Engineering changes is easier with our PowerPoint Slide Designs Data Driven Bar Chart Ppt Template. They enhance the chances of acceptance.


 Continue with Email

 Home
Home


