Data Cycle
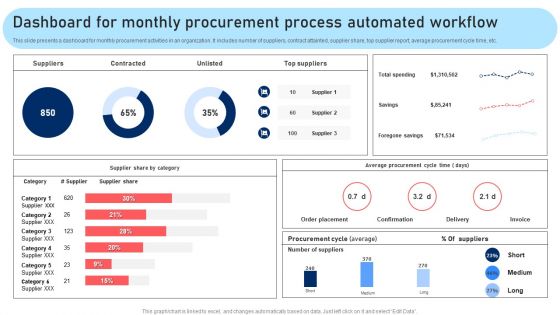
Dashboard For Monthly Procurement Process Automated Workflow Rules PDF
This slide presents a dashboard for monthly procurement activities in an organization. It includes number of suppliers, contract attainted, supplier share, top supplier report, average procurement cycle time, etc. Are you searching for a Dashboard For Monthly Procurement Process Automated Workflow Rules PDF that is uncluttered, straightforward, and original Its easy to edit, and you can change the colors to suit your personal or business branding. For a presentation that expresses how much effort you have put in, this template is ideal. With all of its features, including tables, diagrams, statistics, and lists, its perfect for a business plan presentation. Make your ideas more appealing with these professional slides. Download Dashboard For Monthly Procurement Process Automated Workflow Rules PDF from Slidegeeks today.
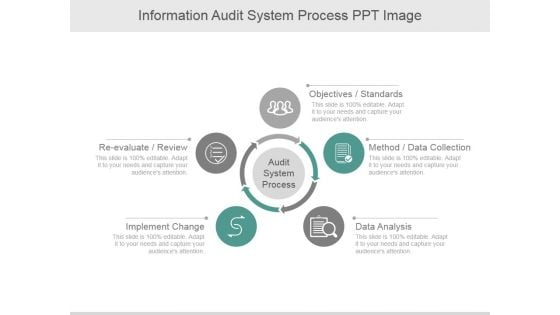
Information Audit System Process Ppt PowerPoint Presentation Ideas
This is a information audit system process ppt powerpoint presentation ideas. This is a five stage process. The stages in this process are objectives standards, method data collection, data analysis, implement change, re evaluate review.

Technological Process Business Template Presentation Powerpoint Example
This is a technological process business template presentation powerpoint example. This is a eight stage process. The stages in this process are client website, training, webinars, coaching, modelling, data preparation, data understanding, business understanding.
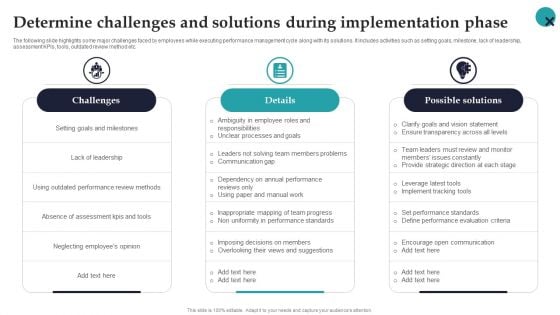
Determine Challenges And Solutions During Implementation Phase Employee Performance Management Clipart PDF
The following slide highlights some major challenges faced by employees while executing performance management cycle along with its solutions. It includes activities such as setting goals, milestone, lack of leadership, assessment KPIs, tools, outdated review method etc.Do you have to make sure that everyone on your team knows about any specific topic I yes, then you should give Determine Challenges And Solutions During Implementation Phase Employee Performance Management Clipart PDF a try. Our experts have put a lot of knowledge and effort into creating this impeccable Determine Challenges And Solutions During Implementation Phase Employee Performance Management Clipart PDF. You can use this template for your upcoming presentations, as the slides are perfect to represent even the tiniest detail. You can download these templates from the Slidegeeks website and these are easy to edit. So grab these today.
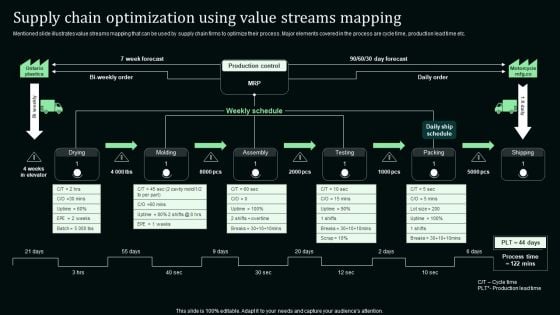
Supply Chain Optimization Using Value Streams Mapping Stand Out Digital Supply Chain Tactics Enhancing Formats PDF
Mentioned slide illustrates value streams mapping that can be used by supply chain firms to optimize their process. Major elements covered in the process are cycle time, production lead time etc. This modern and well-arranged Supply Chain Optimization Using Value Streams Mapping Stand Out Digital Supply Chain Tactics Enhancing Formats PDF provides lots of creative possibilities. It is very simple to customize and edit with the Powerpoint Software. Just drag and drop your pictures into the shapes. All facets of this template can be edited with Powerpoint no extra software is necessary. Add your own material, put your images in the places assigned for them, adjust the colors, and then you can show your slides to the world, with an animated slide included.
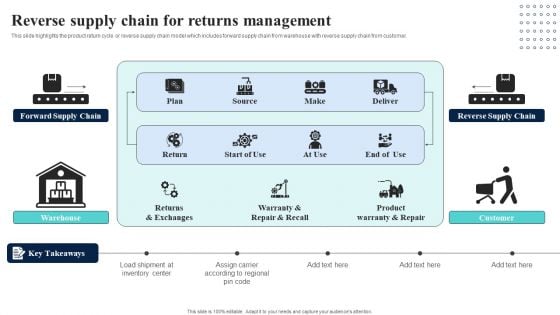
Supply Network Planning And Administration Tactics Reverse Supply Chain For Returns Management Microsoft PDF
This slide highlights the product return cycle or reverse supply chain model which includes forward supply chain from warehouse with reverse supply chain from customer. Retrieve professionally designed Supply Network Planning And Administration Tactics Reverse Supply Chain For Returns Management Microsoft PDF to effectively convey your message and captivate your listeners. Save time by selecting pre made slideshows that are appropriate for various topics, from business to educational purposes. These themes come in many different styles, from creative to corporate, and all of them are easily adjustable and can be edited quickly. Access them as PowerPoint templates or as Google Slides themes. You do not have to go on a hunt for the perfect presentation because Slidegeeks got you covered from everywhere.
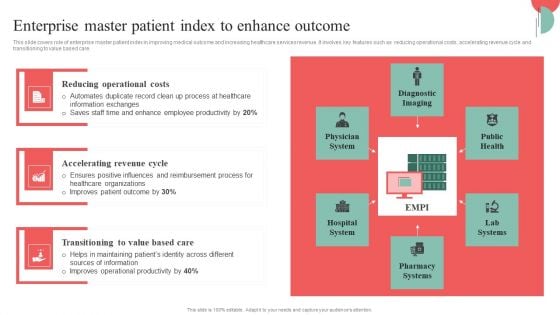
Incorporating HIS To Enhance Healthcare Services Enterprise Master Patient Index To Enhance Outcome Infographics PDF
This slide covers role of enterprise master patient index in improving medical outcome and increasing healthcare services revenue. It involves key features such as reducing operational costs, accelerating revenue cycle and transitioning to value based care. Present like a pro with Incorporating HIS To Enhance Healthcare Services Enterprise Master Patient Index To Enhance Outcome Infographics PDF Create beautiful presentations together with your team, using our easy to use presentation slides. Share your ideas in real time and make changes on the fly by downloading our templates. So whether you are in the office, on the go, or in a remote location, you can stay in sync with your team and present your ideas with confidence. With Slidegeeks presentation got a whole lot easier. Grab these presentations today.
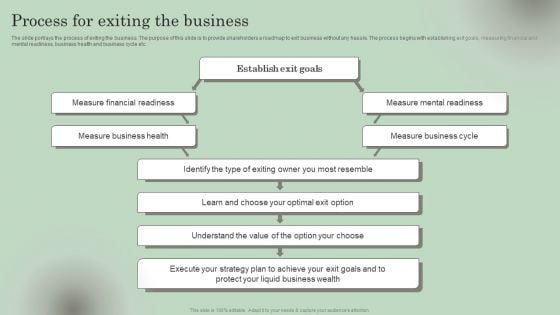
Process For Exiting The Business Inspiration PDF
The slide portrays the process of exiting the business. The purpose of this slide is to provide shareholders a roadmap to exit business without any hassle. The process begins with establishing exit goals, measuring financial and mental readiness, business health and business cycle etc. Retrieve professionally designed Process For Exiting The Business Inspiration PDF to effectively convey your message and captivate your listeners. Save time by selecting pre-made slideshows that are appropriate for various topics, from business to educational purposes. These themes come in many different styles, from creative to corporate, and all of them are easily adjustable and can be edited quickly. Access them as PowerPoint templates or as Google Slides themes. You do not have to go on a hunt for the perfect presentation because Slidegeeks got you covered from everywhere.

Solutions To Procurement Purchase Orders And Supplier Background PDF
This slide provides an overview of the solutions to the procurement problems of a company. Major issues covered are supplier defect rate, procurement ROI, purchase order cycle time and accuracy. Are you in need of a template that can accommodate all of your creative concepts This one is crafted professionally and can be altered to fit any style. Use it with Google Slides or PowerPoint. Include striking photographs, symbols, depictions, and other visuals. Fill, move around, or remove text boxes as desired. Test out color palettes and font mixtures. Edit and save your work, or work with colleagues. Download Solutions To Procurement Purchase Orders And Supplier Background PDF and observe how to make your presentation outstanding. Give an impeccable presentation to your group and make your presentation unforgettable.
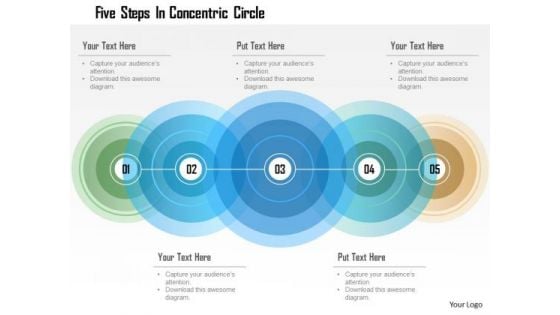
Business Diagram Five Steps In Concentric Circle Presentation Template
Five staged colorful circular text boxes in linear flow has been used to design this power point template. This PPT contains the concept of data representation. Use this PPT for your data related topics in any business or sales presentation.
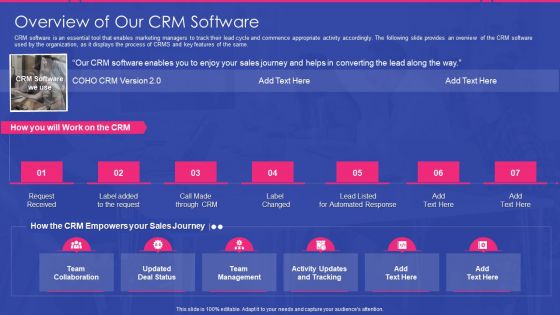
Sales Development Representative Playbook Overview Of Our CRM Software Ppt Gallery Shapes PDF
CRM software is an essential tool that enables marketing managers to track their lead cycle and commence appropriate activity accordingly. The following slide provides an overview of the CRM software used by the organization, as it displays the process of CRMS and key features of the same. This is a sales development representative playbook overview of our crm software ppt gallery shapes pdf template with various stages. Focus and dispense information on seven stages using this creative set, that comes with editable features. It contains large content boxes to add your information on topics like collaboration updated, deal status, team management, activity updates and tracking. You can also showcase facts, figures, and other relevant content using this PPT layout. Grab it now.
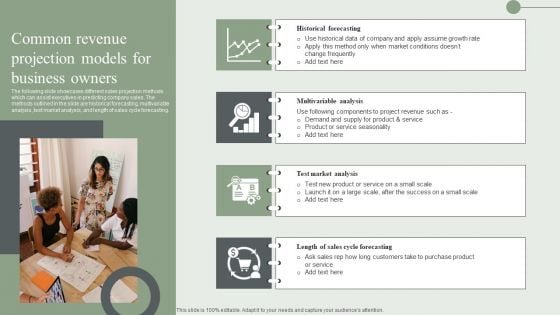
Common Revenue Projection Models For Business Owners Ppt PowerPoint Presentation File Slides PDF
The following slide showcases different sales projection methods which can assist executives in predicting company sales. The methods outlined in the slide are historical forecasting, multivariable analysis, test market analysis, and length of sales cycle forecasting. Here you can discover an assortment of the finest PowerPoint and Google Slides templates. With these templates, you can create presentations for a variety of purposes while simultaneously providing your audience with an eye catching visual experience. Download Common Revenue Projection Models For Business Owners Ppt PowerPoint Presentation File Slides PDF to deliver an impeccable presentation. These templates will make your job of preparing presentations much quicker, yet still, maintain a high level of quality. Slidegeeks has experienced researchers who prepare these templates and write high quality content for you. Later on, you can personalize the content by editing the Common Revenue Projection Models For Business Owners Ppt PowerPoint Presentation File Slides PDF.
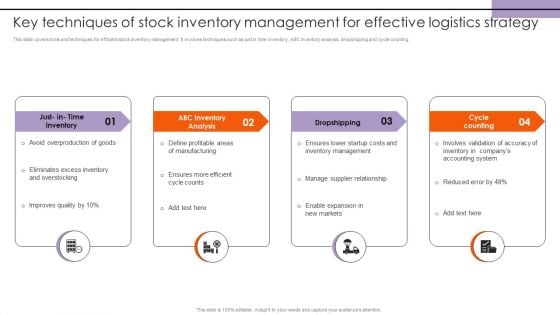
Key Techniques Of Stock Inventory Management For Effective Logistics Strategy Introduction PDF
This slide covers tools and techniques for efficient stock inventory management. It involves techniques such as just in time inventory, ABC inventory analysis, dropshipping and cycle counting. Here you can discover an assortment of the finest PowerPoint and Google Slides templates. With these templates, you can create presentations for a variety of purposes while simultaneously providing your audience with an eye-catching visual experience. Download Key Techniques Of Stock Inventory Management For Effective Logistics Strategy Introduction PDF to deliver an impeccable presentation. These templates will make your job of preparing presentations much quicker, yet still, maintain a high level of quality. Slidegeeks has experienced researchers who prepare these templates and write high-quality content for you. Later on, you can personalize the content by editing the Key Techniques Of Stock Inventory Management For Effective Logistics Strategy Introduction PDF.
Sales Opportunity Tracking And Management Ppt Slides
This is a sales opportunity tracking and management ppt slides. This is a eight stage process. The stages in this process are organization data determination, territory determination, data management, text determination, content management, status management, pricing, partner determination, sales transactions.
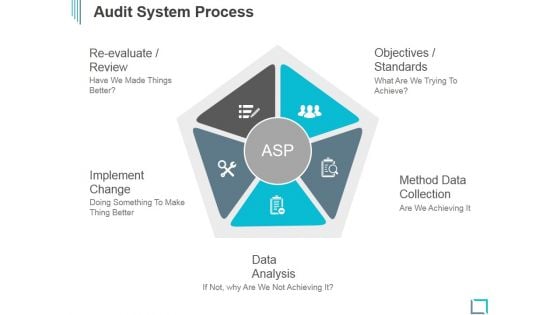
Audit System Process Ppt PowerPoint Presentation Good
This is a audit system process ppt powerpoint presentation good. This is a five stage process. The stages in this process are re evaluate review, objectives standards, implement change, method data collection, data analysis.
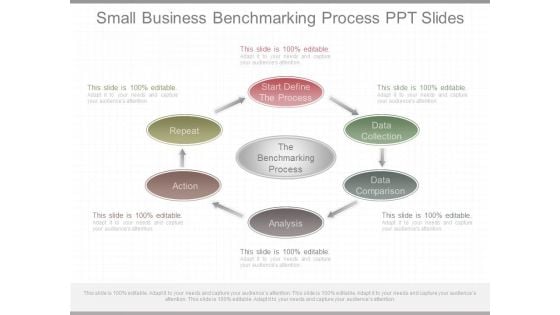
Small Business Benchmarking Process Ppt Slides
This is a small business benchmarking process ppt slides. This is a six stage process. The stages in this process are the benchmarking process, start define the process, data collection, data comparison, analysis, action, repeat.
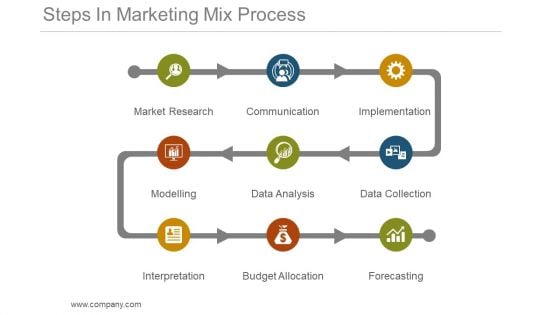
Steps In Marketing Mix Process Powerpoint Slide Deck
This is a steps in marketing mix process powerpoint slide deck. This is a nine stage process. The stages in this process are market research, communication, implementation, data collection, data analysis, modelling, interpretation, budget allocation, forecasting.
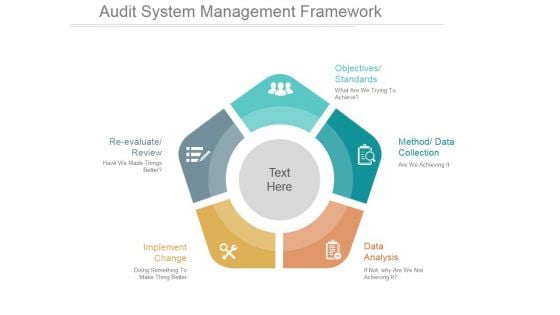
Audit System Management Framework Good Ppt PowerPoint Presentation Microsoft
This is a audit system management framework good ppt powerpoint presentation microsoft. This is a five stage process. The stages in this process are objectives standards, method data collection, data analysis, implement change, re evaluate review.
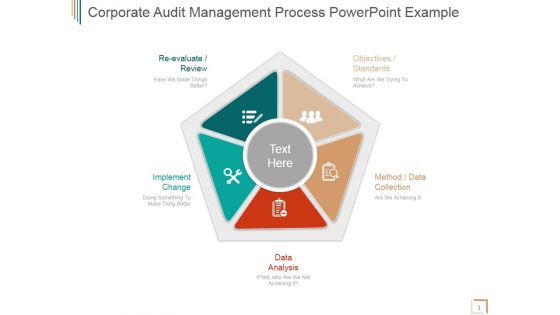
Corporate Audit Management Process Ppt PowerPoint Presentation Summary
This is a corporate audit management process ppt powerpoint presentation summary. This is a five stage process. The stages in this process are re evaluate review, objectives standards, method data collection, data analysis, implement change.
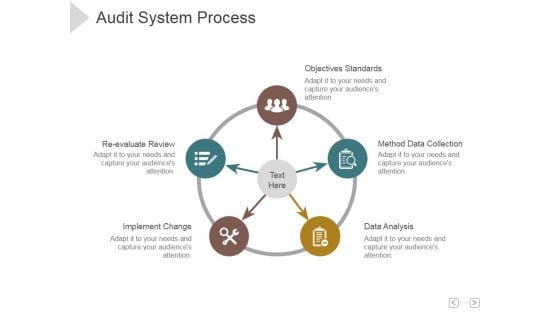
Audit System Process Ppt PowerPoint Presentation Styles
This is a audit system process ppt powerpoint presentation styles. This is a five stage process. The stages in this process are method data collection, data analysis, objectives standards, reevaluate review, implement change.
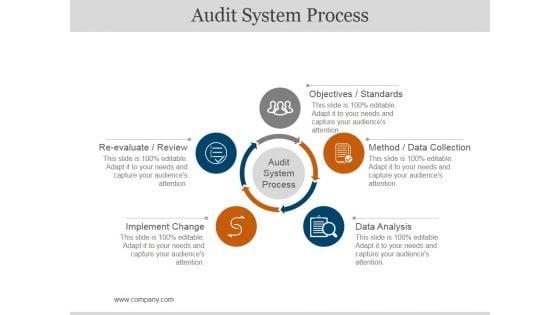
Audit System Process Ppt PowerPoint Presentation Professional
This is a audit system process ppt powerpoint presentation professional. This is a five stage process. The stages in this process are objectives standards, method data collection, data analysis, implement change, re evaluate review.
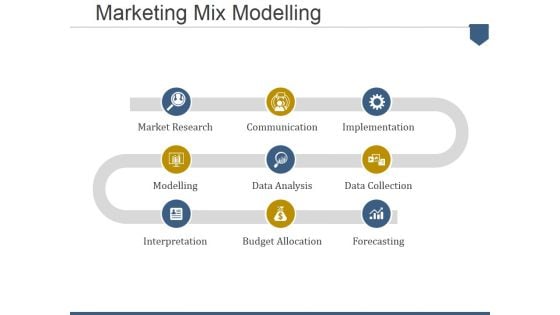
Marketing Mix Modelling Ppt PowerPoint Presentation Portfolio Graphics Template
This is a marketing mix modelling ppt powerpoint presentation portfolio graphics template. This is a three stage process. The stages in this process are market research, communication, implementation, data collection, forecasting, budget allocation, data analysis, modelling, interpretation.
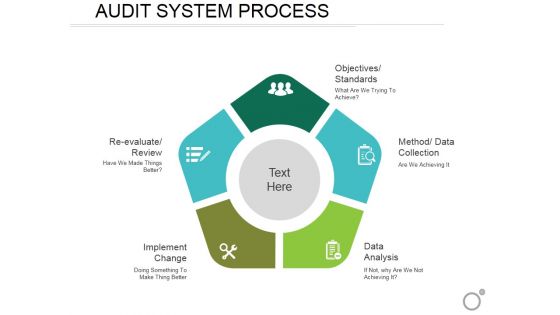
Audit System Process Ppt PowerPoint Presentation Inspiration Graphics Design
This is a audit system process ppt powerpoint presentation inspiration graphics design. This is a five stage process. The stages in this process are objectives standards, method data collection, data analysis, implement change, re evaluate review.
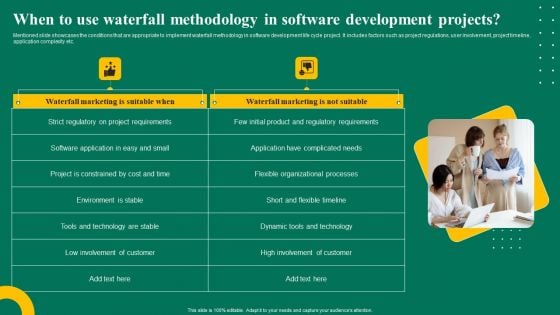
When To Use Waterfall Methodology In Software Development Projects Ppt Outline Slide Portrait PDF
Mentioned slide showcases the conditions that are appropriate to implement waterfall methodology in software development life cycle project. It includes factors such as project regulations, user involvement, project timeline, application complexity etc. Explore a selection of the finest When To Use Waterfall Methodology In Software Development Projects Ppt Outline Slide Portrait PDF here. With a plethora of professionally designed and pre made slide templates, you can quickly and easily find the right one for your upcoming presentation. You can use our When To Use Waterfall Methodology In Software Development Projects Ppt Outline Slide Portrait PDF to effectively convey your message to a wider audience. Slidegeeks has done a lot of research before preparing these presentation templates. The content can be personalized and the slides are highly editable. Grab templates today from Slidegeeks.
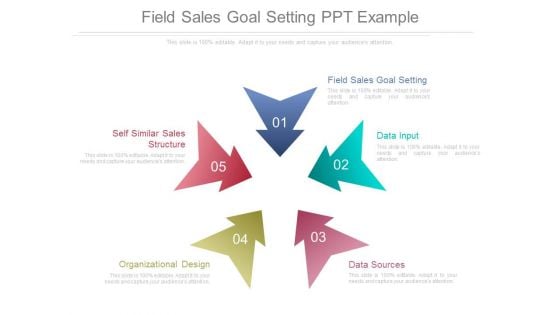
Field Sales Goal Setting Ppt Example
This is a field sales goal setting ppt example. This is a five stage process. The stages in this process are field sales goal setting, data input, data sources, organizational design, self similar sales structure.

Consumer Insight Capabilities Ppt PowerPoint Presentation Styles Example Introduction
This is a consumer insight capabilities ppt powerpoint presentation styles example introduction. This is a six stage process. The stages in this process are insight services, data science services, data management services, research services.
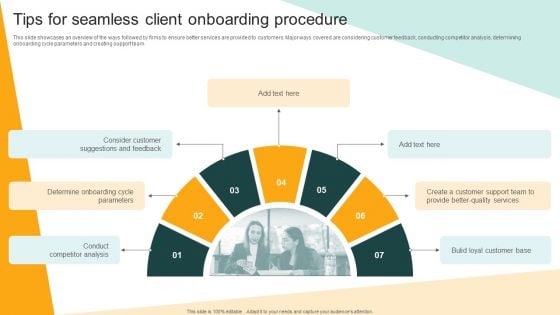
Client Onboarding Plan Tips For Seamless Client Onboarding Procedure Topics PDF
This slide showcases an overview of the ways followed by firms to ensure better services are provided to customers. Major ways covered are considering customer feedback, conducting competitor analysis, determining onboarding cycle parameters and creating support team. Find highly impressive Client Onboarding Plan Tips For Seamless Client Onboarding Procedure Topics PDF on Slidegeeks to deliver a meaningful presentation. You can save an ample amount of time using these presentation templates. No need to worry to prepare everything from scratch because Slidegeeks experts have already done a huge research and work for you. You need to download Client Onboarding Plan Tips For Seamless Client Onboarding Procedure Topics PDF for your upcoming presentation. All the presentation templates are 100 percent editable and you can change the color and personalize the content accordingly. Download now
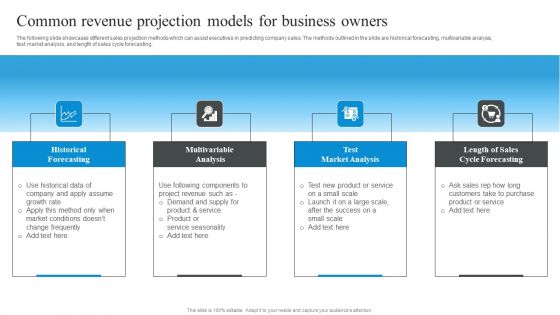
Market Evaluation Of IT Industry Common Revenue Projection Models For Business Owners Mockup PDF
The following slide showcases different sales projection methods which can assist executives in predicting company sales. The methods outlined in the slide are historical forecasting, multivariable analysis, test market analysis, and length of sales cycle forecasting. Do you have to make sure that everyone on your team knows about any specific topic I yes, then you should give Market Evaluation Of IT Industry Common Revenue Projection Models For Business Owners Mockup PDF a try. Our experts have put a lot of knowledge and effort into creating this impeccable Market Evaluation Of IT Industry Common Revenue Projection Models For Business Owners Mockup PDF. You can use this template for your upcoming presentations, as the slides are perfect to represent even the tiniest detail. You can download these templates from the Slidegeeks website and these are easy to edit. So grab these today.
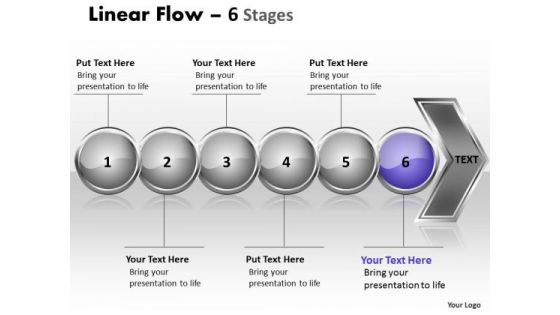
Business Ppt Theme Continual Illustration Graphical Of 6 Issues 7
We present our Business PPT Theme continual illustration Graphical of 6 issues 7.Use our Spheres PowerPoint Templates because, Cycle Template: - Rolling along while gathering profits along the way is the aim. Use our Symbol PowerPoint Templates because, Many a core idea has various enveloping layers. Use our Arrows PowerPoint Templates because, Timelines Template: - Getting it done may not be enough. Use our Metaphor PowerPoint Templates because, But it cannot be gained to desired levels in one go. Use our Business PowerPoint Templates because, Marketing Strategy Business Template:- Maximizing sales of your product is the intended destination. Use these PowerPoint slides for presentations relating to Arrow, Background, Business, Chart, Diagram, Financial, Flow, Graphic, Gray, Icon, Illustration, Linear, Management, Orange, Perspective, Process, Reflection, Spheres, Stage, Text. The prominent colors used in the PowerPoint template are Purple, Gray, and Black Your team will get faithfully behind you. Assume control with our Business Ppt Theme Continual Illustration Graphical Of 6 Issues 7.
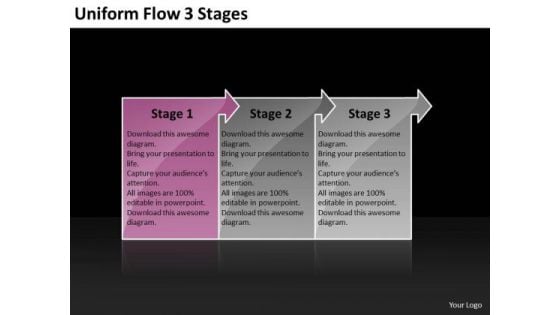
Uniform Flow 3 Stages Technical Chart PowerPoint Templates
We present our uniform flow 3 stages technical chart PowerPoint templates. Use our Arrows PowerPoint Templates because, Set out the goals and your plan of action for them. Use our Symbol PowerPoint Templates because, Business Template:- There is a vision, a need you can meet. Use our Business PowerPoint Templates because, Amplify on your plans to have dedicated sub groups working on related but distinct tasks. Use our Metaphor PowerPoint Templates because, Readymade PowerPoint templates for slides to show. Use our Process and Flows PowerPoint Templates because, Cycle Template: - Rolling along while gathering profits along the way is the aim. Use these PowerPoint slides for presentations relating to Reinforcing, Arrow, Background, Business, Chart, Diagram, Financial, Graphic, Gray, Icon, Illustration, Management, Orange, Perspective, Planning, Process, Stages, Steps, Text. The prominent colors used in the PowerPoint template are Pink, Gray, and Black Give an exhaustive account with our Uniform Flow 3 Stages Technical Chart PowerPoint Templates. Your thoughts will illuminate every little detail.
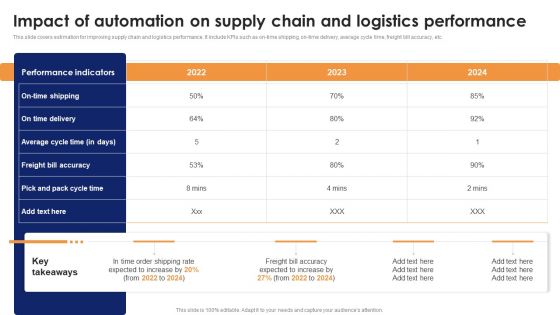
Impact Of Automation On Supply Chain And Logistics Performance Themes PDF
This slide covers estimation for improving supply chain and logistics performance. It include KPIs such as on-time shipping, on-time delivery, average cycle time, freight bill accuracy, etc. Are you in need of a template that can accommodate all of your creative concepts This one is crafted professionally and can be altered to fit any style. Use it with Google Slides or PowerPoint. Include striking photographs, symbols, depictions, and other visuals. Fill, move around, or remove text boxes as desired. Test out color palettes and font mixtures. Edit and save your work, or work with colleagues. Download Impact Of Automation On Supply Chain And Logistics Performance Themes PDF and observe how to make your presentation outstanding. Give an impeccable presentation to your group and make your presentation unforgettable.
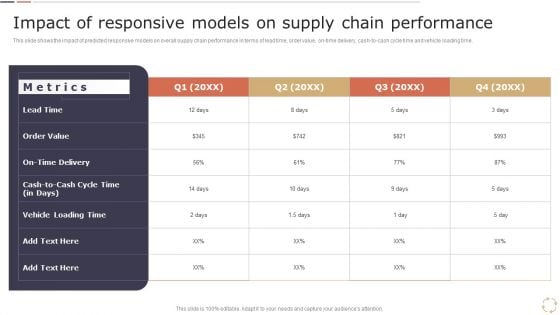
Impact Of Responsive Models On Supply Chain Performance Template PDF
This slide shows the impact of predicted responsive models on overall supply chain performance in terms of lead time, order value, on-time delivery, cash-to-cash cycle time and vehicle loading time. If you are looking for a format to display your unique thoughts, then the professionally designed Impact Of Responsive Models On Supply Chain Performance Template PDF is the one for you. You can use it as a Google Slides template or a PowerPoint template. Incorporate impressive visuals, symbols, images, and other charts. Modify or reorganize the text boxes as you desire. Experiment with shade schemes and font pairings. Alter, share or cooperate with other people on your work. Download Impact Of Responsive Models On Supply Chain Performance Template PDF and find out how to give a successful presentation. Present a perfect display to your team and make your presentation unforgettable.
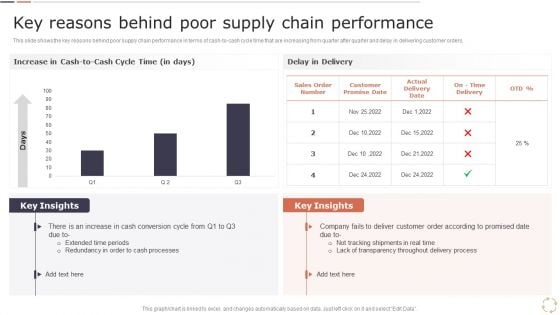
Key Reasons Behind Poor Supply Chain Performance Download PDF
This slide shows the key reasons behind poor supply chain performance in terms of cash to cash cycle time that are increasing from quarter after quarter and delay in delivering customer orders. Are you in need of a template that can accommodate all of your creative concepts This one is crafted professionally and can be altered to fit any style. Use it with Google Slides or PowerPoint. Include striking photographs, symbols, depictions, and other visuals. Fill, move around, or remove text boxes as desired. Test out color palettes and font mixtures. Edit and save your work, or work with colleagues. Download Key Reasons Behind Poor Supply Chain Performance Download PDF and observe how to make your presentation outstanding. Give an impeccable presentation to your group and make your presentation unforgettable.
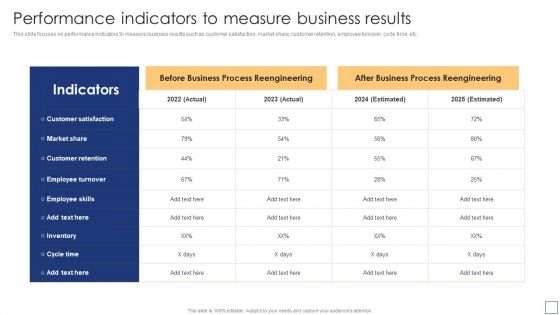
Business Process Redesigning Performance Indicators To Measure Business Results Summary PDF
This slide focuses on performance indicators to measure business results such as customer satisfaction, market share, customer retention, employee turnover, cycle time, etc. Are you in need of a template that can accommodate all of your creative concepts This one is crafted professionally and can be altered to fit any style. Use it with Google Slides or PowerPoint. Include striking photographs, symbols, depictions, and other visuals. Fill, move around, or remove text boxes as desired. Test out color palettes and font mixtures. Edit and save your work, or work with colleagues. Download Business Process Redesigning Performance Indicators To Measure Business Results Summary PDF and observe how to make your presentation outstanding. Give an impeccable presentation to your group and make your presentation unforgettable.

Business Restructuring Process Performance Indicators To Measure Business Results Slides PDF
This slide focuses on performance indicators to measure business results such as customer satisfaction, market share, customer retention, employee turnover, cycle time, etc. Are you in need of a template that can accommodate all of your creative concepts This one is crafted professionally and can be altered to fit any style. Use it with Google Slides or PowerPoint. Include striking photographs, symbols, depictions, and other visuals. Fill, move around, or remove text boxes as desired. Test out color palettes and font mixtures. Edit and save your work, or work with colleagues. Download Business Restructuring Process Performance Indicators To Measure Business Results Slides PDF and observe how to make your presentation outstanding. Give an impeccable presentation to your group and make your presentation unforgettable.
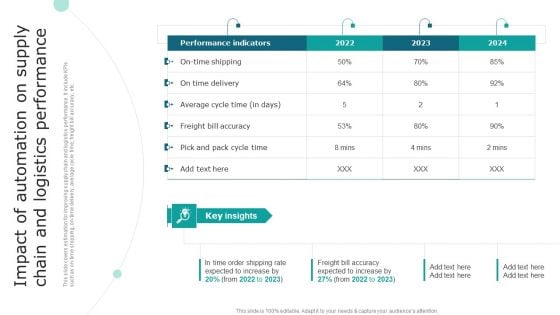
Impact Of Automation On Supply Chain And Logistics Performance Clipart PDF
This slide covers estimation for improving supply chain and logistics performance. It include KPIs such as on-time shipping, on-time delivery, average cycle time, freight bill accuracy, etc. If you are looking for a format to display your unique thoughts, then the professionally designed Impact Of Automation On Supply Chain And Logistics Performance Clipart PDF is the one for you. You can use it as a Google Slides template or a PowerPoint template. Incorporate impressive visuals, symbols, images, and other charts. Modify or reorganize the text boxes as you desire. Experiment with shade schemes and font pairings. Alter, share or cooperate with other people on your work. Download Impact Of Automation On Supply Chain And Logistics Performance Clipart PDF and find out how to give a successful presentation. Present a perfect display to your team and make your presentation unforgettable.
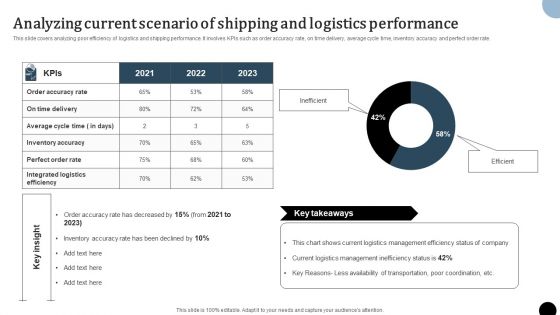
Strategy To Enhance Supply Chain Operations Analyzing Current Scenario Of Shipping And Logistics Mockup PDF
This slide covers analyzing poor efficiency of logistics and shipping performance. It involves KPIs such as order accuracy rate, on time delivery, average cycle time, inventory accuracy and perfect order rate. Are you in need of a template that can accommodate all of your creative concepts This one is crafted professionally and can be altered to fit any style. Use it with Google Slides or PowerPoint. Include striking photographs, symbols, depictions, and other visuals. Fill, move around, or remove text boxes as desired. Test out color palettes and font mixtures. Edit and save your work, or work with colleagues. Download Strategy To Enhance Supply Chain Operations Analyzing Current Scenario Of Shipping And Logistics Mockup PDF and observe how to make your presentation outstanding. Give an impeccable presentation to your group and make your presentation unforgettable.
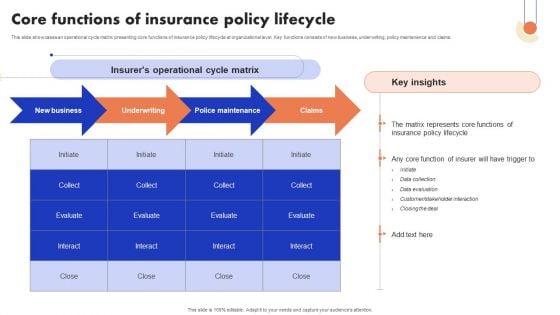
Implementation Of Digital Advancement Techniques Core Functions Of Insurance Policy Introduction PDF
This slide showcases an operational cycle matrix presenting core functions of insurance policy lifecycle at organizational level. Key functions consists of new business, underwriting, policy maintenance and claims. Are you in need of a template that can accommodate all of your creative concepts This one is crafted professionally and can be altered to fit any style. Use it with Google Slides or PowerPoint. Include striking photographs, symbols, depictions, and other visuals. Fill, move around, or remove text boxes as desired. Test out color palettes and font mixtures. Edit and save your work, or work with colleagues. Download Implementation Of Digital Advancement Techniques Core Functions Of Insurance Policy Introduction PDF and observe how to make your presentation outstanding. Give an impeccable presentation to your group and make your presentation unforgettable.

CRM Pipeline Administration Determine Essential Pipeline Metrics Ppt Infographics Show PDF
This slide provides information regarding the essential pipeline metrics such as opportunity dollar size vs. average won deal size, opportunity age vs. win cycle and win rate. Find highly impressive CRM Pipeline Administration Determine Essential Pipeline Metrics Ppt Infographics Show PDF on Slidegeeks to deliver a meaningful presentation. You can save an ample amount of time using these presentation templates. No need to worry to prepare everything from scratch because Slidegeeks experts have already done a huge research and work for you. You need to download CRM Pipeline Administration Determine Essential Pipeline Metrics Ppt Infographics Show PDF for your upcoming presentation. All the presentation templates are 100 percent editable and you can change the color and personalize the content accordingly. Download now.
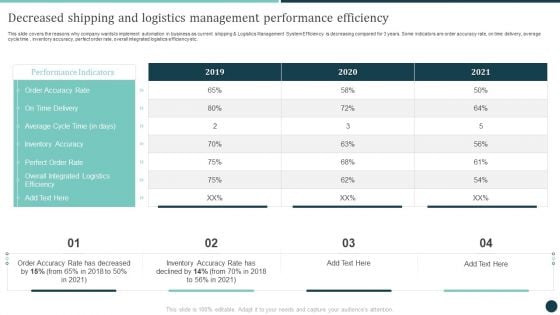
Decreased Shipping And Logistics Management Performance Efficiency Logistics Portrait PDF
This slide covers the reasons why company wants to implement automation in business as current shipping and Logistics Management System Efficiency is decreasing compared for 3 years. Some indicators are order accuracy rate, on time delivery, average cycle time , inventory accuracy, perfect order rate, overall integrated logistics efficiency etc. Here you can discover an assortment of the finest PowerPoint and Google Slides templates. With these templates, you can create presentations for a variety of purposes while simultaneously providing your audience with an eye catching visual experience. Download Decreased Shipping And Logistics Management Performance Efficiency Logistics Portrait PDF to deliver an impeccable presentation. These templates will make your job of preparing presentations much quicker, yet still, maintain a high level of quality. Slidegeeks has experienced researchers who prepare these templates and write high quality content for you. Later on, you can personalize the content by editing the Decreased Shipping And Logistics Management Performance Efficiency Logistics Portrait PDF.
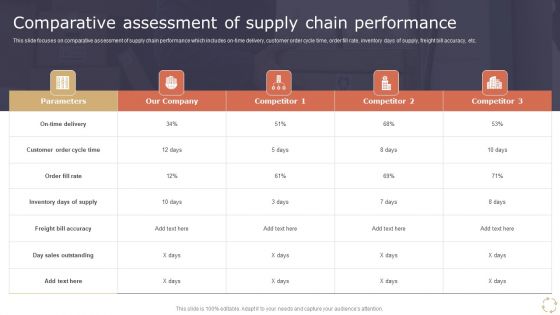
Optimizing Logistics Models To Enhance Supply Chain Management Comparative Assessment Of Supply Chain Performance Clipart PDF
This slide focuses on comparative assessment of supply chain performance which includes on-time delivery, customer order cycle time, order fill rate, inventory days of supply, freight bill accuracy, etc. Formulating a presentation can take up a lot of effort and time, so the content and message should always be the primary focus. The visuals of the PowerPoint can enhance the presenters message, so our Optimizing Logistics Models To Enhance Supply Chain Management Comparative Assessment Of Supply Chain Performance Clipart PDF was created to help save time. Instead of worrying about the design, the presenter can concentrate on the message while our designers work on creating the ideal templates for whatever situation is needed. Slidegeeks has experts for everything from amazing designs to valuable content, we have put everything into Optimizing Logistics Models To Enhance Supply Chain Management Comparative Assessment Of Supply Chain Performance Clipart PDF.
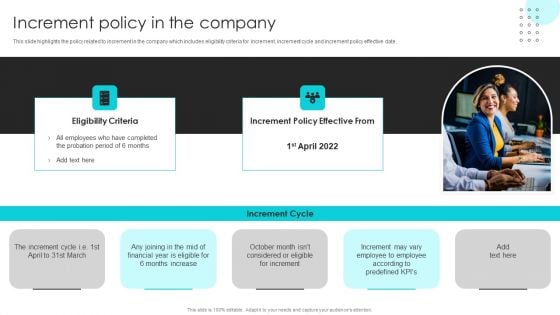
Company Rules And Regulations Manual Increment Policy In The Company Guidelines PDF
This slide highlights the policy related to increment in the company which includes eligibility criteria for increment, increment cycle and increment policy effective date. Formulating a presentation can take up a lot of effort and time, so the content and message should always be the primary focus. The visuals of the PowerPoint can enhance the presenters message, so our Company Rules And Regulations Manual Increment Policy In The Company Guidelines PDF was created to help save time. Instead of worrying about the design, the presenter can concentrate on the message while our designers work on creating the ideal templates for whatever situation is needed. Slidegeeks has experts for everything from amazing designs to valuable content, we have put everything into Company Rules And Regulations Manual Increment Policy In The Company Guidelines PDF
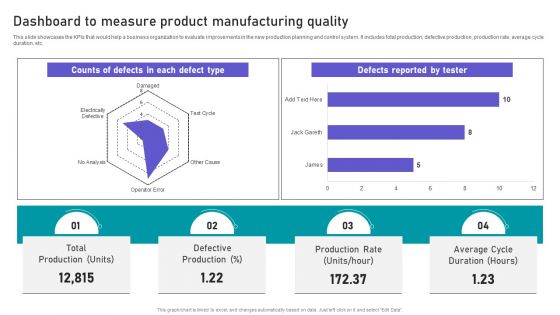
Effective Manufacturing Planning And Control Administration System Dashboard To Measure Product Pictures PDF
This slide showcases the KPIs that would help a business organization to evaluate improvements in the new production planning and control system. It includes total production, defective production, production rate, average cycle duration, etc. Here you can discover an assortment of the finest PowerPoint and Google Slides templates. With these templates, you can create presentations for a variety of purposes while simultaneously providing your audience with an eye-catching visual experience. Download Effective Manufacturing Planning And Control Administration System Dashboard To Measure Product Pictures PDF to deliver an impeccable presentation. These templates will make your job of preparing presentations much quicker, yet still, maintain a high level of quality. Slidegeeks has experienced researchers who prepare these templates and write high-quality content for you. Later on, you can personalize the content by editing the Effective Manufacturing Planning And Control Administration System Dashboard To Measure Product Pictures PDF.
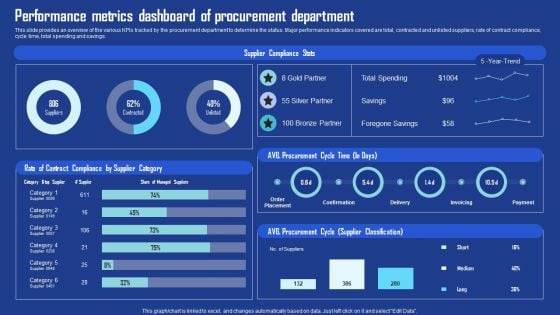
Performance Metrics Dashboard Of Procurement Department Download PDF
This slide provides an overview of the various KPIs tracked by the procurement department to determine the status. Major performance indicators covered are total, contracted and unlisted suppliers, rate of contract compliance, cycle time, total spending and savings. Slidegeeks has constructed Performance Metrics Dashboard Of Procurement Department Download PDF after conducting extensive research and examination. These presentation templates are constantly being generated and modified based on user preferences and critiques from editors. Here, you will find the most attractive templates for a range of purposes while taking into account ratings and remarks from users regarding the content. This is an excellent jumping off point to explore our content and will give new users an insight into our top notch PowerPoint Templates.
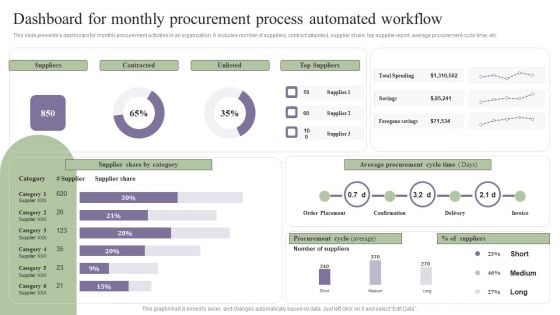
Deployment Of Process Automation To Increase Organisational Performance Dashboard For Monthly Graphics PDF
This slide presents a dashboard for monthly procurement activities in an organization. It includes number of suppliers, contract attainted, supplier share, top supplier report, average procurement cycle time, etc. Here you can discover an assortment of the finest PowerPoint and Google Slides templates. With these templates, you can create presentations for a variety of purposes while simultaneously providing your audience with an eye catching visual experience. Download Deployment Of Process Automation To Increase Organisational Performance Dashboard For Monthly Graphics PDF to deliver an impeccable presentation. These templates will make your job of preparing presentations much quicker, yet still, maintain a high level of quality. Slidegeeks has experienced researchers who prepare these templates and write high quality content for you. Later on, you can personalize the content by editing the Deployment Of Process Automation To Increase Organisational Performance Dashboard For Monthly Graphics PDF.
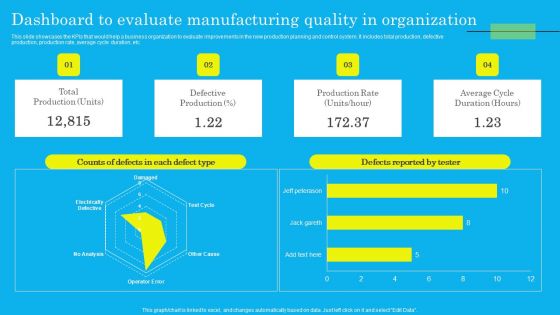
Dashboard To Evaluate Manufacturing Quality In Organization Elements PDF
This slide showcases the KPIs that would help a business organization to evaluate improvements in the new production planning and control system. It includes total production, defective production, production rate, average cycle duration, etc. Here you can discover an assortment of the finest PowerPoint and Google Slides templates. With these templates, you can create presentations for a variety of purposes while simultaneously providing your audience with an eye catching visual experience. Download Dashboard To Evaluate Manufacturing Quality In Organization Elements PDF to deliver an impeccable presentation. These templates will make your job of preparing presentations much quicker, yet still, maintain a high level of quality. Slidegeeks has experienced researchers who prepare these templates and write high quality content for you. Later on, you can personalize the content by editing the Dashboard To Evaluate Manufacturing Quality In Organization Elements PDF.
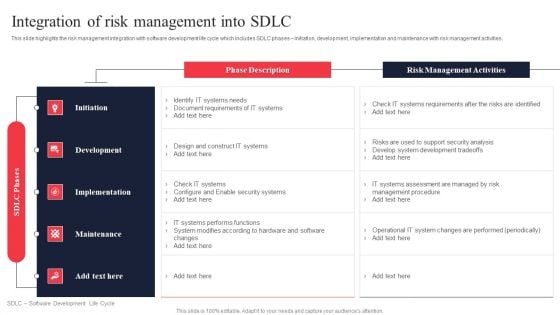
IT System Risk Management Guide Integration Of Risk Management Into SDLC Professional PDF
This slide highlights the risk management integration with software development life cycle which includes SDLC phases Initiation, development, implementation and maintenance with risk management activities. Find highly impressive IT System Risk Management Guide Integration Of Risk Management Into SDLC Professional PDF on Slidegeeks to deliver a meaningful presentation. You can save an ample amount of time using these presentation templates. No need to worry to prepare everything from scratch because Slidegeeks experts have already done a huge research and work for you. You need to download IT System Risk Management Guide Integration Of Risk Management Into SDLC Professional PDF for your upcoming presentation. All the presentation templates are 100 percent editable and you can change the color and personalize the content accordingly. Download now.

Workplace Facility Management Services Company Facility Management Services Global Market Scenario Diagrams PDF
This slide highlights the facility management services market share and future growth rate in graphical format which showcases product life cycle of different countries and organized and unorganized sector future growth rate. Explore a selection of the finest Workplace Facility Management Services Company Facility Management Services Global Market Scenario Diagrams PDF here. With a plethora of professionally designed and pre made slide templates, you can quickly and easily find the right one for your upcoming presentation. You can use our Workplace Facility Management Services Company Facility Management Services Global Market Scenario Diagrams PDF to effectively convey your message to a wider audience. Slidegeeks has done a lot of research before preparing these presentation templates. The content can be personalized and the slides are highly editable. Grab templates today from Slidegeeks.
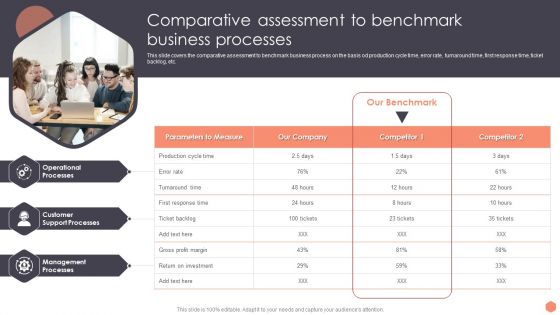
Business Optimization Techniques Comparative Assessment To Benchmark Business Processes Diagrams PDF
This slide covers the comparative assessment to benchmark business process on the basis od production cycle time, error rate, turnaround time, first response time, ticket backlog, etc.Find highly impressive Business Optimization Techniques Comparative Assessment To Benchmark Business Processes Diagrams PDF on Slidegeeks to deliver a meaningful presentation. You can save an ample amount of time using these presentation templates. No need to worry to prepare everything from scratch because Slidegeeks experts have already done a huge research and work for you. You need to download Business Optimization Techniques Comparative Assessment To Benchmark Business Processes Diagrams PDF for your upcoming presentation. All the presentation templates are 100 Precent editable and you can change the color and personalize the content accordingly. Download now.
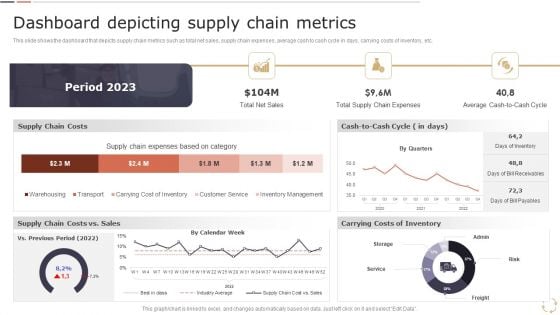
Optimizing Logistics Models To Enhance Supply Chain Management Dashboard Depicting Supply Chain Metrics Download PDF
This slide shows the dashboard that depicts supply chain metrics such as total net sales, supply chain expenses, average cash to cash cycle in days, carrying costs of inventory, etc. Coming up with a presentation necessitates that the majority of the effort goes into the content and the message you intend to convey. The visuals of a PowerPoint presentation can only be effective if it supplements and supports the story that is being told. Keeping this in mind our experts created Optimizing Logistics Models To Enhance Supply Chain Management Dashboard Depicting Supply Chain Metrics Download PDF to reduce the time that goes into designing the presentation. This way, you can concentrate on the message while our designers take care of providing you with the right template for the situation.
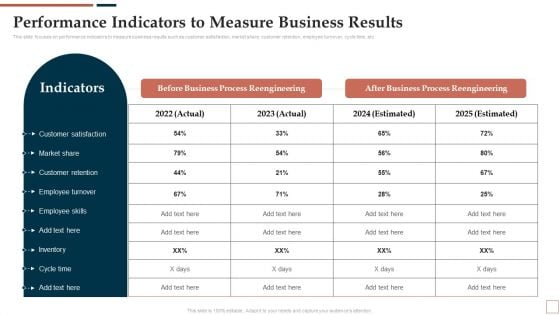
BPR To Develop Operational Effectiveness Performance Indicators To Measure Business Results Structure PDF
This slide focuses on performance indicators to measure business results such as customer satisfaction, market share, customer retention, employee turnover, cycle time, etc. Explore a selection of the finest BPR To Develop Operational Effectiveness Performance Indicators To Measure Business Results Structure PDF here. With a plethora of professionally designed and pre made slide templates, you can quickly and easily find the right one for your upcoming presentation. You can use our BPR To Develop Operational Effectiveness Performance Indicators To Measure Business Results Structure PDF to effectively convey your message to a wider audience. Slidegeeks has done a lot of research before preparing these presentation templates. The content can be personalized and the slides are highly editable. Grab templates today from Slidegeeks.
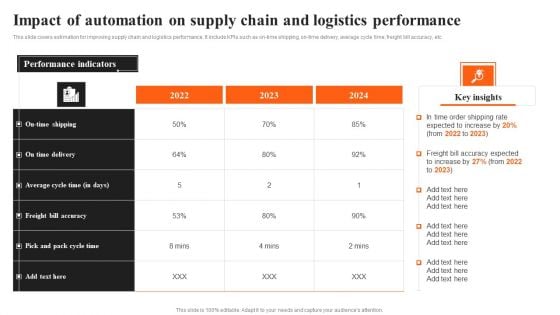
Integrating AI To Enhance Impact Of Automation On Supply Chain And Logistics Performance Slides PDF
This slide covers estimation for improving supply chain and logistics performance. It include KPIs such as on-time shipping, on-time delivery, average cycle time, freight bill accuracy, etc. Coming up with a presentation necessitates that the majority of the effort goes into the content and the message you intend to convey. The visuals of a PowerPoint presentation can only be effective if it supplements and supports the story that is being told. Keeping this in mind our experts created Integrating AI To Enhance Impact Of Automation On Supply Chain And Logistics Performance Slides PDF to reduce the time that goes into designing the presentation. This way, you can concentrate on the message while our designers take care of providing you with the right template for the situation.
Integration Automation Method To Estimate Organization Workflow Efficiency Icons PDF
This slide illustrates the method to calculate organizational workflow efficiency and provide the current workflow efficiency of organization. It includes total cycle time, value added time, wasted activity time etc. Coming up with a presentation necessitates that the majority of the effort goes into the content and the message you intend to convey. The visuals of a PowerPoint presentation can only be effective if it supplements and supports the story that is being told. Keeping this in mind our experts created Integration Automation Method To Estimate Organization Workflow Efficiency Icons PDF to reduce the time that goes into designing the presentation. This way, you can concentrate on the message while our designers take care of providing you with the right template for the situation.
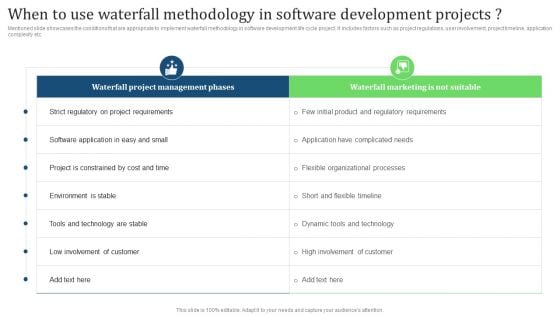
When To Use Waterfall Methodology In Software Development Projects Introduction PDF
Mentioned slide showcases the conditions that are appropriate to implement waterfall methodology in software development life cycle project. It includes factors such as project regulations, user involvement, project timeline, application complexity etc. Explore a selection of the finest When To Use Waterfall Methodology In Software Development Projects Introduction PDF here. With a plethora of professionally designed and pre-made slide templates, you can quickly and easily find the right one for your upcoming presentation. You can use our When To Use Waterfall Methodology In Software Development Projects Introduction PDF to effectively convey your message to a wider audience. Slidegeeks has done a lot of research before preparing these presentation templates. The content can be personalized and the slides are highly editable. Grab templates today from Slidegeeks.
Method To Estimate Organization Workflow Efficiency Ppt Pictures Icons PDF
This slide illustrates the method to calculate organizational workflow efficiency and provide the current workflow efficiency of organization. It includes total cycle time, value added time, wasted activity time etc. Explore a selection of the finest Method To Estimate Organization Workflow Efficiency Ppt Pictures Icons PDF here. With a plethora of professionally designed and pre made slide templates, you can quickly and easily find the right one for your upcoming presentation. You can use our Method To Estimate Organization Workflow Efficiency Ppt Pictures Icons PDF to effectively convey your message to a wider audience. Slidegeeks has done a lot of research before preparing these presentation templates. The content can be personalized and the slides are highly editable. Grab templates today from Slidegeeks.
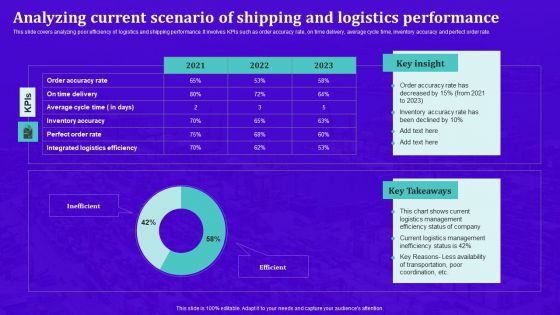
Techniques For Effective Supply Chain Management Analyzing Current Scenario Of Shipping Logistics Sample PDF
This slide covers analyzing poor efficiency of logistics and shipping performance. It involves KPIs such as order accuracy rate, on time delivery, average cycle time, inventory accuracy and perfect order rate. Coming up with a presentation necessitates that the majority of the effort goes into the content and the message you intend to convey. The visuals of a PowerPoint presentation can only be effective if it supplements and supports the story that is being told. Keeping this in mind our experts created Techniques For Effective Supply Chain Management Analyzing Current Scenario Of Shipping Logistics Sample PDF to reduce the time that goes into designing the presentation. This way, you can concentrate on the message while our designers take care of providing you with the right template for the situation.
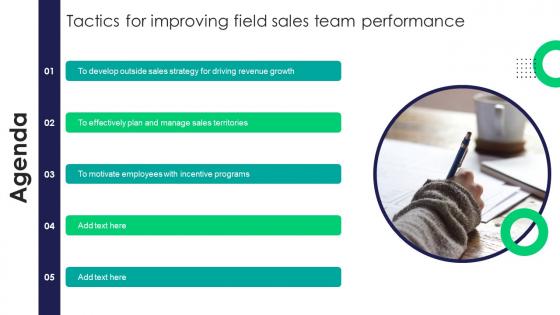
Agenda Tactics For Improving Field Sales Team Performance SA SS V
This slide showcases the impact of outside sales team with quarter-wise key performance indicators such as sales cycle length, cost per lead, win rate, etc. Boost your pitch with our creative Agenda Tactics For Improving Field Sales Team Performance SA SS V. Deliver an awe-inspiring pitch that will mesmerize everyone. Using these presentation templates you will surely catch everyones attention. You can browse the ppts collection on our website. We have researchers who are experts at creating the right content for the templates. So you do not have to invest time in any additional work. Just grab the template now and use them. Our Agenda Tactics For Improving Field Sales Team Performance SA SS V are topically designed to provide an attractive backdrop to any subject. Use them to look like a presentation pro.
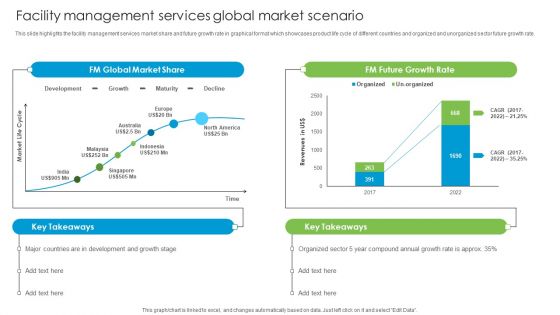
Facility Management Services Global Market Scenario Developing Tactical Fm Services Introduction PDF
This slide highlights the facility management services market share and future growth rate in graphical format which showcases product life cycle of different countries and organized and unorganized sector future growth rate.This Facility Management Services Global Market Scenario Developing Tactical Fm Services Introduction PDF from Slidegeeks makes it easy to present information on your topic with precision. It provides customization options, so you can make changes to the colors, design, graphics, or any other component to create a unique layout. It is also available for immediate download, so you can begin using it right away. Slidegeeks has done good research to ensure that you have everything you need to make your presentation stand out. Make a name out there for a brilliant performance.
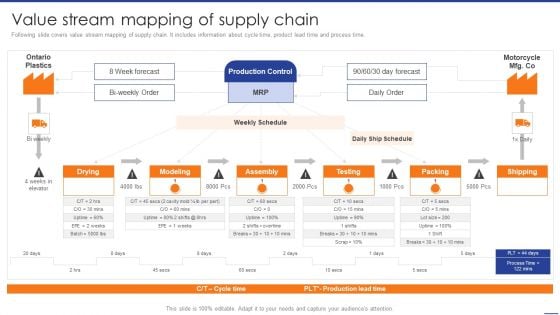
Digital Transformation Of Supply Value Stream Mapping Of Supply Chain Mockup PDF
Following slide covers value stream mapping of supply chain. It includes information about cycle time, product lead time and process time. Presenting this PowerPoint presentation, titled Digital Transformation Of Supply Value Stream Mapping Of Supply Chain Mockup PDF, with topics curated by our researchers after extensive research. This editable presentation is available for immediate download and provides attractive features when used. Download now and captivate your audience. Presenting this Digital Transformation Of Supply Value Stream Mapping Of Supply Chain Mockup PDF. Our researchers have carefully researched and created these slides with all aspects taken into consideration. This is a completely customizable Digital Transformation Of Supply Value Stream Mapping Of Supply Chain Mockup PDF that is available for immediate downloading. Download now and make an impact on your audience. Highlight the attractive features available with our PPTs.
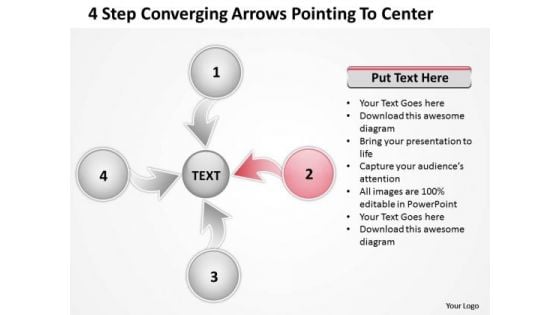
Converging Arrows Poiting To Center Relative Circular Process PowerPoint Template
We present our converging arrows poiting to center Relative Circular Process PowerPoint template.Present our Arrows PowerPoint Templates because you can expound on how you plan to gain their confidence and assure them of continued and consistent excellence in quality of service. Download our Process and Flows PowerPoint Templates because you can Show them the way, be Captain of the ship and lead them to new shores. Download and present our Flow Charts PowerPoint Templates because your listeners do not have to put on their thinking caps. Download and present our Circle Charts PowerPoint Templates because you can present your opinions in this field using our impressive templates. Download and present our Marketing PowerPoint Templates because networking is an imperative in todays world. You need to access the views of others. Similarly you need to give access to them of your abilities.Use these PowerPoint slides for presentations relating to Arrow, blue, business, chart,check, circle, concept, control, cycle,design, development, diagram, do,engineering, evaluate, flow, flowchart,flowchart, graphic, idea,infographic, iterative, lifecycle, lifecycle,management, marble, method, model, plandocheckact, process,quality, red, research, schema, software,spiral, step, strategy, success, system,. The prominent colors used in the PowerPoint template are Red, White, Gray. Use our converging arrows poiting to center Relative Circular Process PowerPoint template are designed by a team of presentation professionals. Professionals tell us our business PowerPoint templates and PPT Slides are Elegant. Customers tell us our converging arrows poiting to center Relative Circular Process PowerPoint template are Appealing. Presenters tell us our cycle PowerPoint templates and PPT Slides provide you with a vast range of viable options. Select the appropriate ones and just fill in your text. You can be sure our converging arrows poiting to center Relative Circular Process PowerPoint template are Dynamic. PowerPoint presentation experts tell us our concept PowerPoint templates and PPT Slides are Ritzy. Schedule meetings with our Converging Arrows Poiting To Center Relative Circular Process PowerPoint Template. Download without worries with our money back guaranteee.


 Continue with Email

 Home
Home


