Data Cycle
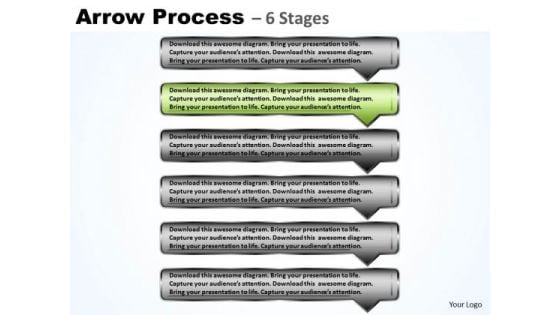
Marketing Ppt Theme Continuous Process Using 6 Rectangular Arrows 3 Design
We present our marketing PPT Theme continuous process using 6 rectangular arrows 3 design. Use our Symbol PowerPoint Templates because; educate your team and the attention you have paid. Use our Metaphor PowerPoint Templates because, the structure of our templates allows you to effectively highlight the key issues concerning the growth of your business. Use our Business PowerPoint Templates because, you have played a stellar role and have a few ideas. Use our Arrows PowerPoint Templates because, Business 3D Circular Puzzle:- Your business and plans for its growth consist of processes that are highly co-related. Use our Process and Flows PowerPoint Templates because, Cycle Template:- Rolling along while gathering profits along the way is the aim. Use these PowerPoint slides for presentations relating to Arrow, Background, Business, Chart, Diagram, Financial, Graphic, Gray, Icon, Illustration, Management, Orange, Perspective, Process, Reflection, Stage, Text, Transparency. The prominent colors used in the PowerPoint template are Green, Gray, and Black Your ideas are actually aspirational. Drive the ambition of your audience with our Marketing Ppt Theme Continuous Process Using 6 Rectangular Arrows 3 Design.
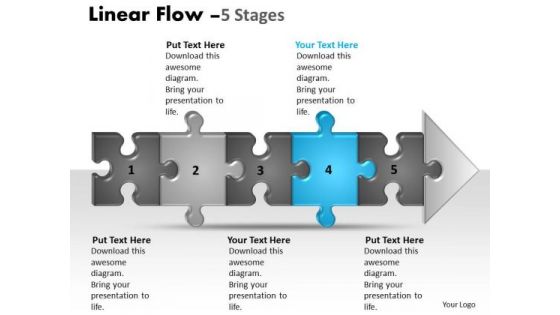
Flow Ppt Linear 5 Phase Diagram Style1 Time Management PowerPoint Design
We present our flow PPT Linear 5 phase diagram style1 time management PowerPoint design. Use our Puzzles or Jigsaws PowerPoint Templates because, Saves your time a prized possession, an ideal aid to give an ideal presentation. Use our Game Pieces PowerPoint Templates because; inform your team ofyour ideas using our illustrative slides. Use our Finance PowerPoint Templates because, they are indicators of the path you have in mind. Use our Shapes PowerPoint Templates because; demonstrate how they contribute to the larger melting pot. Use our Business PowerPoint Templates because, Cycle Template: - Rolling along while gathering profits along the way is the aim. Use these PowerPoint slides for presentations relating to abstract, algorithm, arrow, block diagram, business, chart, color, connection, design, development, diagram, direction, element, flow, graph, linear, linear diagram, management, organization, plan, process, section, segment, set, sign, solution, strategy, symbol, technology, vector. The prominent colors used in the PowerPoint template are Blue, Gray, and Black Help them discover new faith with our Flow Ppt Linear 5 Phase Diagram Style1 Time Management PowerPoint Design. Convert them to your line of thinking.
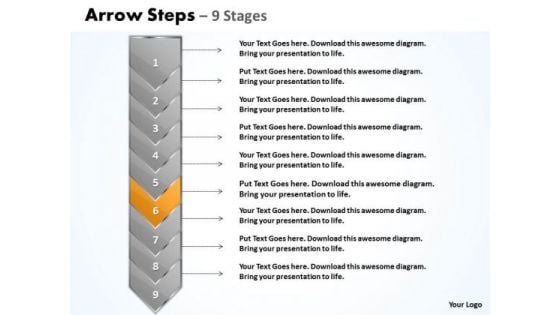
Sales Ppt Template Green And Orange Arrow 9 Stages Business Communication PowerPoint 7 Design
We present our sales PPT template green and orange arrow 9 stages business communication PowerPoint 7 design. Use our Symbol PowerPoint Templates because, they pinpoint the core values of your organization. Use our Metaphor PowerPoint Templates because, you understand the ailment and how to fight it. Use our Business PowerPoint Templates because, Cycle Template: - Rolling along while gathering profits along the way is the aim. Use our Arrows PowerPoint Templates because; Use our template to illustrate what you say. Use our Process and Flows PowerPoint Templates because, we offer you a range of options to garner their interest. Use these PowerPoint slides for presentations relating to 9, Stages, Arrow, Background, Business, Chart, Diagram, Financial, Graphic, Gray, Icon, Illustration, Management, Orange, Perspective, Process, Reflection, Steps, Text, Transparency. The prominent colors used in the PowerPoint template are Orange, Gray, and Black Demonstrate ability with our Sales Ppt Template Green And Orange Arrow 9 Stages Business Communication PowerPoint 7 Design. Download without worries with our money back guaranteee.
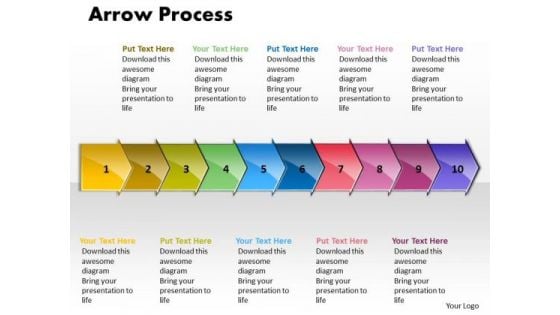
Sales Ppt Theme Arrow Process 10 States Diagram Business Communication PowerPoint Graphic
We present our sales PPT Theme arrow process 10 states diagram business communication PowerPoint Graphic. Use our Symbol PowerPoint Templates because, we offer you a range of options to garner their interest. Use our Metaphor PowerPoint Templates because; Help them align their arrows to consistently be accurate. Use our Business PowerPoint Templates because, Cycle Template: - Rolling along while gathering profits along the way is the aim. Use our Arrows PowerPoint Templates because, Inspired by the indelible Olympic logo this graphic exemplifies the benefits of teamwork. Use our Process and Flows PowerPoint Templates because, determine your targets and sequence them as per your priorities. Use these PowerPoint slides for presentations relating to Arrow, Background, Business, Chart, Diagram, Financial, Graphic, Gray, Icon, Illustration, Management, Orange, Perspective, Process, Reflection, Spheres, Stage, Text, Transparency. The prominent colors used in the PowerPoint template are Brown, Yellow, and Green With our Sales Ppt Theme Arrow Process 10 States Diagram Business Communication PowerPoint Graphic your plans will never fall apart. They assist in maintaining close control.
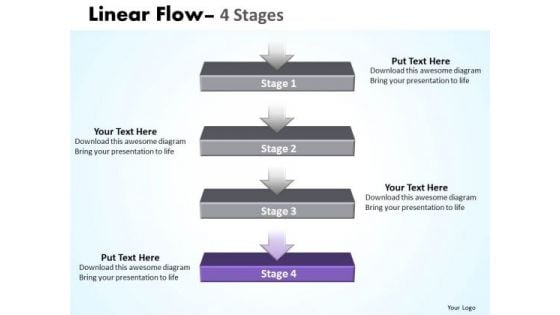
Success Ppt Template Linear Flow 4 Stages Business Communication PowerPoint 5 Image
We present our success PPT template linear flow 4 stages business communication Powerpoint 5 Image. Use our Arrows PowerPoint Templates because, Cycle Template:- Rolling along while gathering profits along the way is the aim. Use our Layers PowerPoint Templates because, to your team you always raise a toast. Use our Shapes PowerPoint Templates because, Emphasize on any critical or key factors within them. Use our Business PowerPoint Templates because, Gears interconnected: - The Gear Train is a basic element of living and daily business. Use our Process and Flows PowerPoint Templates because, explain the relevance of the different layers and stages in getting down to your core competence, ability and desired result. Use these PowerPoint slides for presentations relating to abstract, algorithm, arrow, block diagram, business, chart, color, connection, design, development, diagram, direction, element, flow, graph, linear, linear diagram, management, organization, plan, process, section, segment, set, sign, solution, strategy, symbol, technology, vector. The prominent colors used in the PowerPoint template are Black, Gray, and White Ideas come alive with our Success Ppt Template Linear Flow 4 Stages Business Communication PowerPoint 5 Image. Your thoughts will get animated.
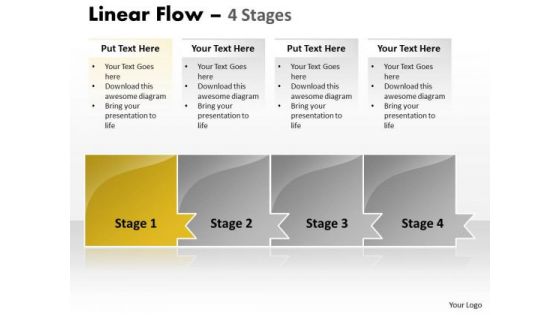
Usa Ppt Horizontal Model Of 4 Concepts Operations Management PowerPoint 2 Graphic
We present our USA PPT horizontal model of 4 concepts operations management power point 2 Graphic. Use our Advertising PowerPoint Templates because, you are going along well but your foresight shows that it may need a slight change in plans or direction. Use our Shapes PowerPoint Templates because; in any endeavor people matter most. Use our Business PowerPoint Templates because, Cycle Template: - Rolling along while gathering profits along the way is the aim. Use our Finance PowerPoint Templates because, you have some hits, you had some misses. Use our Process and Flows PowerPoint Templates because, develop your marketing strategy and communicate your enthusiasm and motivation to raise the bar. Use these PowerPoint slides for presentations relating to abstract, algorithm, arrow, business, chart, color, connection, design, development, direction, element, flow, graph, linear, management, model, organization, plan, process, program, section, segment, set, sign, solution, strategy, symbol, technology. The prominent colors used in the PowerPoint template are Yellow, Gray, and Black Halt doubts with our Usa Ppt Horizontal Model Of 4 Concepts Operations Management PowerPoint 2 Graphic. Download without worries with our money back guaranteee.
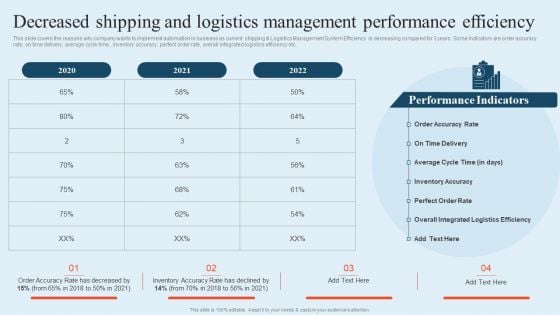
Integrating Logistics Automation Solution Decreased Shipping And Logistics Management Performance Ppt File Background Image PDF
This slide covers the reasons why company wants to implement automation in business as current shipping and Logistics Management System Efficiency is decreasing compared for 3 years. Some indicators are order accuracy rate, on time delivery, average cycle time , inventory accuracy, perfect order rate, overall integrated logistics efficiency etc. Here you can discover an assortment of the finest PowerPoint and Google Slides templates. With these templates, you can create presentations for a variety of purposes while simultaneously providing your audience with an eye-catching visual experience. Download Integrating Logistics Automation Solution Decreased Shipping And Logistics Management Performance Ppt File Background Image PDF to deliver an impeccable presentation. These templates will make your job of preparing presentations much quicker, yet still, maintain a high level of quality. Slidegeeks has experienced researchers who prepare these templates and write high-quality content for you. Later on, you can personalize the content by editing the Integrating Logistics Automation Solution Decreased Shipping And Logistics Management Performance Ppt File Background Image PDF.
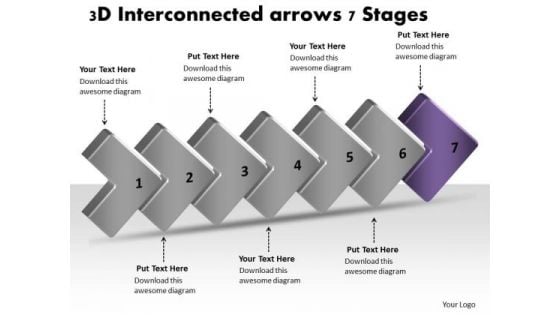
3d Interconnected Arrows 7 Stages Create Flow Charts PowerPoint Slides
We present our 3d interconnected arrows 7 stages create flow charts PowerPoint Slides. Use our Business PowerPoint Templates because, the ideas and plans are on your fingertips. Use our Arrows PowerPoint Templates because, they are logical, accurate and to the point. Use our Shapes PowerPoint Templates because, You now have the knowledge and resources to hit the target down to a T. Use our Abstract PowerPoint Templates because, Signpost your preferred roadmap to your eager co- travelers and demonstrate clearly how you intend to navigate them towards the desired corporate goal. Use our Process and Flows PowerPoint Templates because, Cycle Template:- Rolling along while gathering profits along the way is the aim. Use these PowerPoint slides for presentations relating to abstract, age, ancient, antique, arrows, art, artistic, background, colorful, colors, contemporary, decoration, design, dirt, dynamic, edge, element, frame, future, grunge, illustration, linear, lines, modern, pattern, place, pointer, poster, texture, vintage. The prominent colors used in the PowerPoint template are Purple, Gray, and Black File it with our 3d Interconnected Arrows 7 Stages Create Flow Charts PowerPoint Slides. Get all the information together.
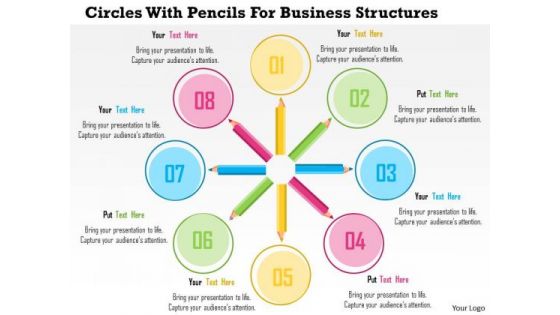
Business Diagram Circles With Pencils For Business Structures Presentation Template
This business diagram has been designed with graphic of pencils with text circles. This slide helps to depict business data and process. Use this slide to build quality presentations for your viewers.
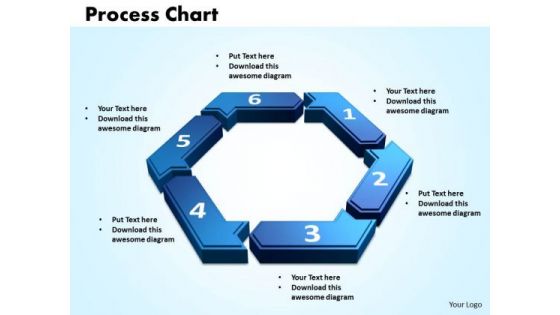
PowerPoint Designs Process Chart Strategy Ppt Slide
PowerPoint Designs process Chart Strategy PPT Slide-This Process Chart can be used as data flow diagram to show the flow of the data as it moves from beginning process to end result.-3d, arrow, art, business, chart, circle, concept, connection, cycle, development, diagram, direction, element, environment, finance, financial, flow, graphic, group, investment, isolated, market,, movement, organization, passive income, perspective, presentation, process chart, recycle, report, sign, step, success, symbol, teamwork-PowerPoint Designs process Chart Strategy PPT Slide Our PowerPoint Designs Process Chart Strategy Ppt Slide have a glossy look. Your thoughts will also acquire a sheen.
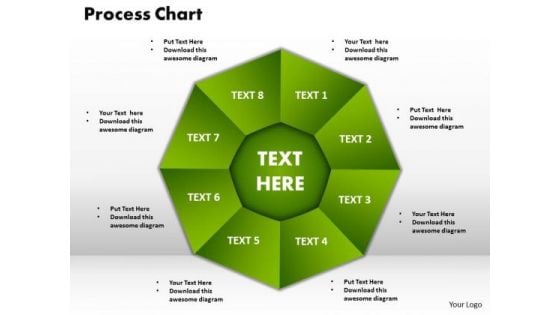
PowerPoint Slide Designs Process Chart Company Ppt Slides
PowerPoint Slide Designs process chart Company PPT Slides-This Process Chart can be used as data flow diagram to show the flow of the data as it moves from beginning process to end result.-3d, art, business, chart, circle, concept, connection, cycle, development, diagram, direction, element, environment, finance, financial, flow, graphic, group, investment, isolated, market,, movement, organization, passive income, perspective, presentation, process chart, recycle, report, sign, step, success, symbol, teamwork-PowerPoint Slide Designs process chart Company PPT Slides Excite emotions with our PowerPoint Slide Designs Process Chart Company Ppt Slides. Give them a real feel for your thoughts.
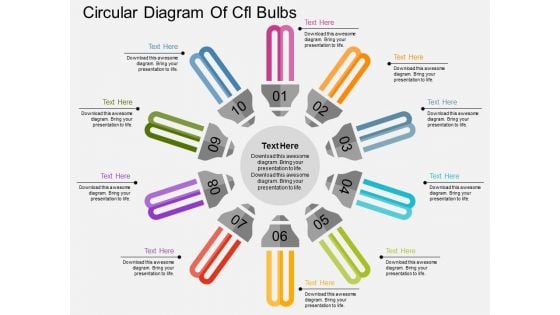
Circular Diagram Of Cfl Bulbs Powerpoint Templates
This PowerPoint template has been designed with circular diagram of CFL bulbs. It helps to exhibit business strategies and ideas. Use this diagram to impart more clarity to data and to create more sound impact on viewers.
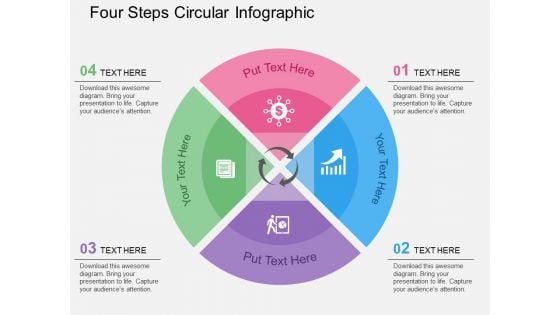
Four Steps Circular Infographic Powerpoint Templates
Our above slide contains diagram of three stage circular infographic. It helps to display global business analysis. Use this diagram to impart more clarity to data and to create more sound impact on viewers.
Colorful Circular Arrows Diagram Powerpoint Template
Our above PPT slide contains circular arrow design. This business diagram helps to exhibit process flow. Use this diagram to impart more clarity to data and to create more sound impact on viewers.
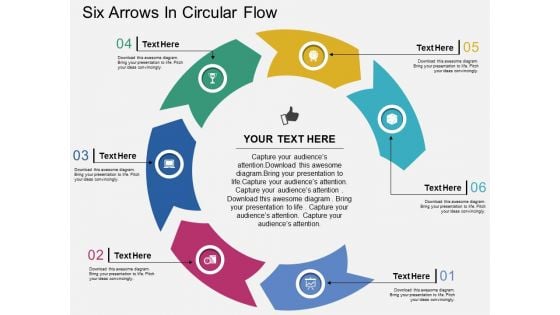
Six Arrows In Circular Flow Powerpoint Templates
Our above PPT slide contains graphics of circular diagram. This business diagram helps to display outline of business plan. Use this template to impart more clarity to data and to create more sound impact on viewers.
Diagram Of Colorful Circular Arrows Powerpoint Template
Our above PPT slide contains circular arrow design. This business diagram helps to exhibit process flow. Use this diagram to impart more clarity to data and to create more sound impact on viewers.
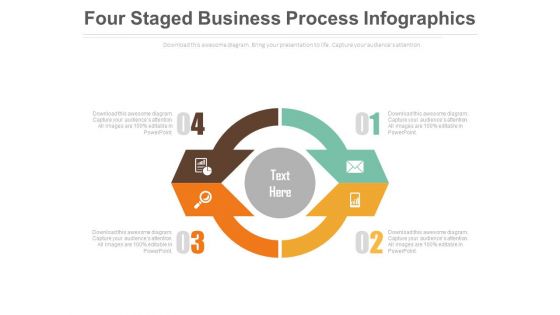
Four Steps Circular Infographic Powerpoint Slides
This innovative, stunningly beautiful dashboard has been designed for data visualization. It contains circular infographic design. This PowerPoint template helps to display your information in a useful, simple and orderly way.
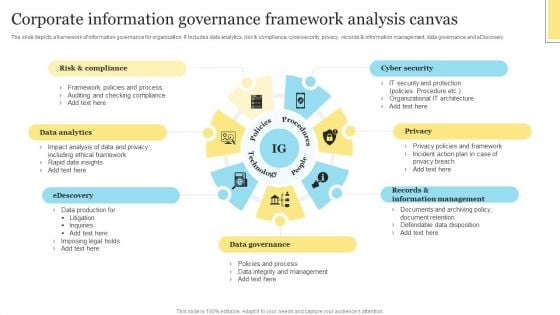
Corporate Information Governance Framework Analysis Canvas Clipart PDF
The slide depicts a framework of information governance for organization. It includes data analytics, risk and compliance, cybersecurity, privacy, records and information management, data governance and eDiscovery. Persuade your audience using this Corporate Information Governance Framework Analysis Canvas Clipart PDF. This PPT design covers four stages, thus making it a great tool to use. It also caters to a variety of topics including Risk Compliance, Data Analytics, Edescovery. Download this PPT design now to present a convincing pitch that not only emphasizes the topic but also showcases your presentation skills.

Steps For Insights In Dataset With Analysis Ppt Infographics PDF
This slide illustrate step for data analytics for extracting insights from the available data set for data mining and cleaning. It include steps like descriptive analytics, diagnosis analytics, predictive analytics and perspective analytics. Persuade your audience using this Steps For Insights In Dataset With Analysis Ppt Infographics PDF. This PPT design covers four stages, thus making it a great tool to use. It also caters to a variety of topics including Descriptive Analytics, Diagnostics Analytics, Predicative Analytics, Prescriptive Analytics. Download this PPT design now to present a convincing pitch that not only emphasizes the topic but also showcases your presentation skills.
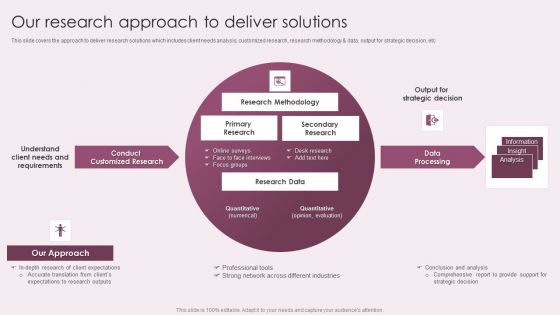
Business Advisory Solutions Company Profile Our Research Approach To Deliver Solutions Structure PDF
This slide covers the approach to deliver research solutions which includes client needs analysis, customized research, research methodology and data, output for strategic decision, etc. This is a Business Advisory Solutions Company Profile Our Research Approach To Deliver Solutions Structure PDF template with various stages. Focus and dispense information on one stages using this creative set, that comes with editable features. It contains large content boxes to add your information on topics like Conduct Customized Research, Research Data, Data Processing. You can also showcase facts, figures, and other relevant content using this PPT layout. Grab it now.
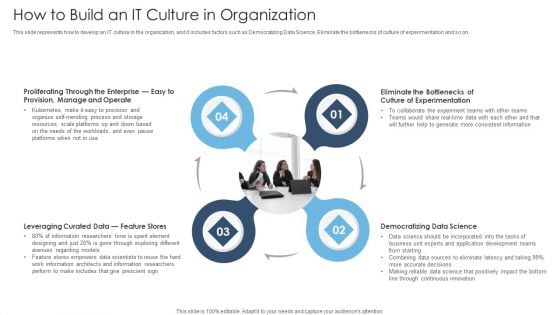
Achieving Proactive From Reactive How To Build An IT Culture In Organization Graphics PDF
This slide represents how to develop an IT culture in the organization, and it includes factors such as Democratizing Data Science, Eliminate the bottlenecks of culture of experimentation and so on. This is a Achieving Proactive From Reactive How To Build An IT Culture In Organization Graphics PDF template with various stages. Focus and dispense information on four stages using this creative set, that comes with editable features. It contains large content boxes to add your information on topics like Leveraging Curated Data, Feature Stores, Democratizing Data Science, Culture Experimentation. You can also showcase facts, figures, and other relevant content using this PPT layout. Grab it now.
Stages Of Demand Planning With Icons Ppt PowerPoint Presentation Pictures Professional PDF
Persuade your audience using this stages of demand planning with icons ppt powerpoint presentation pictures professional pdf. This PPT design covers four stages, thus making it a great tool to use. It also caters to a variety of topics including measuring data currency and accuracy, managing spikes to analyse data errors, preparing data for analysis, understanding impact of order fulfilment on forecasting. Download this PPT design now to present a convincing pitch that not only emphasizes the topic but also showcases your presentation skills.
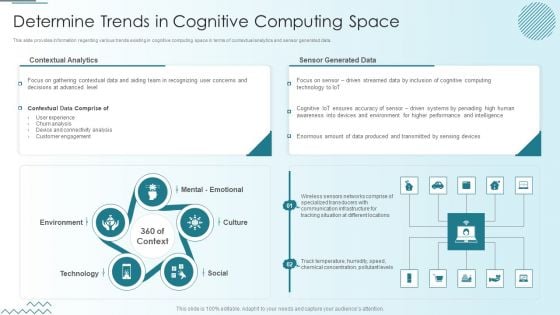
Computer Simulation Human Thinking Determine Trends In Cognitive Computing Space Inspiration PDF
This slide provides information regarding various trends existing in cognitive computing space in terms of contextual analytics and sensor generated data. Presenting Computer Simulation Human Thinking Determine Trends In Cognitive Computing Space Inspiration PDF to provide visual cues and insights. Share and navigate important information on five stages that need your due attention. This template can be used to pitch topics like Contextual Analytics, Contextual Data Comprise, Sensor Generated Data. In addtion, this PPT design contains high resolution images, graphics, etc, that are easily editable and available for immediate download.
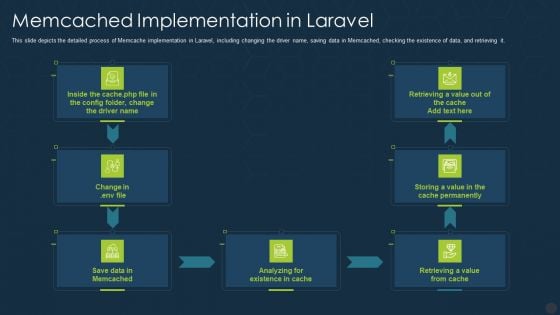
Memcached Implementation In Laravel Ppt Model Graphics Template PDF
This slide depicts the detailed process of Memcache implementation in Laravel, including changing the driver name, saving data in Memcached, checking the existence of data, and retrieving it. Presenting memcached implementation in laravel ppt model graphics template pdf to provide visual cues and insights. Share and navigate important information on seven stages that need your due attention. This template can be used to pitch topics like analyzing, data, permanently, value. In addtion, this PPT design contains high resolution images, graphics, etc, that are easily editable and available for immediate download.
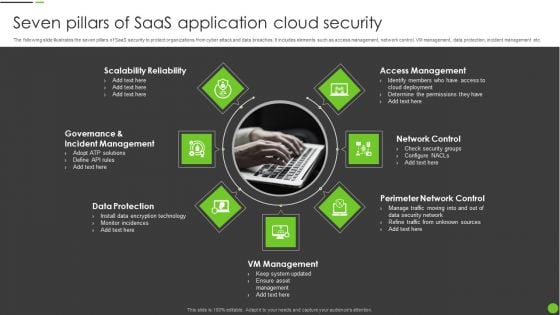
Seven Pillars Of Saas Application Cloud Security Ppt PowerPoint Presentation File Tips PDF
The following slide illustrates the seven pillars of SaaS security to protect organizations from cyber attack and data breaches. It includes elements such as access management, network control, VM management, data protection, incident management etc. Presenting Seven Pillars Of Saas Application Cloud Security Ppt PowerPoint Presentation File Tips PDF to dispense important information. This template comprises seven stages. It also presents valuable insights into the topics including VM Management, Data Protection, Network Control, Perimeter Network Control. This is a completely customizable PowerPoint theme that can be put to use immediately. So, download it and address the topic impactfully.
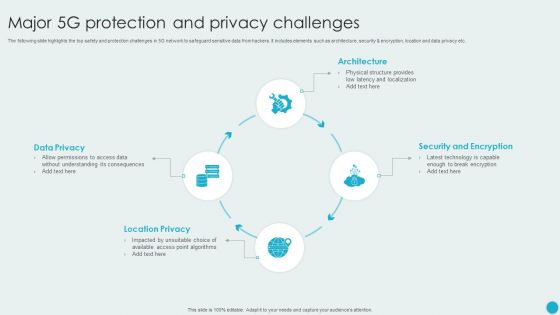
Major 5G Protection And Privacy Challenges Themes PDF
The following slide highlights the top safety and protection challenges in 5G network to safeguard sensitive data from hackers. It includes elements such as architecture, security and encryption, location and data privacy etc. Presenting Major 5G Protection And Privacy Challenges Themes PDF to dispense important information. This template comprises four stages. It also presents valuable insights into the topics including Data Privacy, Location Privacy, Security And Encryption. This is a completely customizable PowerPoint theme that can be put to use immediately. So, download it and address the topic impactfully.
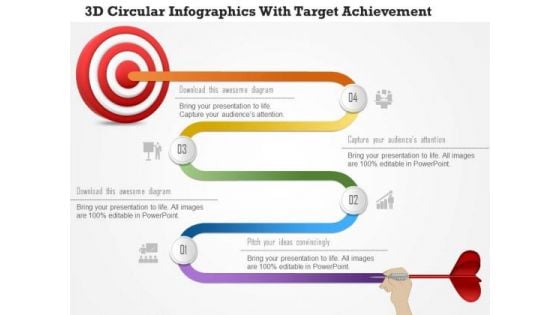
Business Diagram 3d Circular Infographics With Target Achievement PowerPoint Template
This power point template has been crafted with graphic of 3d circular info graphics. This PPT slide contains the concept of data representation and target achievement. This PPT can be used for target and success related presentations.
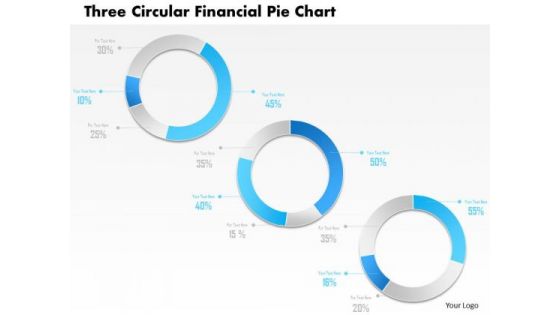
Business Diagram Three Circular Financial Pie Chart PowerPoint Template
This power point template has been designed with graphic of three circular pie chart. This pie chart is suitable for financial data representation. Use this PPt for your business and finance related presentations.

Business Diagram Seven Staged Circular Ribbon Text Box Diagram Presentation Template
This Power Point template slide has been used to display the concept of business data analysis. This PPT slide contains the graphic of seven staged circular ribbon style text boxes. Use this PPT slide for your business presentations.
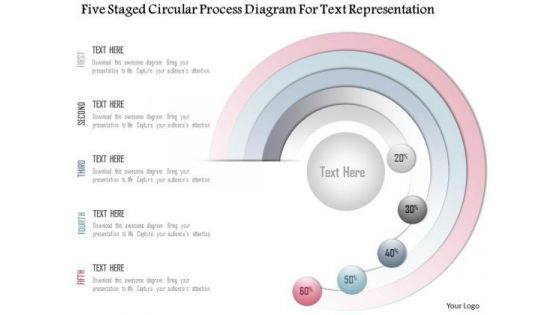
Business Diagram Five Staged Circular Process Diagram For Text Representation Presentation Template
Our above slide displays Five staged circular process diagram. Download our above diagram to express information in a visual way. Use this diagram and get good comments for data related presentations.
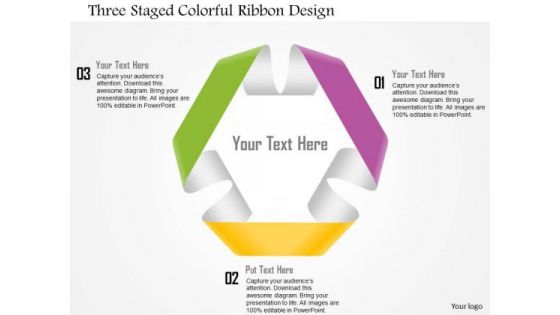
Business Diagram Three Staged Colorful Ribbon Design Presentation Template
This business diagram displays three staged circular ribbon. This Power Point slide can be used for data representation. Use this PPT slide to show flow of activities in circular manner. Get professional with this exclusive business slide.
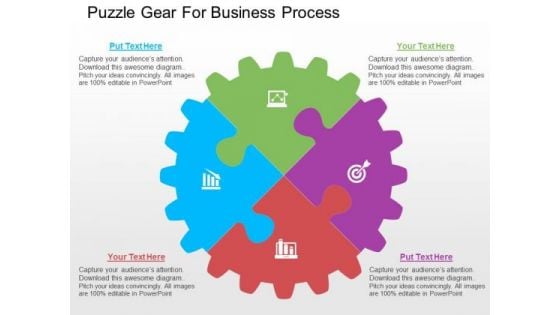
Puzzle Gear For Business Process PowerPoint Templates
Our above PPT slide contains circular gear puzzle diagram. This puzzle gear circular diagram helps to exhibit process planning and solutions. Use this diagram to impart more clarity to data and to create more sound impact on viewers.
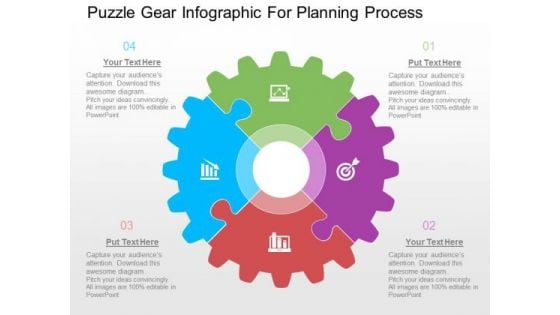
Puzzle Gear Infographic For Planning Process PowerPoint Templates
Our above PPT slide contains circular gear puzzle diagram. This puzzle gear circular diagram helps to exhibit process planning and solutions. Use this diagram to impart more clarity to data and to create more sound impact on viewers.
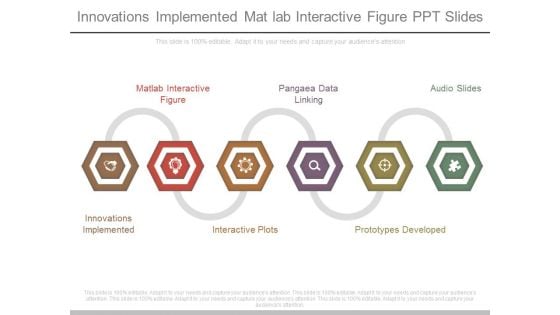
Innovations Implemented Mat Lab Interactive Figure Ppt Slides
This is a innovations implemented mat lab interactive figure ppt slides. This is a six stage process. The stages in this process are mat lab interactive figure, pangaea data linking, audio slides, innovations implemented, interactive plots, prototypes developed.
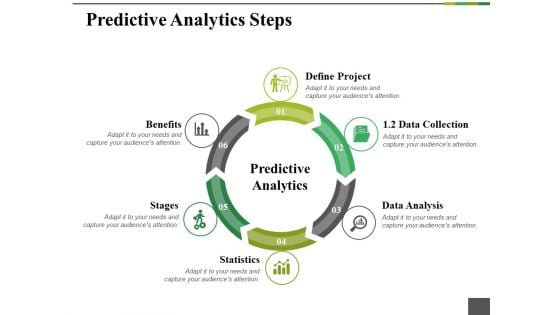
Predictive Analytics Steps Ppt PowerPoint Presentation Portfolio Template
This is a predictive analytics steps ppt powerpoint presentation portfolio template. This is a six stage process. The stages in this process are define project, benefits, stages, statistics, data analysis.
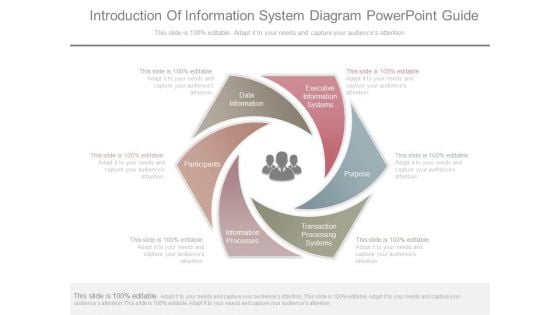
Introduction Of Information System Diagram Powerpoint Guide
This is a introduction of information system diagram powerpoint guide. This is a six stage process. The stages in this process are executive information systems, purpose, transaction processing systems, information processes, participants, data information.
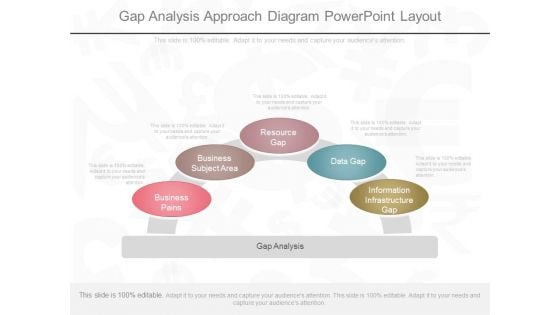
Gap Analysis Approach Diagram Powerpoint Layout
This is a gap analysis approach diagram powerpoint layout. This is a five stage process. The stages in this process are information infrastructure gap, data gap, resource gap, business subject area, business pains.
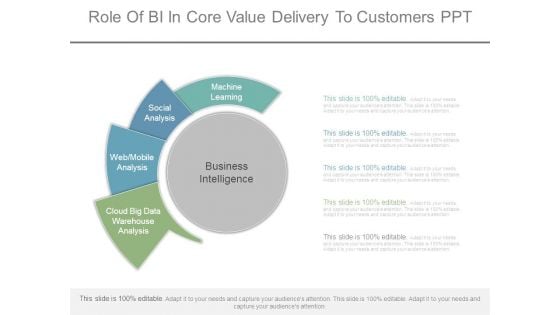
Role Of Bi In Core Value Delivery To Customers Ppt
This is a role of bi in core value delivery to customers ppt. This is a five stage process. The stages in this process are business intelligence, machine learning, social analysis, web mobile analysis, cloud big data warehouse analysis.
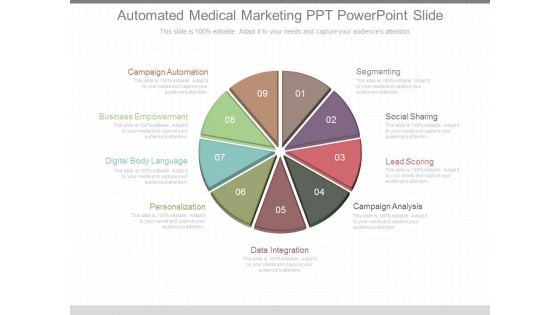
Automated Medical Marketing Ppt Powerpoint Slide
This is an automated medical marketing ppt powerpoint slide. This is a nine stage process. The stages in this process are campaign automation, segmenting, business empowerment, social sharing, lead scoring, lead scoring, digital body language, campaign analysis, data integration.
Business Modelling Analyse Powerpoint Sample
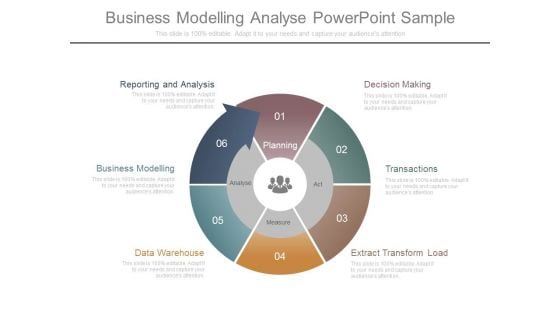
This is a business modelling analyse powerpoint sample. This is a six stage process. The stages in this process are decision making, transactions, extract transform load, data warehouse, business modelling, reporting and analysis, planning, act, measure, analyse.
Continuous Risk Assessment Diagram Powerpoint Slides Templates
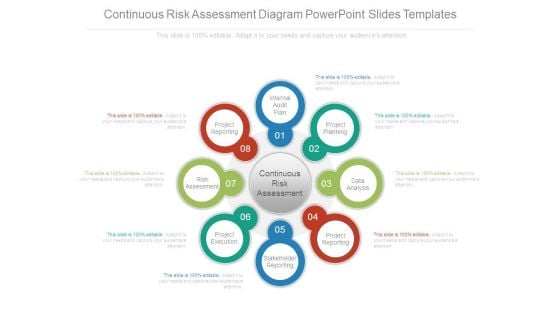
This is a continuous risk assessment diagram powerpoint slides templates. This is a eight stage process. The stages in this process are internal audit plan, project planning, data analysis, project reporting, stakeholder reporting, project execution, risk assessment, project reporting.
Tools For HR Business Analytics Four Stages Of Business Intelligence Process Rules PDF
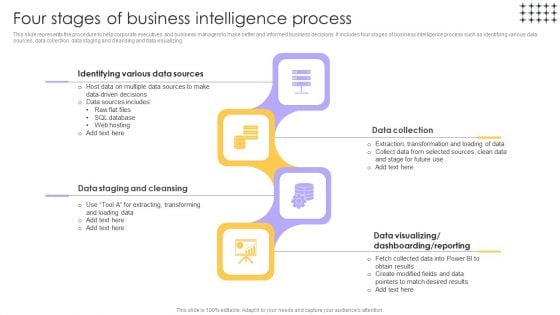
This slide represents the procedure to help corporate executives and business managers to make better and informed business decisions. It includes four stages of business intelligence process such as identifying various data sources, data collection, data staging and cleansing and data visualizing. Formulating a presentation can take up a lot of effort and time, so the content and message should always be the primary focus. The visuals of the PowerPoint can enhance the presenters message, so our Tools For HR Business Analytics Four Stages Of Business Intelligence Process Rules PDF was created to help save time. Instead of worrying about the design, the presenter can concentrate on the message while our designers work on creating the ideal templates for whatever situation is needed. Slidegeeks has experts for everything from amazing designs to valuable content, we have put everything into Tools For HR Business Analytics Four Stages Of Business Intelligence Process Rules PDF.
Abc Steps For Corporate Entrepreneurship Powerpoint Template
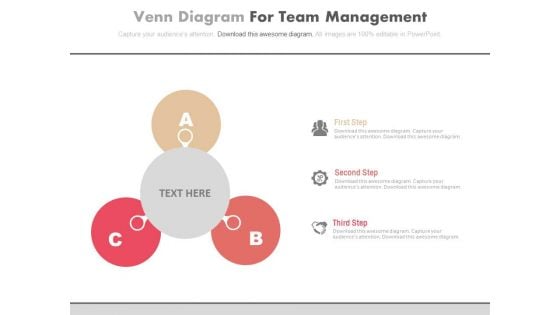
Our above PPT slide contains graphics of ABC steps chart. This business diagram helps to depict concept of corporate entrepreneurship. Use this diagram to impart more clarity to data and to create more sound impact on viewers.
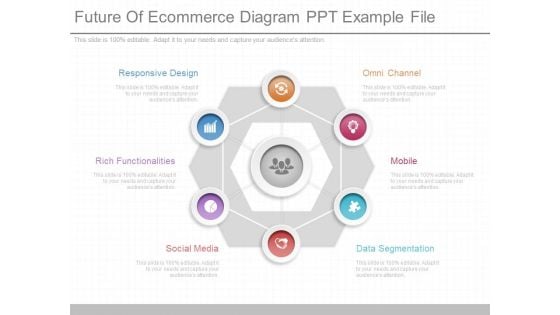
Future Of Ecommerce Diagram Ppt Example File
This is a future of ecommerce diagram ppt example file. This is a six stage process. The stages in this process are responsive design, rich functionalities, social media, omni channel, mobile, data segmentation.
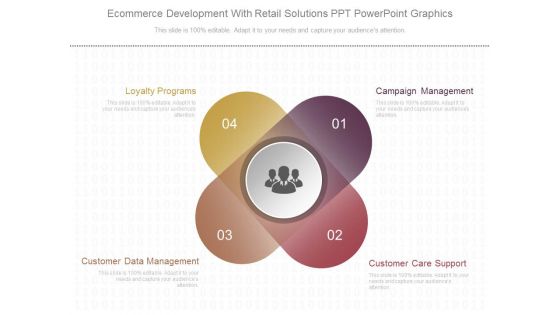
Ecommerce Development With Retail Solutions Ppt Powerpoint Graphics
This is a ecommerce development with retail solutions ppt powerpoint graphics. This is a four stage process. The stages in this process are loyalty programs, campaign management, customer data management, customer care support.\n\n\n\n\n\n
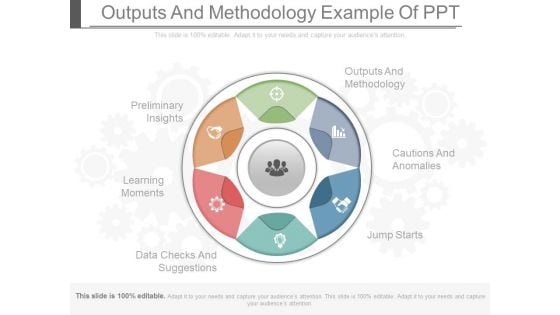
Outputs And Methodology Example Of Ppt
This is a outputs and methodology example of ppt. This is a six stage process. The stages in this process are outputs and methodology, cautions and anomalies, jump starts, data checks and suggestions, learning moments, preliminary insights.
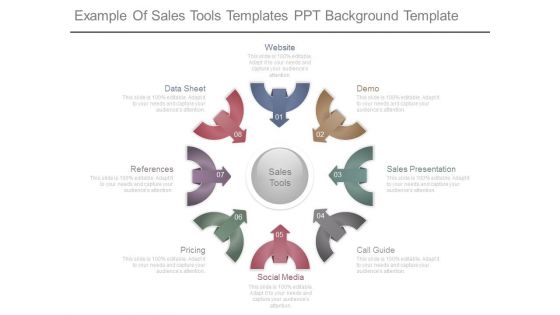
Example Of Sales Tools Templates Ppt Background Template
This is a example of sales tools templates ppt background template. This is a eight stage process. The stages in this process are sales tools, data sheet, references, pricing, social media, call guide, sales presentation, demo, website.
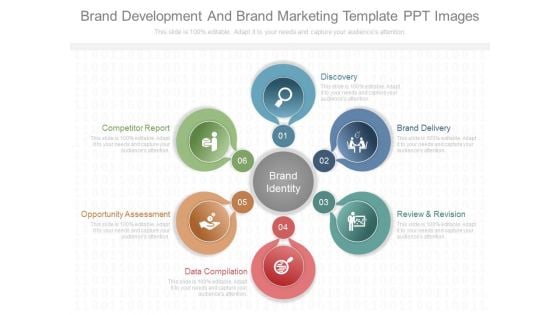
Brand Development And Brand Marketing Template Ppt Images
This is a brand development and brand marketing template ppt images. This is a six stage process. The stages in this process are discovery, brand delivery, review and revision, data compilation, opportunity assessment, competitor report, brand identity.
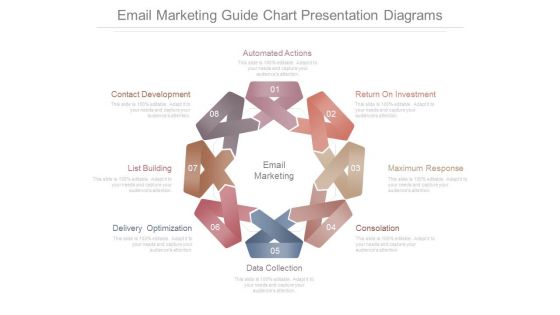
Email Marketing Guide Chart Presentation Diagrams
This is a email marketing guide chart presentation diagrams. This is a eight stage process. The stages in this process are automated actions, return on investment, maximum response, consolation, data collection, delivery optimization, list building, contact development, email marketing.
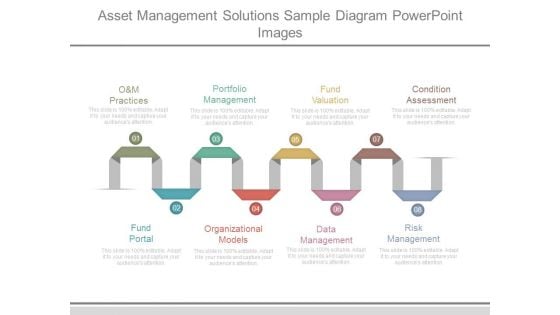
Asset Management Solutions Sample Diagram Powerpoint Images
This is a asset management solutions sample diagram powerpoint images. This is a eight stage process. The stages in this process are o and m practices, portfolio management, fund valuation, condition assessment, fund portal, organizational models, data management, risk management.
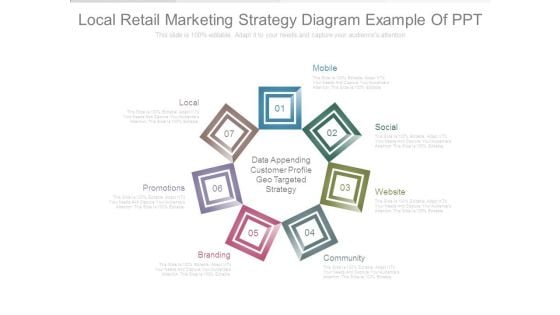
Local Retail Marketing Strategy Diagram Example Of Ppt
This is a local retail marketing strategy diagram example of ppt. This is a seven stage process. The stages in this process are local, promotions, branding, mobile, social, website, community, data appending customer profile geo targeted strategy.
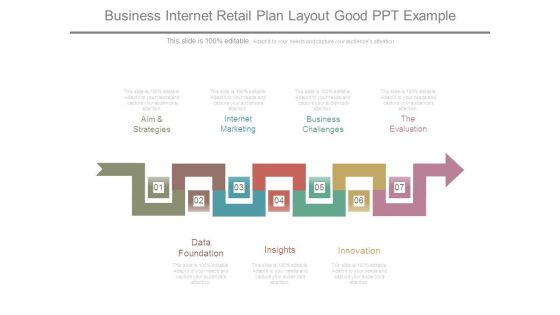
Business Internet Retail Plan Layout Good Ppt Example
This is a business internet retail plan layout good ppt example. This is a seven stage process. The stages in this process are aim and strategies, internet marketing, business challenges, the evaluation, data foundation, insights, innovation.
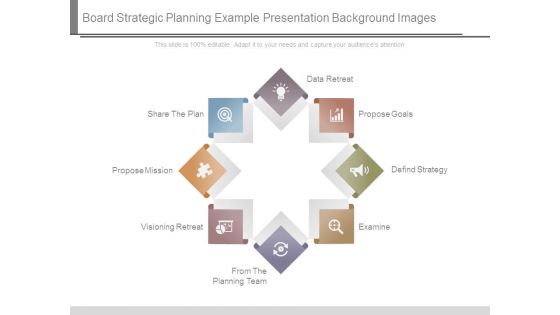
Board Strategic Planning Example Presentation Background Image
This is a board strategic planning example presentation background image. This is a eight stage process. The stages in this process are data retreat, propose goals, defind strategy, examine, share the plan, propose mission, visioning retreat, from the planning team.
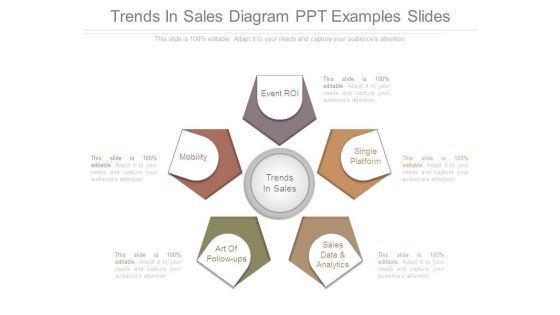
Trends In Sales Diagram Ppt Examples Slides
This is a trends in sales diagram ppt examples slides. This is a five stage process. The stages in this process are event roi, single platform, sales data and analytics, art of follow ups, mobility, trends in sales.
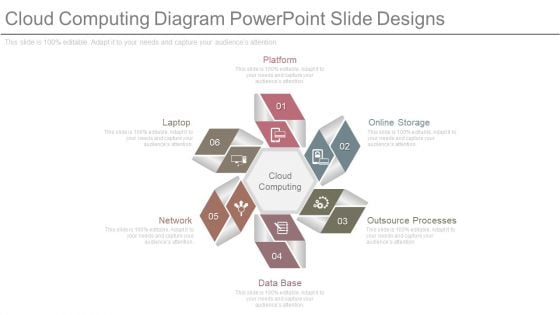
Cloud Computing Diagram Powerpoint Slide Designs
This is a cloud computing diagram powerpoint slide designs. This is a six stage process. The stages in this process are platform, online storage, outsource processes, data base, network, laptop.
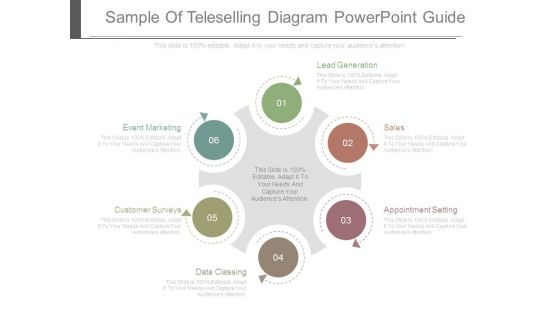
Sample Of Teleselling Diagram Powerpoint Guide
This is a sample of teleselling diagram powerpoint guide. This is a six stage process. The stages in this process are lead generation, sales, appointment setting, data classing, customer surveys, event marketing.
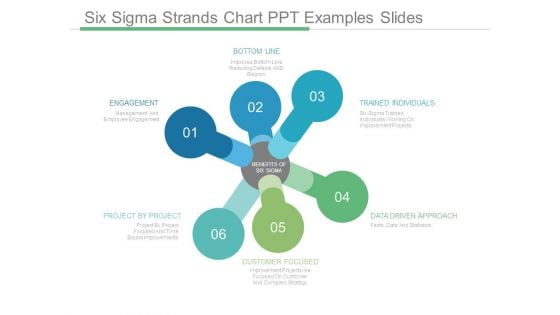
Six Sigma Strands Chart Ppt Examples Slides
This is a six sigma strands chart ppt examples slides. This is a six stage process. The stages in this process are bottom line, trained individuals, data driven approach, customer focused, project by project, engagement, benefits of six sigma.
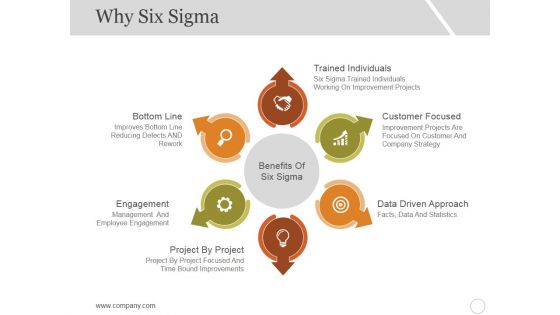
Why Six Sigma Template 2 Ppt PowerPoint Presentation Infographic Template Skills
This is a why six sigma template 2 ppt powerpoint presentation infographic template skills. This is a six stage process. The stages in this process are bottom line, engagement, project by project, customer focused, data driven approach.
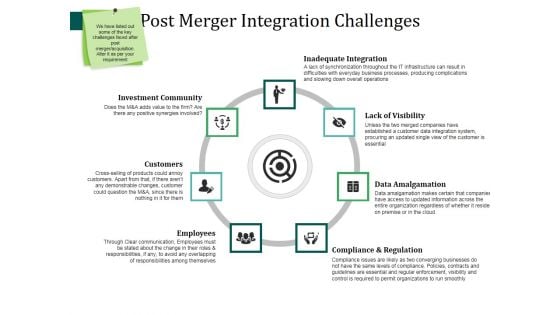
Post Merger Integration Challenges Ppt PowerPoint Presentation Slides Show
This is a post merger integration challenges ppt powerpoint presentation slides show. This is a seven stage process. The stages in this process are investment community, customers, employees, lack of visibility, data amalgamation.
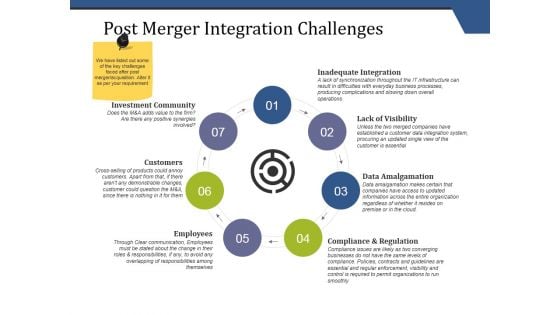
Post Merger Integration Challenges Ppt PowerPoint Presentation Model Example
This is a post merger integration challenges ppt powerpoint presentation model example. This is a seven stage process. The stages in this process are inadequate integration, lack of visibility, data amalgamation, employees, customers, compliance and regulation, investment community.


 Continue with Email

 Home
Home


