Data Dashboard

Dashboard Ppt PowerPoint Presentation Summary Portfolio
This is a dashboard ppt powerpoint presentation summary portfolio. This is a three stage process. The stages in this process are low, medium, high.
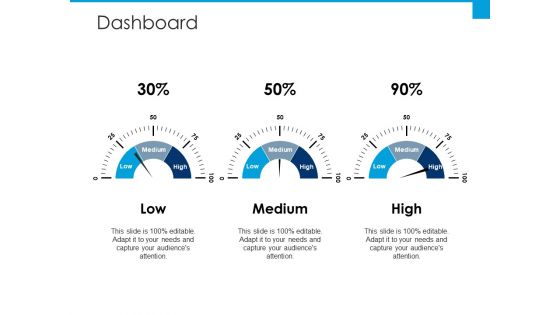
Dashboard Ppt PowerPoint Presentation File Portrait
This is a dashboard ppt powerpoint presentation file portrait. This is a three stage process. The stages in this process are business, management, marketing, strategy, planning.
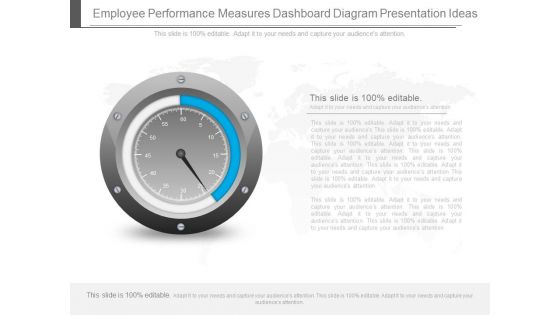
Employee Performance Measures Dashboard Diagram Presentation Ideas
This is a employee performance measures dashboard diagram presentation ideas. This is a one stage process. The stages in this process are business, marketing, dashboard, measuring.
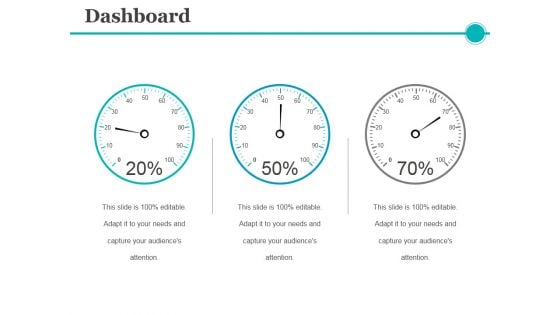
Dashboard Ppt PowerPoint Presentation Portfolio Background Image
This is a dashboard ppt powerpoint presentation portfolio background image. This is a three stage process. The stages in this process are dashboard, measurement, business, marketing.
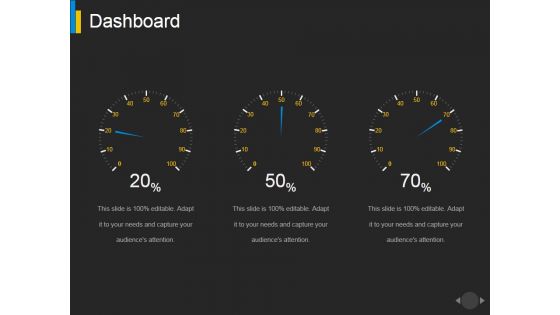
Dashboard Ppt PowerPoint Presentation Portfolio Maker
This is a dashboard ppt powerpoint presentation portfolio maker. This is a three stage process. The stages in this process are dashboard, measurement, finance, business.
Dashboard Ppt PowerPoint Presentation Icon Influencers
This is a dashboard ppt powerpoint presentation icon influencers. This is a three stage process. The stages in this process are dashboard, measurement, business, marketing.
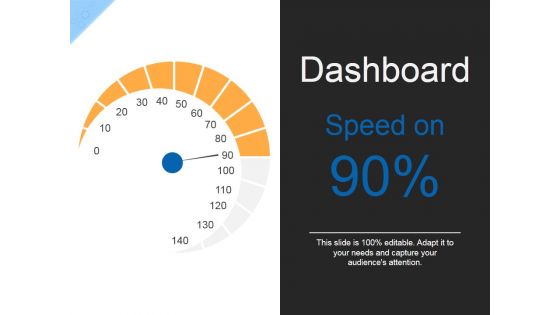
Dashboard Ppt PowerPoint Presentation Infographics Outfit
This is a dashboard ppt powerpoint presentation infographics outfit. This is a one stage process. The stages in this process are dashboard, measurement, finance, business.
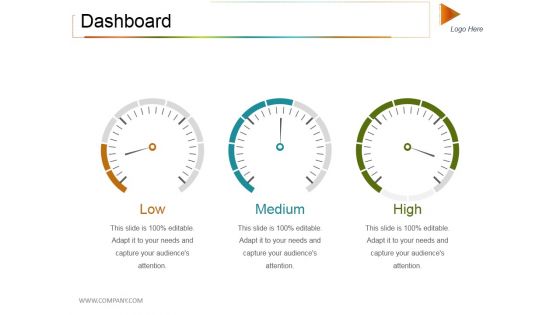
Dashboard Ppt PowerPoint Presentation Inspiration Backgrounds
This is a dashboard ppt powerpoint presentation inspiration backgrounds. This is a three stage process. The stages in this process are low, medium, high, dashboard, measurement.
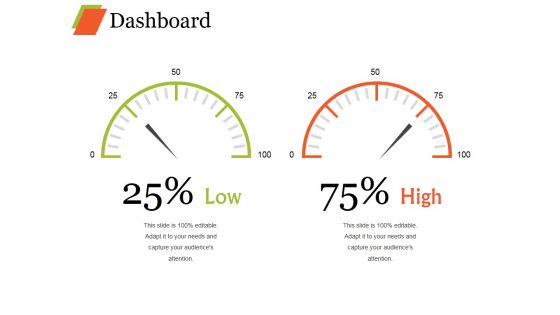
Dashboard Ppt PowerPoint Presentation Styles Templates
This is a dashboard ppt powerpoint presentation styles templates. This is a two stage process. The stages in this process are low, medium, high, dashboard, measurement.

Dashboard Ppt PowerPoint Presentation File Background Images
This is a dashboard ppt powerpoint presentation file background images. This is a three stage process. The stages in this process are dashboard, business, marketing, strategy, process.
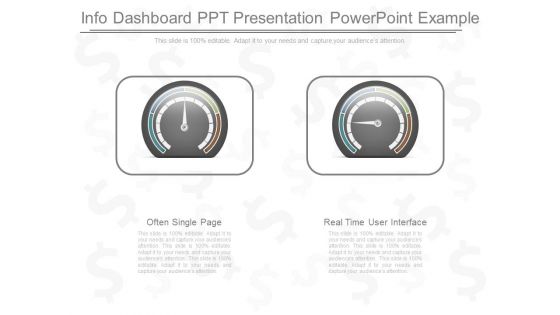
Info Dashboard Ppt Presentation Powerpoint Example
This is a info dashboard ppt presentation powerpoint example. This is a two stage process. The stages in this process are often single page, real time user interface.
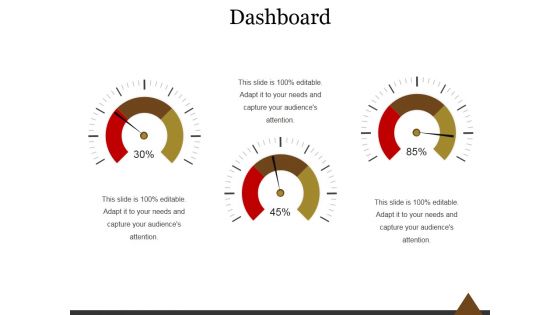
Dashboard Ppt PowerPoint Presentation Visual Aids
This is a dashboard ppt powerpoint presentation visual aids. This is a three stage process. The stages in this process are dashboard, business, marketing, process, success.
Dashboard Measuring Ppt PowerPoint Presentation Ideas Icons
Presenting this set of slides with name dashboard measuring ppt powerpoint presentation ideas icons. This is a three stage process. The stages in this process are dashboard, low, high, management, business. This is a completely editable PowerPoint presentation and is available for immediate download. Download now and impress your audience.
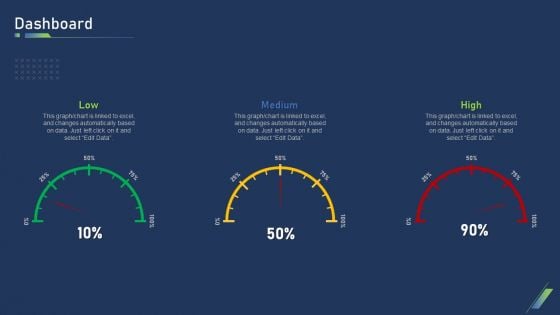
Using Bots Marketing Strategy Dashboard Infographics PDF
This is a using bots marketing strategy dashboard infographics pdf template with various stages. Focus and dispense information on three stages using this creative set, that comes with editable features. It contains large content boxes to add your information on topics like low, medium, high. You can also showcase facts, figures, and other relevant content using this PPT layout. Grab it now.
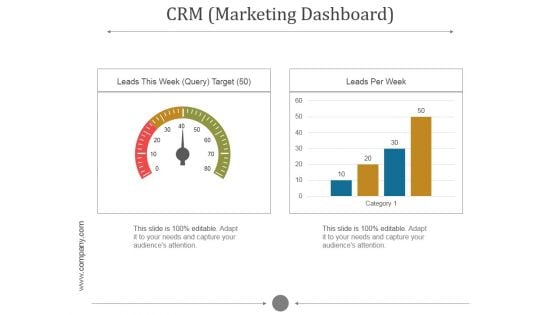
Crm Marketing Dashboard Ppt PowerPoint Presentation Templates
This is a crm marketing dashboard ppt powerpoint presentation templates. This is a two stage process. The stages in this process are leads this week query target, leads per week.

Best Data Mining Tools Sas Data Warehousing And Data Mining Guide AI SS V
This slide showcases SAS, one of the best data mining tools available in the latter market. It provides details about data sources, data preparation, data exploration, insights, reports, Java, Python, Lua, etc. Create an editable Best Data Mining Tools Sas Data Warehousing And Data Mining Guide AI SS V that communicates your idea and engages your audience. Whether you are presenting a business or an educational presentation, pre-designed presentation templates help save time. Best Data Mining Tools Sas Data Warehousing And Data Mining Guide AI SS V is highly customizable and very easy to edit, covering many different styles from creative to business presentations. Slidegeeks has creative team members who have crafted amazing templates. So, go and get them without any delay. This slide showcases SAS, one of the best data mining tools available in the latter market. It provides details about data sources, data preparation, data exploration, insights, reports, Java, Python, Lua, etc.
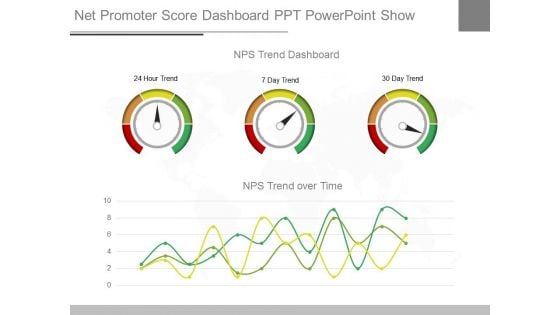
Net Promoter Score Dashboard Ppt Powerpoint Show
This is a net promoter score dashboard ppt powerpoint show. This is a three stage process. The stages in this process are nps trend dashboard, 24 hour trend, 7 day trend, 30 day trend, nps trend over time.

Business Performance Dashboard Analysis Diagram Powerpoint Slides
This is a business performance dashboard analysis diagram powerpoint slides. This is a three stage process. The stages in this process are measure, business, management, presentation, process.
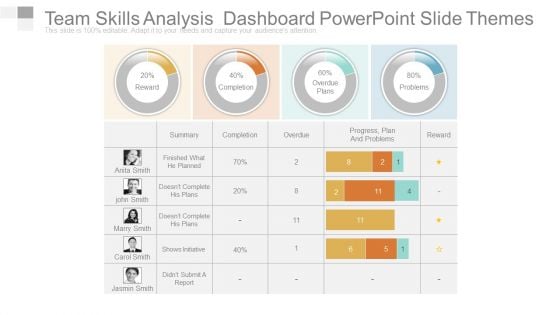
Team Skills Analysis Dashboard Powerpoint Slide Themes
This is a team skills analysis dashboard powerpoint slide themes. This is a four stage process. The stages in this process are reward, completion, overdue, overdue plans, problems.
Team Work Analysis Dashboard Ppt Icon
This is a team work analysis dashboard ppt icon. This is a four stage process. The stages in this process are reward, completion, overdue plans, problems.
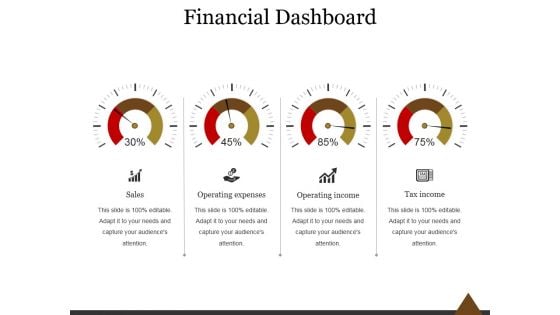
Financial Dashboard Ppt PowerPoint Presentation Information
This is a financial dashboard ppt powerpoint presentation information. This is a four stage process. The stages in this process are sales, operating expenses, operating income, tax income.
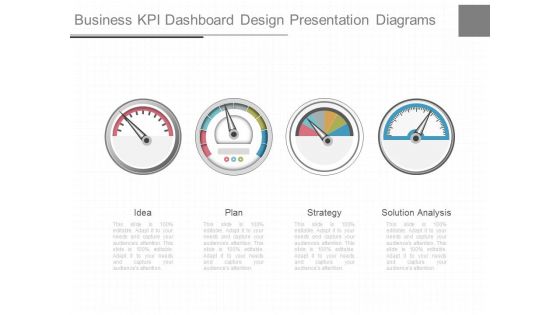
Business Kpi Dashboard Design Presentation Diagrams
This is a business kpi dashboard design presentation diagrams. This is a four stage process. The stages in this process are idea, plan, strategy, solution analysis.
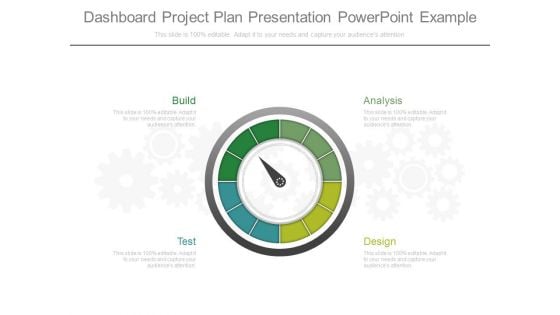
Dashboard Project Plan Presentation Powerpoint Example
This is a dashboard project plan presentation powerpoint example. This is a four stage process. The stages in this process are build, test, design, analysis.
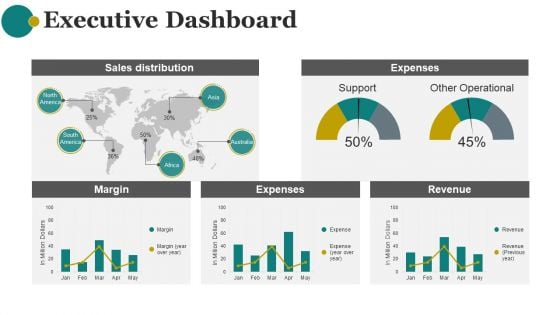
Executive Dashboard Ppt PowerPoint Presentation Graphics
This is a executive dashboard ppt powerpoint presentation graphics. This is a five stage process. The stages in this process are sales distribution, expenses, margin, expenses, revenue.
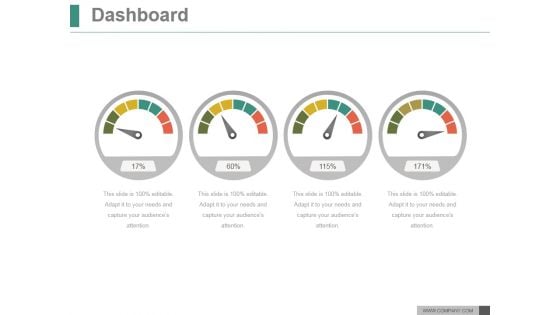
Dashboard Ppt PowerPoint Presentation Example 2015
This is a dashboard ppt powerpoint presentation example 2015. This is a four stage process. The stages in this process are business, marketing, management, analysis, dashboard.
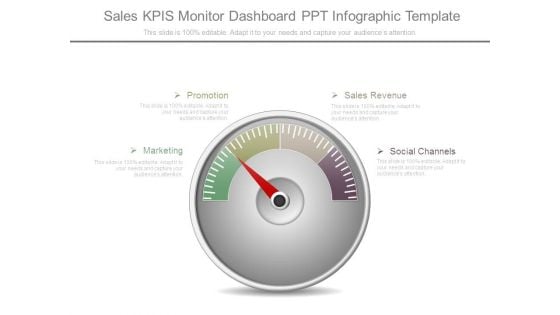
Sales Kpis Monitor Dashboard Ppt Infographic Template
This is a sales kpis monitor dashboard ppt infographic template. This is a one stage process. The stages in this process are promotion, marketing, sales revenue, social channels.
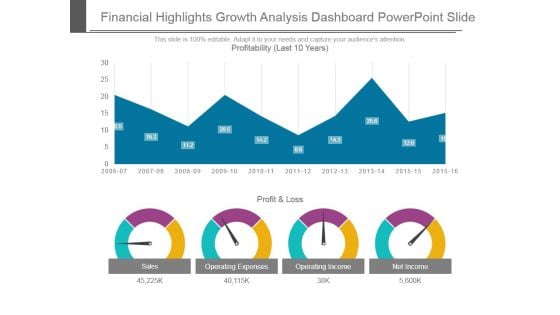
Financial Highlights Growth Analysis Dashboard Powerpoint Slide
This is a financial highlights growth analysis dashboard powerpoint slide. This is a four stage process. The stages in this process are profit and loss, sales, operating expenses, operating income, net income, profitability.

Enterprise Dashboard Ppt Presentation Powerpoint Example
This is a enterprise dashboard ppt presentation powerpoint example. This is a three stage process. The stages in this process are balance scorecard, enterprise performance, industry trends.

Sample Kpi Dashboard Ppt Sample Presentations
This is a sample kpi dashboard ppt sample presentations. This is a four stage process. The stages in this process are sales, market, budget, people.

Sample Sales Kpi Dashboard Presentation Background Images
This is a sample sales kpi dashboard presentation background images. This is a four stage process. The stages in this process are implement review, define, solve, analyze.

Finance Benchmarking Index Dashboard Example Of Ppt
This is a finance benchmarking index dashboard example of ppt. This is a six stage process. The stages in this process are industry, company, government, litigation, economics, credit.
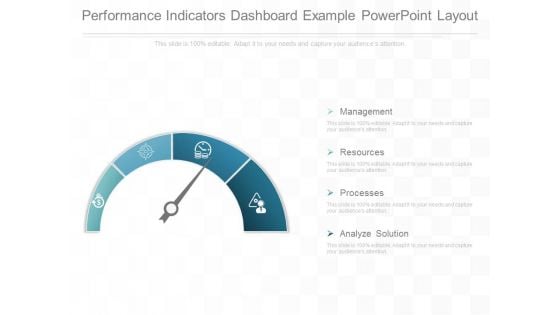
Performance Indicators Dashboard Example Powerpoint Layout
This is a performance indicators dashboard example powerpoint layout. This is a four stage process. The stages in this process are management, resources, processes, analyze solution.
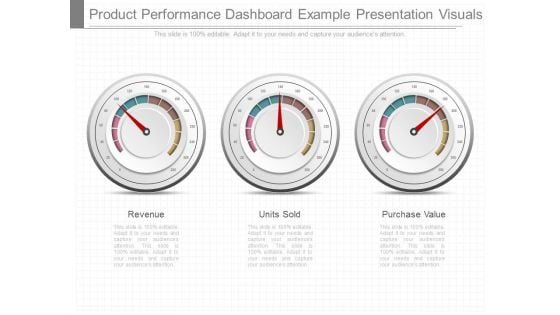
Product Performance Dashboard Example Presentation Visuals
This is a product performance dashboard example presentation visuals. This is a three stage process. The stages in this process are revenue, units sold, purchase value.
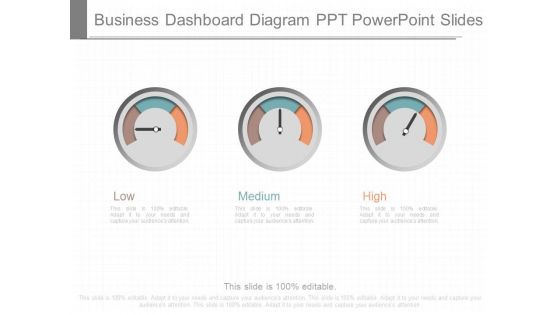
Business Dashboard Diagram Ppt Powerpoint Slides
This is a business dashboard diagram ppt powerpoint slides. This is a three stage process. The stages in this process are low, medium, high.
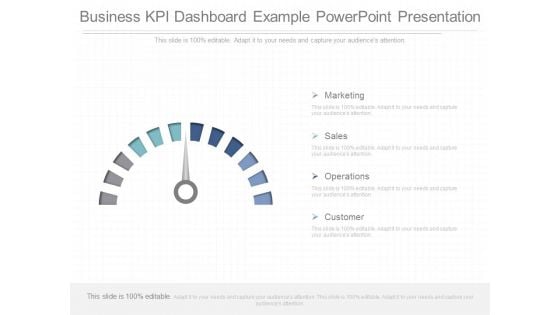
Business Kpi Dashboard Example Powerpoint Presentation
This is a business kpi dashboard example powerpoint presentation. This is a four stage process. The stages in this process are marketing, sales, operations, customer.
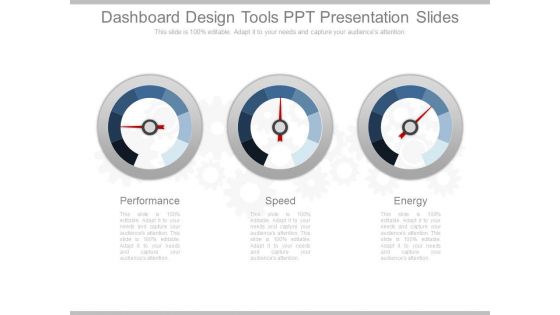
Dashboard Design Tools Ppt Presentation Slides
This is a dashboard design tools ppt presentation slides. This is a three stage process. The stages in this process are performance, speed, energy.
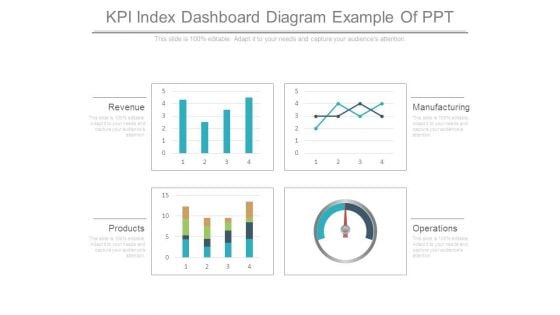
Kpi Index Dashboard Diagram Example Of Ppt
This is a kpi index dashboard diagram example of ppt. This is a four stage process. The stages in this process are revenue, products, operations, manufacturing.
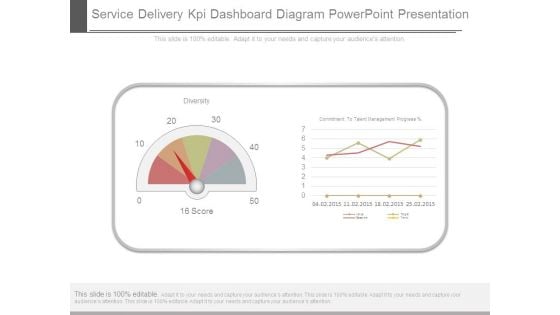
Service Delivery Kpi Dashboard Diagram Powerpoint Presentation
This is a service delivery kpi dashboard diagram powerpoint presentation. This is a two stage process. The stages in this process are diversity, commitment to talent management progress.
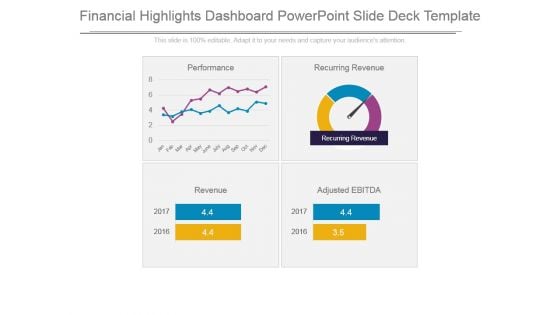
Financial Highlights Dashboard Powerpoint Slide Deck Template
This is a financial highlights dashboard powerpoint slide deck template. This is a four stage process. The stages in this process are recurring revenue, performance, revenue, adjusted ebitda.
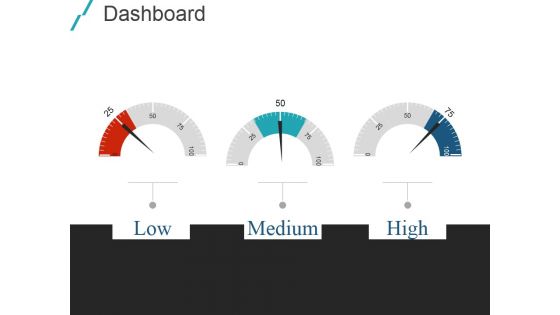
Dashboard Ppt PowerPoint Presentation Inspiration Introduction
This is a dashboard ppt powerpoint presentation inspiration introduction. This is a three stage process. The stages in this process are low, medium, high.
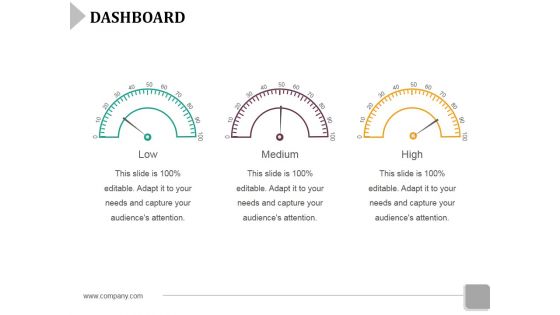
Dashboard Ppt PowerPoint Presentation Gallery Graphics Template
This is a dashboard ppt powerpoint presentation gallery graphics template. This is a three stage process. The stages in this process are low, medium, high, measurement.
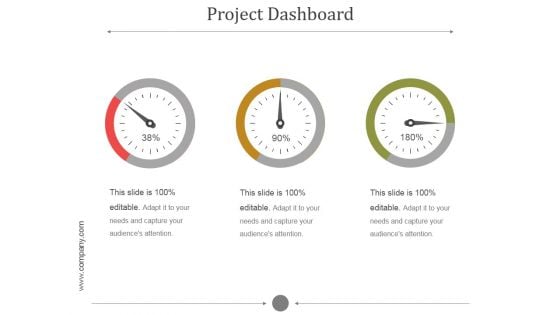
Project Dashboard Ppt PowerPoint Presentation Clipart
This is a project dashboard ppt powerpoint presentation clipart. This is a three stage process. The stages in this process are speed, meter, measure, needle, calculate.
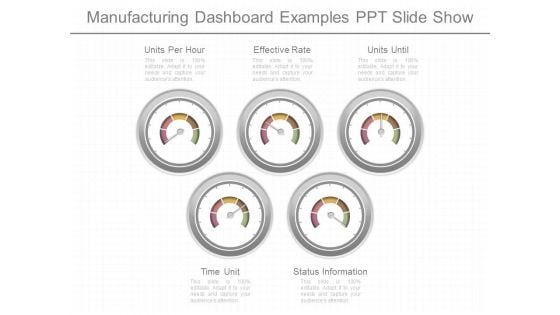
Manufacturing Dashboard Examples Ppt Slide Show
This is a manufacturing dashboard examples ppt slide show. This is a five stage process. The stages in this process are units per hour, effective rate, units until, time unit, status information.
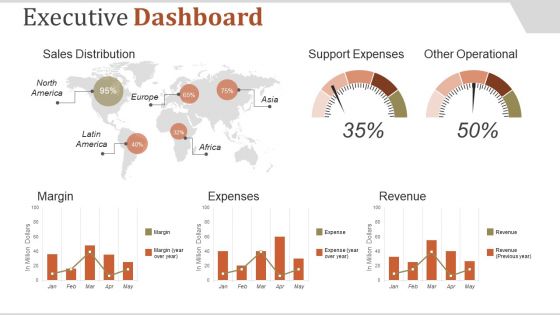
Executive Dashboard Ppt PowerPoint Presentation Introduction
This is a executive dashboard ppt powerpoint presentation introduction. This is a five stage process. The stages in this process are sales distribution, support expenses, other operational, margin, expenses.
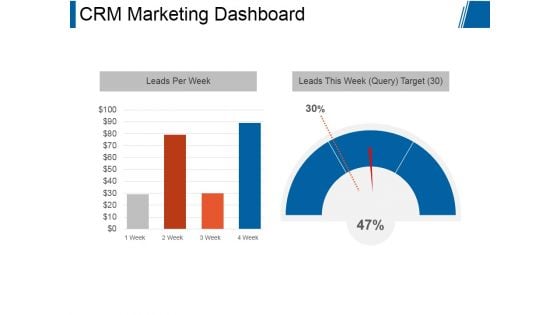
Crm Marketing Dashboard Ppt PowerPoint Presentation Designs
This is a crm marketing dashboard ppt powerpoint presentation designs. This is a two stage process. The stages in this process are leads per week, leads this week target.
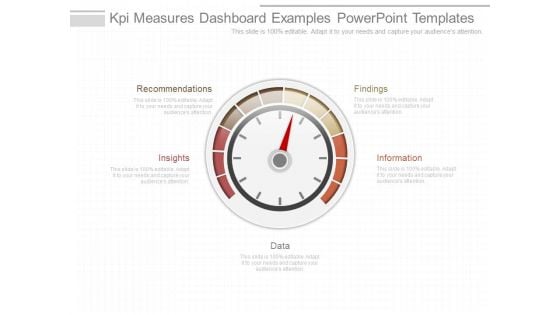
Kpi Measures Dashboard Examples Powerpoint Templates
This is a kpi measures dashboard examples powerpoint templates. This is a four stage process. The stages in this process are recommendations, insights, data, information, findings.
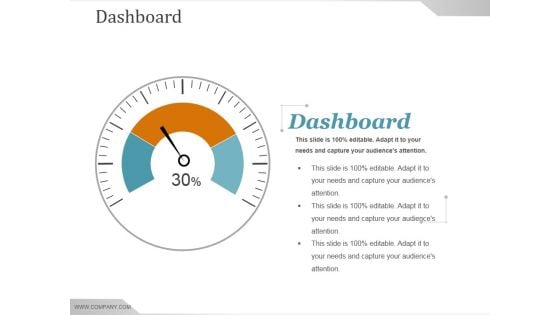
Dashboard Ppt PowerPoint Presentation Inspiration Examples
This is a dashboard ppt powerpoint presentation inspiration examples. This is a one stage process. The stages in this process are business, strategy, marketing, analysis, dashboard, measuring.
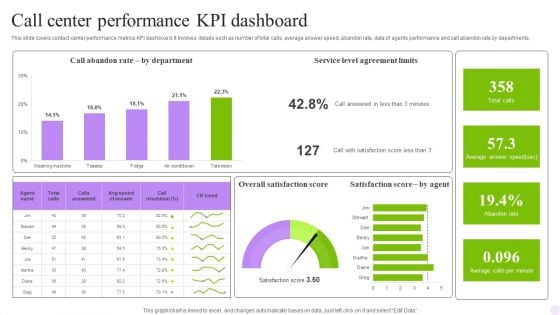
Call Center Performance KPI Dashboard Formats PDF
This slide covers contact center performance metrics KPI dashboard. It involves details such as number of total calls, average answer speed, abandon rate, data of agents performance and call abandon rate by departments. Showcasing this set of slides titled Call Center Performance KPI Dashboard Formats PDF. The topics addressed in these templates are Department, Dashboard, Agreement Limits. All the content presented in this PPT design is completely editable. Download it and make adjustments in color, background, font etc. as per your unique business setting.
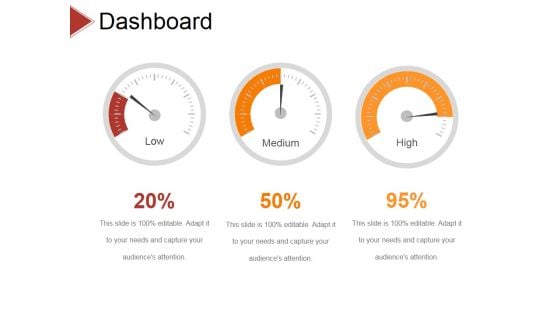
Dashboard Ppt PowerPoint Presentation Styles Graphics Design
This is a dashboard ppt powerpoint presentation styles graphics design. This is a three stage process. The stages in this process are business, strategy, analysis, pretention, finance, dashboard.
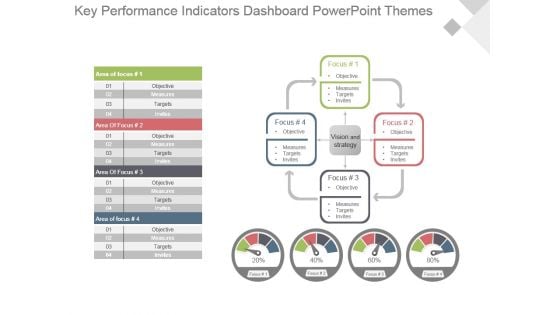
Key Performance Indicators Dashboard Powerpoint Themes
This is a key performance indicators dashboard powerpoint themes. This is a four stage process. The stages in this process are focus, objective, measures, targets, invites, vision and strategy, area of focus.

Revenue Kpi Dashboard Ppt Infographic Template
This is a revenue kpi dashboard ppt infographic template. This is a five stage process. The stages in this process are outcasts, successful adverts, earned revenue, sold products, operations.
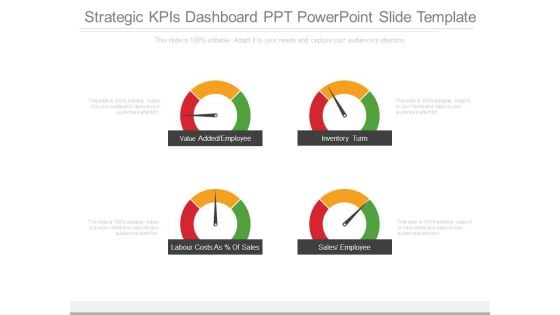
Strategic Kpis Dashboard Ppt Powerpoint Slide Template
This is a strategic kpis dashboard ppt powerpoint slide template. This is a four stage process. The stages in this process are value added employee, inventory turn, labour costs as of sales, sales employee.
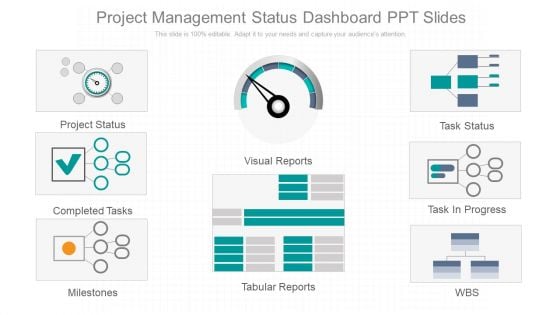
Project Management Status Dashboard Ppt Slides
This is a project management status dashboard ppt slides. This is a eight stage process. The stages in this process are project status, completed tasks, milestones, visual reports, tabular reports, task status, task in progress, wbs.
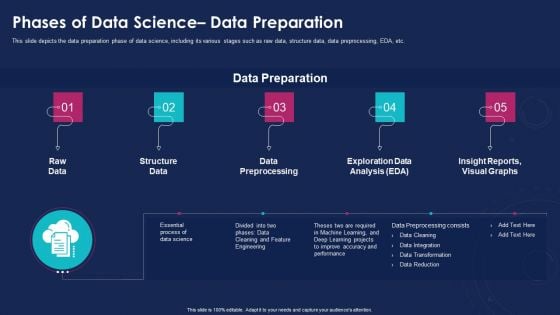
Data Analytics IT Phases Of Data Science Data Preparation Ppt Professional Example Topics PDF
This slide depicts the data preparation phase of data science, including its various stages such as raw data, structure data, data preprocessing, EDA, etc. This is a data analytics it phases of data science data preparation ppt professional example topics pdf template with various stages. Focus and dispense information on five stages using this creative set, that comes with editable features. It contains large content boxes to add your information on topics like raw data, structure data, data preprocessing, exploration data analysis, insight reports, visual graphs. You can also showcase facts, figures, and other relevant content using this PPT layout. Grab it now.
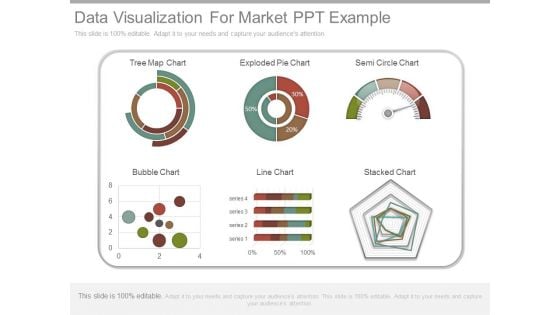
Data Visualization For Market Ppt Example
This is a data visualization for market ppt example. This is a six stage process. The stages in this process are tree map chart, exploded pie chart, semi circle chart, bubble chart, line chart, stacked chart, series.
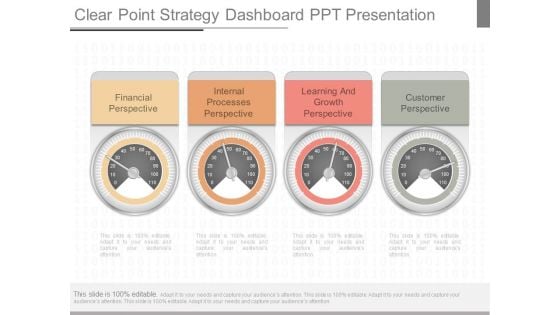
Clear Point Strategy Dashboard Ppt Presentation
This is a clear point strategy dashboard ppt presentation. This is a four stage process. The stages in this process are financial perspective, internal processes perspective, learning and growth perspective, customer perspective.
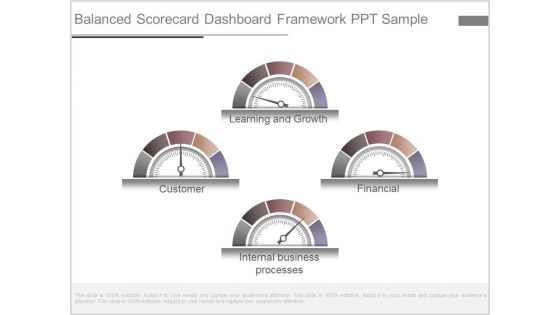
Balanced Scorecard Dashboard Framework Ppt Sample
This is a balanced scorecard dashboard framework ppt sample. This is a four stage process. The stages in this process are learning and growth, financial, internal business processes, customer.
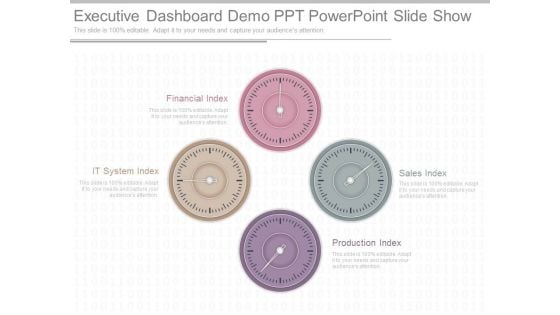
Executive Dashboard Demo Ppt Powerpoint Slide Show
This is a executive dashboard demo ppt powerpoint slide show. This is a four stage process. The stages in this process are financial index, it system index, production index, sales index.
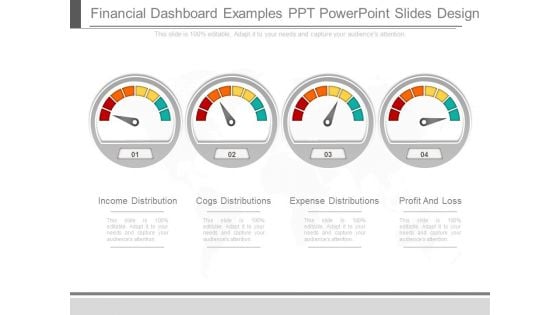
Financial Dashboard Examples Ppt Powerpoint Slides Design
This is a financial dashboard examples ppt powerpoint slides design. This is a four stage process. The stages in this process are income distribution, cogs distributions, expense distributions, profit and loss.
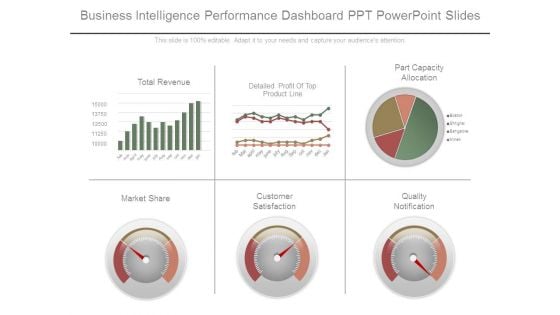
Business Intelligence Performance Dashboard Ppt Powerpoint Slides
This is a business intelligence performance dashboard ppt powerpoint slides. This is a six stage process. The stages in this process are total revenue, detailed profit of top product line, part capacity allocation, market share, customer satisfaction, quality notification.


 Continue with Email

 Home
Home


