Data Dashboard
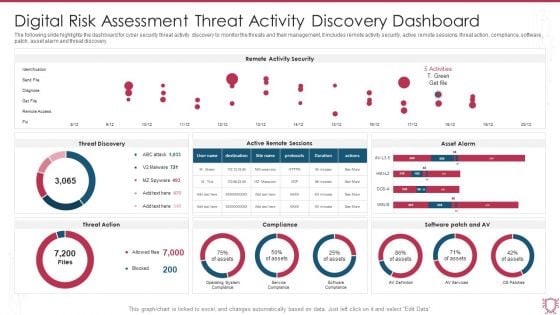
Digital Risk Assessment Threat Activity Discovery Dashboard Ppt Ideas Skills PDF
The following slide highlights the dashboard for cyber security threat activity discovery to monitor the threats and their management, it includes remote activity security, active remote sessions, threat action, compliance, software patch, asset alarm and threat discovery. Pitch your topic with ease and precision using this Digital Risk Assessment Threat Activity Discovery Dashboard Ppt Ideas Skills PDF. This layout presents information on Remote Activity Security, Threat Discovery, Asset Alarm. It is also available for immediate download and adjustment. So, changes can be made in the color, design, graphics or any other component to create a unique layout.
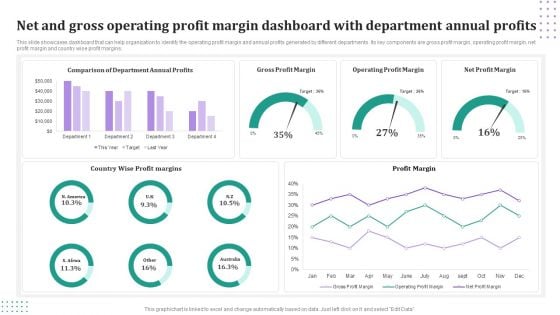
Net And Gross Operating Profit Margin Dashboard With Department Annual Profits Mockup PDF
This slide showcases dashboard that can help organization to identify the operating profit margin and annual profits generated by different departments. Its key components are gross profit margin, operating profit margin, net profit margin and country wise profit margins. Pitch your topic with ease and precision using this Net And Gross Operating Profit Margin Dashboard With Department Annual Profits Mockup PDF. This layout presents information on Gross Profit Margin, Operating Profit Margin, Net Profit Margin. It is also available for immediate download and adjustment. So, changes can be made in the color, design, graphics or any other component to create a unique layout.
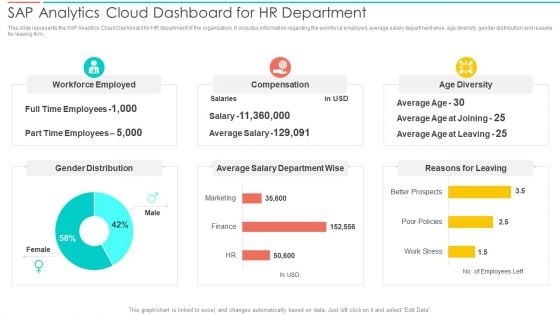
SAC Planning And Implementation SAP Analytics Cloud Dashboard For Hr Department Inspiration PDF
This slide represents the SAP Analytics Cloud Dashboard for HR department of the organization. It includes information regarding the workforce employed, average salary department wise, age diversity, gender distribution and reasons for leaving firm. Deliver and pitch your topic in the best possible manner with this SAC Planning And Implementation SAP Analytics Cloud Dashboard For Hr Department Inspiration PDF. Use them to share invaluable insights on Workforce Employed, Compensation, Age Diversity and impress your audience. This template can be altered and modified as per your expectations. So, grab it now.
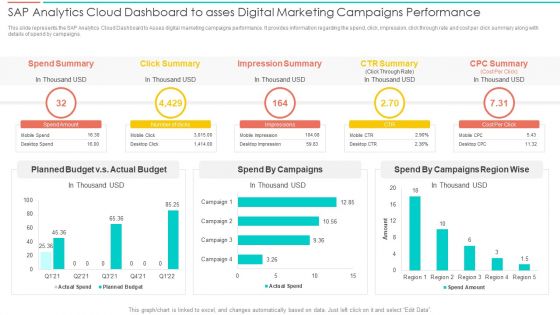
SAC Planning And Implementation SAP Analytics Cloud Dashboard To Asses Digital Marketing Pictures PDF
This slide represents the SAP Analytics Cloud Dashboard to Asses digital marketing campaigns performance. It provides information regarding the spend, click, impression, click through rate and cost per click summary along with details of spend by campaigns. Deliver an awe inspiring pitch with this creative SAC Planning And Implementation SAP Analytics Cloud Dashboard To Asses Digital Marketing Pictures PDF bundle. Topics like Spend Summary, Click Summary, Impression Summary, CTR Summary can be discussed with this completely editable template. It is available for immediate download depending on the needs and requirements of the user.
B2B Sales Techniques Playbook Sales Management Activities Tracking Dashboard Diagrams PDF
This slide provides information regarding sales management activities tracking dashboard to measure closed business, sales pipeline, sales activity by sales rep, month over month growth, forecast by month, etc. Deliver and pitch your topic in the best possible manner with this B2B Sales Techniques Playbook Sales Management Activities Tracking Dashboard Diagrams PDF. Use them to share invaluable insights on Sales Pipeline, Sales Activity, Sales Pipeline and impress your audience. This template can be altered and modified as per your expectations. So, grab it now.
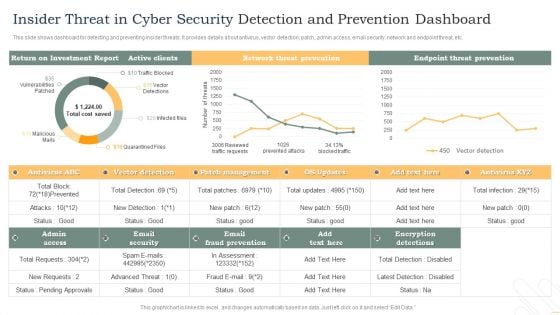
Insider Threat In Cyber Security Detection And Prevention Dashboard Diagrams PDF
This slide shows dashboard for detecting and preventing insider threats. It provides details about antivirus, vector detection, patch, admin access, email security, network and endpoint threat, etc. Pitch your topic with ease and precision using this Insider Threat In Cyber Security Detection And Prevention Dashboard Diagrams PDF. This layout presents information on Active Clients, Network Threat Prevention, Endpoint Threat Prevention. It is also available for immediate download and adjustment. So, changes can be made in the color, design, graphics or any other component to create a unique layout.
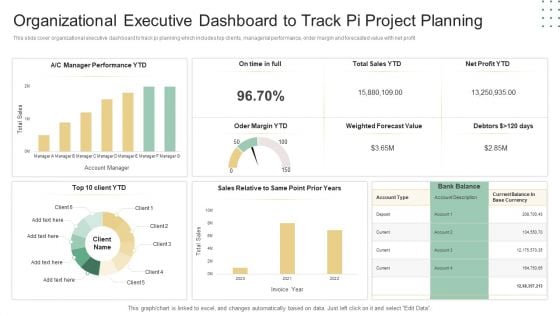
Organizational Executive Dashboard To Track Pi Project Planning Ppt Professional Background PDF
This slide cover organizational executive dashboard to track pi planning which includes top clients, managerial performance, order margin and forecasted value with net profit. Pitch your topic with ease and precision using this Organizational Executive Dashboard To Track Pi Project Planning Ppt Professional Background PDF. This layout presents information on Weighted Forecast Value, Top 10, Client YTD. It is also available for immediate download and adjustment. So, changes can be made in the color, design, graphics or any other component to create a unique layout.
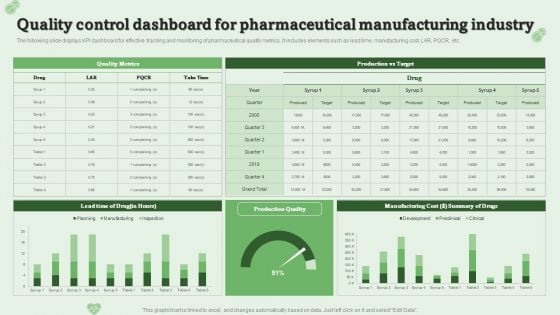
Quality Control Dashboard For Pharmaceutical Manufacturing Industry Ppt PowerPoint Presentation Model Layouts PDF
The following slide displays KPI dashboard for effective tracking and monitoring of pharmaceutical quality metrics. It includes elements such as lead time, manufacturing cost, LAR, PQCR, etc.Pitch your topic with ease and precision using this Quality Control Dashboard For Pharmaceutical Manufacturing Industry Ppt PowerPoint Presentation Model Layouts PDF. This layout presents information on Manufacturing Cost, Summary Drugs, Quality Metrics. It is also available for immediate download and adjustment. So, changes can be made in the color, design, graphics or any other component to create a unique layout.
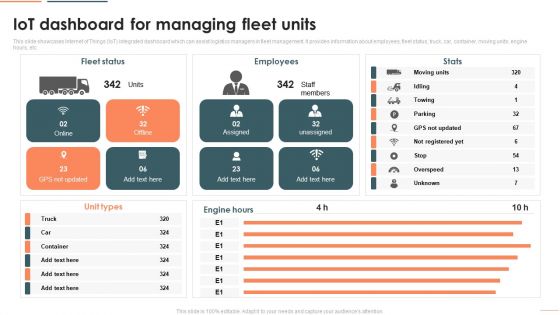
Deploying Iot In Logistics And Supply Chain Iot Dashboard For Managing Fleet Units Download PDF
This slide showcases Internet of Things IoT integrated dashboard which can assist logistics managers in fleet management. It provides information about employees, fleet status, truck, car, container, moving units, engine hours, etc. Deliver and pitch your topic in the best possible manner with this Deploying Iot In Logistics And Supply Chain Iot Dashboard For Managing Fleet Units Download PDF. Use them to share invaluable insights on Fleet Status, Employees, Unit Types and impress your audience. This template can be altered and modified as per your expectations. So, grab it now.
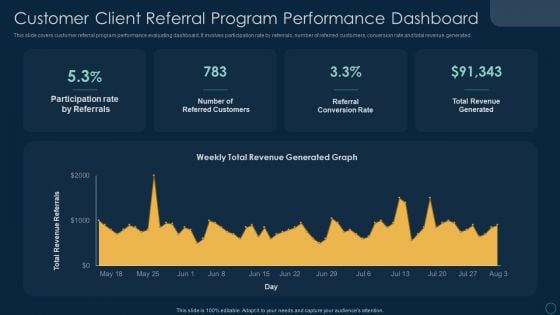
Customer Client Referral Program Performance Dashboard Ppt File Visual Aids PDF
This slide covers customer referral program performance evaluating dashboard. It involves participation rate by referrals, number of referred customers, conversion rate and total revenue generated. Pitch your topic with ease and precision using this Customer Client Referral Program Performance Dashboard Ppt File Visual Aids PDF. This layout presents information on Participation Rate Referrals, Number Referred Customers, Referral Conversion Rate. It is also available for immediate download and adjustment. So, changes can be made in the color, design, graphics or any other component to create a unique layout.

KPI Dashboard Highlighting Automation Results In Supply Achieving Operational Efficiency Graphics PDF
The following slide outlines a comprehensive dashboard depicting the business process automation BPA results in the supply chain. Information covered in the slide is related to average order processing days, average shipping days, etc.Deliver and pitch your topic in the best possible manner with this KPI Dashboard Highlighting Automation Results In Supply Achieving Operational Efficiency Graphics PDF. Use them to share invaluable insights on Orders Progress, Late Deliveries, Deliveries Warehouse and impress your audience. This template can be altered and modified as per your expectations. So, grab it now.
Consumer Journey Mapping Techniques Loyalty Program Performance Tracking Dashboard Portrait PDF
This slide covers the KPI dashboard for analyzing customer loyalty campaign results. It includes metrics such as revenue, liability, NQP accrued, transaction count, members, redemption ratio, etc. Pitch your topic with ease and precision using this Consumer Journey Mapping Techniques Loyalty Program Performance Tracking Dashboard Portrait PDF. This layout presents information on Transaction Count, Revenue, Redemption Ratio. It is also available for immediate download and adjustment. So, changes can be made in the color, design, graphics or any other component to create a unique layout.
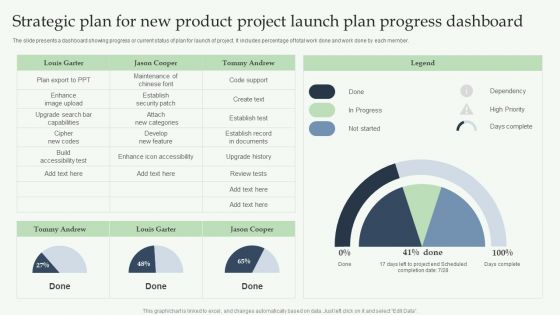
Strategic Plan For New Product Project Launch Plan Progress Dashboard Slides PDF
The slide presents a dashboard showing progress or current status of plan for launch of project. It includes percentage of total work done and work done by each member. Pitch your topic with ease and precision using this Strategic Plan For New Product Project Launch Plan Progress Dashboard Slides PDF. This layout presents information on Louis Garter, Dependency, High Priority. It is also available for immediate download and adjustment. So, changes can be made in the color, design, graphics or any other component to create a unique layout.
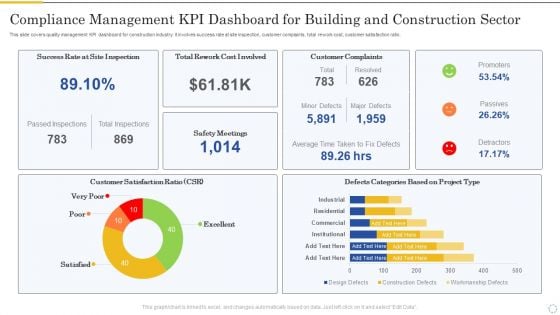
Compliance Management Kpi Dashboard For Building And Construction Sector Inspiration PDF
This slide covers quality management KPI dashboard for construction industry. It involves success rate at site inspection, customer complaints, total rework cost, customer satisfaction ratio. Pitch your topic with ease and precision using this Compliance Management Kpi Dashboard For Building And Construction Sector Inspiration PDF. This layout presents information on Customer Complaints, Customer Satisfaction, Safety Meetings. It is also available for immediate download and adjustment. So, changes can be made in the color, design, graphics or any other component to create a unique layout.
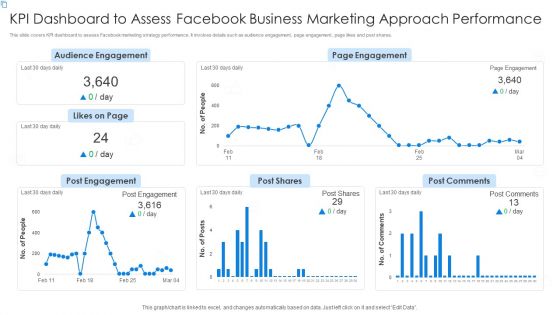
KPI Dashboard To Assess Facebook Business Marketing Approach Performance Portrait PDF
This slide covers KPI dashboard to assess Facebook marketing strategy performance. It involves details such as audience engagement, page engagement, page likes and post shares. Pitch your topic with ease and precision using this KPI Dashboard To Assess Facebook Business Marketing Approach Performance Portrait PDF. This layout presents information on Audience Engagement, Page Engagement, Post Comments. It is also available for immediate download and adjustment. So, changes can be made in the color, design, graphics or any other component to create a unique layout.
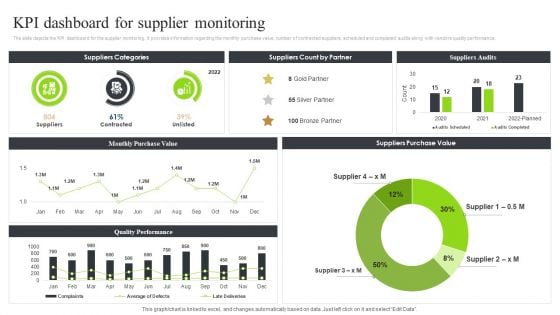
Strategic Sourcing And Supplier Quality Kpi Dashboard For Supplier Monitoring Graphics PDF
The slide depicts the KPI dashboard for the supplier monitoring. It provides information regarding the monthly purchase value, number of contracted suppliers, scheduled and completed audits along with vendors quality performance.Take your projects to the next level with our ultimate collection of Strategic Sourcing And Supplier Quality Kpi Dashboard For Supplier Monitoring Graphics PDF. Slidegeeks has designed a range of layouts that are perfect for representing task or activity duration, keeping track of all your deadlines at a glance. Tailor these designs to your exact needs and give them a truly corporate look with your own brand colors they all make your projects stand out from the rest.
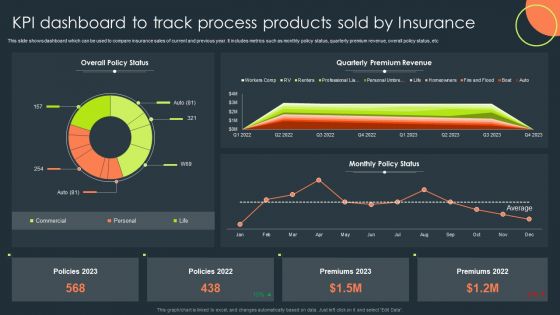
KPI Dashboard To Track Process Products Sold By Insurance Topics PDF
This slide shows dashboard which can be used to compare insurance sales of current and previous year. It includes metrics such as monthly policy status, quarterly premium revenue, overall policy status, etc. Pitch your topic with ease and precision using this KPI Dashboard To Track Process Products Sold By Insurance Topics PDF. This layout presents information on Overall Policy Status, Quarterly Premium Revenue, Monthly Policy Status. It is also available for immediate download and adjustment. So, changes can be made in the color, design, graphics or any other component to create a unique layout.
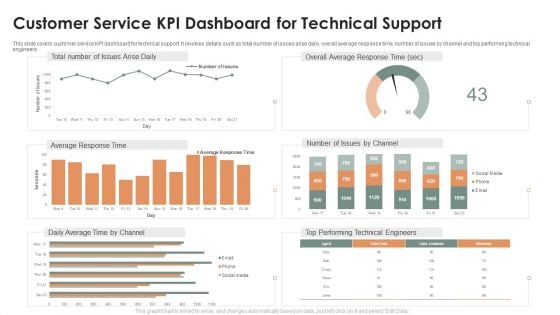
Customer Service KPI Dashboard For Technical Support Ppt Model Vector PDF
This slide covers customer service KPI dashboard for technical support. It involves details such as total number of issues arise daily, overall average response time, number of issues by channel and top performing technical engineers. Pitch your topic with ease and precision using this Customer Service KPI Dashboard For Technical Support Ppt Model Vector PDF. This layout presents information on Overall Average, Response Time, Total Number, Issues Arise Daily. It is also available for immediate download and adjustment. So, changes can be made in the color, design, graphics or any other component to create a unique layout.
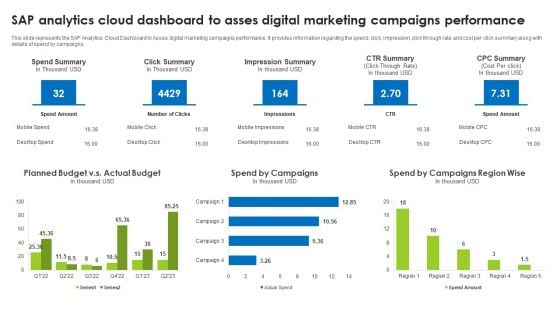
Sap Analytics Cloud Dashboard To Asses Digital Marketing Campaigns Performance Ideas PDF
This slide represents the SAP Analytics Cloud Dashboard to Asses digital marketing campaigns performance. It provides information regarding the spend, click, impression, click through rate and cost per click summary along with details of spend by campaigns. The best PPT templates are a great way to save time, energy, and resources. Slidegeeks have 100 percent editable powerpoint slides making them incredibly versatile. With these quality presentation templates, you can create a captivating and memorable presentation by combining visually appealing slides and effectively communicating your message. Download Sap Analytics Cloud Dashboard To Asses Digital Marketing Campaigns Performance Ideas PDF from Slidegeeks and deliver a wonderful presentation.
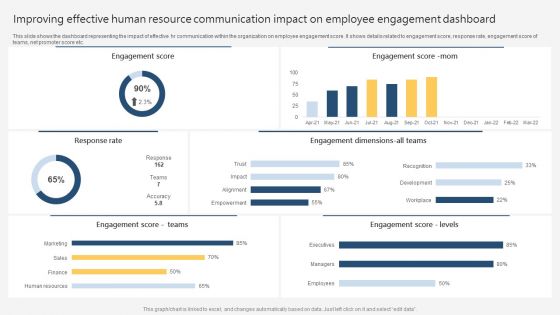
Improving Effective Human Resource Communication Impact On Employee Engagement Dashboard Slides PDF
This slide shows the dashboard representing the impact of effective hr communication within the organization on employee engagement score. It shows details related to engagement score, response rate, engagement score of teams, net promoter score etc. Pitch your topic with ease and precision using this Improving Effective Human Resource Communication Impact On Employee Engagement Dashboard Slides PDF. This layout presents information on Engagement Score, Response Rate, Engagement Score Levels. It is also available for immediate download and adjustment. So, changes can be made in the color, design, graphics or any other component to create a unique layout.
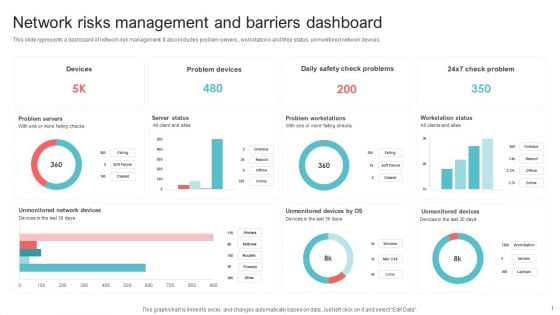
Network Risks Management And Barriers Dashboard Ppt PowerPoint Presentation Gallery Graphic Tips PDF
This slide represents a dashboard of network risk management. It also includes problem servers , workstations and their status, unmonitored network devices. Pitch your topic with ease and precision using this Network Risks Management And Barriers Dashboard Ppt PowerPoint Presentation Gallery Graphic Tips PDF. This layout presents information on Problem Servers, Server Status, Problem Workstations, Workstation Status. It is also available for immediate download and adjustment. So, changes can be made in the color, design, graphics or any other component to create a unique layout.
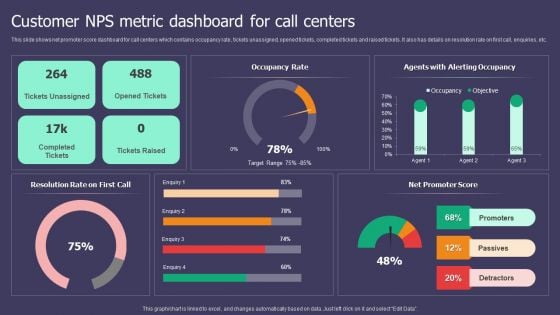
Customer NPS Metric Dashboard For Call Centers Ppt Inspiration Smartart PDF
This slide shows net promoter score dashboard for call centers which contains occupancy rate, tickets unassigned, opened tickets, completed tickets and raised tickets. It also has details on resolution rate on first call, enquiries, etc. Pitch your topic with ease and precision using this Customer NPS Metric Dashboard For Call Centers Ppt Inspiration Smartart PDF. This layout presents information on Occupancy Rate, Resolution Rate, Net Promoter Score. It is also available for immediate download and adjustment. So, changes can be made in the color, design, graphics or any other component to create a unique layout.
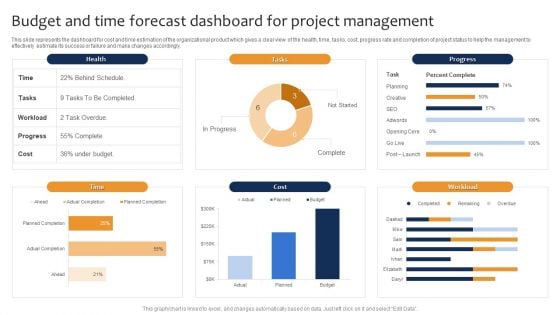
Budget And Time Forecast Dashboard For Project Management Ppt Pictures Format Ideas PDF
This slide represents the dashboard for cost and time estimation of the organizational product which gives a clear view of the health, time, tasks, cost, progress rate and completion of project status to help the management to effectively estimate its success or failure and make changes accordingly. Pitch your topic with ease and precision using this Budget And Time Forecast Dashboard For Project Management Ppt Pictures Format Ideas PDF. This layout presents information on Health, Progress, Cost, Workload. It is also available for immediate download and adjustment. So, changes can be made in the color, design, graphics or any other component to create a unique layout.
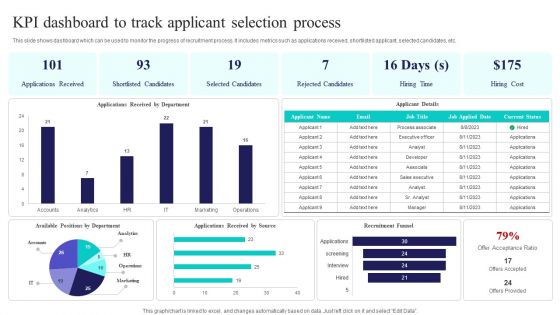
Kpi Dashboard To Track Applicant Selection Process Ppt PowerPoint Presentation File Graphics Template PDF
This slide shows dashboard which can be used to monitor the progress of recruitment process. It includes metrics such as applications received, shortlisted applicant, selected candidates, etc. Pitch your topic with ease and precision using this Kpi Dashboard To Track Applicant Selection Process Ppt PowerPoint Presentation File Graphics Template PDF. This layout presents information on Applications Received, Shortlisted Candidates, Selected Candidates. It is also available for immediate download and adjustment. So, changes can be made in the color, design, graphics or any other component to create a unique layout.
Agile Approaches For IT Team Playbook Agile Project Management Activities Tracking Dashboard Rules PDF
This slide provides information regarding the dashboard which will help team in managing different activities associated to agile projects and keep track on the time, task summary, etc. Find a pre designed and impeccable Agile Approaches For IT Team Playbook Agile Project Management Activities Tracking Dashboard Rules PDF. The templates can ace your presentation without additional effort. You can download these easy to edit presentation templates to make your presentation stand out from others. So, what are you waiting for Download the template from Slidegeeks today and give a unique touch to your presentation.
Developing Brand Awareness To Gain Customer Attention Different Brands Performance Tracking Dashboard Introduction PDF
This slide provides information regarding different brands performance tracking dashboard in terms of brand metric, brand commitment, advertising metrics, and purchase metrics. Make sure to capture your audiences attention in your business displays with our gratis customizable Developing Brand Awareness To Gain Customer Attention Different Brands Performance Tracking Dashboard Introduction PDF. These are great for business strategies, office conferences, capital raising or task suggestions. If you desire to acquire more customers for your tech business and ensure they stay satisfied, create your own sales presentation with these plain slides.
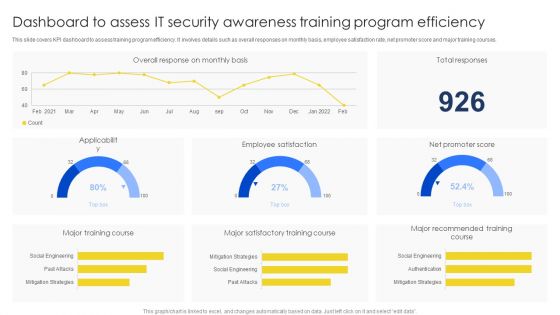
Dashboard To Assess IT Security Awareness Training Program Efficiency Brochure PDF
This slide covers KPI dashboard to assess training program efficiency. It involves details such as overall responses on monthly basis, employee satisfaction rate, net promoter score and major training courses. Pitch your topic with ease and precision using this Dashboard To Assess IT Security Awareness Training Program Efficiency Brochure PDF. This layout presents information on Major Training Course, Major Satisfactory, Training Course. It is also available for immediate download and adjustment. So, changes can be made in the color, design, graphics or any other component to create a unique layout.
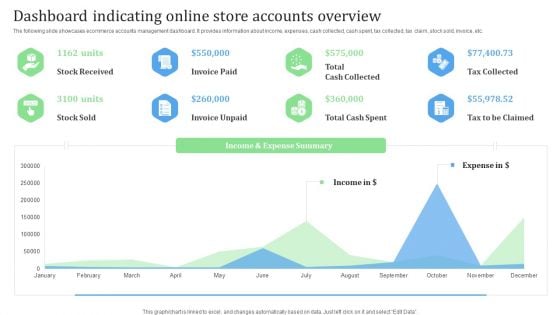
Dashboard Indicating Online Store Accounts Overview Financial Management Strategies Clipart PDF
The following slide showcases ecommerce accounts management dashboard. It provides information about income, expenses, cash collected, cash spent, tax collected, tax claim, stock sold, invoice, etc.From laying roadmaps to briefing everything in detail, our templates are perfect for you. You can set the stage with your presentation slides. All you have to do is download these easy-to-edit and customizable templates. Dashboard Indicating Online Store Accounts Overview Financial Management Strategies Clipart PDF will help you deliver an outstanding performance that everyone would remember and praise you for. Do download this presentation today.
Corporate Financial Performance Tracking Dashboard Ppt PowerPoint Presentation File Pictures PDF
This slide provides information regarding dashboard utilized by firm to monitor financial performance. The performance is tracked through revenues generated, vendors associated, profit generated, etc. Find a pre designed and impeccable Corporate Financial Performance Tracking Dashboard Ppt PowerPoint Presentation File Pictures PDF. The templates can ace your presentation without additional effort. You can download these easy to edit presentation templates to make your presentation stand out from others. So, what are you waiting for Download the template from Slidegeeks today and give a unique touch to your presentation.
Construction Project Instructions Playbook Ongoing Construction Project Progress Tracking Dashboard Infographics PDF
This slide provides information regarding ongoing construction project progress tracking dashboard along with details such as project status, project type, project progress, etc. This modern and well arranged Construction Project Instructions Playbook Ongoing Construction Project Progress Tracking Dashboard Infographics PDF provides lots of creative possibilities. It is very simple to customize and edit with the Powerpoint Software. Just drag and drop your pictures into the shapes. All facets of this template can be edited with Powerpoint no extra software is necessary. Add your own material, put your images in the places assigned for them, adjust the colors, and then you can show your slides to the world, with an animated slide included.
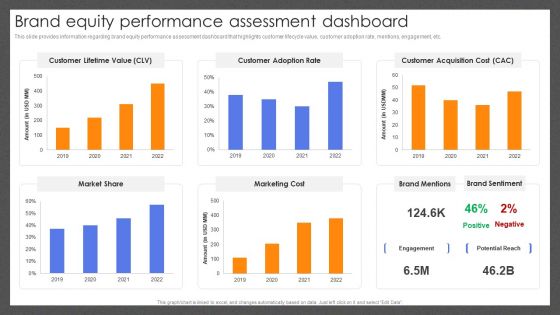
Guide For Effective Brand Brand Equity Performance Assessment Dashboard Diagrams PDF
This slide provides information regarding brand equity performance assessment dashboard that highlights customer lifecycle value, customer adoption rate, mentions, engagement, etc. Present like a pro with Guide For Effective Brand Brand Equity Performance Assessment Dashboard Diagrams PDF Create beautiful presentations together with your team, using our easy-to-use presentation slides. Share your ideas in real-time and make changes on the fly by downloading our templates. So whether youre in the office, on the go, or in a remote location, you can stay in sync with your team and present your ideas with confidence. With Slidegeeks presentation got a whole lot easier. Grab these presentations today.
Guide For Effective Brand Customer Tracking Dashboard To Monitor Brand Loyalty Sample PDF
This slide provides information brand loyalty tracking dashboard in order to monitor customer engagement, average revenues, new vs. returning visitors performance, etc. This modern and well-arranged Guide For Effective Brand Customer Tracking Dashboard To Monitor Brand Loyalty Sample PDF provides lots of creative possibilities. It is very simple to customize and edit with the Powerpoint Software. Just drag and drop your pictures into the shapes. All facets of this template can be edited with Powerpoint, no extra software is necessary. Add your own material, put your images in the places assigned for them, adjust the colors, and then you can show your slides to the world, with an animated slide included.
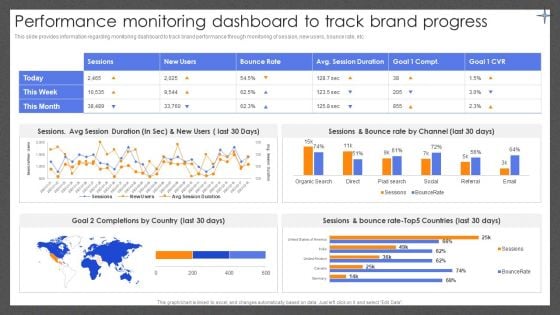
Guide For Effective Brand Performance Monitoring Dashboard To Track Brand Progress Ideas PDF
This slide provides information regarding monitoring dashboard to track brand performance through monitoring of session, new users, bounce rate, etc. Want to ace your presentation in front of a live audience Our Guide For Effective Brand Performance Monitoring Dashboard To Track Brand Progress Ideas PDF can help you do that by engaging all the users towards you. Slidegeeks experts have put their efforts and expertise into creating these impeccable powerpoint presentations so that you can communicate your ideas clearly. Moreover, all the templates are customizable, and easy-to-edit and downloadable. Use these for both personal and commercial use.
Guide For Effective Brand Rebranding Performance Tracking Dashboard To Track Microsoft PDF
This slide provides information regarding rebranding performance tracking dashboard in order to track renewed brand. It includes details about total spent, total link clicks, total conversations, etc. From laying roadmaps to briefing everything in detail, our templates are perfect for you. You can set the stage with your presentation slides. All you have to do is download these easy-to-edit and customizable templates. Guide For Effective Brand Rebranding Performance Tracking Dashboard To Track Microsoft PDF will help you deliver an outstanding performance that everyone would remember and praise you for. Do download this presentation today.
Efficient Administration Of Product Business And Umbrella Branding Product Branding Performance Tracking Dashboard Background PDF
This slide provides information regarding product branding performance tracking dashboard in terms of revenues, new customers, customer satisfaction rate. Make sure to capture your audiences attention in your business displays with our gratis customizable Efficient Administration Of Product Business And Umbrella Branding Product Branding Performance Tracking Dashboard Background PDF. These are great for business strategies, office conferences, capital raising or task suggestions. If you desire to acquire more customers for your tech business and ensure they stay satisfied, create your own sales presentation with these plain slides.
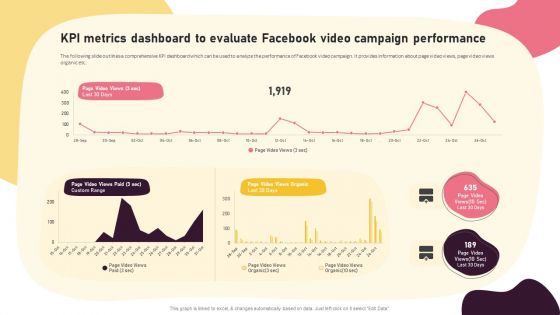
Video Promotion Techniques KPI Metrics Dashboard To Evaluate Facebook Video Introduction PDF
The following slide outlines a comprehensive KPI dashboard which can be used to analyze the performance of Facebook video campaign. It provides information about page video views, page video views organic etc. The best PPT templates are a great way to save time, energy, and resources. Slidegeeks have 100 percent editable powerpoint slides making them incredibly versatile. With these quality presentation templates, you can create a captivating and memorable presentation by combining visually appealing slides and effectively communicating your message. Download Video Promotion Techniques KPI Metrics Dashboard To Evaluate Facebook Video Introduction PDF from Slidegeeks and deliver a wonderful presentation.
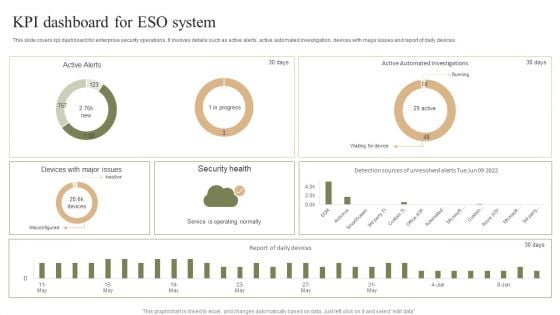
KPI Dashboard For ESO System Ppt PowerPoint Presentation File Template PDF
This slide covers kpi dashboard for enterprise security operations. It involves details such as active alerts, active automated investigation, devices with major issues and report of daily devices. Pitch your topic with ease and precision using this KPI Dashboard For ESO System Ppt PowerPoint Presentation File Template PDF. This layout presents information on Security Health, Misconfigured, Service Operating Normally. It is also available for immediate download and adjustment. So, changes can be made in the color, design, graphics or any other component to create a unique layout.
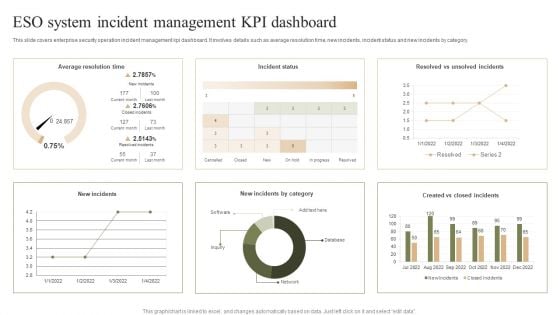
ESO System Incident Management KPI Dashboard Ppt PowerPoint Presentation File Graphic Images PDF
This slide covers enterprise security operation incident management kpi dashboard. It involves details such as average resolution time, new incidents, incident status and new incidents by category. Pitch your topic with ease and precision using this ESO System Incident Management KPI Dashboard Ppt PowerPoint Presentation File Graphic Images PDF. This layout presents information on Average Resolution Time, Incident Status, New Incidents. It is also available for immediate download and adjustment. So, changes can be made in the color, design, graphics or any other component to create a unique layout.
Issues Tracking Dashboard For Organizational Building Management Ppt Infographics Topics PDF
This slide showcases dashboard which can help organization to keep track of issues plus faults during facility management and rectify them within stipulated time. Its key elements are issues reported, fault tracking, etc. Pitch your topic with ease and precision using this Issues Tracking Dashboard For Organizational Building Management Ppt Infographics Topics PDF. This layout presents information on Fault Tracking, Issues Reported, Location. It is also available for immediate download and adjustment. So, changes can be made in the color, design, graphics or any other component to create a unique layout.
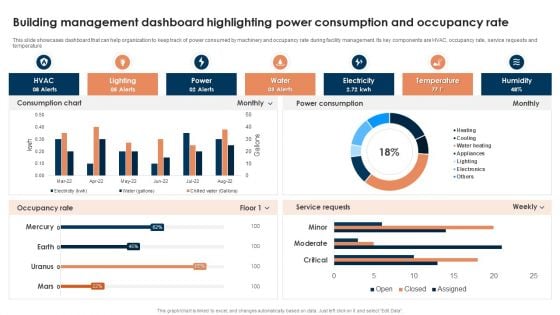
Building Management Dashboard Highlighting Power Consumption And Occupancy Rate Template PDF
This slide showcases dashboard that can help organization to keep track of power consumed by machinery and occupancy rate during facility management. Its key components are HVAC, occupancy rate, service requests and temperature. Pitch your topic with ease and precision using this Building Management Dashboard Highlighting Power Consumption And Occupancy Rate Template PDF. This layout presents information on Lighting, Power, Water, Electricity, Temperature. It is also available for immediate download and adjustment. So, changes can be made in the color, design, graphics or any other component to create a unique layout.
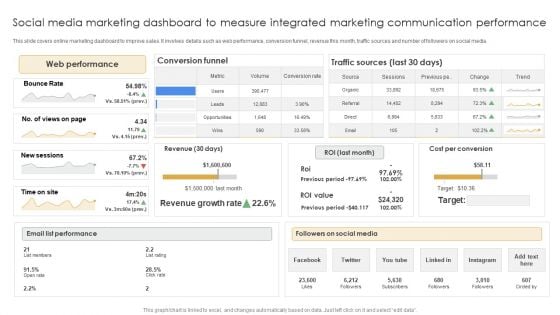
Social Media Marketing Dashboard To Measure Integrated Marketing Communication Performance Clipart PDF
This slide covers online marketing dashboard to improve sales. It involves details such as web performance, conversion funnel, revenue this month, traffic sources and number of followers on social media. Pitch your topic with ease and precision using this Social Media Marketing Dashboard To Measure Integrated Marketing Communication Performance Clipart PDF. This layout presents information on Web Performance, Email List Performance, Followers Social Media. It is also available for immediate download and adjustment. So, changes can be made in the color, design, graphics or any other component to create a unique layout.
Dashboard To Monitor Department Wise Budget Allocation And Usage Icons PDF
This slide highlights the dashboard to monitor the department wise budget allocation and usage. It provides information regarding the total budget allocated and actual amount spent by multiple organization silos such as marketing, finance, HR. It also contains details of each departments average employee spending, Make sure to capture your audiences attention in your business displays with our gratis customizable Dashboard To Monitor Department Wise Budget Allocation And Usage Icons PDF. These are great for business strategies, office conferences, capital raising or task suggestions. If you desire to acquire more customers for your tech business and ensure they stay satisfied, create your own sales presentation with these plain slides.
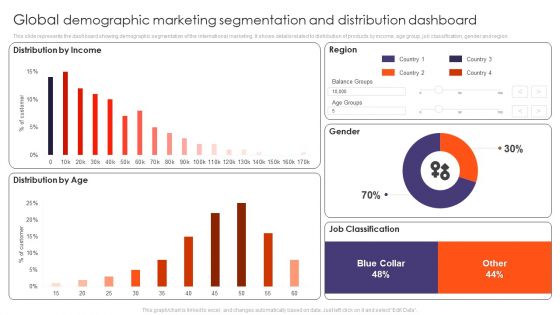
Global Demographic Marketing Segmentation And Distribution Dashboard Ppt Gallery Tips PDF
This slide represents the dashboard showing demographic segmentation of the international marketing. It shows details related to distribution of products by income, age group, job classification, gender and region. Pitch your topic with ease and precision using this Global Demographic Marketing Segmentation And Distribution Dashboard Ppt Gallery Tips PDF. This layout presents information on Distribution Income, Distribution Age, Region, Gender, Job Classification. It is also available for immediate download and adjustment. So, changes can be made in the color, design, graphics or any other component to create a unique layout.
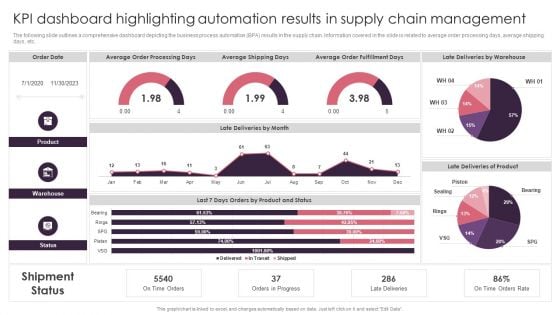
KPI Dashboard Highlighting Automation Results In Supply Chain Management Brochure PDF
The following slide outlines a comprehensive dashboard depicting the business process automation BPA results in the supply chain. Information covered in the slide is related to average order processing days, average shipping days, etc. From laying roadmaps to briefing everything in detail, our templates are perfect for you. You can set the stage with your presentation slides. All you have to do is download these easy to edit and customizable templates. KPI Dashboard Highlighting Automation Results In Supply Chain Management Brochure PDF will help you deliver an outstanding performance that everyone would remember and praise you for. Do download this presentation today.
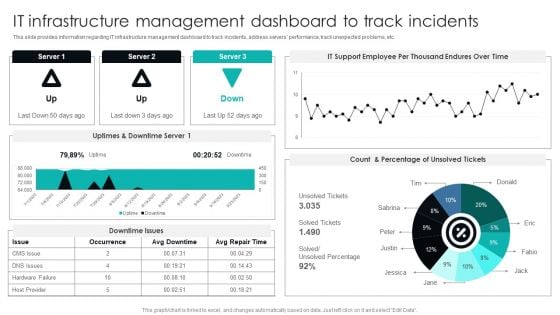
IT Infrastructure Library Procedure Management Playbook IT Infrastructure Management Dashboard To Track Incidents Graphics PDF
This slide provides information regarding IT infrastructure management dashboard to track incidents, address servers performance, track unexpected problems, etc. The best PPT templates are a great way to save time, energy, and resources. Slidegeeks have 100 percent editable powerpoint slides making them incredibly versatile. With these quality presentation templates, you can create a captivating and memorable presentation by combining visually appealing slides and effectively communicating your message. Download IT Infrastructure Library Procedure Management Playbook IT Infrastructure Management Dashboard To Track Incidents Graphics PDF from Slidegeeks and deliver a wonderful presentation.
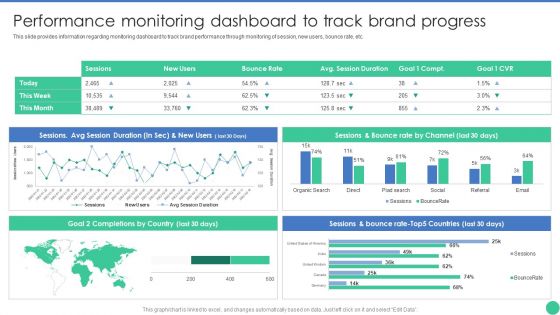
Brand Management To Enhance Performance Monitoring Dashboard To Track Brand Pictures PDF
This slide provides information regarding monitoring dashboard to track brand performance through monitoring of session, new users, bounce rate, etc. Do you know about Slidesgeeks Brand Management To Enhance Performance Monitoring Dashboard To Track Brand Pictures PDF These are perfect for delivering any kind od presentation. Using it, create PowerPoint presentations that communicate your ideas and engage audiences. Save time and effort by using our pre-designed presentation templates that are perfect for a wide range of topic. Our vast selection of designs covers a range of styles, from creative to business, and are all highly customizable and easy to edit. Download as a PowerPoint template or use them as Google Slides themes.
Robotic Process Automation Dashboard With Monthly Test Execution KPI Icons PDF
This slide covers RPA metrics for analyzing test execution on automated platforms. It also includes test execution metrics such as total test executed, test status, tests executed daily for different operation systems, etc. Pitch your topic with ease and precision using this Robotic Process Automation Dashboard With Monthly Test Execution KPI Icons PDF. This layout presents information on Robotic Process Automation Dashboard, Monthly Test Execution Kpi. It is also available for immediate download and adjustment. So, changes can be made in the color, design, graphics or any other component to create a unique layout.
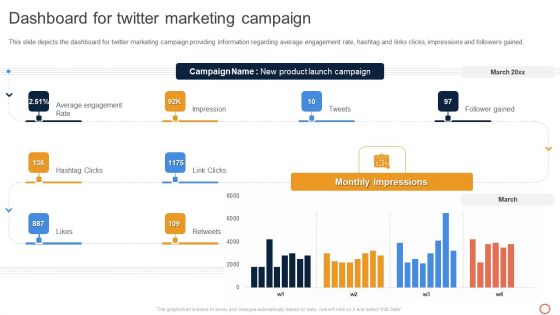
Leveraging Twitter For Social Dashboard For Twitter Marketing Campaign Summary PDF
This slide depicts the dashboard for twitter marketing campaign providing information regarding average engagement rate, hashtag and links clicks, impressions and followers gained. Present like a pro with Leveraging Twitter For Social Dashboard For Twitter Marketing Campaign Summary PDF Create beautiful presentations together with your team, using our easy-to-use presentation slides. Share your ideas in real-time and make changes on the fly by downloading our templates. So whether youre in the office, on the go, or in a remote location, you can stay in sync with your team and present your ideas with confidence. With Slidegeeks presentation got a whole lot easier. Grab these presentations today.
Customer Deal Tracking In Sales Pipeline Dashboard Managing Sales Pipeline Health Formats PDF
This slide covers information regarding dashboard for tracking various customer deals in sales pipeline. Take your projects to the next level with our ultimate collection of Customer Deal Tracking In Sales Pipeline Dashboard Managing Sales Pipeline Health Formats PDF. Slidegeeks has designed a range of layouts that are perfect for representing task or activity duration, keeping track of all your deadlines at a glance. Tailor these designs to your exact needs and give them a truly corporate look with your own brand colors they well make your projects stand out from the rest.
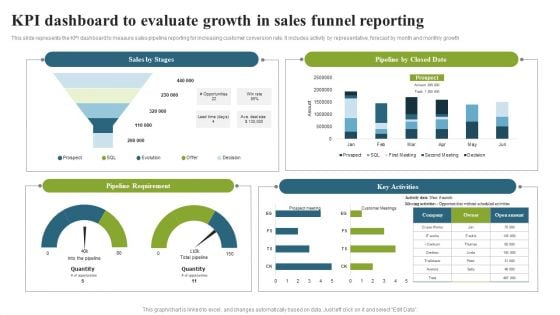
KPI Dashboard To Evaluate Growth In Sales Funnel Reporting Topics PDF
This slide represents the KPI dashboard to measure sales pipeline reporting for increasing customer conversion rate. It includes activity by representative, forecast by month and monthly growth. Pitch your topic with ease and precision using this KPI Dashboard To Evaluate Growth In Sales Funnel Reporting Topics PDF. This layout presents information on Pipeline Requirement, Key Activities, Pipeline Closed Date. It is also available for immediate download and adjustment. So, changes can be made in the color, design, graphics or any other component to create a unique layout.
New Product Launch Product Launch Activities Tracking Dashboard Wd Topics PDF
This slide provides information regarding product launch activities tracking dashboard in terms of project budget, projected launch date, overdue tasks, workload, risks, etc. The best PPT templates are a great way to save time, energy, and resources. Slidegeeks have 100 percent editable powerpoint slides making them incredibly versatile. With these quality presentation templates, you can create a captivating and memorable presentation by combining visually appealing slides and effectively communicating your message. Download New Product Launch Product Launch Activities Tracking Dashboard Wd Topics PDF from Slidegeeks and deliver a wonderful presentation.
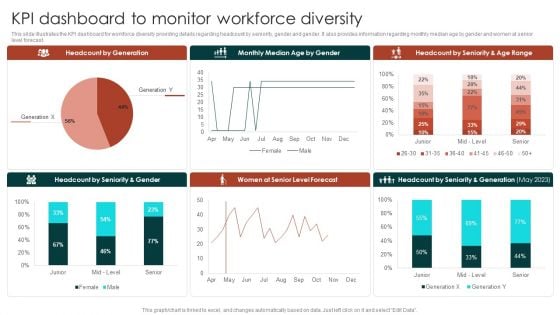
Diversity Management Plan To Improve Workplace Culture KPI Dashboard To Monitor Workforce Microsoft PDF
This slide illustrates the KPI dashboard for workforce diversity providing details regarding headcount by seniority, gender and gender. It also provides information regarding monthly median age by gender and women at senior level forecast.Find a pre-designed and impeccable Diversity Management Plan To Improve Workplace Culture KPI Dashboard To Monitor Workforce Microsoft PDF. The templates can ace your presentation without additional effort. You can download these easy-to-edit presentation templates to make your presentation stand out from others. So, what are you waiting for. Download the template from Slidegeeks today and give a unique touch to your presentation.

Effective Brand Reputation Management Brand Equity Performance Assessment Dashboard Slides PDF
This slide provides information regarding brand equity performance assessment dashboard that highlights customer lifecycle value, customer adoption rate, mentions, engagement, etc. If your project calls for a presentation, then Slidegeeks is your go-to partner because we have professionally designed, easy-to-edit templates that are perfect for any presentation. After downloading, you can easily edit Effective Brand Reputation Management Brand Equity Performance Assessment Dashboard Slides PDF and make the changes accordingly. You can rearrange slides or fill them with different images. Check out all the handy templates.
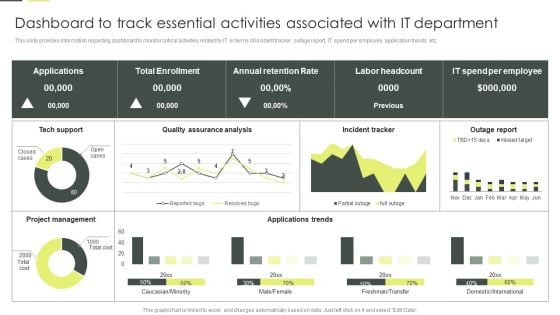
Dashboard To Track Essential Activities Associated With IT Department Brochure PDF
This slide provides information regarding dashboard to monitor critical activities related to IT in terms of incident tracker, outage report, IT spend per employee, application trends, etc. Slidegeeks is one of the best resources for PowerPoint templates. You can download easily and regulate Dashboard To Track Essential Activities Associated With IT Department Brochure PDF for your personal presentations from our wonderful collection. A few clicks is all it takes to discover and get the most relevant and appropriate templates. Use our Templates to add a unique zing and appeal to your presentation and meetings. All the slides are easy to edit and you can use them even for advertisement purposes.
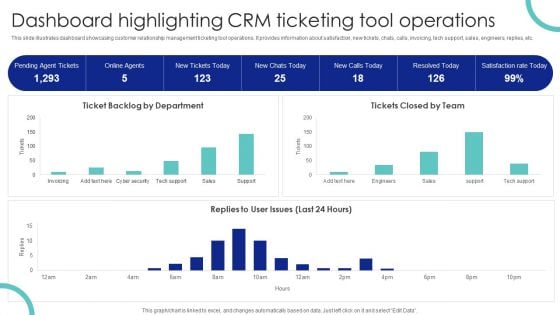
Dashboard Highlighting CRM Ticketing Tool Operations Ppt PowerPoint Presentation File Professional PDF
This slide illustrates dashboard showcasing customer relationship management ticketing tool operations. It provides information about satisfaction, new tickets, chats, calls, invoicing, tech support, sales, engineers, replies, etc. Want to ace your presentation in front of a live audience Our Dashboard Highlighting CRM Ticketing Tool Operations Ppt PowerPoint Presentation File Professional PDF can help you do that by engaging all the users towards you. Slidegeeks experts have put their efforts and expertise into creating these impeccable powerpoint presentations so that you can communicate your ideas clearly. Moreover, all the templates are customizable, and easy to edit and downloadable. Use these for both personal and commercial use.
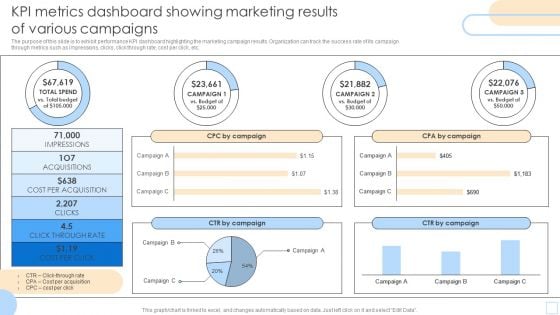
KPI Metrics Dashboard Showing Marketing Results Of Various Campaigns Pictures PDF
The purpose of this slide is to exhibit performance KPI dashboard highlighting the marketing campaign results. Organization can track the success rate of its campaign through metrics such as impressions, clicks, click through rate, cost per click, etc. Pitch your topic with ease and precision using this KPI Metrics Dashboard Showing Marketing Results Of Various Campaigns Pictures PDF. This layout presents information on Impressions, Acquisitions, CPA By Campaign. It is also available for immediate download and adjustment. So, changes can be made in the color, design, graphics or any other component to create a unique layout.
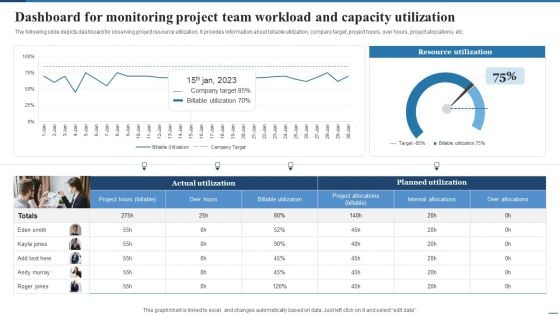
Dashboard For Monitoring Project Team Workload And Capacity Utilization Background PDF
The following slide depicts dashboard for observing project resource utilization. It provides information about billable utilization, company target, project hours, over hours, project allocations, etc.Present like a pro with Dashboard For Monitoring Project Team Workload And Capacity Utilization Background PDF Create beautiful presentations together with your team, using our easy-to-use presentation slides. Share your ideas in real-time and make changes on the fly by downloading our templates. So whether you are in the office, on the go, or in a remote location, you can stay in sync with your team and present your ideas with confidence. With Slidegeeks presentation got a whole lot easier. Grab these presentations today.
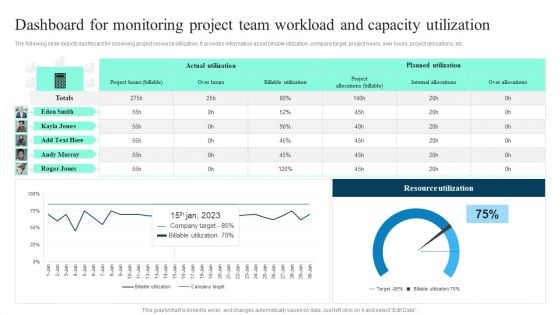
Dashboard For Monitoring Project Team Workload And Capacity Utilization Topics PDF
The following slide depicts dashboard for observing project resource utilization. It provides information about billable utilization, company target, project hours, over hours, project allocations, etc. Take your projects to the next level with our ultimate collection of Dashboard For Monitoring Project Team Workload And Capacity Utilization Topics PDF. Slidegeeks has designed a range of layouts that are perfect for representing task or activity duration, keeping track of all your deadlines at a glance. Tailor these designs to your exact needs and give them a truly corporate look with your own brand colors they will make your projects stand out from the rest.
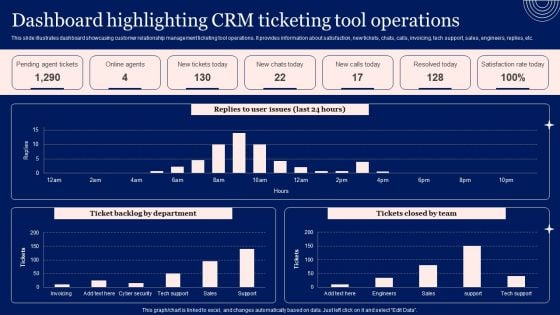
Implementing Advanced Service Help Desk Administration Program Dashboard Highlighting CRM Ticketing Tool Operations Mockup PDF
This slide illustrates dashboard showcasing customer relationship management ticketing tool operations. It provides information about satisfaction, new tickets, chats, calls, invoicing, tech support, sales, engineers, replies, etc. Want to ace your presentation in front of a live audience Our Implementing Advanced Service Help Desk Administration Program Dashboard Highlighting CRM Ticketing Tool Operations Mockup PDF can help you do that by engaging all the users towards you.. Slidegeeks experts have put their efforts and expertise into creating these impeccable powerpoint presentations so that you can communicate your ideas clearly. Moreover, all the templates are customizable, and easy-to-edit and downloadable. Use these for both personal and commercial use.
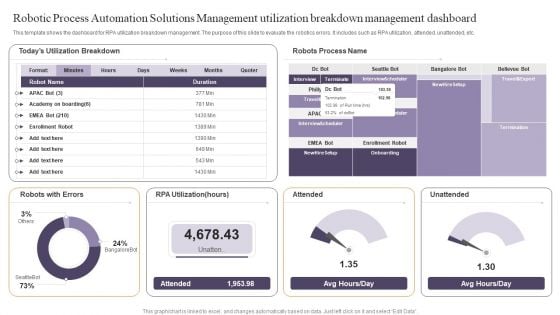
Robotic Process Automation Solutions Management Utilization Breakdown Management Dashboard Pictures PDF
This template shows the dashboard for RPA utilization breakdown management. The purpose of this slide to evaluate the robotics errors. It includes such as RPA utilization, attended, unattended, etc. Pitch your topic with ease and precision using this Robotic Process Automation Solutions Management Utilization Breakdown Management Dashboard Pictures PDF. This layout presents information on Robots With Errors, Utilization, Unattended. It is also available for immediate download and adjustment. So, changes can be made in the color, design, graphics or any other component to create a unique layout.


 Continue with Email

 Home
Home


