Data Dashboard
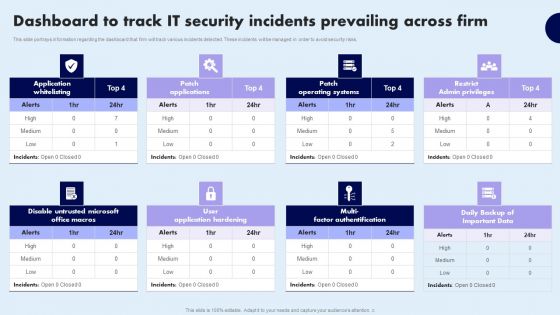
Dashboard To Track IT Security Incidents Prevailing Across Firm Demonstration PDF
This slide portrays information regarding the dashboard that firm will track various incidents detected. These incidents will be managed in order to avoid security risks. Do you have an important presentation coming up Are you looking for something that will make your presentation stand out from the rest Look no further than Dashboard To Track IT Security Incidents Prevailing Across Firm Demonstration PDF. With our professional designs, you can trust that your presentation will pop and make delivering it a smooth process. And with Slidegeeks, you can trust that your presentation will be unique and memorable. So why wait Grab Dashboard To Track IT Security Incidents Prevailing Across Firm Demonstration PDF today and make your presentation stand out from the rest
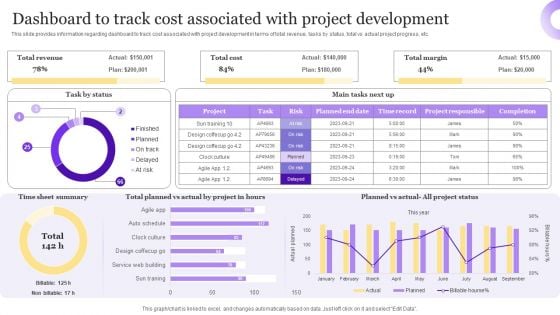
Best Techniques For Agile Project Cost Assessment Dashboard To Track Cost Associated Formats PDF
This slide provides information regarding dashboard to track cost associated with project development in terms of total revenue, tasks by status, total vs actual project progress, etc. Do you have an important presentation coming up Are you looking for something that will make your presentation stand out from the rest Look no further than Best Techniques For Agile Project Cost Assessment Dashboard To Track Cost Associated Formats PDF. With our professional designs, you can trust that your presentation will pop and make delivering it a smooth process. And with Slidegeeks, you can trust that your presentation will be unique and memorable. So why wait Grab Best Techniques For Agile Project Cost Assessment Dashboard To Track Cost Associated Formats PDF today and make your presentation stand out from the rest
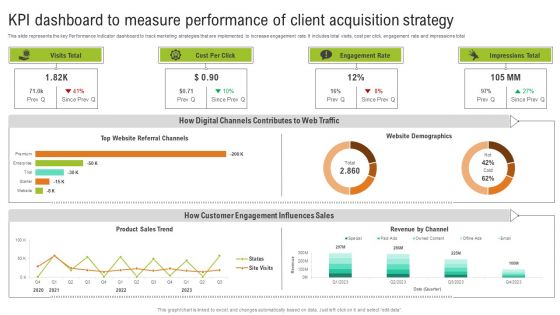
KPI Dashboard To Measure Performance Of Client Acquisition Strategy Slides PDF
This slide represents the key Performance Indicator dashboard to track marketing strategies that are implemented to increase engagement rate. It includes total visits, cost per click, engagement rate and impressions total. Showcasing this set of slides titled KPI Dashboard To Measure Performance Of Client Acquisition Strategy Slides PDF. The topics addressed in these templates are Visits Total, Cost Per Click, Engagement Rate, Impressions Total. All the content presented in this PPT design is completely editable. Download it and make adjustments in color, background, font etc. as per your unique business setting.
Retail Trading Platform Dashboard Tracking Essential Kpis For Ecommerce Performance Diagrams PDF
This slide provides information regarding essential KPIs for ecommerce performance dashboard tracking average bounce rate, new vs. old customers, channel revenue vs. channel acquisitions costs, channel revenue vs. sales, average conversion rate, etc. Deliver an awe inspiring pitch with this creative retail trading platform dashboard tracking essential kpis for ecommerce performance diagrams pdf bundle. Topics like average bounce rate, average conversion rate, bounce rate, channel revenue sales can be discussed with this completely editable template. It is available for immediate download depending on the needs and requirements of the user.

HR Recruitment Dashboard Kpis With Open Positions Ppt Model Good PDF
Following slide showcases the recruitment dashboard metrics for measuring placement per department. It include KPIs like applications received by departments, applicant details, sources, time to hire. Pitch your topic with ease and precision using this HR Recruitment Dashboard Kpis With Open Positions Ppt Model Good PDF. This layout presents information on Offer Acceptance Ratio, Recruitment Funnel, Applicant Details. It is also available for immediate download and adjustment. So, changes can be made in the color, design, graphics or any other component to create a unique layout.
Strategy Playbook For Ecommerce Business Dashboard Tracking Essential Kpis For Ecommerce Performance Rules PDF
This slide provides information regarding essential KPIs for ecommerce performance dashboard tracking average bounce rate, new vs. old customers, channel revenue vs. channel acquisitions costs, channel revenue vs. sales, average conversion rate, etc. Deliver an awe inspiring pitch with this creative Strategy Playbook For Ecommerce Business Dashboard Tracking Essential Kpis For Ecommerce Performance Rules PDF bundle. Topics like Returning Customers, Acquisition Cost, Channel Revenue can be discussed with this completely editable template. It is available for immediate download depending on the needs and requirements of the user.
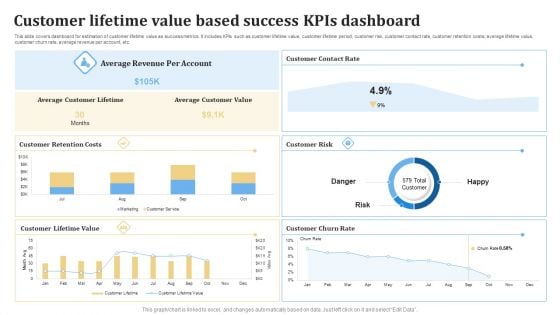
Customer Lifetime Value Based Success KPIS Dashboard Ppt PowerPoint Presentation Layouts Gridlines PDF
This slide covers dashboard for estimation of customer lifetime value as success metrics. It includes KPIs such as customer lifetime value, customer lifetime period, customer risk, customer contact rate, customer retention costs, average lifetime value, customer churn rate, average revenue per account, etc. Pitch your topic with ease and precision using this Customer Lifetime Value Based Success KPIS Dashboard Ppt PowerPoint Presentation Layouts Gridlines PDF. This layout presents information on Average Revenue, Customer Lifetime, Customer Risk. It is also available for immediate download and adjustment. So, changes can be made in the color, design, graphics or any other component to create a unique layout.
Real Estate Sales Tracking Dashboard With Inquiry Referrals Ppt PowerPoint Presentation File Samples PDF
This slide showcases dashboard to track property sales KPIs for smooth flow of operations. It includes information such as rent, social media, digital ads, agent wise sales, etc. Showcasing this set of slides titled Real Estate Sales Tracking Dashboard With Inquiry Referrals Ppt PowerPoint Presentation File Samples PDF. The topics addressed in these templates are Property Inquiry Referrals, Properties Sold And Rent By Agent, Sales By Religion, Sales Target. All the content presented in this PPT design is completely editable. Download it and make adjustments in color, background, font etc. as per your unique business setting.
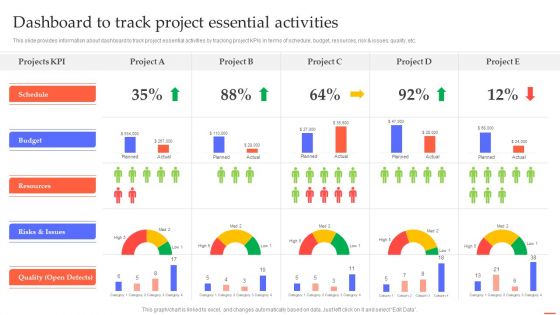
Dashboard To Track Project Essential Activities Efficient Project Administration By Leaders Microsoft PDF
This slide provides information about dashboard to track project essential activities by tracking project KPIs in terms of schedule, budget, resources, risk issues, quality, etc.Boost your pitch with our creative Dashboard To Track Project Essential Activities Efficient Project Administration By Leaders Microsoft PDF. Deliver an awe-inspiring pitch that will mesmerize everyone. Using these presentation templates you will surely catch everyones attention. You can browse the ppts collection on our website. We have researchers who are experts at creating the right content for the templates. So you do not have to invest time in any additional work. Just grab the template now and use them.
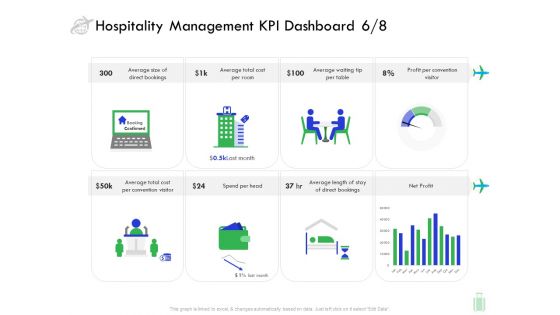
Travel And Leisure Industry Analysis Hospitality Management KPI Dashboard Head Infographics PDF
Presenting this set of slides with name travel and leisure industry analysis hospitality management kpi dashboard head infographics pdf. The topics discussed in these slides are average, cost, convention visitor, net profit. This is a completely editable PowerPoint presentation and is available for immediate download. Download now and impress your audience.
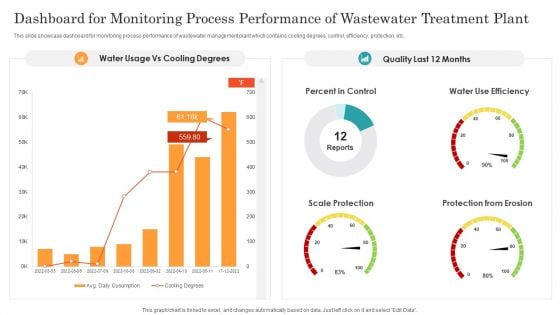
Dashboard For Monitoring Process Performance Of Wastewater Treatment Plant Ppt Infographic Template Demonstration PDF
This slide showcase dashboard for monitoring process performance of wastewater management plant which contains cooling degrees, control, efficiency, protection, etc. Showcasing this set of slides titled Dashboard For Monitoring Process Performance Of Wastewater Treatment Plant Ppt Infographic Template Demonstration PDF. The topics addressed in these templates are Percent Control, Water Use Efficiency, Scale Protection, Protection From Erosion. All the content presented in this PPT design is completely editable. Download it and make adjustments in color, background, font etc. as per your unique business setting.
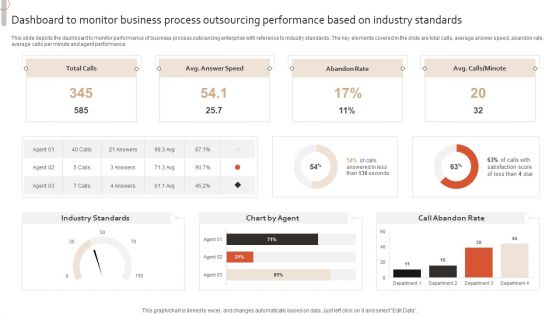
Dashboard To Monitor Business Process Outsourcing Performance Based On Industry Standards Infographics PDF
This slide depicts the dashboard to monitor performance of business process outsourcing enterprise with reference to industry standards. The key elements covered in the slide are total calls, average answer speed, abandon rate, average calls per minute and agent performanc. Showcasing this set of slides titled Dashboard To Monitor Business Process Outsourcing Performance Based On Industry Standards Infographics PDF. The topics addressed in these templates are Industry Standards, Chart By Agent, Call Abandon Rate, Total Calls. All the content presented in this PPT design is completely editable. Download it and make adjustments in color, background, font etc. as per your unique business setting.
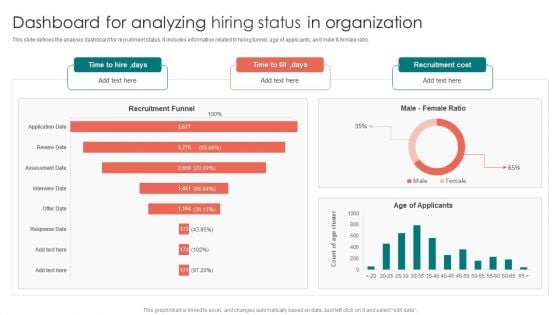
Dashboard For Analyzing Hiring Status In Organization Ppt PowerPoint Presentation Gallery Images PDF
This slide defines the analysis dashboard for recruitment status. It includes information related to hiring funnel, age of applicants, and male and female ratio. Pitch your topic with ease and precision using this Dashboard For Analyzing Hiring Status In Organization Ppt PowerPoint Presentation Gallery Images PDF. This layout presents information on Recruitment Funnel, Time To Hire, Age Applicants. It is also available for immediate download and adjustment. So, changes can be made in the color, design, graphics or any other component to create a unique layout.

KPI Dashboard To Track Sales And Operations Process Of Manufacturing Enterprise Brochure PDF
This slide depicts a dashboard to track the key performance metrics in sales and operations process of a manufacturing enterprise to analyze deviations in the actual and planned output. The key performing indicators are percentage deviation, dollar deviation, inventory in hand etc.Pitch your topic with ease and precision using this KPI Dashboard To Track Sales And Operations Process Of Manufacturing Enterprise Brochure PDF. This layout presents information on Planned Output, Yearly Growth, Inventory Hand. It is also available for immediate download and adjustment. So, changes can be made in the color, design, graphics or any other component to create a unique layout.
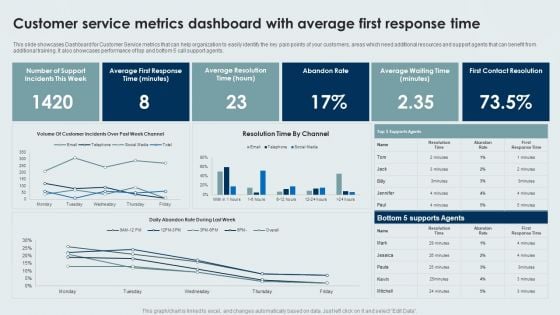
Customer Service Metrics Dashboard With Average First Response Time Background PDF
This slide showcases Dashboard for Customer Service metrics that can help organization to easily identify the key pain points of your customers, areas which need additional resources and support agents that can benefit from additional training. It also showcases performance of top and bottom 5 call support agents. Pitch your topic with ease and precision using this Customer Service Metrics Dashboard With Average First Response Time Background PDF. This layout presents information on Average, Abandon Rate, Contact Resolution. It is also available for immediate download and adjustment. So, changes can be made in the color, design, graphics or any other component to create a unique layout.
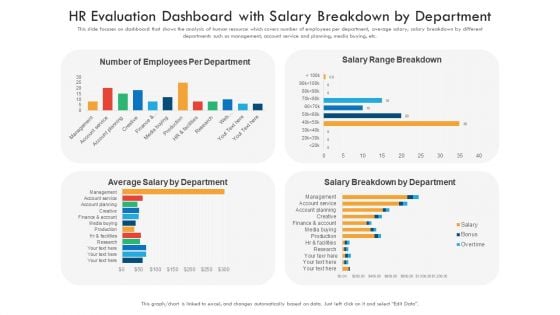
HR Evaluation Dashboard With Salary Breakdown By Department Ppt PowerPoint Presentation Templates PDF
This slide focuses on dashboard that shows the analysis of human resource which covers number of employees per department, average salary, salary breakdown by different departments such as management, account service and planning, media buying, etc. Showcasing this set of slides titled HR evaluation dashboard with salary breakdown by department ppt powerpoint presentation templates pdf. The topics addressed in these templates are finance account, web development, account planning. All the content presented in this PPT design is completely editable. Download it and make adjustments in color, background, font etc. as per your unique business setting.

Risk Assessment Software Dashboard For Cybersecurity Ppt PowerPoint Presentation Gallery Pictures PDF
This slide represents risk assessment software dashboard for cybersecurity. It includes risk percentage, number of risks, risk analysis progress, risk response progress, risk rating etc. Showcasing this set of slides titled Risk Assessment Software Dashboard For Cybersecurity Ppt PowerPoint Presentation Gallery Pictures PDF. The topics addressed in these templates are Risk Rating Breakdown, Action Plan Breakdown, Top 5 Entities Prone To Risk. All the content presented in this PPT design is completely editable. Download it and make adjustments in color, background, font etc. as per your unique business setting.
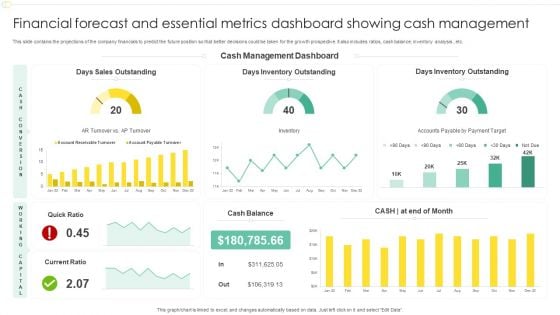
Financial Forecast And Essential Metrics Dashboard Showing Cash Management Designs PDF
This slide contains the projections of the company financials to predict the future position so that better decisions could be taken for the growth prospective. It also includes ratios, cash balance, inventory analysis , etc. Showcasing this set of slides titled Financial Forecast And Essential Metrics Dashboard Showing Cash Management Designs PDF. The topics addressed in these templates are Days Sales Outstanding, Cash Management Dashboard, Days Inventory Outstanding. All the content presented in this PPT design is completely editable. Download it and make adjustments in color, background, font etc. as per your unique business setting.
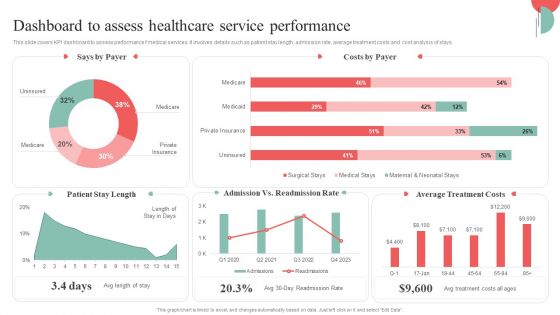
Incorporating HIS To Enhance Healthcare Services Dashboard To Assess Healthcare Service Performance Background PDF
This slide covers KPI dashboard to assess performance f medical services. It involves details such as patient stay length, admission rate, average treatment costs and cost analysis of stays. Boost your pitch with our creative Incorporating HIS To Enhance Healthcare Services Dashboard To Assess Healthcare Service Performance Background PDF. Deliver an awe-inspiring pitch that will mesmerize everyone. Using these presentation templates you will surely catch everyones attention. You can browse the ppts collection on our website. We have researchers who are experts at creating the right content for the templates. So you do not have to invest time in any additional work. Just grab the template now and use them.
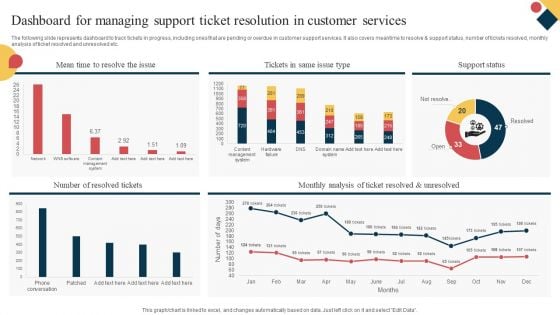
Dashboard For Managing Support Ticket Resolution In Customer Services Ideas PDF
The following slide represents dashboard to track tickets in progress, including ones that are pending or overdue in customer support services. It also covers meantime to resolve and support status, number of tickets resolved, monthly analysis of ticket resolved and unresolved etc. Showcasing this set of slides titled Dashboard For Managing Support Ticket Resolution In Customer Services Ideas PDF. The topics addressed in these templates are Resolved Tickets, Ticket Resolved Unresolved, Support Status. All the content presented in this PPT design is completely editable. Download it and make adjustments in color, background, font etc. as per your unique business setting.
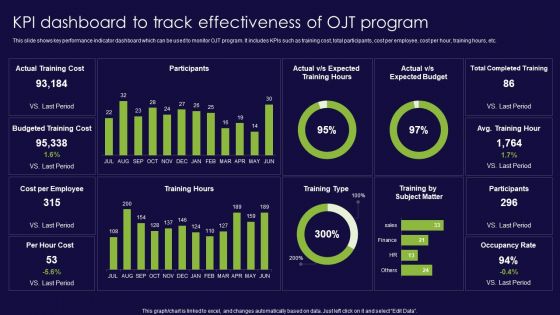
KPI Dashboard To Track Effectiveness Of OJT Program Ppt Gallery Sample PDF
This slide shows key performance indicator dashboard which can be used to monitor OJT program. It includes KPIs such as training cost, total participants, cost per employee, cost per hour, training hours, etc. Showcasing this set of slides titled KPI Dashboard To Track Effectiveness Of OJT Program Ppt Gallery Sample PDF. The topics addressed in these templates are Actual Training Cost, Budgeted Training Cost, Cost per Employee. All the content presented in this PPT design is completely editable. Download it and make adjustments in color, background, font etc. as per your unique business setting.
Dashboard Approach For Various Project Tracking Ppt PowerPoint Presentation Gallery Information PDF
Showcasing this set of slides titled dashboard approach for various project tracking ppt powerpoint presentation gallery information pdf. The topics addressed in these templates are design, define, develop. All the content presented in this PPT design is completely editable. Download it and make adjustments in color, background, font etc. as per your unique business setting.
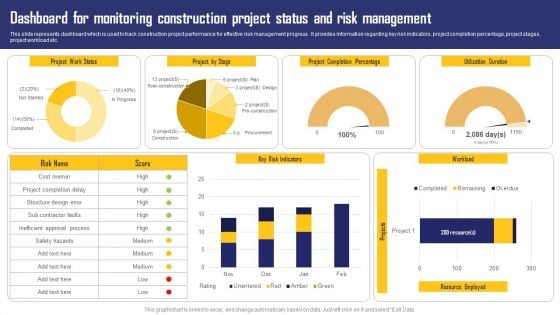
Dashboard For Monitoring Construction Project Status And Risk Management Ideas PDF
This slide represents dashboard which is used to track construction project performance for effective risk management progress . It provides information regarding key risk indicators, project completion percentage, project stages, project workload etc. Pitch your topic with ease and precision using this Dashboard For Monitoring Construction Project Status And Risk Management Ideas PDF. This layout presents information on Project Completion Percentage, Key Risk Indicators, Project By Stage. It is also available for immediate download and adjustment. So, changes can be made in the color, design, graphics or any other component to create a unique layout.
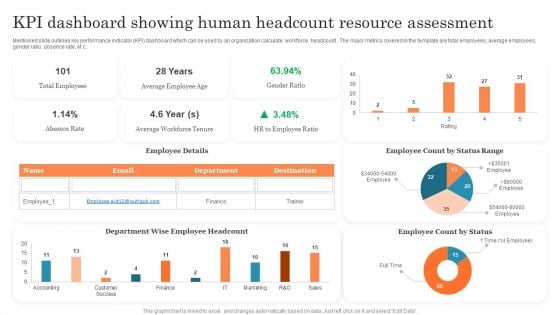
KPI Dashboard Showing Human Headcount Resource Assessment Ppt PowerPoint Presentation Outline PDF
Mentioned slide outlines key performance indicator KPI dashboard which can be used by an organization calculate workforce headcount . The major metrics covered in the template are total employees, average employees, gender ratio, absence rate, etc. Pitch your topic with ease and precision using this KPI Dashboard Showing Human Headcount Resource Assessment Ppt PowerPoint Presentation Outline PDF. This layout presents information on Total Employees, Average Employee, Employee Count. It is also available for immediate download and adjustment. So, changes can be made in the color, design, graphics or any other component to create a unique layout.
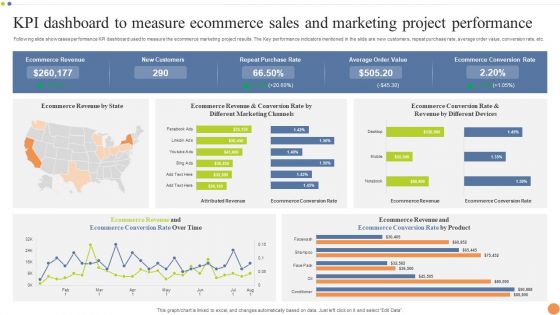
KPI Dashboard To Measure Ecommerce Sales And Marketing Project Performance Portrait PDF
Following slide showcases performance KPI dashboard used to measure the ecommerce marketing project results. The Key performance indicators mentioned in the slide are new customers, repeat purchase rate, average order value, conversion rate, etc. Pitch your topic with ease and precision using this KPI Dashboard To Measure Ecommerce Sales And Marketing Project Performance Portrait PDF. This layout presents information on Purchase Rate, Average Order Value, Ecommerce Conversion Rate. It is also available for immediate download and adjustment. So, changes can be made in the color, design, graphics or any other component to create a unique layout.

Improvement Of Safety Performance At Construction Site Kpi Dashboard To Track Safety Program Microsoft PDF
This slide reflects the key performance indicator dashboard to track the performance of safety program. It includes information regarding the total manpower, manhours, unsafe conditions, lost time injuries frequency, injuries severity rate, along with the training hours. Make sure to capture your audiences attention in your business displays with our gratis customizable Improvement Of Safety Performance At Construction Site Kpi Dashboard To Track Safety Program Microsoft PDF. These are great for business strategies, office conferences, capital raising or task suggestions. If you desire to acquire more customers for your tech business and ensure they stay satisfied, create your own sales presentation with these plain slides.
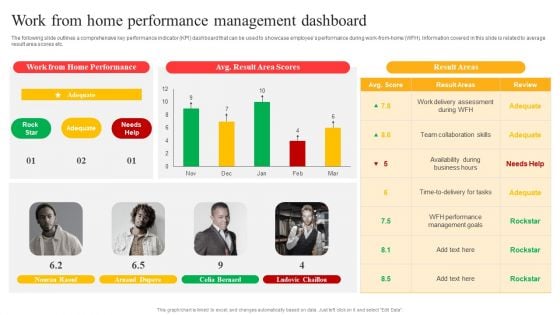
Flexible Working Policies And Guidelines Work From Home Performance Management Dashboard Introduction PDF
The following slide outlines a comprehensive key performance indicator KPI dashboard that can be used to showcase employees performance during work from home WFH. Information covered in this slide is related to average result area scores etc. There are so many reasons you need a Flexible Working Policies And Guidelines Work From Home Performance Management Dashboard Introduction PDF. The first reason is you cannot spend time making everything from scratch, Thus, Slidegeeks has made presentation templates for you too. You can easily download these templates from our website easily.
Dashboard For Enterprise Recruitment With Time To Hire And Fill Icons PDF
In this slide corporate staffing dashboard highlights important recruitment KPIs to review application trends and candidate response to job vacancy. It further includes details about application, review, assessment, interview, etc. Showcasing this set of slides titled Dashboard For Enterprise Recruitment With Time To Hire And Fill Icons PDF. The topics addressed in these templates are Key Metrics, Experienced Ratio, Applicants. All the content presented in this PPT design is completely editable. Download it and make adjustments in color, background, font etc. as per your unique business setting.
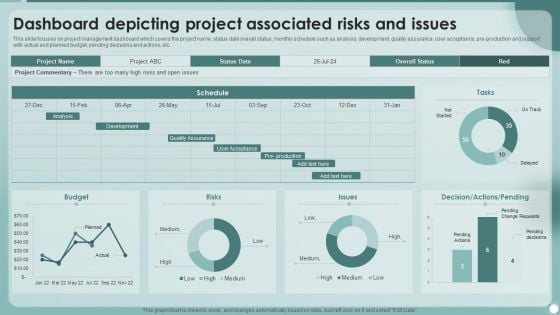
Strategies To Enhance Project Management Process Dashboard Depicting Project Associated Risks And Issues Background PDF
This slide focuses on project management dashboard which covers the project name, status date overall status, monthly schedule such as analysis, development, quality assurance, user acceptance, pre production and support with actual and planned budget, pending decisions and actions, etc. Deliver and pitch your topic in the best possible manner with this Strategies To Enhance Project Management Process Dashboard Depicting Project Associated Risks And Issues Background PDF. Use them to share invaluable insights on Quality Assurance, Development, Analysis and impress your audience. This template can be altered and modified as per your expectations. So, grab it now.
Online Risk Management Dashboard For Tracking Threats And Attacks Icons PDF
The purpose of this slide is to represent dashboard to monitor risks and cyber threats for efficient risk management. It includes various types of key performance indicators such as types of risks, severities, sources and risk meter. Showcasing this set of slides titled Online Risk Management Dashboard For Tracking Threats And Attacks Icons PDF. The topics addressed in these templates are Attack, Indication Severities, Sources. All the content presented in this PPT design is completely editable. Download it and make adjustments in color, background, font etc. as per your unique business setting.
E2E Quality Assurance And Testing In Developer Operations IT Tracking Devops Dashboard Guidelines PDF Mockup PDF
This slide provides information regarding essential quality management activities tracking dashboard in DevOps in terms of quality health such as static analysis, code coverage and unit tests. Deliver and pitch your topic in the best possible manner with this e2e quality assurance and testing in developer operations it tracking devops dashboard guidelines pdf mockup pdf Use them to share invaluable insights on iteration performance, release quality, engagement level and impress your audience. This template can be altered and modified as per your expectations. So, grab it now.
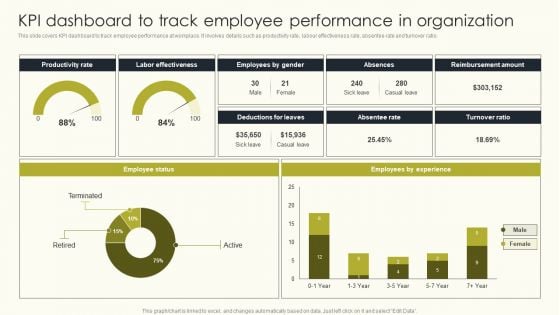
Employee Performance Management To Enhance Organizational Growth KPI Dashboard To Track Employee Topics PDF
The Employee Performance Management To Enhance Organizational Growth KPI Dashboard To Track Employee Topics PDF is a compilation of the most recent design trends as a series of slides. It is suitable for any subject or industry presentation, containing attractive visuals and photo spots for businesses to clearly express their messages. This template contains a variety of slides for the user to input data, such as structures to contrast two elements, bullet points, and slides for written information. Slidegeeks is prepared to create an impression.
SEO Tracking Dashboard For Backlinks And Keywords Ppt PowerPoint Presentation File Deck PDF
Purpose of the following slide is to measure the SEO performance of the organization as it measures the keywords, backlinks, the total number of sessions and average call duration The SEO Tracking Dashboard For Backlinks And Keywords Ppt PowerPoint Presentation File Deck PDF is a compilation of the most recent design trends as a series of slides. It is suitable for any subject or industry presentation, containing attractive visuals and photo spots for businesses to clearly express their messages. This template contains a variety of slides for the user to input data, such as structures to contrast two elements, bullet points, and slides for written information. Slidegeeks is prepared to create an impression.
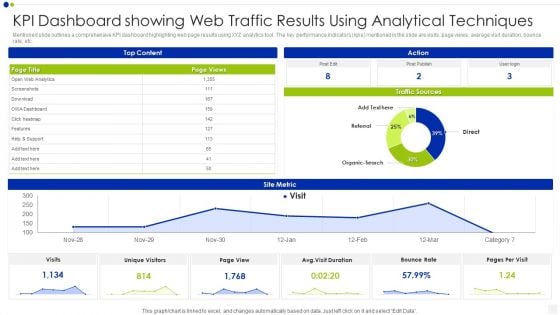
KPI Dashboard Showing Web Traffic Results Using Analytical Techniques Inspiration PDF
Mentioned slide outlines a comprehensive KPI dashboard highlighting web page results using XYZ analytics tool. The key performance indicators kpis mentioned in the slide are visits, page views, average visit duration, bounce rate, etc. Pitch your topic with ease and precision using this kpi dashboard showing web traffic results using analytical techniques inspiration pdf. This layout presents information on bounce rate, traffic sources, analytics. It is also available for immediate download and adjustment. So, changes can be made in the color, design, graphics or any other component to create a unique layout.
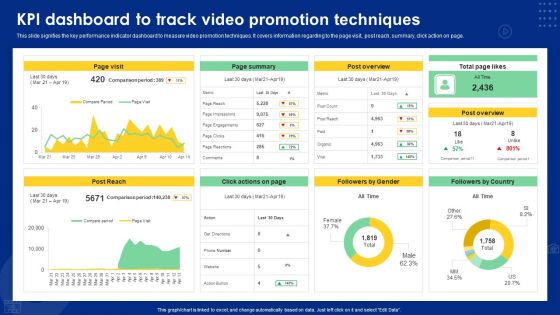
Kpi Dashboard To Track Video Promotion Techniques Ppt Summary Guide PDF
This slide signifies the key performance indicator dashboard to measure video promotion techniques. It covers information regarding to the page visit, post reach, summary, click action on page. Pitch your topic with ease and precision using this Kpi Dashboard To Track Video Promotion Techniques Ppt Summary Guide PDF. This layout presents information on Page Visit, Page Summary, Post Overview. It is also available for immediate download and adjustment. So, changes can be made in the color, design, graphics or any other component to create a unique layout.
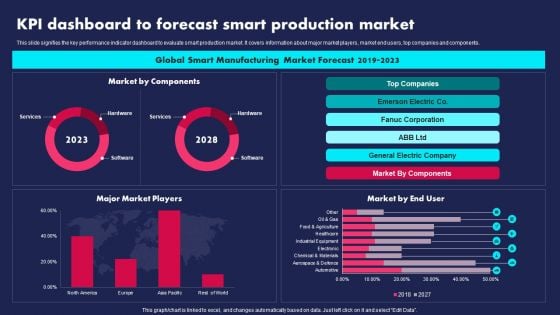
KPI Dashboard To Forecast Smart Production Market Ppt PowerPoint Presentation Gallery Visual Aids PDF
This slide signifies the key performance indicator dashboard to evaluate smart production market. It covers information about major market players, market end users, top companies and components. Pitch your topic with ease and precision using this KPI Dashboard To Forecast Smart Production Market Ppt PowerPoint Presentation Gallery Visual Aids PDF. This layout presents information on Global Smart Manufacturing, Market Forecast, 2019 To 2023. It is also available for immediate download and adjustment. So, changes can be made in the color, design, graphics or any other component to create a unique layout.
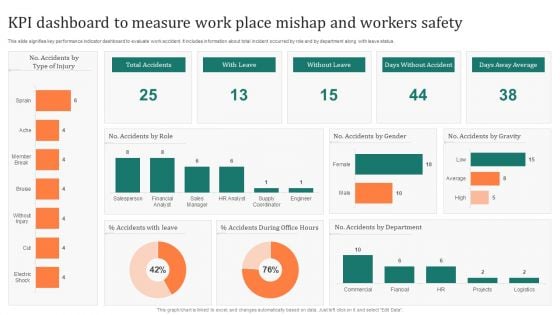
KPI Dashboard To Measure Work Place Mishap And Workers Safety Inspiration PDF
This slide signifies key performance indicator dashboard to evaluate work accident. It includes information about total incident occurred by role and by department along with leave status. Pitch your topic with ease and precision using this KPI Dashboard To Measure Work Place Mishap And Workers Safety Inspiration PDF. This layout presents information on Accidents Role, Accidents Leave, Accidents Department. It is also available for immediate download and adjustment. So, changes can be made in the color, design, graphics or any other component to create a unique layout.
Monthly Sales KPI Dashboard For Tracking Brand Recommendation Progress Background PDF
Following slide demonstrates key performance indicator dashboard for tracking monthly sales to monitor business performance. It includes components such as monthly execution cost, sales, state wise events, Brand market, and programs. Showcasing this set of slides titled Monthly Sales KPI Dashboard For Tracking Brand Recommendation Progress Background PDF. The topics addressed in these templates are Products Sold, Engagements, Events, Active Markets, Sampled, Attendance. All the content presented in this PPT design is completely editable. Download it and make adjustments in color, background, font etc. as per your unique business setting.
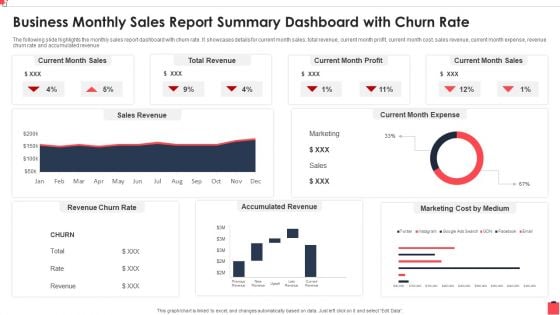
Business Monthly Sales Report Summary Dashboard With Churn Rate Background PDF
The following slide highlights the monthly sales report dashboard with churn rate. It showcases details for current month sales, total revenue, current month profit, current month cost, sales revenue, current month expense, revenue churn rate and accumulated revenue.Pitch your topic with ease and precision using this Business Monthly Sales Report Summary Dashboard With Churn Rate Background PDF This layout presents information on Total Revenue, Accumulated Revenue, Marketing Medium It is also available for immediate download and adjustment. So, changes can be made in the color, design, graphics or any other component to create a unique layout.
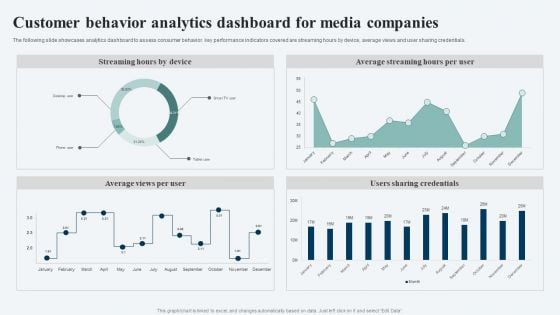
Customer Behavior Analytics Dashboard For Media Companies Ppt Ideas Visuals PDF
The following slide showcases analytics dashboard to assess consumer behavior. key performance indicators covered are streaming hours by device, average views and user sharing credentials. Showcasing this set of slides titled Customer Behavior Analytics Dashboard For Media Companies Ppt Ideas Visuals PDF. The topics addressed in these templates are Streaming Hours Device, Average Streaming Hours, Per User, Users Sharing Credentials. All the content presented in this PPT design is completely editable. Download it and make adjustments in color, background, font etc. as per your unique business setting.

HR KPI Dashboard With Staff Payroll Details Ppt PowerPoint Presentation File Layout Ideas PDF
This slide represents the key performance indicator dashboard with salary details of employee working in an organisation. It includes turnover rate, pie chart of employment contract and status, bar graph based on employee gender. Showcasing this set of slides titled HR KPI Dashboard With Staff Payroll Details Ppt PowerPoint Presentation File Layout Ideas PDF. The topics addressed in these templates are Turnover Rate, Absenteeism Rate, Permanent Rate. All the content presented in this PPT design is completely editable. Download it and make adjustments in color, background, font etc. as per your unique business setting.
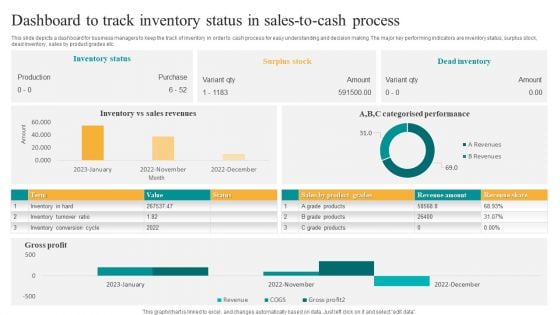
Dashboard To Track Inventory Status In Sales To Cash Process Themes PDF
This slide depicts a dashboard for business managers to keep the track of inventory in order to cash process for easy understanding and decision making. The major key performing indicators are inventory status, surplus stock, dead inventory, sales by product grades etc. Showcasing this set of slides titled Dashboard To Track Inventory Status In Sales To Cash Process Themes PDF. The topics addressed in these templates are Inventory Status, Surplus Stock, Dead Inventory. All the content presented in this PPT design is completely editable. Download it and make adjustments in color, background, font etc. as per your unique business setting.
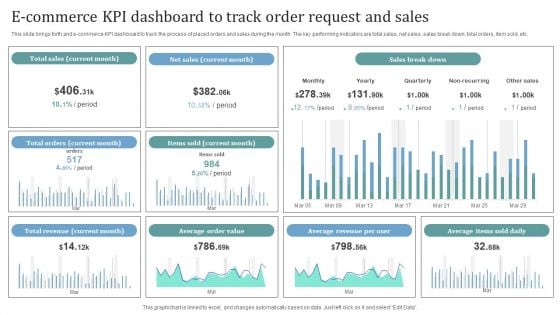
E Commerce KPI Dashboard To Track Order Request And Sales Introduction PDF
This slide brings forth and e commerce KPI dashboard to track the process of placed orders and sales during the month. The key performing indicators are total sales, net sales, sales break down, total orders, item sold, etc. Showcasing this set of slides titled E Commerce KPI Dashboard To Track Order Request And Sales Introduction PDF. The topics addressed in these templates are Total Sales, Net Sales, Sales Break Down. All the content presented in this PPT design is completely editable. Download it and make adjustments in color, background, font etc. as per your unique business setting.
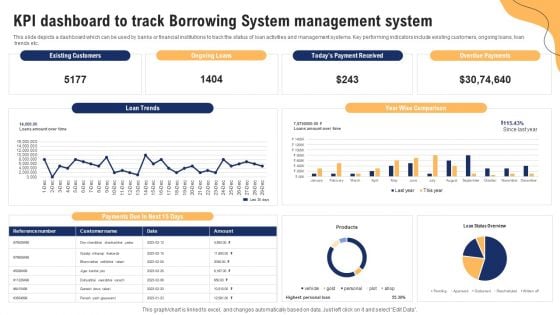
KPI Dashboard To Track Borrowing System Management System Ppt Visual Aids Portfolio PDF
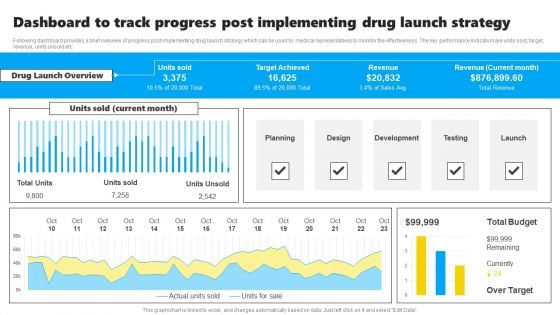
Dashboard To Track Progress Post Implementing Drug Launch Strategy Slides PDF
Following dashboard provides a brief overview of progress post implementing drug launch strategy which can be used by medical representatives to monitor the effectiveness. The key performance indicators are units sold, target, revenue, units unsold etc. Showcasing this set of slides titled Dashboard To Track Progress Post Implementing Drug Launch Strategy Slides PDF. The topics addressed in these templates are Planning, Design, Development, Testing, Launch. All the content presented in this PPT design is completely editable. Download it and make adjustments in color, background, font etc. as per your unique business setting.
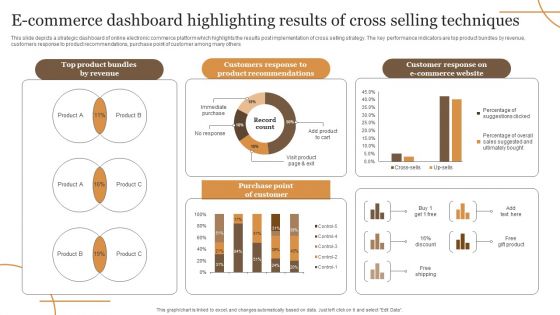
E Commerce Dashboard Highlighting Results Of Cross Selling Techniques Elements PDF
This slide depicts a strategic dashboard of online electronic commerce platform which highlights the results post implementation of cross selling strategy. The key performance indicators are top product bundles by revenue, customers response to product recommendations, purchase point of customer among many others. Showcasing this set of slides titled E Commerce Dashboard Highlighting Results Of Cross Selling Techniques Elements PDF. The topics addressed in these templates are Revenue, E Commerce Website, Purchase. All the content presented in this PPT design is completely editable. Download it and make adjustments in color, background, font etc. as per your unique business setting.
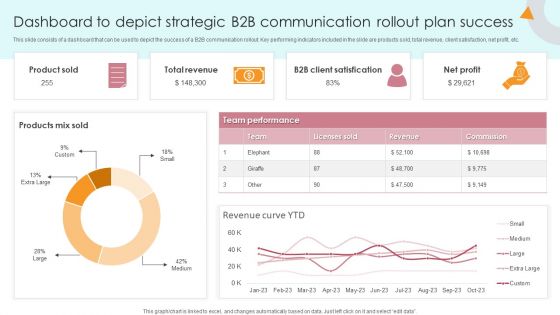
Dashboard To Depict Strategic B2B Communication Rollout Plan Success Portrait PDF
This slide consists of a dashboard that can be used to depict the success of a B2B communication rollout. Key performing indicators included in the slide are products sold, total revenue, client satisfaction, net profit, etc. Showcasing this set of slides titled Dashboard To Depict Strategic B2B Communication Rollout Plan Success Portrait PDF. The topics addressed in these templates are Product Sold, Total Revenue, B2b Client Satisfication. All the content presented in this PPT design is completely editable. Download it and make adjustments in color, background, font etc. as per your unique business setting.
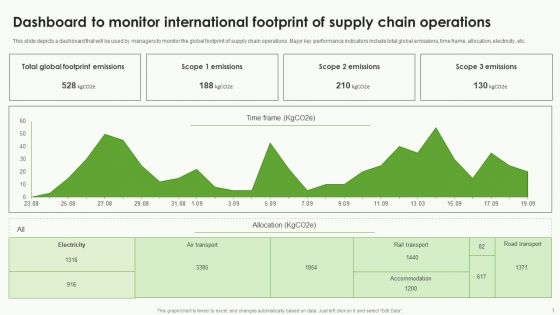
Dashboard To Monitor International Footprint Of Supply Chain Operations Brochure PDF
This slide depicts a dashboard that will be used by managers to monitor the global footprint of supply chain operations. Major key performance indicators include total global emissions, time frame, allocation, electricity, etc. Showcasing this set of slides titled Dashboard To Monitor International Footprint Of Supply Chain Operations Brochure PDF. The topics addressed in these templates are Electricity, Footprint Emissions, Allocation. All the content presented in this PPT design is completely editable. Download it and make adjustments in color, background, font etc. as per your unique business setting.
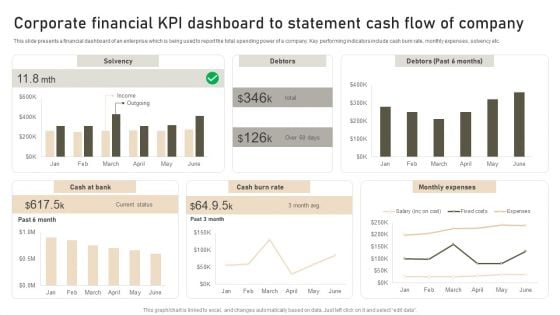
Corporate Financial KPI Dashboard To Statement Cash Flow Of Company Diagrams PDF
This slide presents a financial dashboard of an enterprise which is being used to report the total spending power of a company. Key performing indicators include cash burn rate, monthly expenses, solvency etc. Showcasing this set of slides titled Corporate Financial KPI Dashboard To Statement Cash Flow Of Company Diagrams PDF. The topics addressed in these templates are Solvency, Debtors, Monthly Expenses. All the content presented in this PPT design is completely editable. Download it and make adjustments in color, background, font etc. as per your unique business setting.
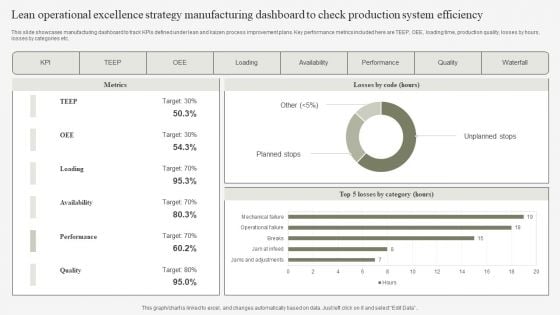
Lean Operational Excellence Strategy Manufacturing Dashboard To Check Production System Efficiency Pictures PDF
This slide showcases manufacturing dashboard to track KPIs defined under lean and kaizen process improvement plans. Key performance metrics included here are TEEP, OEE, loading time, production quality, losses by hours, losses by categories etc. Pitch your topic with ease and precision using this Lean Operational Excellence Strategy Manufacturing Dashboard To Check Production System Efficiency Pictures PDF. This layout presents information on Loading, Availability, Performance. It is also available for immediate download and adjustment. So, changes can be made in the color, design, graphics or any other component to create a unique layout.
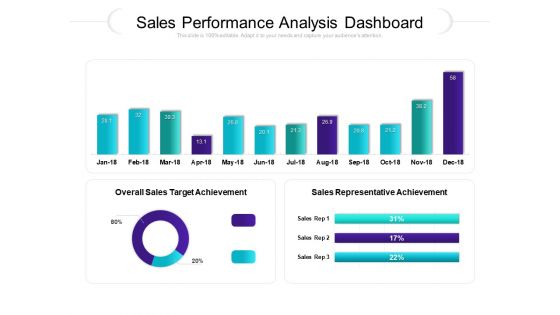
Sales Performance Analysis Dashboard Ppt PowerPoint Presentation Infographic Template Guide PDF
Presenting this set of slides with name sales performance analysis dashboard ppt powerpoint presentation infographic template guide pdf. The topics discussed in these slides are overall sales target achievement, sales representative achievement. This is a completely editable PowerPoint presentation and is available for immediate download. Download now and impress your audience.
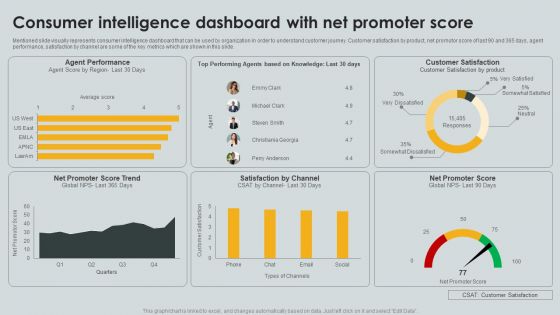
Consumer Intelligence Dashboard With Net Promoter Score Ppt PowerPoint Presentation File Templates PDF
Mentioned slide visually represents consumer intelligence dashboard that can be used by organization in order to understand customer journey. Customer satisfaction by product, net promotor score of last 90 and 365 days, agent performance, satisfaction by channel are some of the key metrics which are shown in this slide. Showcasing this set of slides titled Consumer Intelligence Dashboard With Net Promoter Score Ppt PowerPoint Presentation File Templates PDF. The topics addressed in these templates are Agent Performance, Satisfaction Channel, Net Promoter. All the content presented in this PPT design is completely editable. Download it and make adjustments in color, background, font etc. as per your unique business setting.
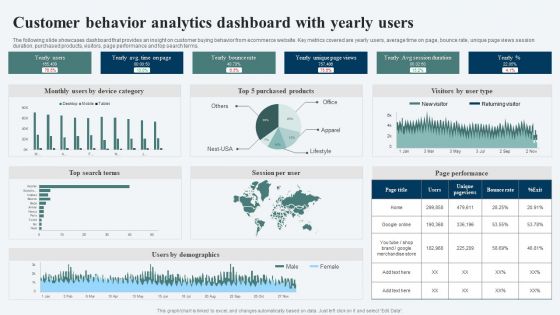
Customer Behavior Analytics Dashboard With Yearly Users Ppt Portfolio Ideas PDF
The following slide showcases dashboard that provides an insight on customer buying behavior from ecommerce website. Key metrics covered are yearly users, average time on page, bounce rate, unique page views session duration, purchased products, visitors, page performance and top search terms. Showcasing this set of slides titled Customer Behavior Analytics Dashboard With Yearly Users Ppt Portfolio Ideas PDF. The topics addressed in these templates are Yearly Users, Yearly Bounce Rate, Top Search Terms. All the content presented in this PPT design is completely editable. Download it and make adjustments in color, background, font etc. as per your unique business setting.
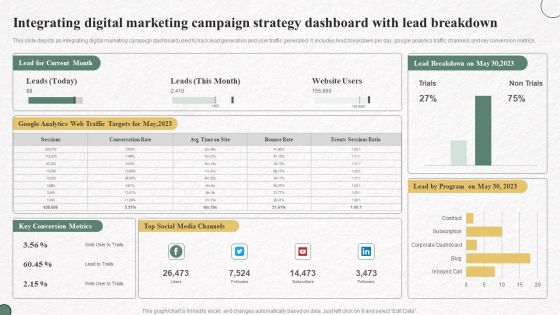
Integrating Digital Marketing Campaign Strategy Dashboard With Lead Breakdown Slides PDF
This slide depicts an integrating digital marketing campaign dashboard used to track lead generation and user traffic generated. It includes lead breakdown per day, google analytics traffic channels and key conversion metrics. Showcasing this set of slides titled Integrating Digital Marketing Campaign Strategy Dashboard With Lead Breakdown Slides PDF. The topics addressed in these templates are Lead Current Month, Website Users, Top Social Media Channels. All the content presented in this PPT design is completely editable. Download it and make adjustments in color, background, font etc. as per your unique business setting.
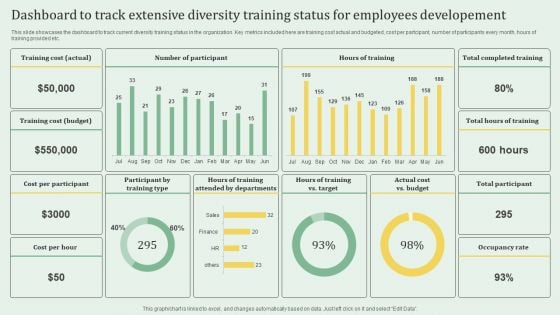
Dashboard To Track Extensive Diversity Training Status For Employees Developement Elements PDF
This slide showcases the dashboard to track current diversity training status in the organization. Key metrics included here are training cost actual and budgeted, cost per partcipant, number of participants every month, hours of training provided etc. Showcasing this set of slides titled Dashboard To Track Extensive Diversity Training Status For Employees Developement Elements PDF. The topics addressed in these templates are Training Cost, Budget, Occupancy Rate. All the content presented in this PPT design is completely editable. Download it and make adjustments in color, background, font etc. as per your unique business setting.
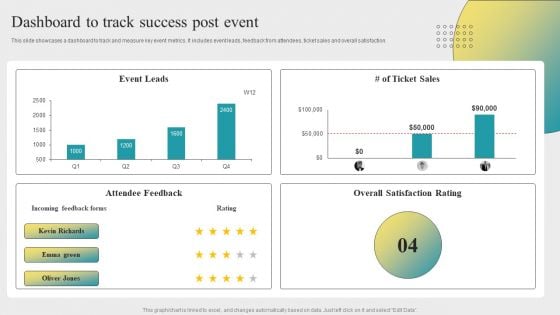
Post Event Activities Dashboard To Track Success Post Event Clipart PDF
This slide showcases a dashboard to track and measure key event metrics. It includes event leads, feedback from attendees, ticket sales and overall satisfaction. Boost your pitch with our creative Post Event Activities Dashboard To Track Success Post Event Clipart PDF. Deliver an awe-inspiring pitch that will mesmerize everyone. Using these presentation templates you will surely catch everyones attention. You can browse the ppts collection on our website. We have researchers who are experts at creating the right content for the templates. So you dont have to invest time in any additional work. Just grab the template now and use them.
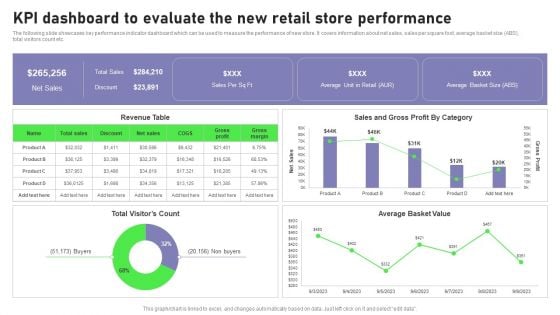
Retail Outlet Opening To Enhance Product Sale Kpi Dashboard To Evaluate The New Retail Guidelines PDF
The following slide showcases key performance indicator dashboard which can be used to measure the performance of new store. It covers information about net sales, sales per square foot, average basket size ABS, total visitors count etc. There are so many reasons you need a Retail Outlet Opening To Enhance Product Sale Kpi Dashboard To Evaluate The New Retail Guidelines PDF. The first reason is you can not spend time making everything from scratch, Thus, Slidegeeks has made presentation templates for you too. You can easily download these templates from our website easily.
Actively Influencing Customers Dashboard For Tracking Marketing Activities At Social Guidelines PDF
This slide covers information regarding the dashboard for tracking essential marketing activities at social media platform in terms of social traffic and conversion, referral traffic by site, key social media metrics. Deliver and pitch your topic in the best possible manner with this Actively Influencing Customers Dashboard For Tracking Marketing Activities At Social Guidelines PDF. Use them to share invaluable insights on Social Events, Social Traffic And Conversion, Referral Traffic By Site, Key Social Metrics and impress your audience. This template can be altered and modified as per your expectations. So, grab it now.
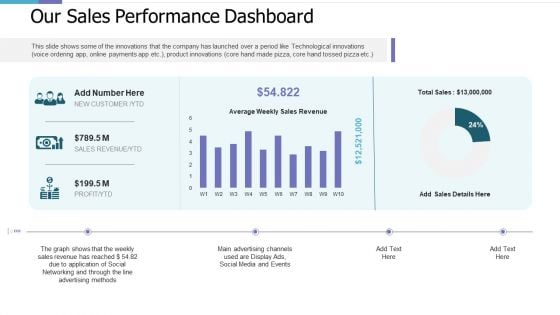
Our Sales Performance Dashboard Investor Pitch Deck For PE Funding Designs PDF
This slide shows some of the innovations that the company has launched over a period like Technological innovations voice ordering app, online payments app etc, product innovations core hand made pizza, core hand tossed pizza etc. Deliver and pitch your topic in the best possible manner with this our sales performance dashboard investor pitch deck for pe funding designs pdf. Use them to share invaluable insights on our sales performance dashboard and impress your audience. This template can be altered and modified as per your expectations. So, grab it now.
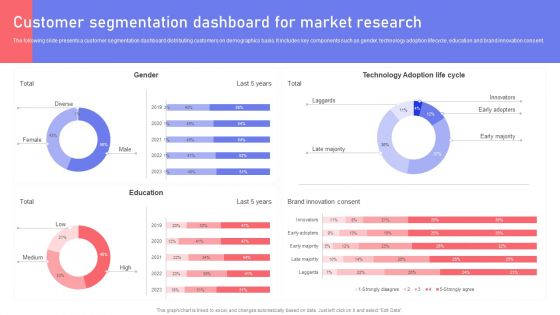
Customer Segmentation Dashboard For Market Research Ppt PowerPoint Presentation File Professional PDF
The following slide presents a customer segmentation dashboard distributing customers on demographics basis. It includes key components such as gender, technology adoption lifecycle, education and brand innovation consent. Make sure to capture your audiences attention in your business displays with our gratis customizable Customer Segmentation Dashboard For Market Research Ppt PowerPoint Presentation File Professional PDF. These are great for business strategies, office conferences, capital raising or task suggestions. If you desire to acquire more customers for your tech business and ensure they stay satisfied, create your own sales presentation with these plain slides.


 Continue with Email

 Home
Home


