Data Dashboard

Net Promoter Score Dashboard Ppt PowerPoint Presentation Complete Deck With Slides
This complete deck acts as a great communication tool. It helps you in conveying your business message with personalized sets of graphics, icons etc. Comprising a set of ninteen slides, this complete deck can help you persuade your audience. It also induces strategic thinking as it has been thoroughly researched and put together by our experts. Not only is it easily downloadable but also editable. The color, graphics, theme any component can be altered to fit your individual needs. So grab it now.

Customer Relationship Management Dashboard Ppt PowerPoint Presentation Complete Deck With Slides
This complete deck acts as a great communication tool. It helps you in conveying your business message with personalized sets of graphics, icons etc. Comprising a set of fourtynine slides, this complete deck can help you persuade your audience. It also induces strategic thinking as it has been thoroughly researched and put together by our experts. Not only is it easily downloadable but also editable. The color, graphics, theme any component can be altered to fit your individual needs. So grab it now.
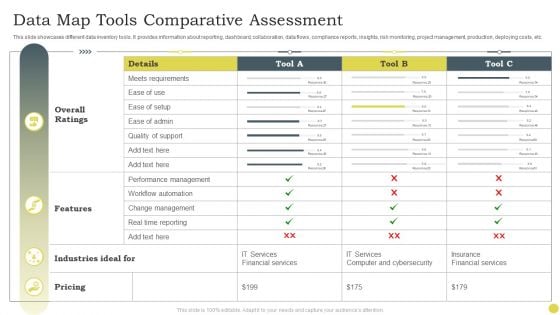
Data Map Tools Comparative Assessment Ppt PowerPoint Presentation Gallery Influencers PDF
This slide showcases different data inventory tools. It provides information about reporting, dashboard, collaboration, data flows, compliance reports, insights, risk monitoring, project management, production, deploying costs, etc. Showcasing this set of slides titled Data Map Tools Comparative Assessment Ppt PowerPoint Presentation Gallery Influencers PDF. The topics addressed in these templates are Overall Ratings, Industries Ideal, Pricing. All the content presented in this PPT design is completely editable. Download it and make adjustments in color, background, font etc. as per your unique business setting.
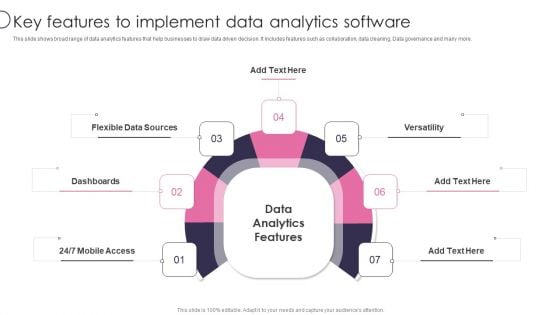
Information Transformation Process Toolkit Key Features To Implement Data Analytics Software Microsoft PDF
This slide shows broad range of data analytics features that help businesses to draw data driven decision. It includes features such as collaboration, data cleaning, Data governance and many more. Presenting Information Transformation Process Toolkit Key Features To Implement Data Analytics Software Microsoft PDF to provide visual cues and insights. Share and navigate important information on seven stages that need your due attention. This template can be used to pitch topics like Flexible Data Sources, Dashboards, Versatility. In addtion, this PPT design contains high resolution images, graphics, etc, that are easily editable and available for immediate download.

Strategic Staffing Using Data Best Practices To Optimize Recruitment Process CRP DK SS V
This slide showcases tips to improve hiring process such as selecting suitable metrics, developing dashboards and data analysis. Do you have an important presentation coming up Are you looking for something that will make your presentation stand out from the rest Look no further than Strategic Staffing Using Data Best Practices To Optimize Recruitment Process CRP DK SS V. With our professional designs, you can trust that your presentation will pop and make delivering it a smooth process. And with Slidegeeks, you can trust that your presentation will be unique and memorable. So why wait Grab Strategic Staffing Using Data Best Practices To Optimize Recruitment Process CRP DK SS V today and make your presentation stand out from the rest This slide showcases tips to improve hiring process such as selecting suitable metrics, developing dashboards and data analysis.
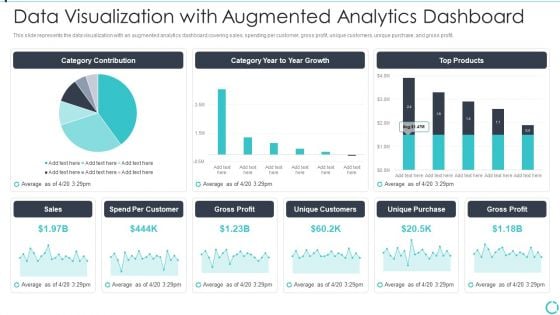
Augmented Analytics Implementation IT Data Visualization With Augmented Analytics Microsoft PDF
This slide represents the data visualization with an augmented analytics dashboard covering sales, spending per customer, gross profit, unique customers, unique purchase, and gross profit. Deliver an awe inspiring pitch with this creative Augmented Analytics Implementation IT Data Visualization With Augmented Analytics Microsoft PDF bundle. Topics like Category Contribution, Category Year To Year Growth, Top Products, Sales, Gross Profit can be discussed with this completely editable template. It is available for immediate download depending on the needs and requirements of the user.
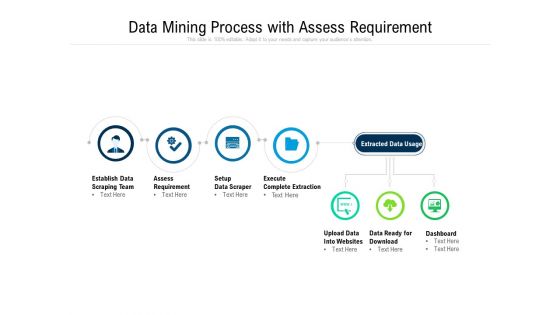
Data Mining Process With Assess Requirement Ppt PowerPoint Presentation Slides Format Ideas PDF
Persuade your audience using this data mining process with assess requirement ppt powerpoint presentation slides format ideas pdf. This PPT design covers eight stages, thus making it a great tool to use. It also caters to a variety of topics including establish data scraping team, assess requirement, setup, data scraper execute, complete extraction, data ready for download, dashboard, upload data into websites. Download this PPT design now to present a convincing pitch that not only emphasizes the topic but also showcases your presentation skills.

Data Driven Approach To Optimise Best Practices To Optimize Recruitment Process CRP SS V
This slide showcases tips to improve hiring process such as selecting suitable metrics, developing dashboards and data analysis. Slidegeeks is here to make your presentations a breeze with Data Driven Approach To Optimise Best Practices To Optimize Recruitment Process CRP SS V With our easy-to-use and customizable templates, you can focus on delivering your ideas rather than worrying about formatting. With a variety of designs to choose from, you are sure to find one that suits your needs. And with animations and unique photos, illustrations, and fonts, you can make your presentation pop. So whether you are giving a sales pitch or presenting to the board, make sure to check out Slidegeeks first This slide showcases tips to improve hiring process such as selecting suitable metrics, developing dashboards and data analysis.
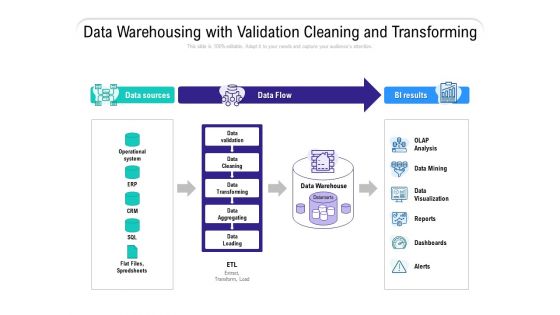
Data Warehousing With Validation Cleaning And Transforming Ppt PowerPoint Presentation Professional Visuals
Presenting this set of slides with name data warehousing with validation cleaning and transforming ppt powerpoint presentation professional visuals. This is a three stage process. The stages in this process are data sources, data flow, bi results, operational system, erp, crm, sql, flat files, spredsheets, olap analysis, data mining, data visualization, reports, dashboards, alerts. This is a completely editable PowerPoint presentation and is available for immediate download. Download now and impress your audience.
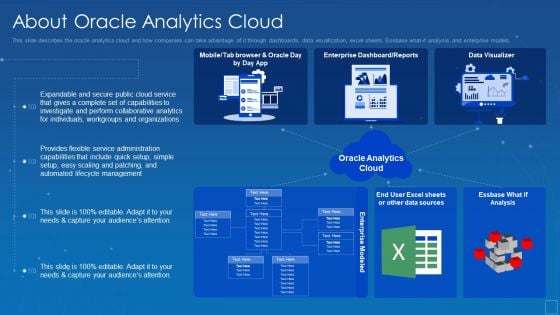
Oracle Cloud Data Analytics Administration IT About Oracle Analytics Cloud Clipart PDF
This slide describes the oracle analytics cloud and how companies can take advantage of it through dashboards, data visualization, excel sheets, Essbase what if analysis, and enterprise models. Deliver and pitch your topic in the best possible manner with this oracle cloud data analytics administration it about oracle analytics cloud clipart pdf. Use them to share invaluable insights on management, lifecycle, capabilities, service, flexible and impress your audience. This template can be altered and modified as per your expectations. So, grab it now.

Business Analysis Data Charts And Reports Ppt Powerpoint Presentation Ideas Portrait
This is a business analysis data charts and reports ppt powerpoint presentation ideas portrait. This is a three stage process. The stages in this process are business metrics, business kpi, business dashboard.
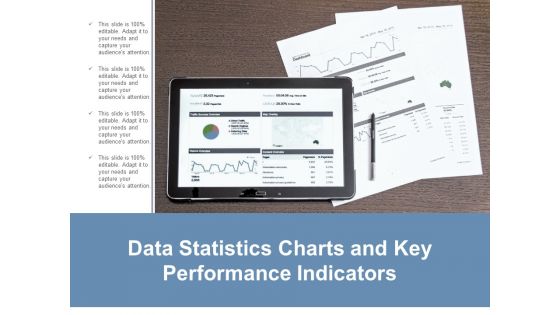
Data Statistics Charts And Key Performance Indicators Ppt Powerpoint Presentation Layouts Guide
This is a data statistics charts and key performance indicators ppt powerpoint presentation layouts guide. This is a four stage process. The stages in this process are business metrics, business kpi, business dashboard.
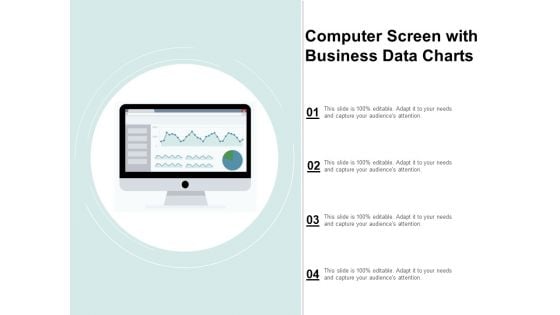
Computer Screen With Business Data Charts Ppt Powerpoint Presentation Show Vector
This is a computer screen with business data charts ppt powerpoint presentation show vector. This is a four stage process. The stages in this process are business metrics, business kpi, business dashboard.
Man Looking At Data Charts For Operation Kpi Evaluation Ppt Powerpoint Presentation Ideas Demonstration
This is a man looking at data charts for operation kpi evaluation ppt powerpoint presentation ideas demonstration. This is a four stage process. The stages in this process are business metrics, business kpi, business dashboard.
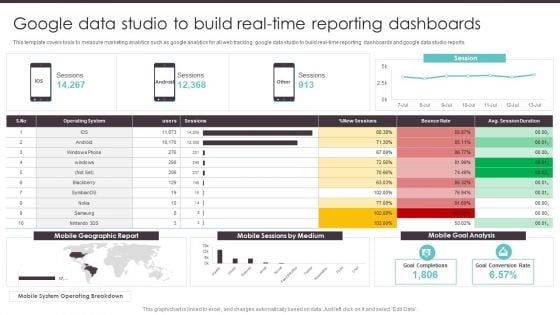
Business To Business Digital Google Data Studio To Build Real Time Reporting Summary PDF
This template covers tools to measure marketing analytics such as google analytics for all web tracking, google data studio to build real-time reporting dashboards and google data studio reports. Find highly impressive Business To Business Digital Google Data Studio To Build Real Time Reporting Summary PDF on Slidegeeks to deliver a meaningful presentation. You can save an ample amount of time using these presentation templates. No need to worry to prepare everything from scratch because Slidegeeks experts have already done a huge research and work for you. You need to download Business To Business Digital Google Data Studio To Build Real Time Reporting Summary PDF for your upcoming presentation. All the presentation templates are 100 percent editable and you can change the color and personalize the content accordingly. Download now.
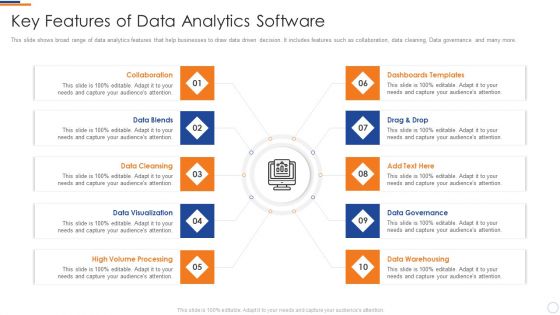
Business Intelligence And Big Key Features Of Data Analytics Software Guidelines PDF
This slide shows broad range of data analytics features that help businesses to draw data driven decision. It includes features such as collaboration, data cleaning, Data governance and many more. This is a business intelligence and big key features of data analytics software guidelines pdf template with various stages. Focus and dispense information on ten stages using this creative set, that comes with editable features. It contains large content boxes to add your information on topics like collaboration, data blends, data cleansing, data visualization, high volume processing, dashboards templates. You can also showcase facts, figures, and other relevant content using this PPT layout. Grab it now.
Market Performance Analysis Data Chart With Arrow Ppt PowerPoint Presentation Inspiration Graphics
This is a market performance analysis data chart with arrow ppt powerpoint presentation inspiration graphics. This is a four stage process. The stages in this process are marketing analytics, marketing performance, marketing discovery.
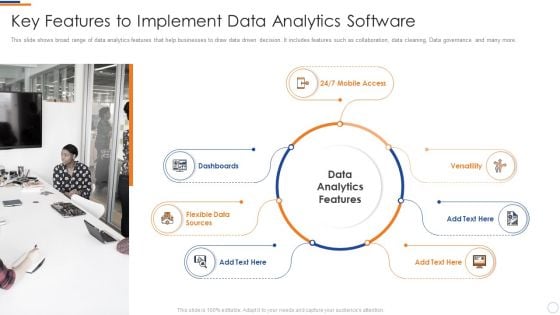
Business Intelligence And Big Key Features To Implement Data Analytics Software Download PDF
This slide shows broad range of data analytics features that help businesses to draw data driven decision. It includes features such as collaboration, data cleaning, Data governance and many more. Presenting business intelligence and big key features to implement data analytics software download pdf to provide visual cues and insights. Share and navigate important information on seven stages that need your due attention. This template can be used to pitch topics like mobile access, dashboards, flexible data sources, versatility. In addtion, this PPT design contains high resolution images, graphics, etc, that are easily editable and available for immediate download.
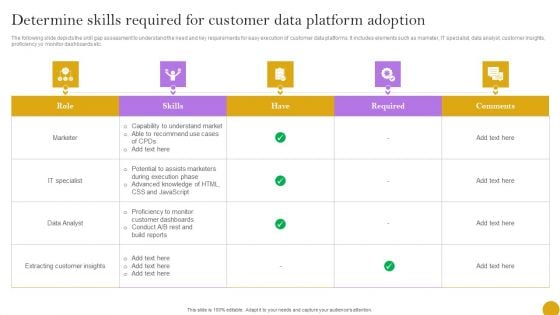
Comprehensive Customer Data Platform Guide Optimizing Promotional Initiatives Determine Skills Required For Customer Introduction PDF
The following slide depicts the skill gap assessment to understand the need and key requirements for easy execution of customer data platforms. It includes elements such as marketer, IT specialist, data analyst, customer insights, proficiency yo monitor dashboards etc. This Comprehensive Customer Data Platform Guide Optimizing Promotional Initiatives Determine Skills Required For Customer Introduction PDF from Slidegeeks makes it easy to present information on your topic with precision. It provides customization options, so you can make changes to the colors, design, graphics, or any other component to create a unique layout. It is also available for immediate download, so you can begin using it right away. Slidegeeks has done good research to ensure that you have everything you need to make your presentation stand out. Make a name out there for a brilliant performance.
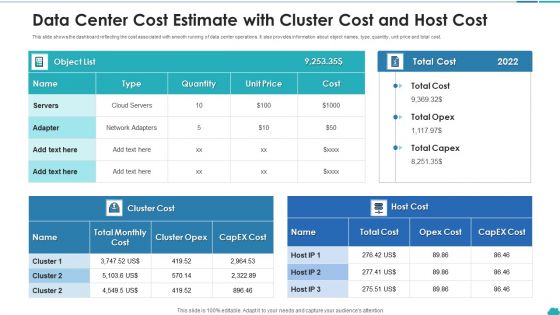
Data Center Cost Estimate With Cluster Cost And Host Cost Slides PDF
This slide shows the dashboard reflecting the cost associated with smooth running of data center operations. It also provides information about object names, type, quantity, unit price and total cost. Pitch your topic with ease and precision using this data center cost estimate with cluster cost and host cost slides pdf. This layout presents information on data center cost estimate with cluster cost and host cost. It is also available for immediate download and adjustment. So, changes can be made in the color, design, graphics or any other component to create a unique layout.
Key Features To Implement Data Analytics Software Business Analysis Modification Toolkit Icons PDF
This slide shows broad range of data analytics features that help businesses to draw data driven decision. It includes features such as collaboration, data cleaning, data governance and many more.This is a Key Features To Implement Data Analytics Software Business Analysis Modification Toolkit Icons PDF template with various stages. Focus and dispense information on seven stages using this creative set, that comes with editable features. It contains large content boxes to add your information on topics like Dashboards, Versatility, Flexible Data. You can also showcase facts, figures, and other relevant content using this PPT layout. Grab it now.
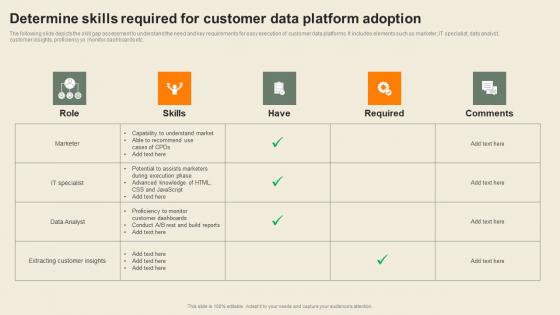
Determine Skills Required For Customer Data Usability Of CDP Software Tool Clipart Pdf
The following slide depicts the skill gap assessment to understand the need and key requirements for easy execution of customer data platforms. It includes elements such as marketer, IT specialist, data analyst, customer insights, proficiency yo monitor dashboards etc. Explore a selection of the finest Determine Skills Required For Customer Data Usability Of CDP Software Tool Clipart Pdf here. With a plethora of professionally designed and pre-made slide templates, you can quickly and easily find the right one for your upcoming presentation. You can use our Determine Skills Required For Customer Data Usability Of CDP Software Tool Clipart Pdf to effectively convey your message to a wider audience. Slidegeeks has done a lot of research before preparing these presentation templates. The content can be personalized and the slides are highly editable. Grab templates today from Slidegeeks. The following slide depicts the skill gap assessment to understand the need and key requirements for easy execution of customer data platforms. It includes elements such as marketer, IT specialist, data analyst, customer insights, proficiency yo monitor dashboards etc.
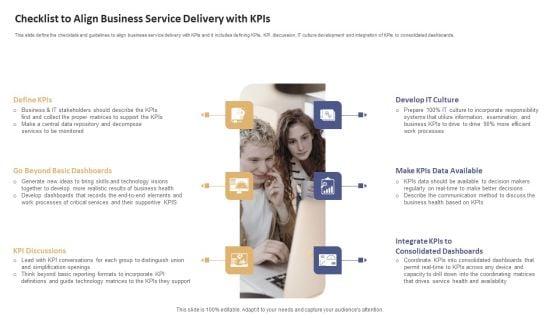
Data Processing Services Delivery Checklist To Align Business Service Delivery With Kpis Designs PDF
This slide define the checklists and guidelines to align business service delivery with KPIs and it includes defining KPIs, KPI discussion, IT culture development and integration of KPIs to consolidated dashboards. This is a Data Processing Services Delivery Checklist To Align Business Service Delivery With Kpis Designs PDF template with various stages. Focus and dispense information on six stages using this creative set, that comes with editable features. It contains large content boxes to add your information on topics like Define KPIs, KPI Discussions, Develop IT Culture. You can also showcase facts, figures, and other relevant content using this PPT layout. Grab it now.
BI System To Enhance Processes For Data Warehouse Management Ppt Professional Icon PDF
This slide shows the business intelligence architecture. It provides information such as enterprise data warehouse, data sources, analytics and user accessibility with tools, dashboards, reports and information delivery. Presenting BI System To Enhance Processes For Data Warehouse Management Ppt Professional Icon PDF to dispense important information. This template comprises four stages. It also presents valuable insights into the topics including Data Sources, Enterprise Data Warehouse, Extract Transform Load. This is a completely customizable PowerPoint theme that can be put to use immediately. So, download it and address the topic impactfully.
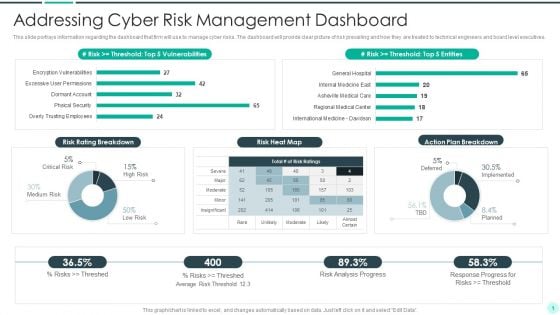
Executing Advance Data Analytics At Workspace Addressing Cyber Risk Guidelines PDF
This slide portrays information regarding the dashboard that firm will use to manage cyber risks. The dashboard will provide clear picture of risk prevailing and how they are treated to technical engineers and board level executives.Deliver an awe inspiring pitch with this creative executing advance data analytics at workspace addressing cyber risk guidelines pdf bundle. Topics like addressing cyber risk management dashboard can be discussed with this completely editable template. It is available for immediate download depending on the needs and requirements of the user.
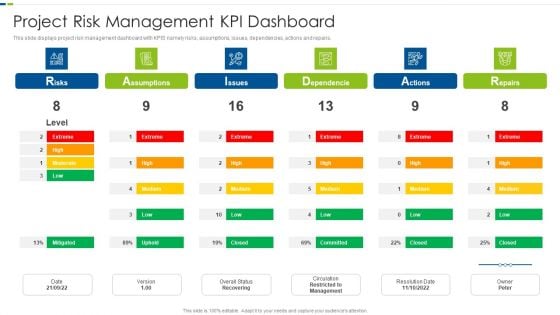
Utilizing Agile Methodology In Data Transformation Project IT Project Risk Management KPI Infographics PDF
This slide displays project risk management dashboard with KPIS namely risks, assumptions, issues, dependencies, actions and repairs. Deliver and pitch your topic in the best possible manner with this utilizing agile methodology in data transformation project it project risk management kpi infographics pdf. Use them to share invaluable insights on project risk management kpi dashboard and impress your audience. This template can be altered and modified as per your expectations. So, grab it now.
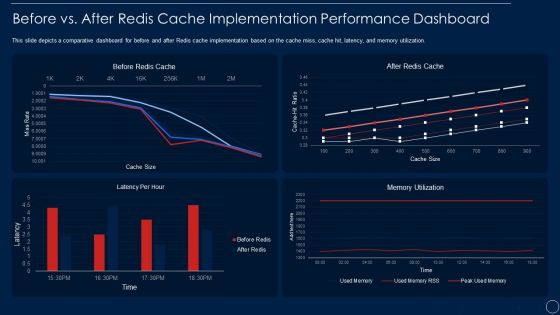
Redis Cache Data Structure IT Before Vs After Redis Cache Portrait PDF
This slide depicts a comparative dashboard for before and after Redis cache implementation based on the cache miss, cache hit, latency, and memory utilization. Deliver an awe inspiring pitch with this creative redis cache data structure it before vs after redis cache portrait pdf bundle. Topics like before vs after redis cache implementation performance dashboard can be discussed with this completely editable template. It is available for immediate download depending on the needs and requirements of the user.
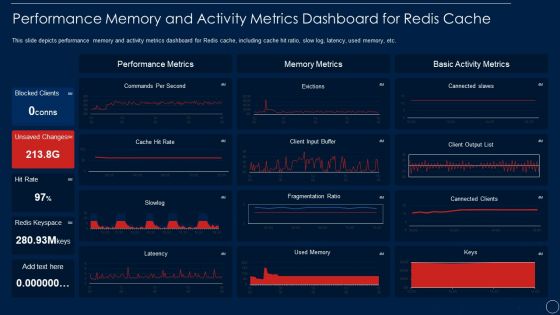
Redis Cache Data Structure IT Performance Memory And Activity Metrics Introduction PDF
This slide depicts performance memory and activity metrics dashboard for Redis cache, including cache hit ratio, slow log, latency, used memory, etc. This is a redis cache data structure it performance memory and activity metrics introduction pdf template with various stages. Focus and dispense information on one stages using this creative set, that comes with editable features. It contains large content boxes to add your information on topics like performance memory and activity metrics dashboard for redis cache. You can also showcase facts, figures, and other relevant content using this PPT layout. Grab it now.
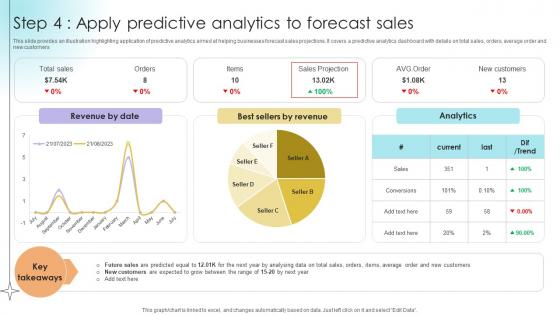
Step 4 Apply Predictive Analytics To Forecast Sales Data Analytics SS V
This slide provides an illustration highlighting application of predictive analytics aimed at helping businesses forecast sales projections. It covers a predictive analytics dashboard with details on total sales, orders, average order and new customers.Coming up with a presentation necessitates that the majority of the effort goes into the content and the message you intend to convey. The visuals of a PowerPoint presentation can only be effective if it supplements and supports the story that is being told. Keeping this in mind our experts created Step 4 Apply Predictive Analytics To Forecast Sales Data Analytics SS V to reduce the time that goes into designing the presentation. This way, you can concentrate on the message while our designers take care of providing you with the right template for the situation. This slide provides an illustration highlighting application of predictive analytics aimed at helping businesses forecast sales projections. It covers a predictive analytics dashboard with details on total sales, orders, average order and new customers.
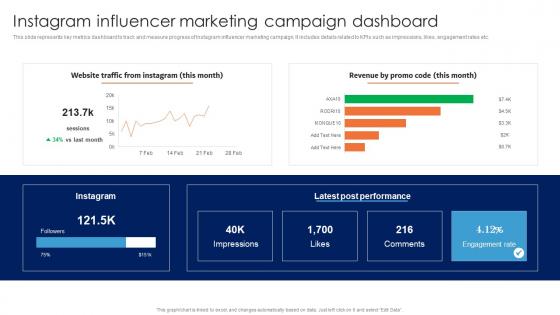
Instagram Influencer Marketing Campaign Guide For Data Driven Advertising Guidelines Pdf
This slide represents key metrics dashboard to track and measure progress of Instagram influencer marketing campaign. It includes details related to KPIs such as impressions, likes, engagement rates etc.From laying roadmaps to briefing everything in detail, our templates are perfect for you. You can set the stage with your presentation slides. All you have to do is download these easy-to-edit and customizable templates. Instagram Influencer Marketing Campaign Guide For Data Driven Advertising Guidelines Pdf will help you deliver an outstanding performance that everyone would remember and praise you for. Do download this presentation today. This slide represents key metrics dashboard to track and measure progress of Instagram influencer marketing campaign. It includes details related to KPIs such as impressions, likes, engagement rates etc.
Facebook Ad Campaign Performance Tracking Guide For Data Driven Advertising Pictures Pdf
This slide represents the KPI dashboard to effectively measure and monitor performance of Facebook marketing campaign conducted by the organization to enhance customer engagement. It includes details related to KPIs such as ad impressions, ad reach etc.Take your projects to the next level with our ultimate collection of Facebook Ad Campaign Performance Tracking Guide For Data Driven Advertising Pictures Pdf. Slidegeeks has designed a range of layouts that are perfect for representing task or activity duration, keeping track of all your deadlines at a glance. Tailor these designs to your exact needs and give them a truly corporate look with your own brand colors they all make your projects stand out from the rest. This slide represents the KPI dashboard to effectively measure and monitor performance of Facebook marketing campaign conducted by the organization to enhance customer engagement. It includes details related to KPIs such as ad impressions, ad reach etc.
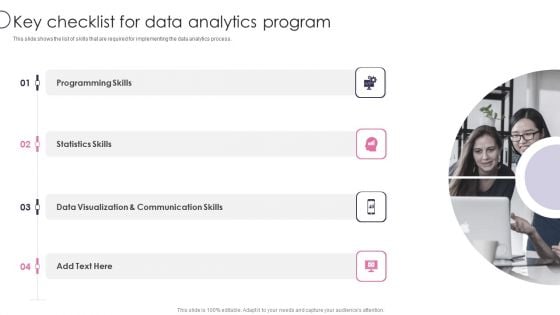
Information Transformation Process Toolkit Key Checklist For Data Analytics Program Template PDF
This diagram illustrates the Stream Analytics pipeline, showing how data is ingested, analyzed, and then sent for presentation or action. Deliver an awe inspiring pitch with this creative Information Transformation Process Toolkit Key Checklist For Data Analytics Program Template PDF bundle. Topics like Batch Analytics, Term Storage, Dashboard can be discussed with this completely editable template. It is available for immediate download depending on the needs and requirements of the user.
Executing Advance Data Analytics At Workspace Tracking Intelligence Infrastructure Elements PDF
This slide portrays information regarding tracking essential activities in intelligence infrastructure dashboard in terms of IT operations, security, business analytics, internet of things, etc. Deliver an awe inspiring pitch with this creative executing advance data analytics at workspace tracking intelligence infrastructure elements pdf bundle. Topics like leveraging potential technologies beneficial to firm can be discussed with this completely editable template. It is available for immediate download depending on the needs and requirements of the user.
Data Analysis Reports Under Magnifying Glass Ppt PowerPoint Presentation Icon Graphic Tips
Presenting this set of slides with name data analysis reports under magnifying glass ppt powerpoint presentation icon graphic tips. This is a three stage process. The stages in this process are data visualization icon, research analysis, business focus. This is a completely editable PowerPoint presentation and is available for immediate download. Download now and impress your audience.
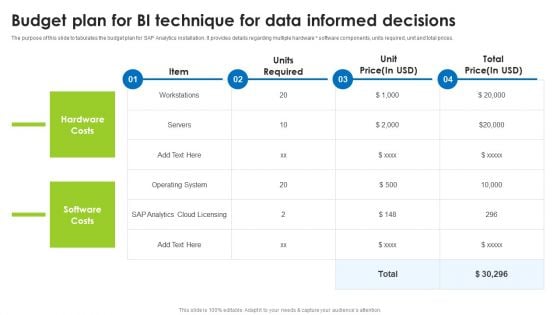
Budget Plan For BI Technique For Data Informed Decisions Clipart PDF
The purpose of this slide to tabulates the budget plan for SAP Analytics installation. It provides details regarding multiple hardware software components, units required, unit and total prices. Explore a selection of the finest Sap Analytics Cloud Dashboard For Income Analysis And Forecasting Formats PDF here. With a plethora of professionally designed and pre made slide templates, you can quickly and easily find the right one for your upcoming presentation. You can use our Sap Analytics Cloud Dashboard For Income Analysis And Forecasting Formats PDF to effectively convey your message to a wider audience. Slidegeeks has done a lot of research before preparing these presentation templates. The content can be personalized and the slides are highly editable. Grab templates today from Slidegeeks.
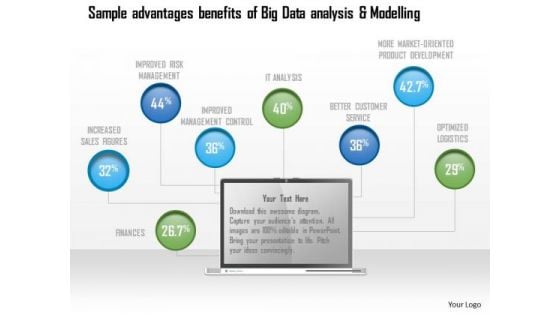
Business Diagram Sample Advantages Benefits Of Big Data Analysis And Modelling Ppt Slide
Explain the concept of sample advantages and benefits of big data analysis with this unique diagram. This slide contains the graphic of data icons. Use this slide to present data analysis and modeling related topics in any presentation.
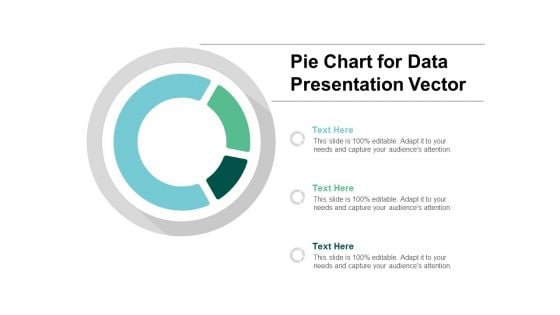
Pie Chart For Data Presentation Vector Ppt PowerPoint Presentation Summary Files
Presenting this set of slides with name pie chart for data presentation vector ppt powerpoint presentation summary files. The topics discussed in these slides are data visualization icon, research analysis, business focus. This is a completely editable PowerPoint presentation and is available for immediate download. Download now and impress your audience.
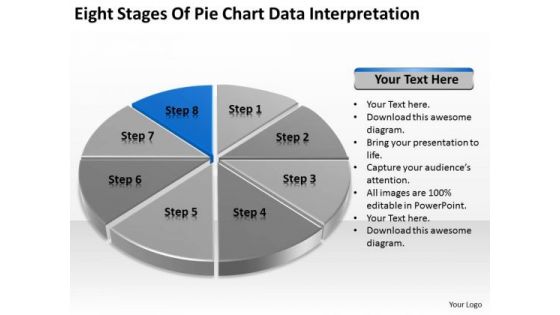
Eight Stages Of Pie Chart Data Interpretation Detailed Business Plan PowerPoint Templates
We present our eight stages of pie chart data interpretation detailed business plan PowerPoint templates.Download and present our Competition PowerPoint Templates because You can Stir your ideas in the cauldron of our PowerPoint Templates and Slides. Cast a magic spell on your audience. Download and present our Marketing PowerPoint Templates because You should Kick up a storm with our PowerPoint Templates and Slides. The heads of your listeners will swirl with your ideas. Download and present our Arrows PowerPoint Templates because Your ideas provide food for thought. Our PowerPoint Templates and Slides will help you create a dish to tickle the most discerning palate. Present our Circle Charts PowerPoint Templates because You can Stir your ideas in the cauldron of our PowerPoint Templates and Slides. Cast a magic spell on your audience. Download our Business PowerPoint Templates because You can Score a slam dunk with our PowerPoint Templates and Slides. Watch your audience hang onto your every word.Use these PowerPoint slides for presentations relating to chart, graph, pie, 3d, diagram, graphic, icon, control, business, data, profit, market, sales, display, corporate, concept, render, success, presentation, finance, report, marketing, accounting, management, piece, strategy, money, growth, company, competition, progress, account, sheet, part, information, investment, improvement, banking, index, financial, reflect, results, performance, exchange. The prominent colors used in the PowerPoint template are Blue, Black, Gray. Exult in the comfort of our Eight Stages Of Pie Chart Data Interpretation Detailed Business Plan PowerPoint Templates. Experience the convenience they deliver.
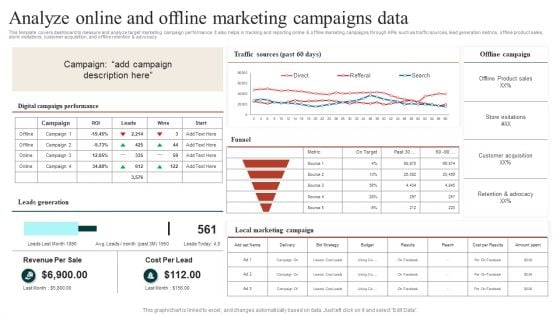
Target Marketing Techniques Analyze Online And Offline Marketing Campaigns Data Ideas PDF
This template covers dashboard to measure and analyze target marketing campaign performance. It also helps in tracking and reporting online and offline marketing campaigns through KPIs such as traffic sources, lead generation metrics, offline product sales, store visitations, customer acquisition, and offline retention and advocacy Find a pre designed and impeccable Target Marketing Techniques Evaluating Growth Rate For Target Marketing Slides PDF. The templates can ace your presentation without additional effort. You can download these easy to edit presentation templates to make your presentation stand out from others. So, what are you waiting for Download the template from Slidegeeks today and give a unique touch to your presentation.
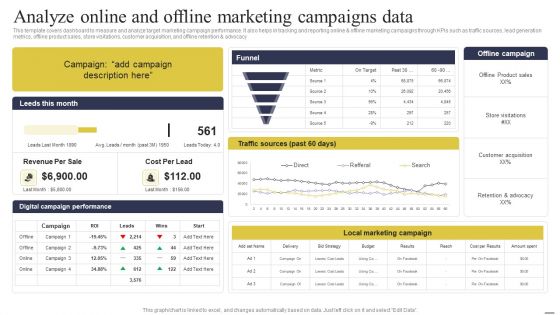
Defining Generic Target Marketing Techniques Analyze Online And Offline Marketing Campaigns Data Topics PDF
This template covers dashboard to measure and analyze target marketing campaign performance. It also helps in tracking and reporting online and offline marketing campaigns through KPIs such as traffic sources, lead generation metrics, offline product sales, store visitations, customer acquisition, and offline retention and advocacy. Create an editable Defining Generic Target Marketing Techniques Analyze Online And Offline Marketing Campaigns Data Topics PDF that communicates your idea and engages your audience. Whether you are presenting a business or an educational presentation, pre designed presentation templates help save time. Defining Generic Target Marketing Techniques Analyze Online And Offline Marketing Campaigns Data Topics PDF is highly customizable and very easy to edit, covering many different styles from creative to business presentations. Slidegeeks has creative team members who have crafted amazing templates. So, go and get them without any delay.
Data Processing Mainframe Structure Vector Icon Ppt PowerPoint Presentation Model Files PDF
Pitch your topic with ease and precision using this data processing mainframe structure vector icon ppt powerpoint presentation model files pdf. This layout presents information on data processing mainframe structure vector icon. It is also available for immediate download and adjustment. So, changes can be made in the color, design, graphics or any other component to create a unique layout.
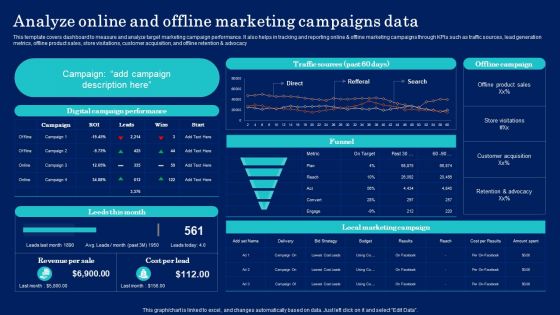
Why Target Market Identification Analyze Online And Offline Marketing Campaigns Data Topics PDF
This template covers dashboard to measure and analyze target marketing campaign performance. It also helps in tracking and reporting online and offline marketing campaigns through KPIs such as traffic sources, lead generation metrics, offline product sales, store visitations, customer acquisition, and offline retention and advocacy. Boost your pitch with our creative Why Target Market Identification Analyze Online And Offline Marketing Campaigns Data Topics PDF. Deliver an awe inspiring pitch that will mesmerize everyone. Using these presentation templates you will surely catch everyones attention. You can browse the ppts collection on our website. We have researchers who are experts at creating the right content for the templates. So you do not have to invest time in any additional work. Just grab the template now and use them.
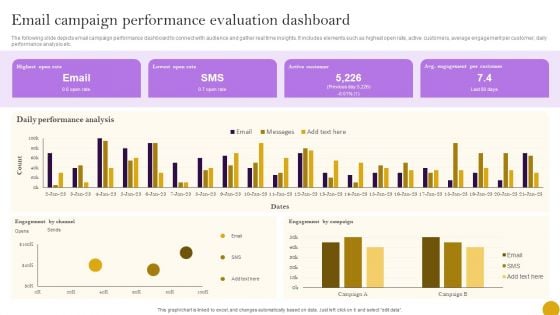
Comprehensive Customer Data Platform Guide Optimizing Promotional Initiatives Email Campaign Performance Evaluation Information PDF
The following slide depicts email campaign performance dashboard to connect with audience and gather real time insights. It includes elements such as highest open rate, active customers, average engagement per customer, daily performance analysis etc. Take your projects to the next level with our ultimate collection of Comprehensive Customer Data Platform Guide Optimizing Promotional Initiatives Email Campaign Performance Evaluation Information PDF. Slidegeeks has designed a range of layouts that are perfect for representing task or activity duration, keeping track of all your deadlines at a glance. Tailor these designs to your exact needs and give them a truly corporate look with your own brand colors they will make your projects stand out from the rest.
Quantitative Data Analysis Icon For Predictive Modelling Ppt Ideas Images PDF
Presenting Quantitative Data Analysis Icon For Predictive Modelling Ppt Ideas Images PDF to dispense important information. This template comprises one stages. It also presents valuable insights into the topics including Quantitative Data, Analysis Icon, Predictive Modelling. This is a completely customizable PowerPoint theme that can be put to use immediately. So, download it and address the topic impactfully.
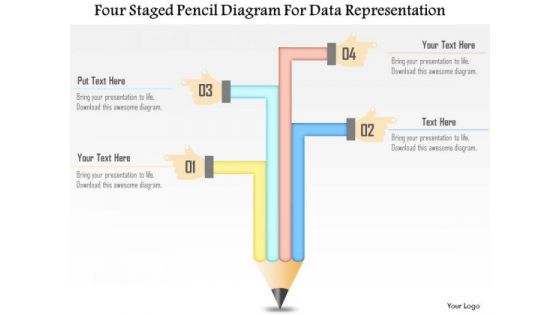
Business Diagram Four Staged Pencil Diagram For Data Representation Presentation Template
This business diagram has been designed with four staged pencil chart. This slide suitable for data representation. You can also use this slide to present four steps of any business process. Use this diagram to present your views in a wonderful manner.
Data Maturity Framework Assessment Icon Ppt PowerPoint Presentation Icon Infographic Template PDF
Presenting Data Maturity Framework Assessment Icon Ppt PowerPoint Presentation Icon Infographic Template PDF to dispense important information. This template comprises one stages. It also presents valuable insights into the topics including Data Maturity Framework, Assessment Icon. This is a completely customizable PowerPoint theme that can be put to use immediately. So, download it and address the topic impactfully.
File Transfer Data Management Vector Icon Ppt PowerPoint Presentation File Graphic Images
Presenting this set of slides with name file transfer data management vector icon ppt powerpoint presentation file graphic images. The topics discussed in these slides are data sources, database management, marketing. This is a completely editable PowerPoint presentation and is available for immediate download. Download now and impress your audience.
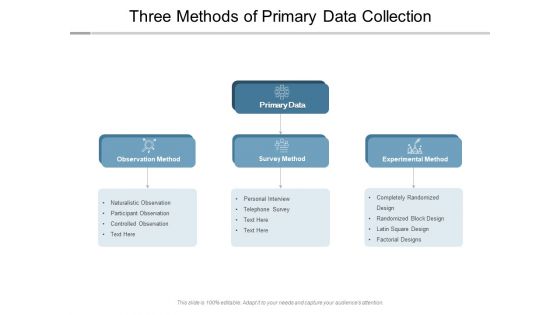
Three Methods Of Primary Data Collection Ppt PowerPoint Presentation Infographics Graphics Design
Presenting this set of slides with name three methods of primary data collection ppt powerpoint presentation infographics graphics design. The topics discussed in these slides are data sources, database management, marketing. This is a completely editable PowerPoint presentation and is available for immediate download. Download now and impress your audience.
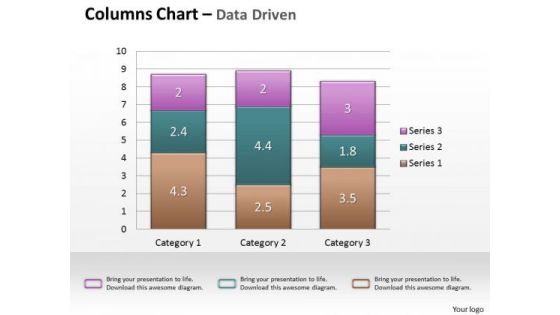
Data Analysis In Excel Column Chart For Business Analytics PowerPoint Templates
Our data analysis in excel column chart for business analytics Powerpoint Templates Heighten Concentration. Your Audience Will Be On The Edge.
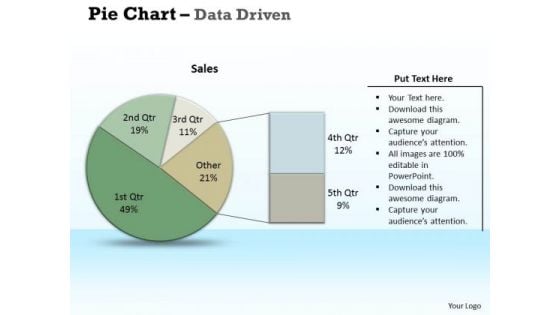
Examples Of Data Analysis Market Driven Pie Chart Research PowerPoint Slides Templates
Chalk It Up With Our examples of data analysis market driven pie chart research powerpoint slides Templates . Add To The Credits Of Your Ideas.

Business Diagram 3d Pie Chart With Arrows For Data Representation PowerPoint Slide
This business slide displays pie chart with timeline graphics. This diagram has been designed with graphic of with four arrows representing yearly data. Use this diagram, in your presentations to display process steps, stages, for business management.
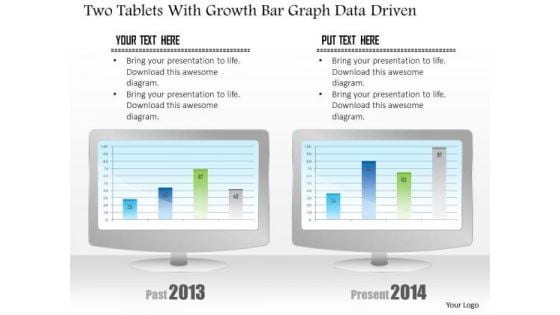
Business Diagram Two Tablets With Growth Bar Graph Data Driven PowerPoint Slide
This business diagram has been designed with comparative charts on tablets. This slide suitable for data representation. You can also use this slide to present business reports and information. Use this diagram to present your views in a wonderful manner.
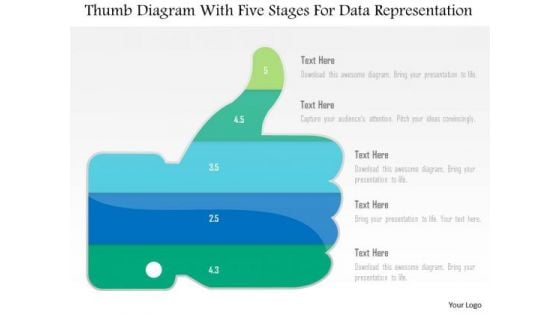
Business Diagram Thumb Diagram With Five Stages For Data Representation PowerPoint Slide
This business diagram displays thumb up with five stages. This diagram contains text boxes for data representation. Use this diagram to display business process workflows in any presentations.
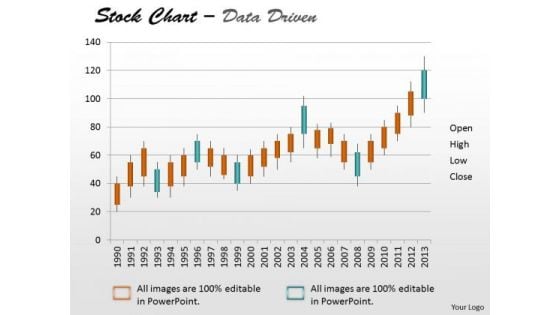
Data Analysis Template Driven Stock Chart For Market Trends PowerPoint Slides Templates
Drive Your Team Along The Road To Success. Take The Wheel With Our data analysis template driven stock chart for market trends powerpoint slides Templates .
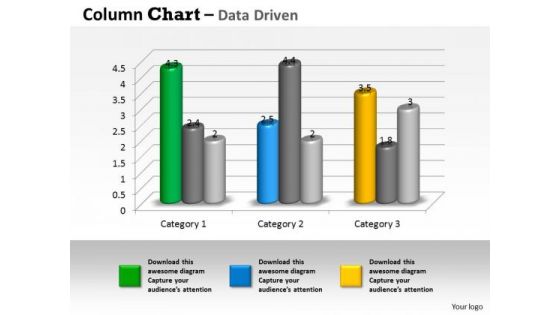
Examples Of Data Analysis Market 3d Business Trend Series Chart PowerPoint Templates
Duct It Through With Our examples of data analysis market 3d business trend series chart Powerpoint Templates . Your Ideas Will Reach Into Their Minds Intact.
Decision Support System What Is Modern Data Warehouse Ppt Icon Outline PDF
This slide represents what a modern data warehouse is and how it supports SQL, machine learning, graphs, spatial processing, and analytical tools that help use data without transferring it. Presenting Decision Support System What Is Modern Data Warehouse Ppt Icon Outline PDF to provide visual cues and insights. Share and navigate important information on one stages that need your due attention. This template can be used to pitch topics like Data Warehouse, Analytics Data Mart, Reporting Tools. In addtion, this PPT design contains high resolution images, graphics, etc, that are easily editable and available for immediate download.
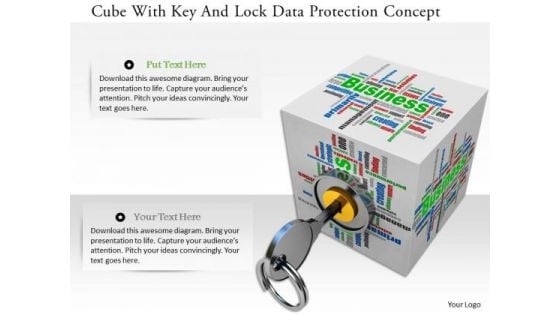
Stock Photo Cube With Key And Lock Data Protection Concept PowerPoint Slide
Graphic of cube with lock and key has been used to design this power point image template. This image template contains the concept of data protection. This image template can e used for data related presentations.
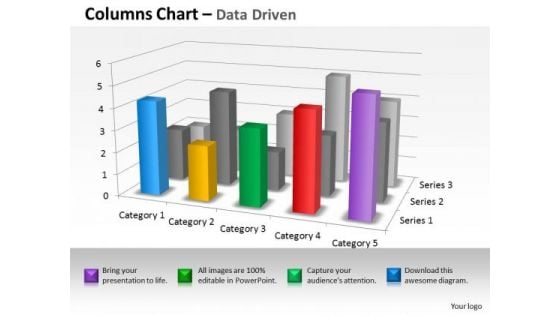
Quantitative Data Analysis 3d Interpretation Of Statistical Quality Control PowerPoint Templates
Land The Idea With Our quantitative data analysis 3d interpretation of statistical quality control Powerpoint Templates . Help It Grow With Your Thoughts.
Data Quality Auditing And Threats Reporting Process Ppt Icon Picture PDF
This slide covers auditing process of data quality and reporting risk detected. It includes framework depicting checkpoints needed to audit data quality for data warehouse and business intelligence projects. Presenting Data Quality Auditing And Threats Reporting Process Ppt Icon Picture PDF to dispense important information. This template comprises one stages. It also presents valuable insights into the topics including External Data, Customer Data, Legacy Data. This is a completely customizable PowerPoint theme that can be put to use immediately. So, download it and address the topic impactfully.
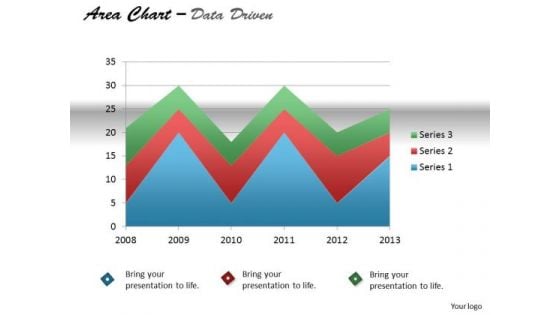
Quantitative Data Analysis Driven Display Series With Area Chart PowerPoint Slides Templates
Our quantitative data analysis driven display series with area chart powerpoint slides Templates Enjoy Drama. They Provide Entertaining Backdrops.


 Continue with Email

 Home
Home


