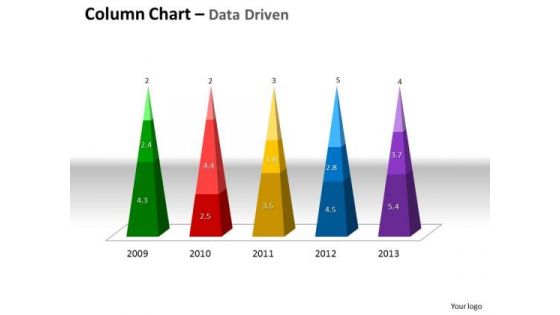
Data Dashboard
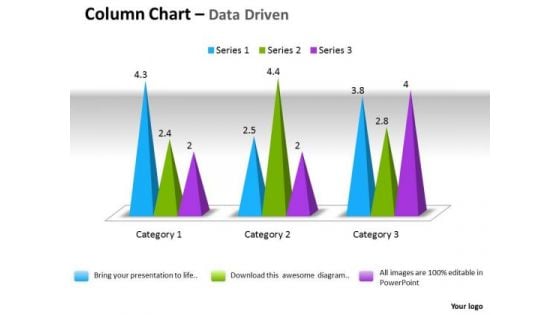
Microsoft Excel Data Analysis 3d Change In Business Process Chart PowerPoint Templates
Double Your Chances With Our microsoft excel data analysis 3d change in business process chart Powerpoint Templates . The Value Of Your Thoughts Will Increase Two-Fold.
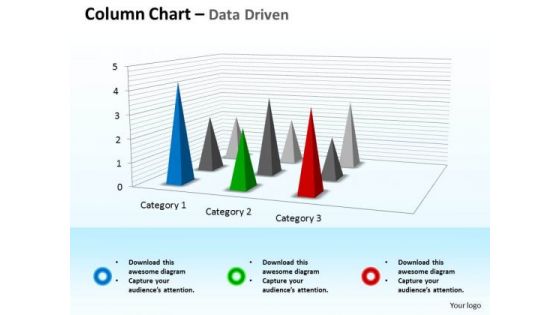
Microsoft Excel Data Analysis 3d Chart For Business Observation PowerPoint Templates
Double Up Our microsoft excel data analysis 3d chart for business observation Powerpoint Templates With Your Thoughts. They Will Make An Awesome Pair.
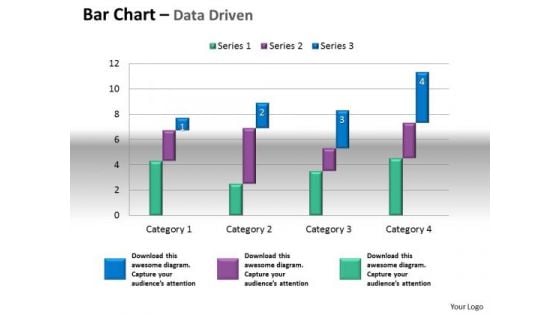
Microsoft Excel Data Analysis Bar Chart To Compare Quantities PowerPoint Templates
Our microsoft excel data analysis bar chart to compare quantities Powerpoint Templates Leave No One In Doubt. Provide A Certainty To Your Views.
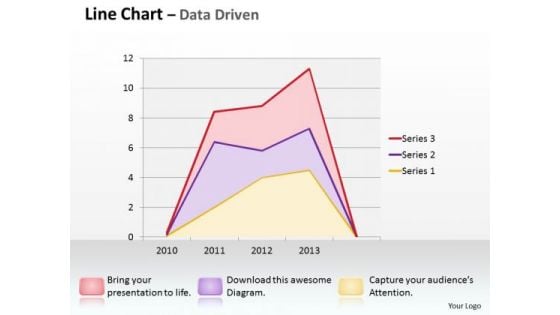
Multivariate Data Analysis Driven Line Chart Shows Revenue Trends PowerPoint Slides Templates
Good Camaraderie Is A Key To Teamwork. Our multivariate data analysis driven line chart shows revenue trends powerpoint slides Templates Can Be A Cementing Force.
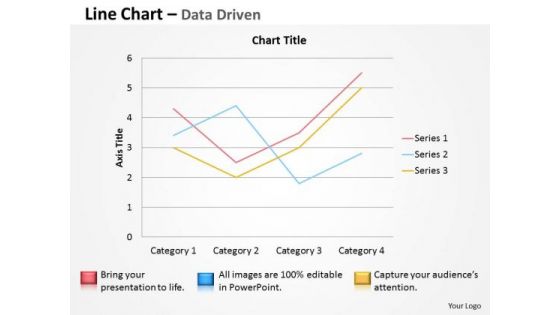
Multivariate Data Analysis Driven Line Chart To Demonstrate PowerPoint Slides Templates
Brace Yourself, Arm Your Thoughts. Prepare For The Hustle With Our multivariate data analysis driven line chart to demonstrate powerpoint slides Templates .
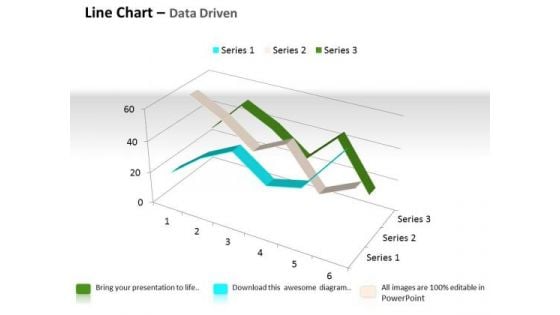
Quantitative Data Analysis 3d Line Chart For Comparison Of PowerPoint Templates
Touch Base With Our quantitative data analysis 3d line chart for comparison of Powerpoint Templates . Review Your Growth With Your Audience.

Quantitative Data Analysis 3d Pie Chart For Business Process PowerPoint Templates
Put Them On The Same Page With Our quantitative data analysis 3d pie chart for business process Powerpoint Templates . Your Team Will Sing From The Same Sheet.
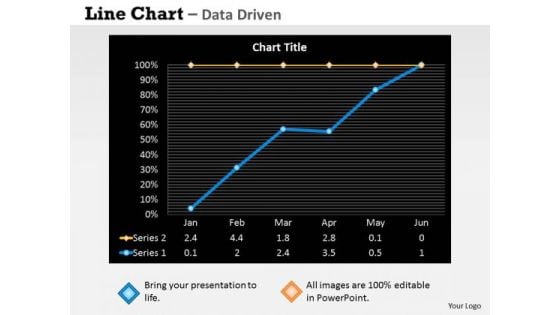
Quantitative Data Analysis Driven Economic Status Line Chart PowerPoint Slides Templates
Be The Dramatist With Our quantitative data analysis driven economic status line chart powerpoint slides Templates . Script Out The Play Of Words.
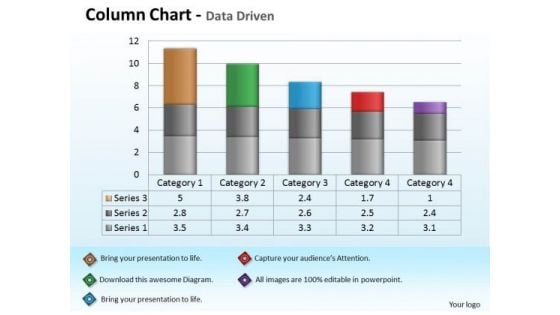
Quantitative Data Analysis Driven Economic With Column Chart PowerPoint Slides Templates
Add Some Dramatization To Your Thoughts. Our quantitative data analysis driven economic with column chart powerpoint slides Templates Make Useful Props.
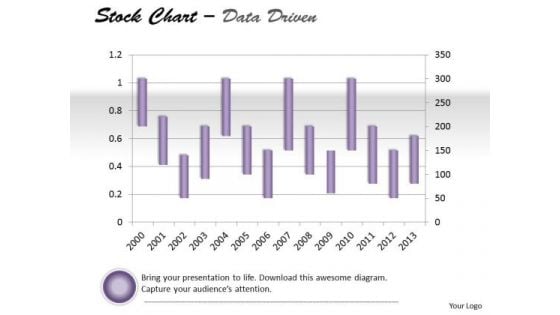
Data Analysis On Excel Driven Stock Chart For Market History PowerPoint Slides Templates
Draw Out The Best In You With Our data analysis on excel driven stock chart for market history powerpoint slides Templates . Let Your Inner Brilliance Come To The Surface.
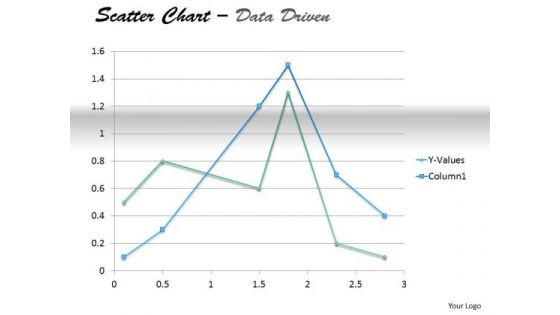
Examples Of Data Analysis Market Driven Present In Scatter Chart PowerPoint Slides Templates
Your Thoughts Will Take To Our examples of data analysis market driven present in scatter chart powerpoint slides Templates Like A Duck To Water. They Develop A Binding Affinity.
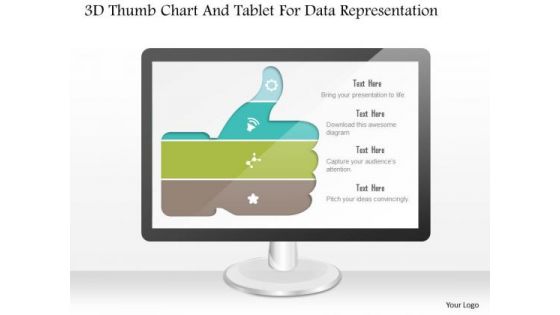
Business Diagram 3d Thumb Chart And Tablet For Data Representation PowerPoint Slide
This business diagram displays graphic of 3d thumb up chart with icons on computer screen. This business slide contains the concept of business data representation. Use this diagram to build professional presentations for your viewers.
Personal Data Visualization On Computer Screen Ppt PowerPoint Presentation Show Layout Ideas
Presenting this set of slides with name personal data visualization on computer screen ppt powerpoint presentation show layout ideas. This is a one stage process. The stages in this process are data visualization icon, research analysis, business focus. This is a completely editable PowerPoint presentation and is available for immediate download. Download now and impress your audience.
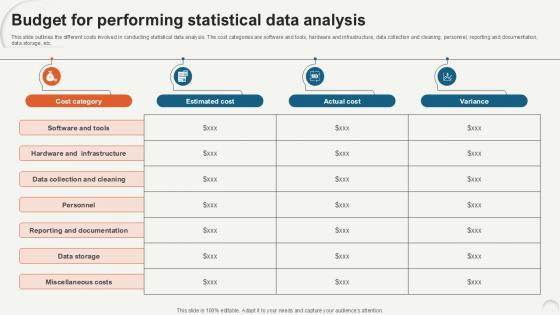
Budget For Performing Statistical Data Analytics For Informed Decision Ppt Template
This slide outlines the different costs involved in conducting statistical data analysis. The cost categories are software and tools, hardware and infrastructure, data collection and cleaning, personnel, reporting and documentation, data storage, etc. There are so many reasons you need a Budget For Performing Statistical Data Analytics For Informed Decision Ppt Template. The first reason is you can not spend time making everything from scratch, Thus, Slidegeeks has made presentation templates for you too. You can easily download these templates from our website easily. This slide outlines the different costs involved in conducting statistical data analysis. The cost categories are software and tools, hardware and infrastructure, data collection and cleaning, personnel, reporting and documentation, data storage, etc.
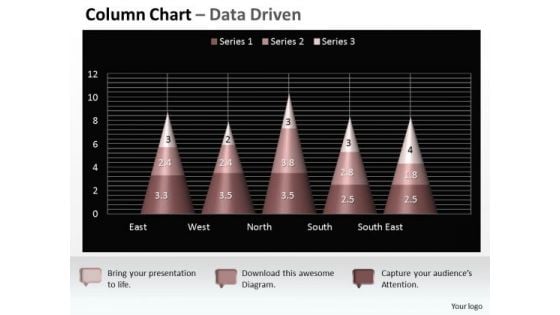
Data Analysis On Excel 3d Chart Shows Interrelated Sets Of PowerPoint Templates
Put Them On The Same Page With Our data analysis on excel 3d chart shows interrelated sets of Powerpoint Templates . Your Team Will Sing From The Same Sheet.
Business Diagram 3d Capsule With Multiple Icons For Business Data Flow PowerPoint Slide
This diagram has been designed with 3d graphic of capsule with multiple icons. This data driven PowerPoint slide can be used to give your presentations more effective look. It helps in clearly conveying your message to clients and audience.
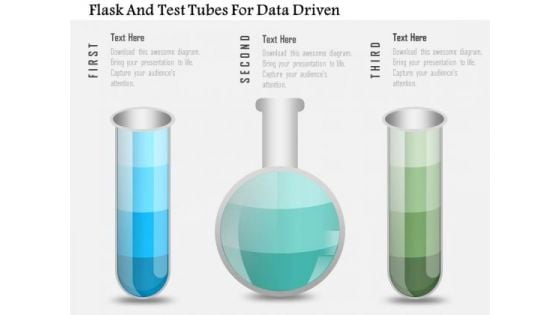
Business Diagram Flask And Test Tubes For Data Driven PowerPoint Slide
This data driven diagram has been designed with flask and test tubes. Download this diagram to give your presentations more effective look. It helps in clearly conveying your message to clients and audience.
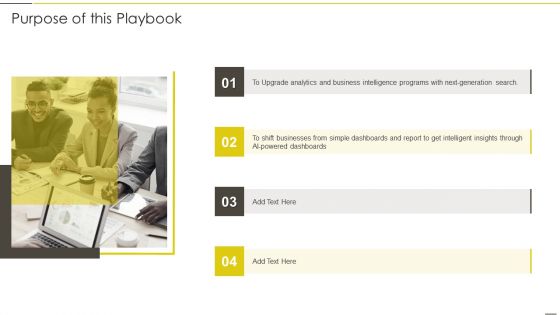
Administered Data And Analytic Quality Playbook Purpose Of This Playbook Topics PDF
This is a Administered Data And Analytic Quality Playbook Purpose Of This Playbook Topics PDF template with various stages. Focus and dispense information on four stages using this creative set, that comes with editable features. It contains large content boxes to add your information on topics like Business Intelligence, Generation Search, Businesses Dashboards You can also showcase facts, figures, and other relevant content using this PPT layout. Grab it now.

Business Diagram Data Driven Bar Graph And Pie Chart For Analysis PowerPoint Slide
This PowerPoint template displays technology gadgets with various business charts. Use this diagram slide, in your presentations to make business reports for statistical analysis. You may use this diagram to impart professional appearance to your presentations.
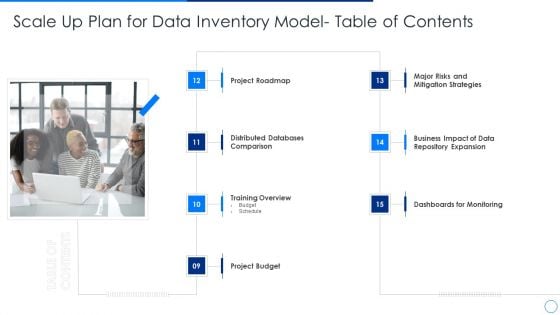
Scale Up Plan For Data Inventory Model Table Of Contents Budget Portrait PDF
This is a scale up plan for data inventory model table of contents budget portrait pdf template with various stages. Focus and dispense information on seven stages using this creative set, that comes with editable features. It contains large content boxes to add your information on topics like project budget, training overview, project roadmap, mitigation strategies, dashboards for monitoring. You can also showcase facts, figures, and other relevant content using this PPT layout. Grab it now.
Threats Management Of Confidential Data Reports Icon Ppt Ideas Summary PDF
Persuade your audience using this Threats Management Of Confidential Data Reports Icon Ppt Ideas Summary PDF. This PPT design covers two stages, thus making it a great tool to use. It also caters to a variety of topics including Threats Management, Confidential Data Reports, Icon. Download this PPT design now to present a convincing pitch that not only emphasizes the topic but also showcases your presentation skills.
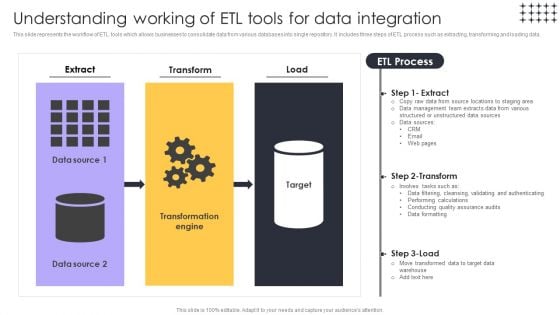
Tools For HR Business Analytics Understanding Working Of ETL Tools For Data Integration Ideas PDF
This slide represents the workflow of ETL tools which allows businesses to consolidate data from various databases into single repository. It includes three steps of ETL process such as extracting, transforming and loading data. Presenting this PowerPoint presentation, titled Tools For HR Business Analytics Understanding Working Of ETL Tools For Data Integration Ideas PDF, with topics curated by our researchers after extensive research. This editable presentation is available for immediate download and provides attractive features when used. Download now and captivate your audience. Presenting this Tools For HR Business Analytics Understanding Working Of ETL Tools For Data Integration Ideas PDF. Our researchers have carefully researched and created these slides with all aspects taken into consideration. This is a completely customizable Tools For HR Business Analytics Understanding Working Of ETL Tools For Data Integration Ideas PDF that is available for immediate downloading. Download now and make an impact on your audience. Highlight the attractive features available with our PPTs.
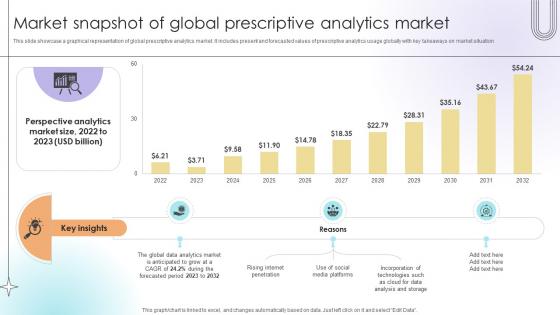
Market Snapshot Of Global Prescriptive Analytics Market Data Analytics SS V
This slide showcase a graphical representation of global prescriptive analytics market. It includes present and forecasted values of prescriptive analytics usage globally with key takeaways on market situation.Make sure to capture your audiences attention in your business displays with our gratis customizable Market Snapshot Of Global Prescriptive Analytics Market Data Analytics SS V. These are great for business strategies, office conferences, capital raising or task suggestions. If you desire to acquire more customers for your tech business and ensure they stay satisfied, create your own sales presentation with these plain slides. This slide showcase a graphical representation of global prescriptive analytics market. It includes present and forecasted values of prescriptive analytics usage globally with key takeaways on market situation.
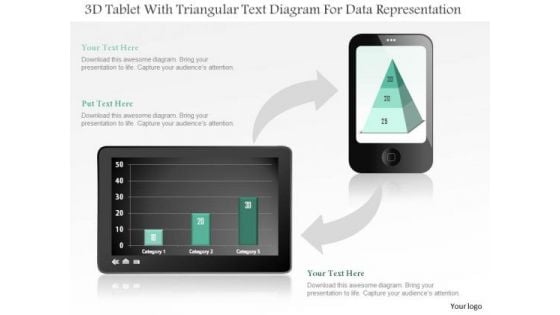
Business Diagram 3d Tablet With Triangular Text Diagram For Data Representation PowerPoint Slide
This business diagram displays bar graph on tablet and pyramid chart on mobile phone. Use this diagram, to make reports for interactive business presentations. Create professional presentations using this diagram.
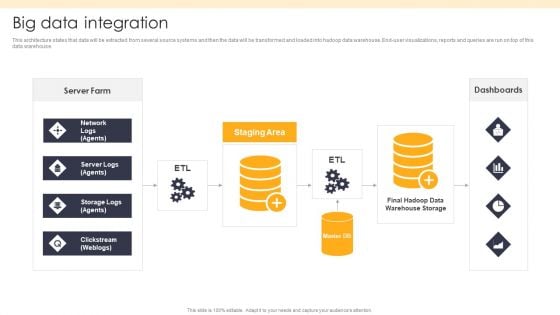
ETL Repository Big Data Integration Ppt PowerPoint Presentation Ideas Outline PDF
This architecture states that data will be extracted from several source systems and then the data will be transformed and loaded into hadoop data warehouse. End-user visualizations, reports and queries are run on top of this data warehouse.Deliver and pitch your topic in the best possible manner with this ETL Repository Big Data Integration Ppt PowerPoint Presentation Ideas Outline PDF. Use them to share invaluable insights on Server Farm, Staging Area, Dashboards and impress your audience. This template can be altered and modified as per your expectations. So, grab it now.
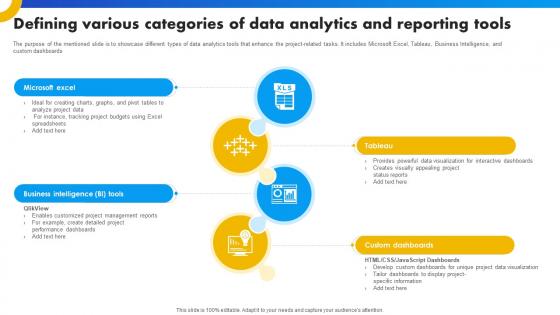
Defining Various Categories Of Data Analytics And Reporting Tools Strategies For Success In Digital
The purpose of the mentioned slide is to showcase different types of data analytics tools that enhance the project-related tasks. It includes Microsoft Excel, Tableau, Business Intelligence, and custom dashboards. Slidegeeks is here to make your presentations a breeze with Defining Various Categories Of Data Analytics And Reporting Tools Strategies For Success In Digital With our easy-to-use and customizable templates, you can focus on delivering your ideas rather than worrying about formatting. With a variety of designs to choose from, you are sure to find one that suits your needs. And with animations and unique photos, illustrations, and fonts, you can make your presentation pop. So whether you are giving a sales pitch or presenting to the board, make sure to check out Slidegeeks first The purpose of the mentioned slide is to showcase different types of data analytics tools that enhance the project-related tasks. It includes Microsoft Excel, Tableau, Business Intelligence, and custom dashboards.
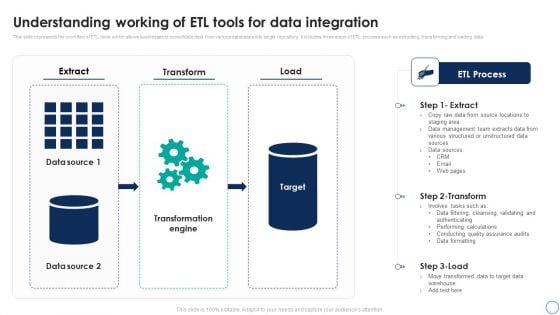
Business Analytics Application Understanding Working Of ETL Tools For Data Structure PDF
This slide represents the workflow of ETL tools which allows businesses to consolidate data from various databases into single repository. It includes three steps of ETL process such as extracting, transforming and loading data. This Business Analytics Application Understanding Working Of ETL Tools For Data Structure PDF from Slidegeeks makes it easy to present information on your topic with precision. It provides customization options, so you can make changes to the colors, design, graphics, or any other component to create a unique layout. It is also available for immediate download, so you can begin using it right away. Slidegeeks has done good research to ensure that you have everything you need to make your presentation stand out. Make a name out there for a brilliant performance.
Human Resource Analytics Understanding Working Of ETL Tools For Data Integration Microsoft PDF
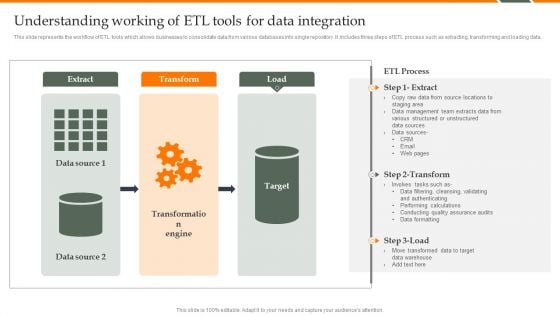
This slide represents the workflow of ETL tools which allows businesses to consolidate data from various databases into single repository. It includes three steps of ETL process such as extracting, transforming and loading data. Do you know about Slidesgeeks Human Resource Analytics Understanding Working Of ETL Tools For Data Integration Microsoft PDF These are perfect for delivering any kind od presentation. Using it, create PowerPoint presentations that communicate your ideas and engage audiences. Save time and effort by using our pre-designed presentation templates that are perfect for a wide range of topic. Our vast selection of designs covers a range of styles, from creative to business, and are all highly customizable and easy to edit. Download as a PowerPoint template or use them as Google Slides themes.
Business Data Analysis Chart Shows Changes Over The Time PowerPoint Templates
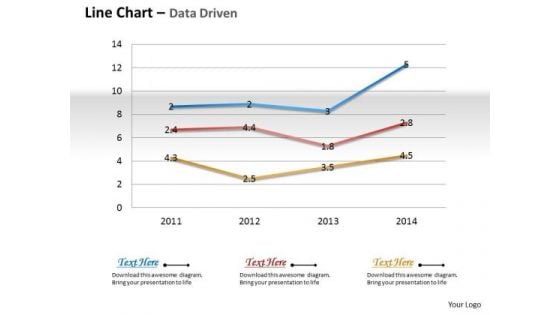
Document The Process On Our business data analysis chart shows changes over the time Powerpoint Templates. Make A Record Of Every Detail.
Data Analysis Excel Driven Multiple Series Scatter Chart PowerPoint Slides Templates
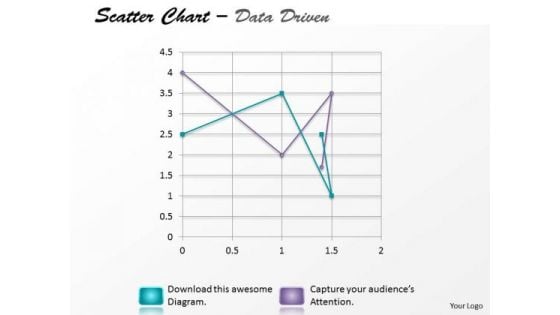
Your Listeners Will Never Doodle. Our data analysis excel driven multiple series scatter chart powerpoint slides Templates Will Hold Their Concentration.
Decision Support System Why We Need Data Warehouse Ppt Slides Good PDF
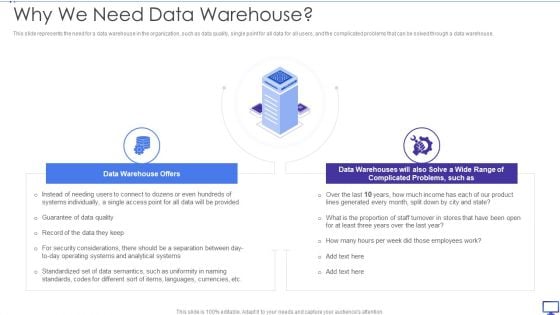
This slide represents the need for a data warehouse in the organization, such as data quality, single point for all data for all users, and the complicated problems that can be solved through a data warehouse. This is a Decision Support System Why We Need Data Warehouse Ppt Slides Good PDF template with various stages. Focus and dispense information on two stages using this creative set, that comes with editable features. It contains large content boxes to add your information on topics like Data Warehouse Offers, Complicated Problems, Data Quality. You can also showcase facts, figures, and other relevant content using this PPT layout. Grab it now.

Various Stages Data Extraction Process Flow Chart Ppt PowerPoint Presentation Pictures Show PDF
Persuade your audience using this various stages data extraction process flow chart ppt powerpoint presentation pictures show pdf. This PPT design covers five stages, thus making it a great tool to use. It also caters to a variety of topics including interpretation evaluation, data mining, transformation, preprocessing, selection, target data, preprocessed data, transformed data, patterns, knowledge. Download this PPT design now to present a convincing pitch that not only emphasizes the topic but also showcases your presentation skills.
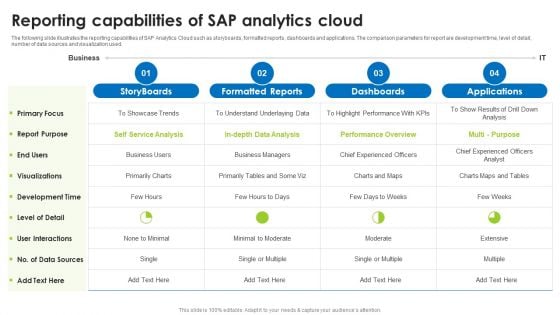
BI Technique For Data Informed Decisions Reporting Capabilities Of Sap Analytics Cloud Demonstration PDF
The following slide illustrates the reporting capabilities of SAP Analytics Cloud such as storyboards, formatted reports, dashboards and applications. The comparison parameters for report are development time, level of detail, number of data sources and visualization used. Make sure to capture your audiences attention in your business displays with our gratis customizable BI Technique For Data Informed Decisions Reporting Capabilities Of Sap Analytics Cloud Demonstration PDF. These are great for business strategies, office conferences, capital raising or task suggestions. If you desire to acquire more customers for your tech business and ensure they stay satisfied, create your own sales presentation with these plain slides.
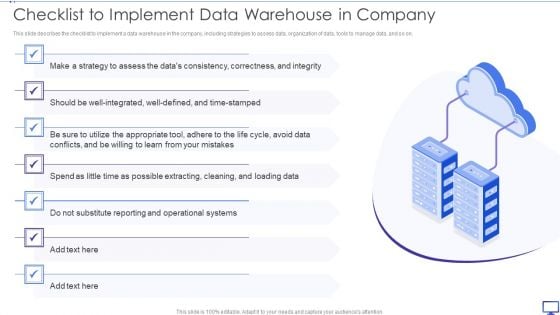
Decision Support System Checklist To Implement Data Warehouse In Company Slides PDF
This slide describes the checklist to implement a data warehouse in the company, including strategies to assess data, organization of data, tools to manage data, and so on. This is a Decision Support System Checklist To Implement Data Warehouse In Company Slides PDF template with various stages. Focus and dispense information on one stages using this creative set, that comes with editable features. It contains large content boxes to add your information on topics like Datas Consistency, Time Stamped, Operational Systems. You can also showcase facts, figures, and other relevant content using this PPT layout. Grab it now.
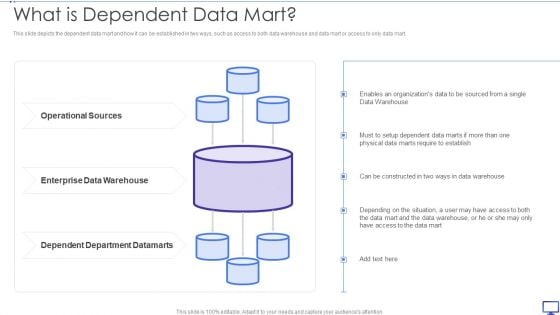
Decision Support System What Is Dependent Data Mart Ppt Layout PDF
This slide depicts the dependent data mart and how it can be established in two ways, such as access to both data warehouse and data mart or access to only data mart. This is a Decision Support System What Is Dependent Data Mart Ppt Layout PDF template with various stages. Focus and dispense information on one stages using this creative set, that comes with editable features. It contains large content boxes to add your information on topics like Operational Sources, Enterprise Data Warehouse, Dependent Department Datamarts. You can also showcase facts, figures, and other relevant content using this PPT layout. Grab it now.
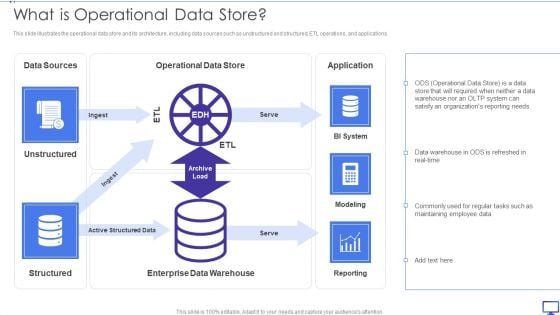
Decision Support System What Is Operational Data Store Ppt Portfolio Example File PDF
This slide illustrates the operational data store and its architecture, including data sources such as unstructured and structured, ETL operations, and applications. This is a Decision Support System What Is Operational Data Store Ppt Portfolio Example File PDF template with various stages. Focus and dispense information on one stages using this creative set, that comes with editable features. It contains large content boxes to add your information on topics like Operational Data Store, Application, Data Sources, Enterprise Data Warehouse. You can also showcase facts, figures, and other relevant content using this PPT layout. Grab it now.

Decision Support System What Is Cloud Data Warehouse Ppt Visual Aids Pictures PDF
This slide depicts what a cloud data warehouse is and how it can store data from many data sources and is scalable as per the organizational needs. Presenting Decision Support System What Is Cloud Data Warehouse Ppt Visual Aids Pictures PDF to provide visual cues and insights. Share and navigate important information on four stages that need your due attention. This template can be used to pitch topics like Data Sources, Cloud Data Warehouse, Essential Component. In addtion, this PPT design contains high resolution images, graphics, etc, that are easily editable and available for immediate download.
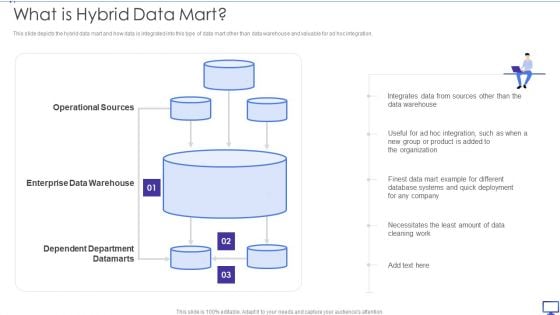
Decision Support System What Is Hybrid Data Mart Ppt Outline Visual Aids PDF
This slide depicts the hybrid data mart and how data is integrated into this type of data mart other than data warehouse and valuable for ad hoc integration. Presenting Decision Support System What Is Hybrid Data Mart Ppt Outline Visual Aids PDF to provide visual cues and insights. Share and navigate important information on three stages that need your due attention. This template can be used to pitch topics like Operational Sources, Enterprise Data Warehouse, Dependent Department Datamarts. In addtion, this PPT design contains high resolution images, graphics, etc, that are easily editable and available for immediate download.
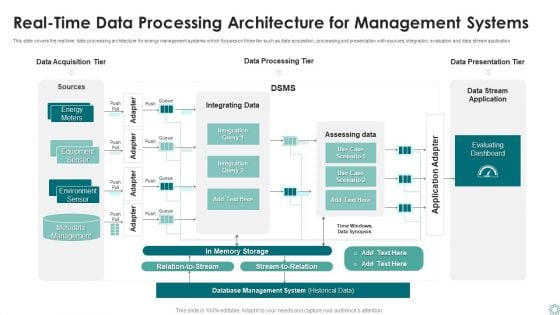
Real Time Data Processing Architecture For Management Systems Ppt Professional Slide Download PDF
This slide covers the real time data processing architecture for energy management systems which focuses on three tier such as data acquisition, processing and presentation with sources, integration, evaluation and data stream application. Persuade your audience using this ocessing Architecture For Management Systems Ppt Professional Slide Download PDF. This PPT design covers one stages, thus making it a great tool to use. It also caters to a variety of topics including Data Acquisition Tier, Data Processing Tier, Data Presentation Tier. Download this PPT design now to present a convincing pitch that not only emphasizes the topic but also showcases your presentation skills.
Emergency Management Data Management Management Facility Planning Ppt PowerPoint Presentation Infographics Graphics Tutorials
This is a emergency management data management management facility planning ppt powerpoint presentation infographics graphics tutorials. This is a two stage process. The stages in this process are emergency management, data management, management facility planning.
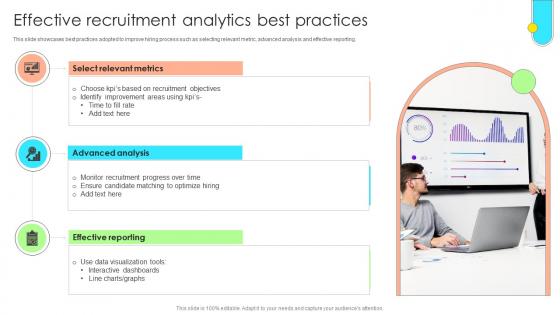
Data Driven Approach To Optimise Effective Recruitment Analytics Best Practices CRP SS V
This slide showcases best practices adopted to improve hiring process such as selecting relevant metric, advanced analysis and effective reporting. Crafting an eye-catching presentation has never been more straightforward. Let your presentation shine with this tasteful yet straightforward Data Driven Approach To Optimise Effective Recruitment Analytics Best Practices CRP SS V template. It offers a minimalistic and classy look that is great for making a statement. The colors have been employed intelligently to add a bit of playfulness while still remaining professional. Construct the ideal Data Driven Approach To Optimise Effective Recruitment Analytics Best Practices CRP SS V that effortlessly grabs the attention of your audience Begin now and be certain to wow your customers This slide showcases best practices adopted to improve hiring process such as selecting relevant metric, advanced analysis and effective reporting.

Global Data Security Industry Report Global Cybersecurity Industry A Quick Snapshot IR SS V
This slide provides a glimpse of key highlights of the cybersecurity industry, enabling executives to grasp the main findings quickly. It serves as a snapshot highlighting revenue, CAGR, fastest growing region, segments, regional breakdown, and key market players. If you are looking for a format to display your unique thoughts, then the professionally designed Global Data Security Industry Report Global Cybersecurity Industry A Quick Snapshot IR SS V is the one for you. You can use it as a Google Slides template or a PowerPoint template. Incorporate impressive visuals, symbols, images, and other charts. Modify or reorganize the text boxes as you desire. Experiment with shade schemes and font pairings. Alter, share or cooperate with other people on your work. Download Global Data Security Industry Report Global Cybersecurity Industry A Quick Snapshot IR SS V and find out how to give a successful presentation. Present a perfect display to your team and make your presentation unforgettable. This slide provides a glimpse of key highlights of the cybersecurity industry, enabling executives to grasp the main findings quickly. It serves as a snapshot highlighting revenue, CAGR, fastest growing region, segments, regional breakdown, and key market players.
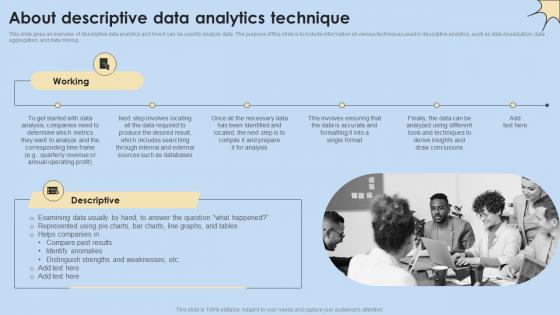
About Descriptive Data Analytics Technique Internet Of Things Analysis Clipart Pdf
This slide gives an overview of descriptive data analytics and how it can be used to analyze data. The purpose of this slide is to include information on various techniques used in descriptive analytics, such as data visualization, data aggregation, and data mining. Find a pre-designed and impeccable About Descriptive Data Analytics Technique Internet Of Things Analysis Clipart Pdf. The templates can ace your presentation without additional effort. You can download these easy-to-edit presentation templates to make your presentation stand out from others. So, what are you waiting for Download the template from Slidegeeks today and give a unique touch to your presentation. This slide gives an overview of descriptive data analytics and how it can be used to analyze data. The purpose of this slide is to include information on various techniques used in descriptive analytics, such as data visualization, data aggregation, and data mining.
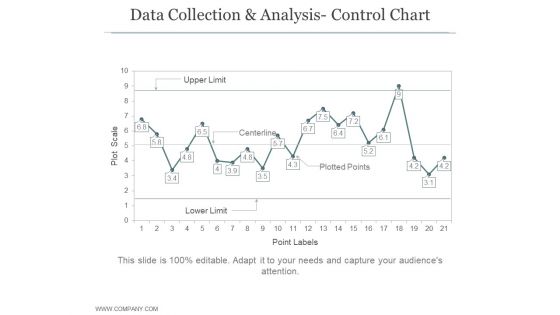
Data Collection And Analysis Control Chart Ppt PowerPoint Presentation Example File
This is a data collection and analysis control chart ppt powerpoint presentation example file. This is a four stage process. The stages in this process are business, strategy, marketing, bar graph, growth strategy.
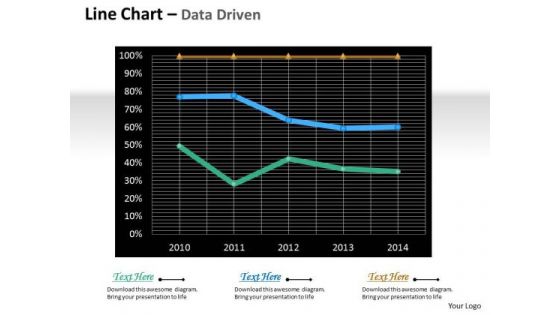
Multivariate Data Analysis Driven Line Chart For Market Survey PowerPoint Slides Templates
Rake In The Dough With
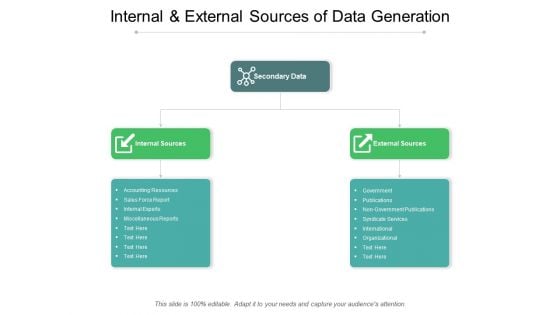
Internal And External Sources Of Data Generation Ppt PowerPoint Presentation Gallery Information
Presenting this set of slides with name internal and external sources of data generation ppt powerpoint presentation gallery information. This is a three stage process. The stages in this process are data sources, database management, marketing. This is a completely editable PowerPoint presentation and is available for immediate download. Download now and impress your audience.
Data Collection Methods And Tools With Icons Ppt PowerPoint Presentation Pictures Structure
Presenting this set of slides with name data collection methods and tools with icons ppt powerpoint presentation pictures structure. This is a six stage process. The stages in this process are data sources, database management, marketing. This is a completely editable PowerPoint presentation and is available for immediate download. Download now and impress your audience.
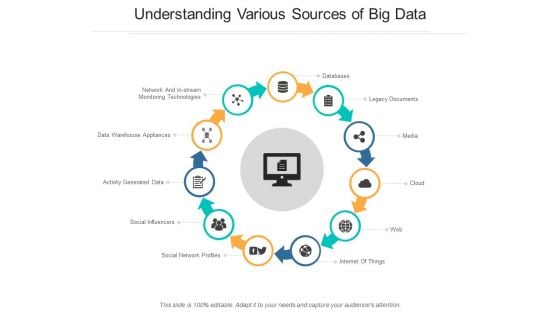
Understanding Various Sources Of Big Data Ppt PowerPoint Presentation Model Slide Download
Presenting this set of slides with name understanding various sources of big data ppt powerpoint presentation model slide download. This is a eleven stage process. The stages in this process are data sources, database management, marketing. This is a completely editable PowerPoint presentation and is available for immediate download. Download now and impress your audience.
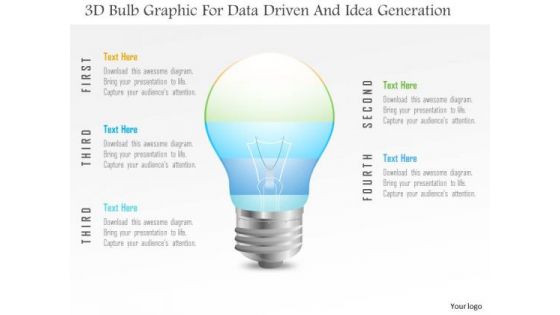
Business Diagram 3d Bulb Graphic For Data Driven And Idea Generation PowerPoint Slide
This Power Point template has been designed with 3d bulb graphic. Use this slide to represent technology idea and strategy concepts. Download this diagram for your business presentations and get exclusive comments on your efforts.

Business Diagram Four Pie Chart For Data Driven Result Analysis Of Business PowerPoint Slide
This business diagram displays graphic of pie charts in shape of flasks. This business slide is suitable to present and compare business data. Use this diagram to build professional presentations for your viewers.
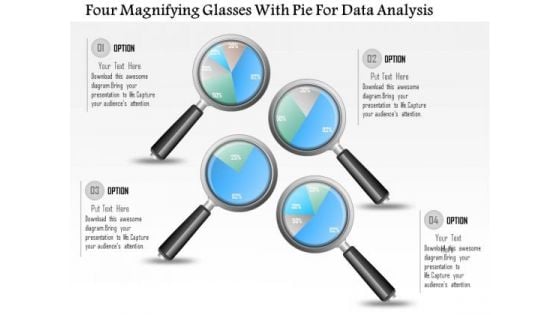
Business Diagram Four Magnifying Glasses With Pie For Data Analysis PowerPoint Slide
This business diagram displays graphic of pie charts in shape of magnifying glasses This business slide is suitable to present and compare business data. Use this diagram to build professional presentations for your viewers.
Decision Support System What Is Data Mart Ppt Icon Infographic Template PDF
This slide depicts the data mart type of data warehouse, its architecture, and how a single department manages it in an organization through limited sources of information. This is a Decision Support System What Is Data Mart Ppt Icon Infographic Template PDF template with various stages. Focus and dispense information on six stages using this creative set, that comes with editable features. It contains large content boxes to add your information on topics like External Sources, Data Feed, Spreadsheets. You can also showcase facts, figures, and other relevant content using this PPT layout. Grab it now.
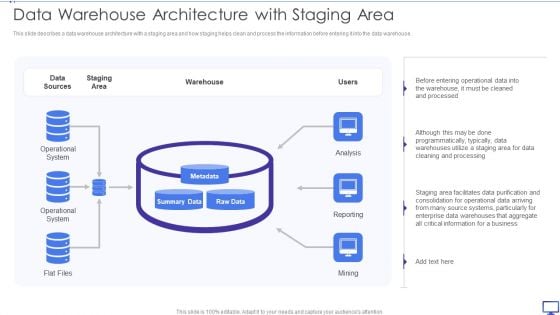
Decision Support System Data Warehouse Architecture With Staging Area Diagrams PDF
This slide describes a data warehouse architecture with a staging area and how staging helps clean and process the information before entering it into the data warehouse. This is a Decision Support System Data Warehouse Architecture With Staging Area Diagrams PDF template with various stages. Focus and dispense information on one stages using this creative set, that comes with editable features. It contains large content boxes to add your information on topics like Data Sources, Staging Area, Operational System. You can also showcase facts, figures, and other relevant content using this PPT layout. Grab it now.
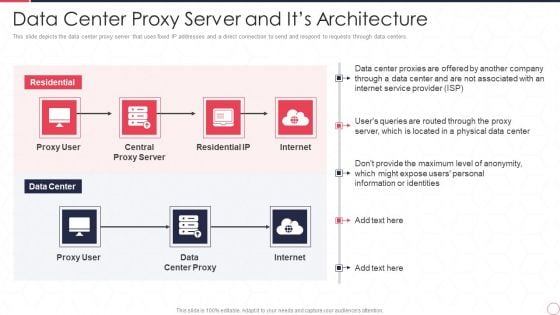
Reverse Proxy Server IT Data Center Proxy Server And Its Architecture Ppt Visual Aids Files PDF
This slide depicts the data center proxy server that uses fixed IP addresses and a direct connection to send and respond to requests through data centers. This is a reverse proxy server it data center proxy server and its architecture ppt visual aids files pdf template with various stages. Focus and dispense information on one stages using this creative set, that comes with editable features. It contains large content boxes to add your information on topics like residential, data center, proxy user, central, proxy server. You can also showcase facts, figures, and other relevant content using this PPT layout. Grab it now.

Decision Support System Top Down Design Approach Of Data Warehouse Download PDF
This slide represents the top-down design approach of the data warehouse, including its features such as time-variant, non-volatile, subject-oriented, etc. This is a Decision Support System Top Down Design Approach Of Data Warehouse Download PDF template with various stages. Focus and dispense information on four stages using this creative set, that comes with editable features. It contains large content boxes to add your information on topics like Data Warehouse, Integrated Data Repository, Source System. You can also showcase facts, figures, and other relevant content using this PPT layout. Grab it now.
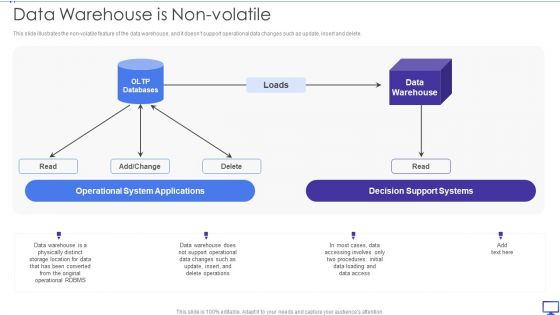
Decision Support System Data Warehouse Is Non Volatile Ppt Professional Vector PDF
This slide illustrates the non-volatile feature of the data warehouse, and it doesnt support operational data changes such as update, insert and delete. This is a Decision Support System Data Warehouse Is Non Volatile Ppt Professional Vector PDF template with various stages. Focus and dispense information on two stages using this creative set, that comes with editable features. It contains large content boxes to add your information on topics like OLTP Databases, Data Warehouse, Decision Support System. You can also showcase facts, figures, and other relevant content using this PPT layout. Grab it now.
Customer Voice Service Data Flow Charts Ppt PowerPoint Presentation Icon Styles PDF
This slide presents a data flow charts, which includes visual data about the inputs and outputs of entities and processes illustrating the flow of information between client voice services and data verse. it covers procedures including create project, distribute survey, respond to survey and analyse results. Presenting Customer Voice Service Data Flow Charts Ppt PowerPoint Presentation Icon Styles PDF to dispense important information. This template comprises one stages. It also presents valuable insights into the topics including Create Project, Distribute Survey, Analyze Results, Project Information. This is a completely customizable PowerPoint theme that can be put to use immediately. So, download it and address the topic impactfully.
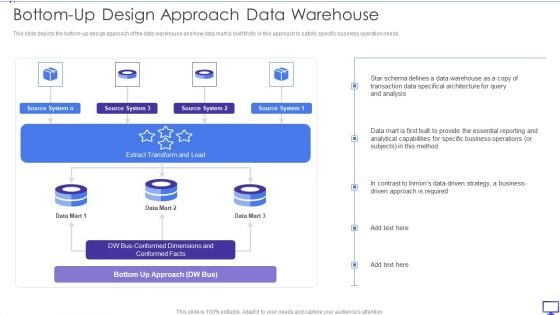
Decision Support System Bottom Up Design Approach Data Warehouse Download PDF
This slide depicts the bottom-up design approach of the data warehouse and how data mart is built firstly in this approach to satisfy specific business operation needs. Presenting Decision Support System Bottom Up Design Approach Data Warehouse Download PDF to provide visual cues and insights. Share and navigate important information on three stages that need your due attention. This template can be used to pitch topics like Source System, Extract Transform Load, Data Mart. In addtion, this PPT design contains high resolution images, graphics, etc, that are easily editable and available for immediate download.
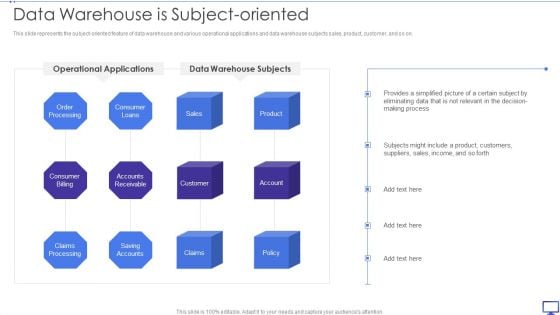
Decision Support System Data Warehouse Is Subject Oriented Ppt Inspiration Objects PDF
This slide represents the subject-oriented feature of data warehouse and various operational applications and data warehouse subjects sales, product, customer, and so on. Presenting Decision Support System Data Warehouse Is Subject Oriented Ppt Inspiration Objects PDF to provide visual cues and insights. Share and navigate important information on one stages that need your due attention. This template can be used to pitch topics like Operational Applications, Data Warehouse Subjects, Order Processing. In addtion, this PPT design contains high resolution images, graphics, etc, that are easily editable and available for immediate download.


 Continue with Email

 Home
Home


