Data Dashboard

Data Breach Prevention Recognition Ppt PowerPoint Presentation Complete Deck With Slides
This complete deck acts as a great communication tool. It helps you in conveying your business message with personalized sets of graphics, icons etc. Comprising a set of fifty slides, this complete deck can help you persuade your audience. It also induces strategic thinking as it has been thoroughly researched and put together by our experts. Not only is it easily downloadable but also editable. The color, graphics, theme any component can be altered to fit your individual needs. So grab it now.

Companys Data Safety Recognition Ppt PowerPoint Presentation Complete Deck With Slides
This complete deck acts as a great communication tool. It helps you in conveying your business message with personalized sets of graphics, icons etc. Comprising a set of fifty one slides, this complete deck can help you persuade your audience. It also induces strategic thinking as it has been thoroughly researched and put together by our experts. Not only is it easily downloadable but also editable. The color, graphics, theme any component can be altered to fit your individual needs. So grab it now.
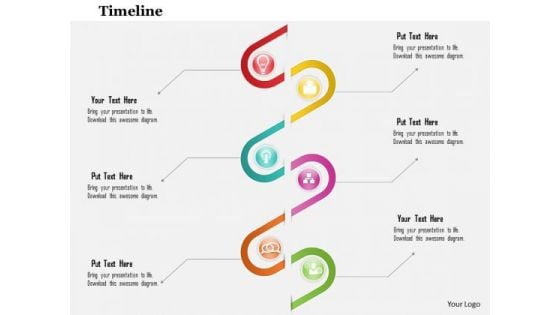
Business Diagram Six Staged Spiral Diagram For Data Flow Presentation Template
This business slide depicts six staged spiral diagram. This diagram provides an effective way of displaying information you can edit text, color, shade and style as per you need. Present your views using this innovative slide and be assured of leaving a lasting impression.
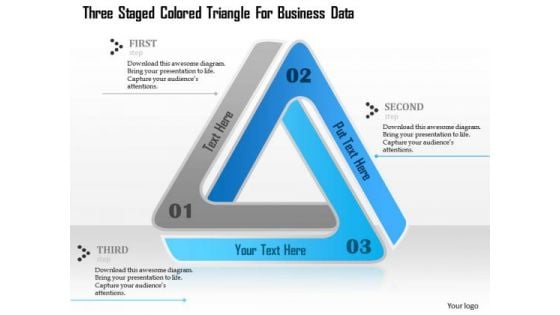
Business Diagram Three Staged Colored Triangle For Business Data Presentation Template
Three staged blue colored triangle has been used to design this business diagram. This slide contains triangle diagram to depict process flow. Use this PPT slide for your business and marketing presentations
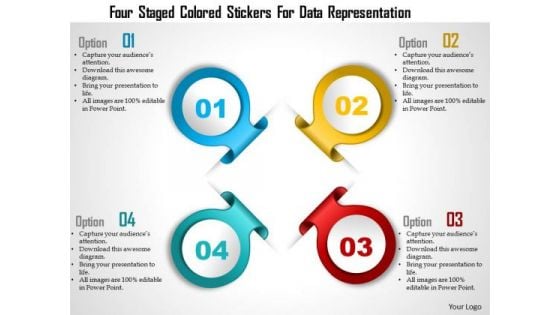
Business Diagram Four Staged Colored Stickers For Data Representation Presentation Template
Graphic of four staged colored stickers been used to design this business slide. This slide depicts four steps of a business process. Make your presentation more interactive with this business slide.

Business Diagram Smiley With Check Box And Pencil For Data Representation Presentation Template
This business diagram has been designed with smiley with check box and pencil. Download this diagram to analyze the key points. This diagram offers a way for your audience to visually conceptualize the process.
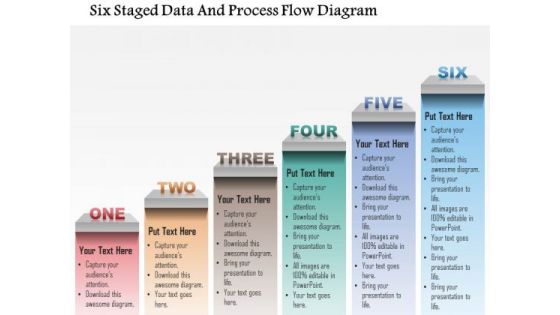
Busines Diagram Six Staged Data And Process Flow Diagram Presentation Template
Six staged diagram has been used to design this business slide. This diagram can be used to show the business processes or workflows. Deliver amazing presentations to mesmerize your audience.
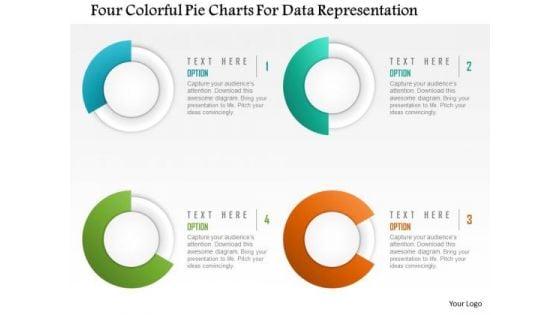
Business Diagram Four Colorful Pie Charts For Data Representation Presentation Template
This diagram is designed with four colorful pie charts. Download this diagram to analyze the key points. This diagram offers a way for your audience to visually conceptualize the process.
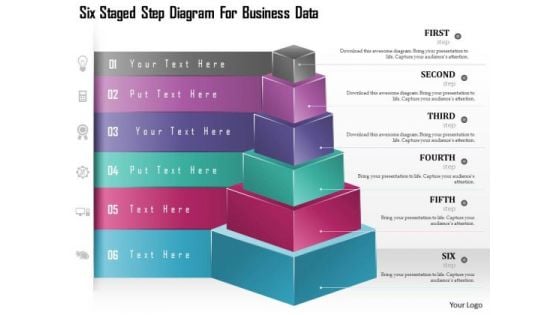
Business Diagram Six Staged Step Diagram For Business Data Presentation Template
Download this diagram to display business development strategies, business plans, decisions, and stages. This Business diagram contains graphics of six steps cubes with icons. Present your views using this innovative slide and be assured of leaving a lasting impression.
Business Diagram Spiral Road Diagram For Data And Timeline Presentation Template
this power point template slide has been designed with graphic of spiral road diagram. This diagram can be used for timeline and business process flow related topics. Use this PPT slide in your business and marketing related presentations.
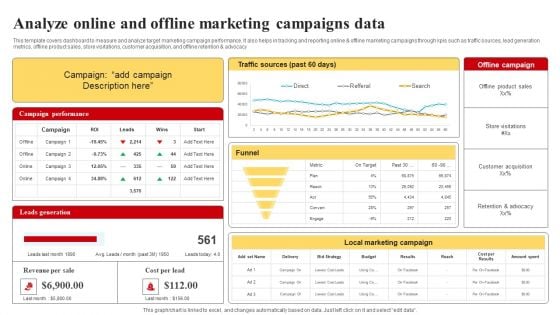
Selecting And Developing An Effective Target Market Strategy Analyze Online And Offline Marketing Campaigns Data Template PDF
This template covers dashboard to measure and analyze target marketing campaign performance. It also helps in tracking and reporting online and offline marketing campaigns through kpis such as traffic sources, lead generation metrics, offline product sales, store visitations, customer acquisition, and offline retention and advocacy If you are looking for a format to display your unique thoughts, then the professionally designed Selecting And Developing An Effective Target Market Strategy Analyze Online And Offline Marketing Campaigns Data Template PDF is the one for you. You can use it as a Google Slides template or a PowerPoint template. Incorporate impressive visuals, symbols, images, and other charts. Modify or reorganize the text boxes as you desire. Experiment with shade schemes and font pairings. Alter, share or cooperate with other people on your work. Download Selecting And Developing An Effective Target Market Strategy Analyze Online And Offline Marketing Campaigns Data Template PDF and find out how to give a successful presentation. Present a perfect display to your team and make your presentation unforgettable.
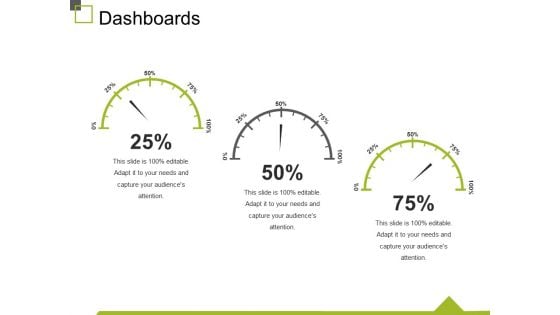
Dashboards Ppt PowerPoint Presentation Slides Layout
This is a dashboards ppt powerpoint presentation slides layout. This is a three stage process. The stages in this process are Dashboards, Percentage, Business, Marketing, Process.
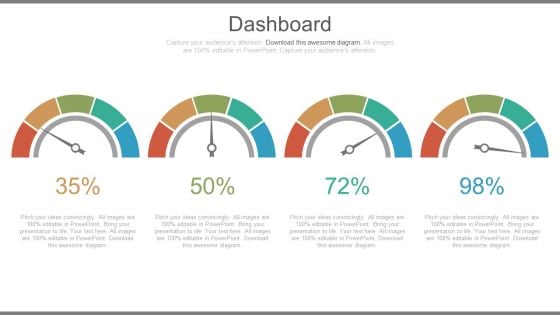
Dashboards For Profit Growth Analysis Powerpoint Slides
This PowerPoint template has been designed with graphics of dashboard. You may use this dashboard slide design to exhibit profit growth analysis. This PPT slide is powerful tool to describe your ideas.
Dashboards For Measuring Business Performance Ppt Icon
This is a dashboards for measuring business performance ppt icon. This is a three stage process. The stages in this process are dashboard, measuring, management, speedometer, icons, strategy.
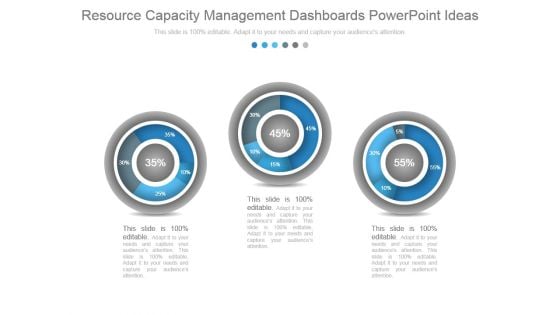
Resource Capacity Management Dashboards Powerpoint Ideas
This is a resource capacity management dashboards powerpoint ideas. This is a three stage process. The stages in this process are dashboard, percentage, measuring, business, marketing.
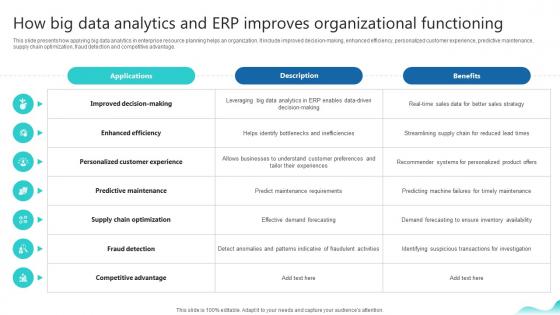
How Big Data Analytics And Erp Improves Organizational Erp And Digital Transformation For Maximizing DT SS V
This slide presents how applying big data analytics in enterprise resource planning helps an organization. It include improved decision-making, enhanced efficiency, personalized customer experience, predictive maintenance, supply chain optimization, fraud detection and competitive advantage.Slidegeeks is one of the best resources for PowerPoint templates. You can download easily and regulate How Big Data Analytics And Erp Improves Organizational Erp And Digital Transformation For Maximizing DT SS V for your personal presentations from our wonderful collection. A few clicks is all it takes to discover and get the most relevant and appropriate templates. Use our Templates to add a unique zing and appeal to your presentation and meetings. All the slides are easy to edit and you can use them even for advertisement purposes. This slide presents how applying big data analytics in enterprise resource planning helps an organization. It include improved decision-making, enhanced efficiency, personalized customer experience, predictive maintenance, supply chain optimization, fraud detection and competitive advantage.
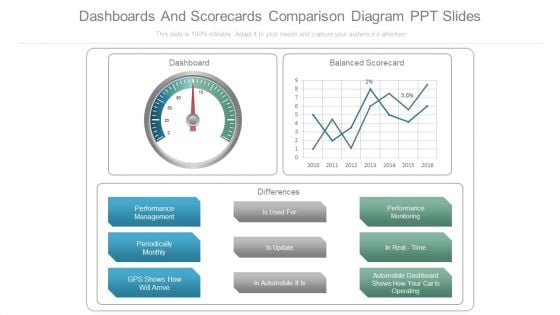
Dashboards And Scorecards Comparison Diagram Ppt Slides
This is a dashboards and scorecards comparison diagram ppt slides. This is a three stage process. The stages in this process are dashboard, balanced scorecard, differences, performance management, periodically monthly, gps shows how will arrive, is used for, is update, in automobile it is, performance monitoring, in real time, automobile dashboard shows how your car is operating.
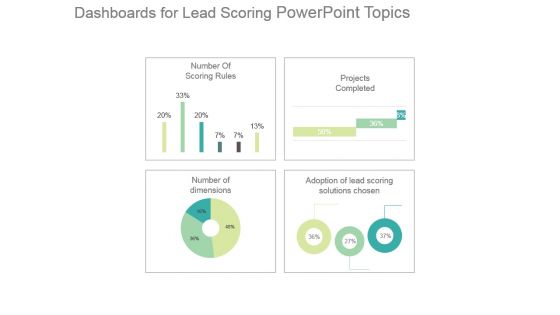
Dashboards For Lead Scoring Powerpoint Topics
This is a dashboards for lead scoring powerpoint topics. This is a four stage process. The stages in this process are number of scoring rules, projects completed, adoption of lead scoring solutions chosen, number of dimensions.
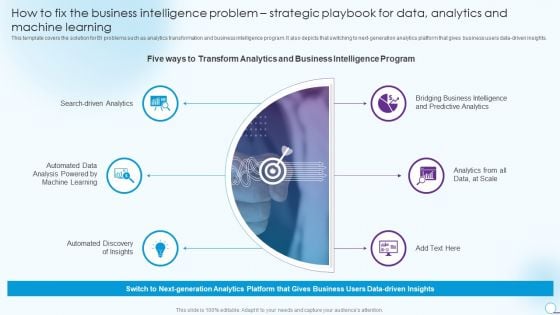
How To Fix The Business Intelligence Problem Strategic Playbook For Data Analytics And Machine Learning Designs PDF
This template covers the solution for BI problems such as analytics transformation and business intelligence program. It also depicts that switching to next generation analytics platform that gives business users data driven insights. This is a How To Fix The Business Intelligence Problem Strategic Playbook For Data Analytics And Machine Learning Designs PDF template with various stages. Focus and dispense information on six stages using this creative set, that comes with editable features. It contains large content boxes to add your information on topics like Automated Data Analysis, Search Driven Analytics, Predictive Analytics. You can also showcase facts, figures, and other relevant content using this PPT layout. Grab it now.
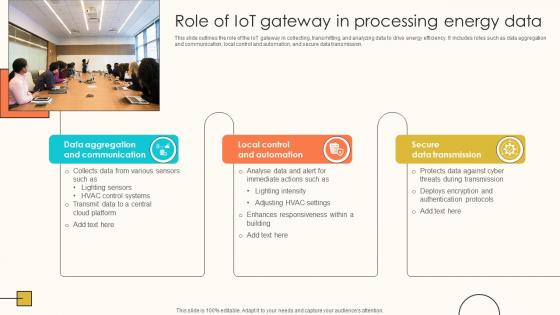
Role Of IoT Gateway In Processing Energy Data Internet Of Things Solutions To Enhance Energy IoT SS V
This slide outlines the role of the IoT gateway in collecting, transmitting, and analyzing data to drive energy efficiency. It includes roles such as data aggregation and communication, local control and automation, and secure data transmission. Do you know about Slidesgeeks Role Of IoT Gateway In Processing Energy Data Internet Of Things Solutions To Enhance Energy IoT SS V These are perfect for delivering any kind od presentation. Using it, create PowerPoint presentations that communicate your ideas and engage audiences. Save time and effort by using our pre-designed presentation templates that are perfect for a wide range of topic. Our vast selection of designs covers a range of styles, from creative to business, and are all highly customizable and easy to edit. Download as a PowerPoint template or use them as Google Slides themes. This slide outlines the role of the IoT gateway in collecting, transmitting, and analyzing data to drive energy efficiency. It includes roles such as data aggregation and communication, local control and automation, and secure data transmission.
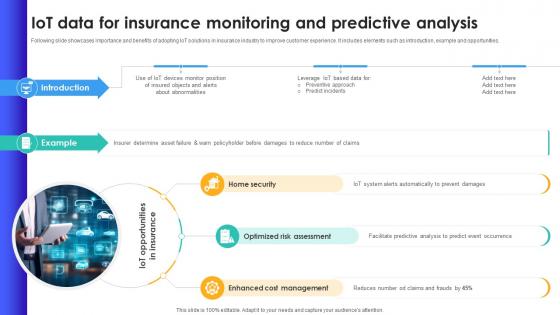
IoT Data For Insurance Monitoring And Predictive Analysis IoT In Banking For Digital Future IoT SS V
Following slide showcases importance and benefits of adopting IoT solutions in insurance industry to improve customer experience. It includes elements such as introduction, example and opportunities. Whether you have daily or monthly meetings, a brilliant presentation is necessary. IoT Data For Insurance Monitoring And Predictive Analysis IoT In Banking For Digital Future IoT SS V can be your best option for delivering a presentation. Represent everything in detail using IoT Data For Insurance Monitoring And Predictive Analysis IoT In Banking For Digital Future IoT SS V and make yourself stand out in meetings. The template is versatile and follows a structure that will cater to your requirements. All the templates prepared by Slidegeeks are easy to download and edit. Our research experts have taken care of the corporate themes as well. So, give it a try and see the results. Following slide showcases importance and benefits of adopting IoT solutions in insurance industry to improve customer experience. It includes elements such as introduction, example and opportunities.
Data Search With Various Charts To Recognize Market Trends Icon Ppt PowerPoint Presentation Infographic Template Clipart PDF
Persuade your audience using this data search with various charts to recognize market trends icon ppt powerpoint presentation infographic template clipart pdf. This PPT design covers three stages, thus making it a great tool to use. It also caters to a variety of topics including data search with various charts to recognize market trends icon. Download this PPT design now to present a convincing pitch that not only emphasizes the topic but also showcases your presentation skills.
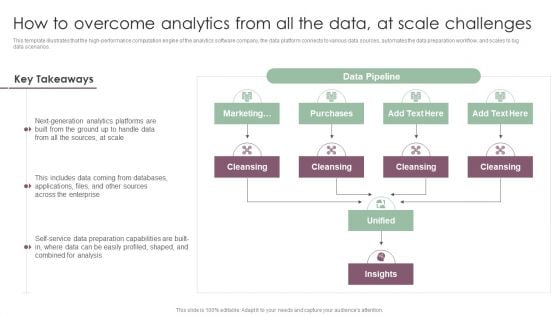
Information Analysis And BI Playbook How To Overcome Analytics From All The Data At Scale Challenges Microsoft PDF
This template illustrates that the high performance computation engine of the analytics software company, the data platform connects to various data sources, automates the data preparation workflow, and scales to big data scenarios. Crafting an eye catching presentation has never been more straightforward. Let your presentation shine with this tasteful yet straightforward Information Analysis And BI Playbook How To Overcome Analytics From All The Data At Scale Challenges Microsoft PDF template. It offers a minimalistic and classy look that is great for making a statement. The colors have been employed intelligently to add a bit of playfulness while still remaining professional. Construct the ideal Information Analysis And BI Playbook How To Overcome Analytics From All The Data At Scale Challenges Microsoft PDF that effortlessly grabs the attention of your audience Begin now and be certain to wow your customers.
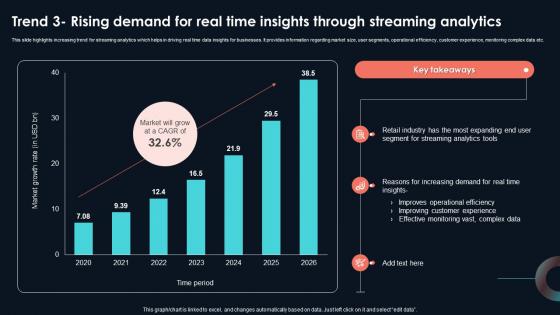
Trend 3 Rising Demand For Real Time Insights Developing Strategic Insights Using Big Data Analytics SS V
This slide highlights increasing trend for streaming analytics which helps in driving real time data insights for businesses. It provides information regarding market size, user segments, operational efficiency, customer experience, monitoring complex data etc. Take your projects to the next level with our ultimate collection of Trend 3 Rising Demand For Real Time Insights Developing Strategic Insights Using Big Data Analytics SS V. Slidegeeks has designed a range of layouts that are perfect for representing task or activity duration, keeping track of all your deadlines at a glance. Tailor these designs to your exact needs and give them a truly corporate look with your own brand colors they will make your projects stand out from the rest This slide highlights increasing trend for streaming analytics which helps in driving real time data insights for businesses. It provides information regarding market size, user segments, operational efficiency, customer experience, monitoring complex data etc.
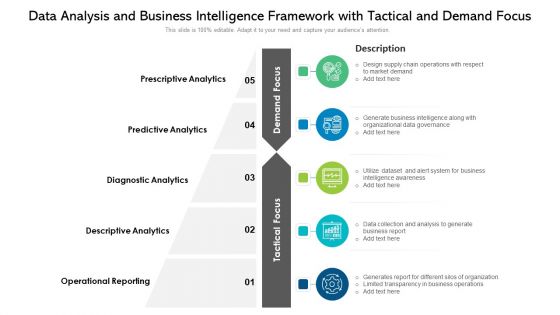
Data Analysis And Business Intelligence Framework With Tactical And Demand Focus Ppt PowerPoint Presentation Model Portfolio PDF
Persuade your audience using this data analysis and business intelligence framework with tactical and demand focus ppt powerpoint presentation model portfolio pdf. This PPT design covers five stages, thus making it a great tool to use. It also caters to a variety of topics including prescriptive analytics, diagnostic analytics, operational reporting. Download this PPT design now to present a convincing pitch that not only emphasizes the topic but also showcases your presentation skills.
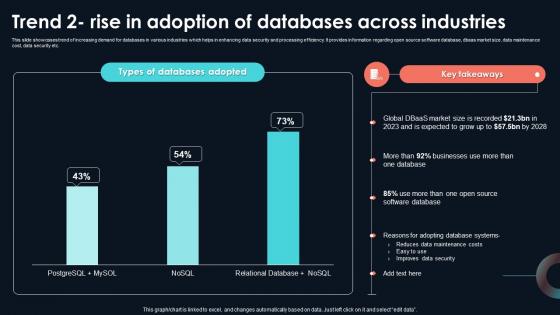
Trend 2 Rise In Adoption Of Databases Across Developing Strategic Insights Using Big Data Analytics SS V
This slide showcases trend of increasing demand for databases in various industries which helps in enhancing data security and processing efficiency. It provides information regarding open source software database, dbaas market size, data maintenance cost, data security etc. This Trend 2 Rise In Adoption Of Databases Across Developing Strategic Insights Using Big Data Analytics SS V from Slidegeeks makes it easy to present information on your topic with precision. It provides customization options, so you can make changes to the colors, design, graphics, or any other component to create a unique layout. It is also available for immediate download, so you can begin using it right away. Slidegeeks has done good research to ensure that you have everything you need to make your presentation stand out. Make a name out there for a brilliant performance. This slide showcases trend of increasing demand for databases in various industries which helps in enhancing data security and processing efficiency. It provides information regarding open source software database, dbaas market size, data maintenance cost, data security etc.

Information Analysis And BI Playbook How To Fix The Business Intelligence Problem Data Analytics Playbook Designs PDF
This template covers the solution for BI problems such as analytics transformation and business intelligence program. It also depicts that switching to next generation analytics platform that gives business users data-driven insights. Get a simple yet stunning designed Information Analysis And BI Playbook How To Fix The Business Intelligence Problem Data Analytics Playbook Designs PDF. It is the best one to establish the tone in your meetings. It is an excellent way to make your presentations highly effective. So, download this PPT today from Slidegeeks and see the positive impacts. Our easy to edit Information Analysis And BI Playbook How To Fix The Business Intelligence Problem Data Analytics Playbook Designs PDF can be your go to option for all upcoming conferences and meetings. So, what are you waiting for Grab this template today.
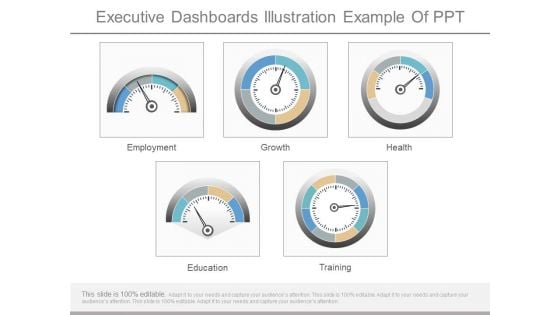
Executive Dashboards Illustration Example Of Ppt
This is a executive dashboards illustration example of ppt. This is a five stage process. The stages in this process are employment, growth, health, education, training.

Business Company Dashboards Ppt Powerpoint Slide Show
This is a business company dashboards ppt powerpoint slide show. This is a four stage process. The stages in this process are presentation, finance, management, business, strategy, success.
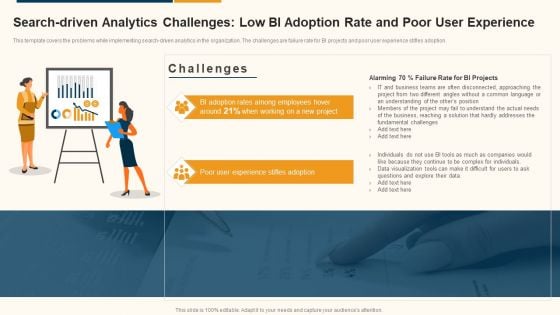
Data Interpretation And Analysis Playbook Search Driven Analytics Challenges Low Bi Adoption Rate And Poor Demonstration PDF
This template covers the problems while implementing search-driven analytics in the organization. The challenges are failure rate for BI projects and poor user experience stifles adoption. Presenting data interpretation and analysis playbook search driven analytics challenges low bi adoption rate and poor demonstration pdf to provide visual cues and insights. Share and navigate important information on two stages that need your due attention. This template can be used to pitch topics like business, data visualization, fundamental challenges. In addtion, this PPT design contains high resolution images, graphics, etc, that are easily editable and available for immediate download.
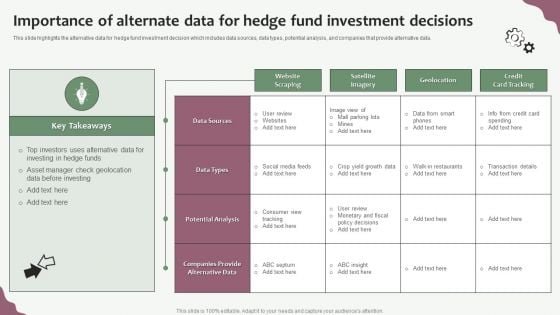
Hedge Funds Trading And Investing Strategies Importance Of Alternate Data For Hedge Fund Investment Decisions Template PDF
This slide highlights the alternative data for hedge fund investment decision which includes data sources, data types, potential analysis, and companies that provide alternative data. Deliver an awe inspiring pitch with this creative Hedge Funds Trading And Investing Strategies Importance Of Alternate Data For Hedge Fund Investment Decisions Template PDF bundle. Topics like Data Sources, Potential Analysis, Companies Provide Alternative Data can be discussed with this completely editable template. It is available for immediate download depending on the needs and requirements of the user.
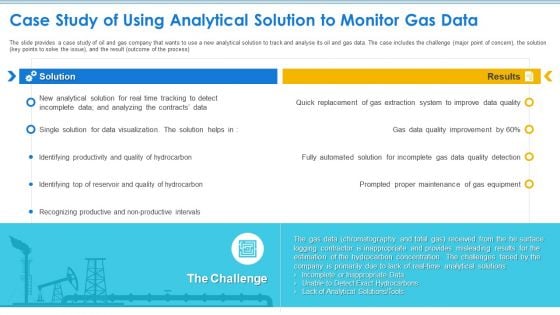
Case Competition Petroleum Sector Issues Case Study Of Using Analytical Solution To Monitor Gas Data Slides PDF
The slide provides a case study of oil and gas company that wants to use a new analytical solution to track and analyse its oil and gas data. The case includes the challenge major point of concern, the solution key points to solve the issue, and the result outcome of the process. Deliver an awe inspiring pitch with this creative case competition petroleum sector issues case study of using analytical solution to monitor gas data slides pdf bundle. Topics like productivity and quality of hydrocarbon, quality of hydrocarbon, extraction system to improve data quality, prompted proper maintenance of gas equipment can be discussed with this completely editable template. It is available for immediate download depending on the needs and requirements of the user.
Business Diagram Big Data Analysis From Feed Of Zeros And Ones 0s And 1s Magnifying Glass Ppt Slide
This PowerPoint template has been designed with graphic of magnifier on big data text. This magnifier is magnifying the binary data. This slide can be used to represent topics like binary, programming, coding etc.
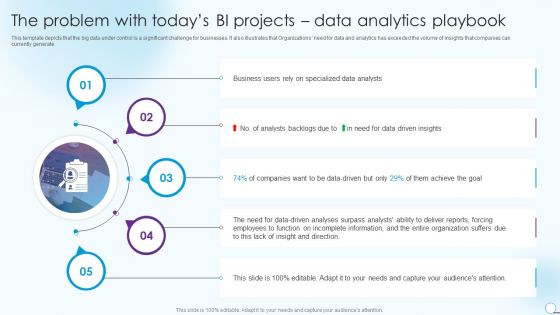
Information Analytics And Ml Strategy Playbook The Problem With Todays BI Projects Data Analytics Playbook Rules PDF
This template depicts that the big data under control is a significant challenge for businesses. It also illustrates that Organizations need for data and analytics has exceeded the volume of insights that companies can currently generate. This is a Information Analytics And Ml Strategy Playbook The Problem With Todays BI Projects Data Analytics Playbook Rules PDF template with various stages. Focus and dispense information on five stages using this creative set, that comes with editable features. It contains large content boxes to add your information on topics like Specialized Data Analysts, Business Users, Entire Organization. You can also showcase facts, figures, and other relevant content using this PPT layout. Grab it now.
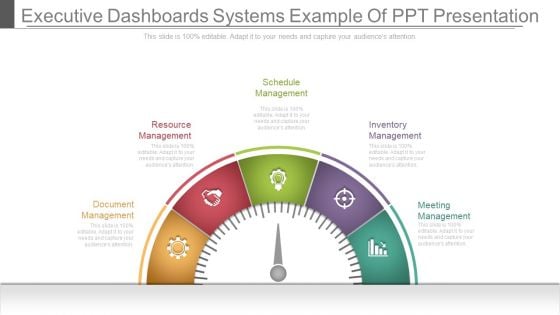
Executive Dashboards Systems Example Of Ppt Presentation
This is a executive dashboards systems example of ppt presentation. This is a five stage process. The stages in this process are schedule management, resource management, document management, inventory management, meeting management.
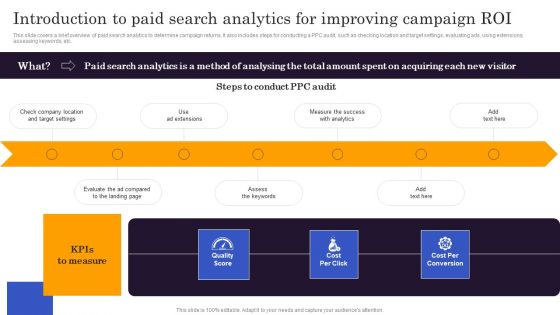
Marketers Guide To Data Analysis Optimization Introduction To Paid Search Analytics For Improving Campaign Roi Demonstration PDF
This slide covers a brief overview of paid search analytics to determine campaign returns. It also includes steps for conducting a PPC audit, such as checking location and target settings, evaluating ads, using extensions, assessing keywords, etc. The best PPT templates are a great way to save time, energy, and resources. Slidegeeks have 100 percent editable powerpoint slides making them incredibly versatile. With these quality presentation templates, you can create a captivating and memorable presentation by combining visually appealing slides and effectively communicating your message. Download Marketers Guide To Data Analysis Optimization Introduction To Paid Search Analytics For Improving Campaign Roi Demonstration PDF from Slidegeeks and deliver a wonderful presentation.
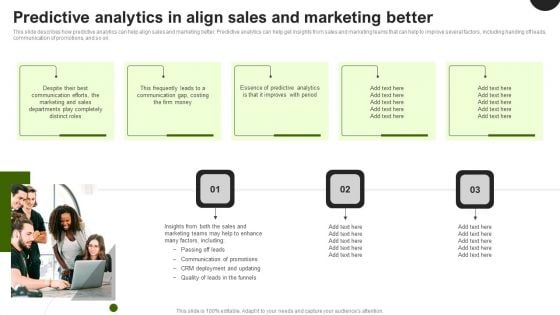
Predictive Analytics In The Age Of Big Data Predictive Analytics In Align Sales And Marketing Better Topics PDF
This slide describes how predictive analytics can help align sales and marketing better. Predictive analytics can help get insights from sales and marketing teams that can help to improve several factors, including handing off leads, communication of promotions, and so on. This modern and well arranged Predictive Analytics In The Age Of Big Data Predictive Analytics In Align Sales And Marketing Better Topics PDF provides lots of creative possibilities. It is very simple to customize and edit with the Powerpoint Software. Just drag and drop your pictures into the shapes. All facets of this template can be edited with Powerpoint no extra software is necessary. Add your own material, put your images in the places assigned for them, adjust the colors, and then you can show your slides to the world, with an animated slide included.
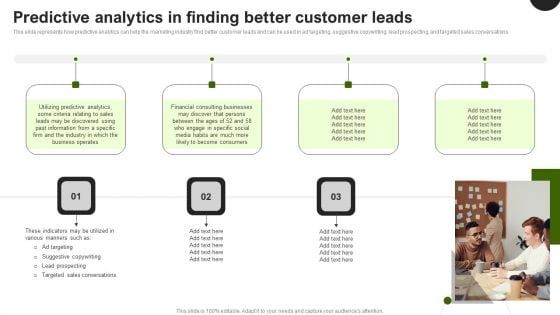
Predictive Analytics In The Age Of Big Data Predictive Analytics In Finding Better Customer Leads Diagrams PDF
This slide represents how predictive analytics can help the marketing industry find better customer leads and can be used in ad targeting, suggestive copywriting, lead prospecting, and targeted sales conversations. Welcome to our selection of the Predictive Analytics In The Age Of Big Data Predictive Analytics In Finding Better Customer Leads Diagrams PDF. These are designed to help you showcase your creativity and bring your sphere to life. Planning and Innovation are essential for any business that is just starting out. This collection contains the designs that you need for your everyday presentations. All of our PowerPoints are 100 percent editable, so you can customize them to suit your needs. This multi purpose template can be used in various situations. Grab these presentation templates today.
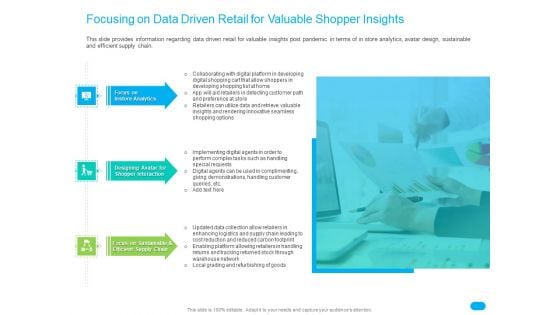
Post COVID Recovery Strategy For Retail Industry Focusing On Data Driven Retail For Valuable Shopper Insights Topics PDF
This slide provides information regarding data driven retail for valuable insights post pandemic in terms of in store analytics, avatar design, sustainable and efficient supply chain. This is a post covid recovery strategy for retail industry focusing on data driven retail for valuable shopper insights topics pdf template with various stages. Focus and dispense information on three stages using this creative set, that comes with editable features. It contains large content boxes to add your information on topics like focus on instore analytics, designing avatar for shopper interaction, focus on sustainable and efficient supply chain. You can also showcase facts, figures, and other relevant content using this PPT layout. Grab it now.
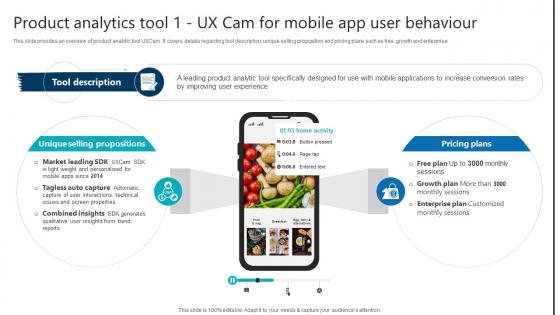
Product Analytics Tool 1 UX Cam For Mobile App User Behaviour Product Analytics Implementation Data Analytics V
This slide provides an overview of product analytic tool UXCam. It covers details regarding tool description, unique selling proposition and pricing plans such as free, growth and enterprise.Present like a pro with Product Analytics Tool 1 UX Cam For Mobile App User Behaviour Product Analytics Implementation Data Analytics V. Create beautiful presentations together with your team, using our easy-to-use presentation slides. Share your ideas in real-time and make changes on the fly by downloading our templates. So whether you are in the office, on the go, or in a remote location, you can stay in sync with your team and present your ideas with confidence. With Slidegeeks presentation got a whole lot easier. Grab these presentations today. This slide provides an overview of product analytic tool UXCam. It covers details regarding tool description, unique selling proposition and pricing plans such as free, growth and enterprise.
Types Of Enterprise Decision Management With Accounting System And Data Analysis System Ppt PowerPoint Presentation Outline Icon PDF
Presenting this set of slides with name types of enterprise decision management with accounting system and data analysis system ppt powerpoint presentation outline icon pdf. This is a five stage process. The stages in this process are status inquiry system, information analysis system, model based system data analysis system. This is a completely editable PowerPoint presentation and is available for immediate download. Download now and impress your audience.
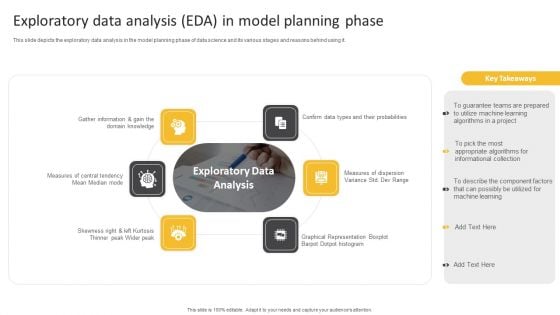
Information Science Exploratory Data Analysis EDA In Model Planning Phase Ppt PowerPoint Presentation Infographics Graphics Pictures PDF
This slide depicts the exploratory data analysis in the model planning phase of data science and its various stages and reasons behind using it.This is a Information Science Exploratory Data Analysis EDA In Model Planning Phase Ppt PowerPoint Presentation Infographics Graphics Pictures PDF template with various stages. Focus and dispense information on six stages using this creative set, that comes with editable features. It contains large content boxes to add your information on topics like Measures Dispersion, Graphical Representation, Skewness Right. You can also showcase facts, figures, and other relevant content using this PPT layout. Grab it now.
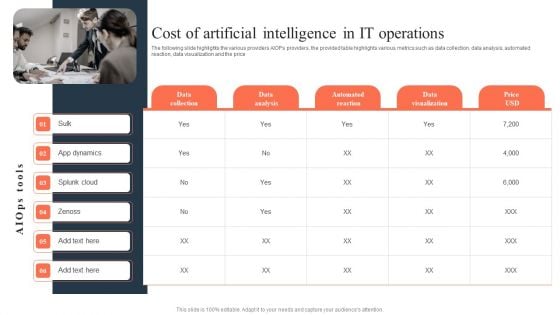
Ml And Big Data In Information Technology Processes Cost Of Artificial Intelligence In IT Operations Infographics PDF
The following slide highlights the various providers AIOPs providers, the provided table highlights various metrics such as data collection, data analysis, automated reaction, data visualization and the price Do you have to make sure that everyone on your team knows about any specific topic I yes, then you should give Ml And Big Data In Information Technology Processes Cost Of Artificial Intelligence In IT Operations Infographics PDF a try. Our experts have put a lot of knowledge and effort into creating this impeccable Ml And Big Data In Information Technology Processes Cost Of Artificial Intelligence In IT Operations Infographics PDF. You can use this template for your upcoming presentations, as the slides are perfect to represent even the tiniest detail. You can download these templates from the Slidegeeks website and these are easy to edit. So grab these today.
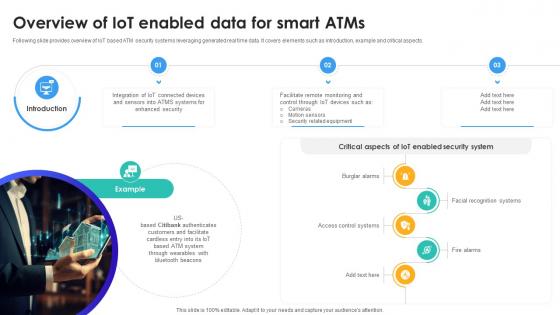
Overview Of IoT Enabled Data For Smart Atms IoT In Banking For Digital Future IoT SS V
Following slide provides overview of IoT based ATM security systems leveraging generated real time data. It covers elements such as introduction, example and critical aspects. Retrieve professionally designed Overview Of IoT Enabled Data For Smart Atms IoT In Banking For Digital Future IoT SS V to effectively convey your message and captivate your listeners. Save time by selecting pre-made slideshows that are appropriate for various topics, from business to educational purposes. These themes come in many different styles, from creative to corporate, and all of them are easily adjustable and can be edited quickly. Access them as PowerPoint templates or as Google Slides themes. You do not have to go on a hunt for the perfect presentation because Slidegeeks got you covered from everywhere. Following slide provides overview of IoT based ATM security systems leveraging generated real time data. It covers elements such as introduction, example and critical aspects.
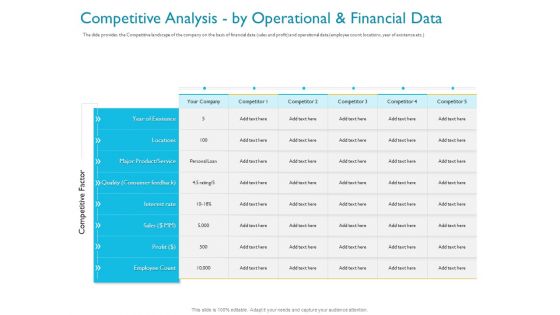
Investor Funding Deck For Hybrid Financing Competitive Analysis By Operational And Financial Data Ppt Pictures Rules PDF
The slide provides the Competitive landscape of the company on the basis of financial data sales and profit and operational data employee count, locations, year of existence etc. Deliver and pitch your topic in the best possible manner with this investor funding deck for hybrid financing competitive analysis by operational and financial data ppt pictures rules pdf. Use them to share invaluable insights on locations, sales, interest rate, major product, service, employee count, quality, consumer feedback and impress your audience. This template can be altered and modified as per your expectations. So, grab it now.
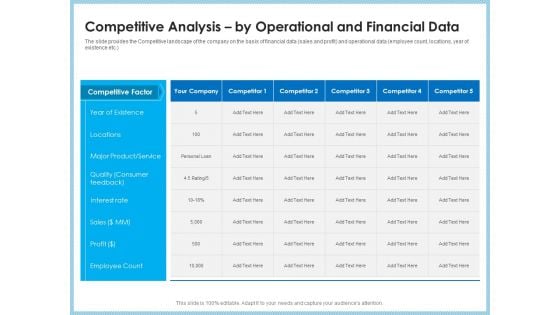
Investment Pitch To Generating Capital From Mezzanine Credit Competitive Analysis By Operational And Financial Data Inspiration PDF
The slide provides the Competitive landscape of the company on the basis of financial data sales and profit and operational data employee count, locations, year of existence etc. Deliver and pitch your topic in the best possible manner with this investment pitch to generating capital from mezzanine credit competitive analysis by operational and financial data inspiration pdf. Use them to share invaluable insights on competitive factor, year existence, locations, major product, service, quality consumer, interest rate and impress your audience. This template can be altered and modified as per your expectations. So, grab it now.

Investor Pitch Deck To Collect Capital From Subordinated Loan Competitive Analysis By Operational And Financial Data Diagrams PDF
The slide provides the Competitive landscape of the company on the basis of financial data sales and profit and operational data employee count, locations, year of existence etc. Deliver an awe-inspiring pitch with this creative investor pitch deck to collect capital from subordinated loan competitive analysis by operational and financial data diagrams pdf bundle. Topics like year existence, locations, major product service, interest rate, sales, employee count, profit can be discussed with this completely editable template. It is available for immediate download depending on the needs and requirements of the user.
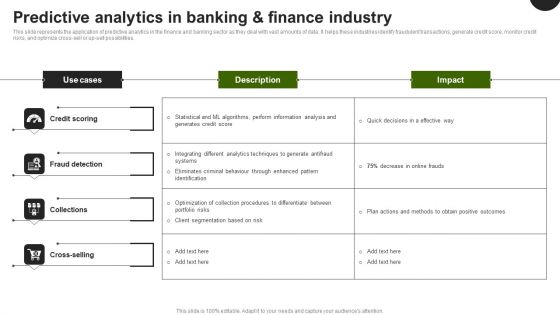
Predictive Analytics In The Age Of Big Data Predictive Analytics In Banking And Finance Industry Microsoft PDF
This slide represents the application of predictive analytics in the finance and banking sector as they deal with vast amounts of data. It helps these industries identify fraudulent transactions, generate credit score, monitor credit risks, and optimize cross-sell or up-sell possibilities. This Predictive Analytics In The Age Of Big Data Predictive Analytics In Banking And Finance Industry Microsoft PDF is perfect for any presentation, be it in front of clients or colleagues. It is a versatile and stylish solution for organizing your meetings. The Predictive Analytics In The Age Of Big Data Predictive Analytics In Banking And Finance Industry Microsoft PDF features a modern design for your presentation meetings. The adjustable and customizable slides provide unlimited possibilities for acing up your presentation. Slidegeeks has done all the homework before launching the product for you. So, do not wait, grab the presentation templates today
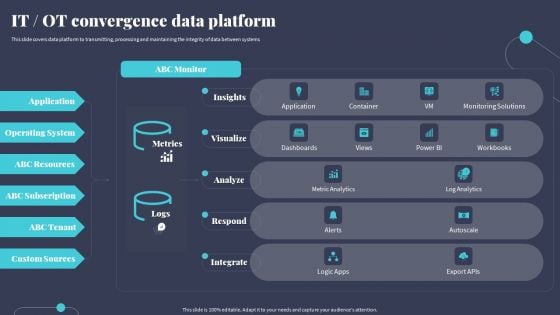
Tactics For Incorporating OT And IT With The Latest PI Systemit OT Convergence Data Platform Guidelines PDF
This slide covers data platform to transmitting, processing and maintaining the integrity of data between systems. If your project calls for a presentation, then Slidegeeks is your go-to partner because we have professionally designed, easy-to-edit templates that are perfect for any presentation. After downloading, you can easily edit Tactics For Incorporating OT And IT With The Latest PI Systemit OT Convergence Data Platform Guidelines PDF and make the changes accordingly. You can rearrange slides or fill them with different images. Check out all the handy templates
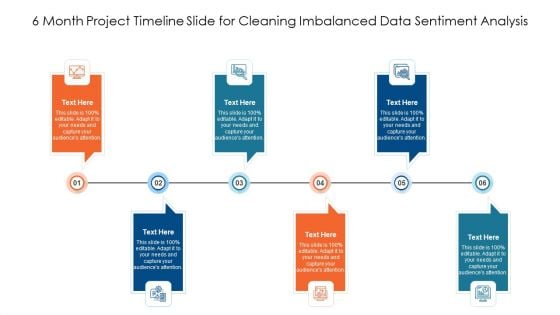
6 Month Project Timeline Slide For Cleaning Imbalanced Data Sentiment Analysis Ppt PowerPoint Presentation File Deck PDF
Presenting 6 month project timeline slide for cleaning imbalanced data sentiment analysis ppt powerpoint presentation file deck pdf to dispense important information. This template comprises six stages. It also presents valuable insights into the topics including 6 month project timeline slide for cleaning imbalanced data sentiment analysis. This is a completely customizable PowerPoint theme that can be put to use immediately. So, download it and address the topic impactfully.
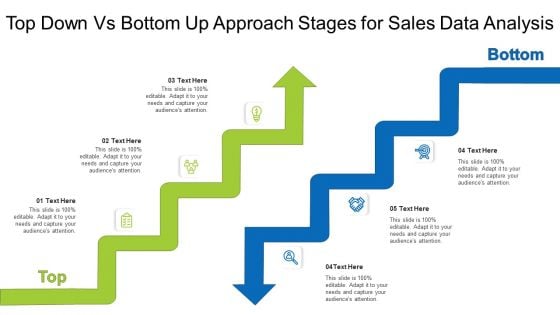
Top Down Vs Bottom Up Approach Stages For Sales Data Analysis Ppt PowerPoint Presentation Inspiration Template PDF
Presenting top down vs bottom up approach stages for sales data analysis ppt powerpoint presentation inspiration template pdf to dispense important information. This template comprises two stages. It also presents valuable insights into the topics including top down vs bottom up approach stages for sales data analysis. This is a completely customizable PowerPoint theme that can be put to use immediately. So, download it and address the topic impactfully.
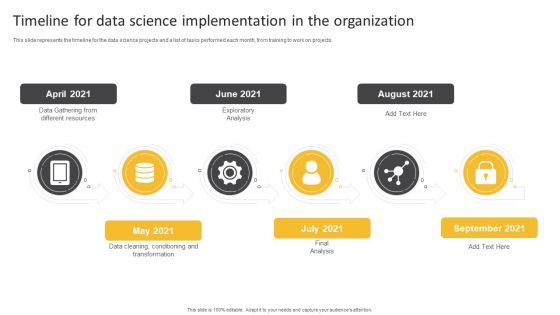
Information Science Timeline For Data Science Implementation In The Organization Ppt PowerPoint Presentation Infographic Template Slideshow PDF
This slide represents the timeline for the data science projects and a list of tasks performed each month, from training to work on projects.This is a Information Science Timeline For Data Science Implementation In The Organization Ppt PowerPoint Presentation Infographic Template Slideshow PDF template with various stages. Focus and dispense information on six stages using this creative set, that comes with editable features. It contains large content boxes to add your information on topics like Data Gathering, Exploratory Analysis, Final Analysis. You can also showcase facts, figures, and other relevant content using this PPT layout. Grab it now.
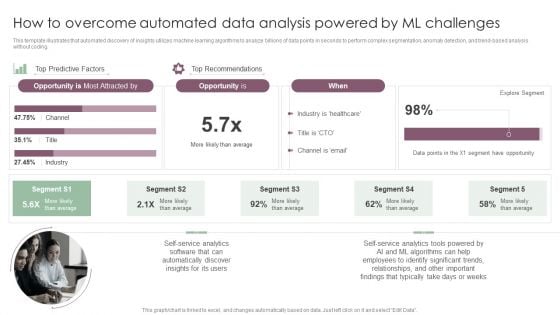
Information Analysis And BI Playbook How To Overcome Automated Data Analysis Powered By Ml Challenges Clipart PDF
This template illustrates that automated discovery of insights utilizes machine learning algorithms to analyze billions of data points in seconds to perform complex segmentation, anomaly detection, and trend-based analysis without coding. Make sure to capture your audiences attention in your business displays with our gratis customizable Information Analysis And BI Playbook How To Overcome Automated Data Analysis Powered By Ml Challenges Clipart PDF. These are great for business strategies, office conferences, capital raising or task suggestions. If you desire to acquire more customers for your tech business and ensure they stay satisfied, create your own sales presentation with these plain slides.

Marketers Guide To Data Analysis Optimization Analyzing Cost Per Click CPC To Ensure Higher ROI Slides PDF
Get a simple yet stunning designed Marketers Guide To Data Analysis Optimization Analyzing Cost Per Click CPC To Ensure Higher ROI Slides PDF. It is the best one to establish the tone in your meetings. It is an excellent way to make your presentations highly effective. So, download this PPT today from Slidegeeks and see the positive impacts. Our easy to edit Marketers Guide To Data Analysis Optimization Analyzing Cost Per Click CPC To Ensure Higher ROI Slides PDF can be your go to option for all upcoming conferences and meetings. So, what are you waiting for Grab this template today.
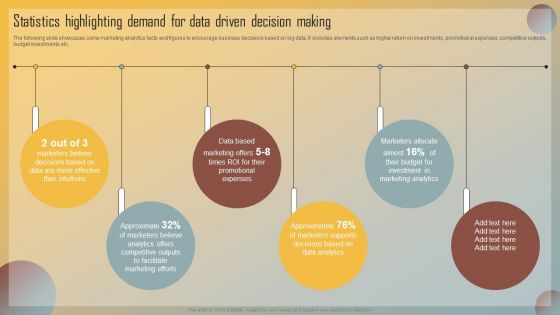
Guide For Marketing Analytics To Improve Decisions Statistics Highlighting Demand For Data Driven Decision Making Slides PDF
The following slide showcases some marketing analytics facts and figures to encourage business decisions based on big data. It includes elements such as higher return on investments, promotional expenses, competitive outputs, budget investments etc. This modern and well arranged Guide For Marketing Analytics To Improve Decisions Statistics Highlighting Demand For Data Driven Decision Making Slides PDF provides lots of creative possibilities. It is very simple to customize and edit with the Powerpoint Software. Just drag and drop your pictures into the shapes. All facets of this template can be edited with Powerpoint no extra software is necessary. Add your own material, put your images in the places assigned for them, adjust the colors, and then you can show your slides to the world, with an animated slide included.

Concept Of Ontology In The Semantic Web How Does It Add Meaning To Data On The Web Inspiration PDF
This slide represents how the semantic web adds meaning to information on the web so that it can only provide accurate results to user queries. The techniques include vocabularies, ontologies, RDF prototype, web ontology language, etc. Crafting an eye catching presentation has never been more straightforward. Let your presentation shine with this tasteful yet straightforward Concept Of Ontology In The Semantic Web How Does It Add Meaning To Data On The Web Inspiration PDF template. It offers a minimalistic and classy look that is great for making a statement. The colors have been employed intelligently to add a bit of playfulness while still remaining professional. Construct the ideal Concept Of Ontology In The Semantic Web How Does It Add Meaning To Data On The Web Inspiration PDF that effortlessly grabs the attention of your audience Begin now and be certain to wow your customers.
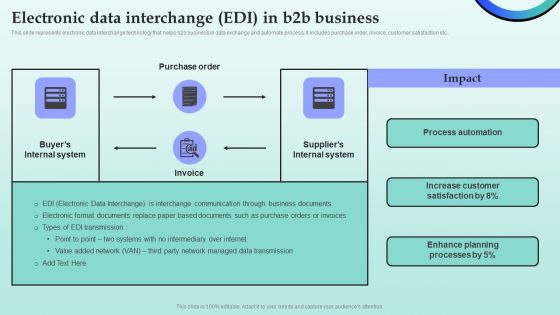
Strategies For Successful Customer Base Development In B2b M Commerce Electronic Data Interchange EDI In B2b Business Ideas PDF
This slide represents electronic data interchange technology that helps b2b business in data exchange and automate process. It includes purchase order, invoice, customer satisfaction etc.. Slidegeeks is here to make your presentations a breeze with Strategies For Successful Customer Base Development In B2b M Commerce Electronic Data Interchange EDI In B2b Business Ideas PDF With our easy to use and customizable templates, you can focus on delivering your ideas rather than worrying about formatting. With a variety of designs to choose from, you are sure to find one that suits your needs. And with animations and unique photos, illustrations, and fonts, you can make your presentation pop. So whether you are giving a sales pitch or presenting to the board, make sure to check out Slidegeeks first.
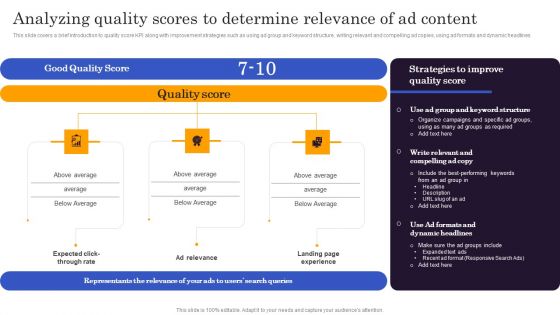
Marketers Guide To Data Analysis Optimization Analyzing Quality Scores To Determine Relevance Of Ad Content Diagrams PDF
This slide covers a brief introduction to quality score KPI along with improvement strategies such as using ad group and keyword structure, writing relevant and compelling ad copies, using ad formats and dynamic headlines. If you are looking for a format to display your unique thoughts, then the professionally designed Marketers Guide To Data Analysis Optimization Analyzing Quality Scores To Determine Relevance Of Ad Content Diagrams PDF is the one for you. You can use it as a Google Slides template or a PowerPoint template. Incorporate impressive visuals, symbols, images, and other charts. Modify or reorganize the text boxes as you desire. Experiment with shade schemes and font pairings. Alter, share or cooperate with other people on your work. Download Marketers Guide To Data Analysis Optimization Analyzing Quality Scores To Determine Relevance Of Ad Content Diagrams PDF and find out how to give a successful presentation. Present a perfect display to your team and make your presentation unforgettable.
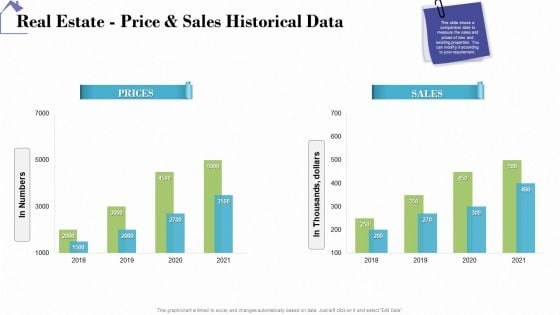
Industry Analysis Of Real Estate And Construction Sector Real Estate Price And Sales Historical Data Diagrams PDF
Deliver and pitch your topic in the best possible manner with this industry analysis of real estate and construction sector real estate price and sales historical data diagrams pdf. Use them to share invaluable insights on prices, sales and impress your audience. This template can be altered and modified as per your expectations. So, grab it now.
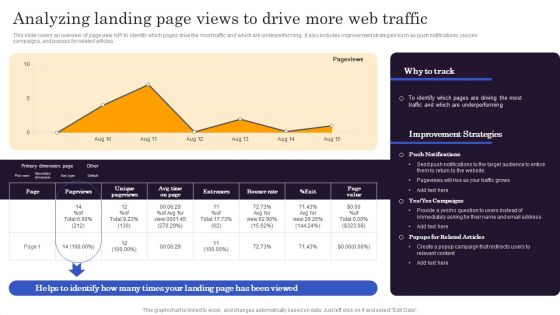
Marketers Guide To Data Analysis Optimization Analyzing Landing Page Views To Drive More Web Traffic Rules PDF
This slide covers an overview of page view KPI to identify which pages drive the most traffic and which are underperforming. It also includes improvement strategies such as push notifications, yes yes campaigns, and popups for related articles. Do you have an important presentation coming up Are you looking for something that will make your presentation stand out from the rest Look no further than Marketers Guide To Data Analysis Optimization Analyzing Landing Page Views To Drive More Web Traffic Rules PDF. With our professional designs, you can trust that your presentation will pop and make delivering it a smooth process. And with Slidegeeks, you can trust that your presentation will be unique and memorable. So why wait Grab Marketers Guide To Data Analysis Optimization Analyzing Landing Page Views To Drive More Web Traffic Rules PDF today and make your presentation stand out from the rest.


 Continue with Email

 Home
Home


