Data Dashboard
Measuring Product Performance Using Client Health Score Icon Graphics PDF
Persuade your audience using this Measuring Product Performance Using Client Health Score Icon Graphics PDF. This PPT design covers four stages, thus making it a great tool to use. It also caters to a variety of topics including Measuring Product Performance, Using Client Health, Score Icon. Download this PPT design now to present a convincing pitch that not only emphasizes the topic but also showcases your presentation skills.
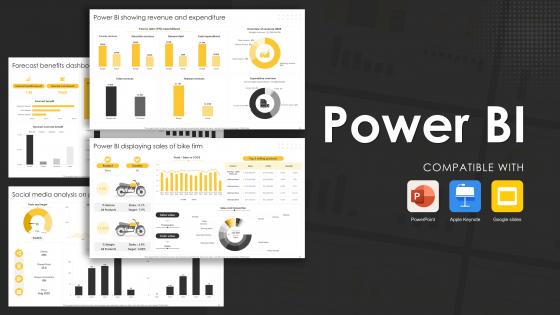
Power BI Powerpoint PPT Template Bundles
This Power BI Powerpoint PPT Template Bundles is a primer on how to capitalize on business opportunities through planning, innovation, and market intelligence. The content-ready format of the complete deck will make your job as a decision-maker a lot easier. Use this ready-made PowerPoint Template to help you outline an extensive and legible plan to capture markets and grow your company on the right path, at an exponential pace. What is even more amazing is that this presentation is completely editable and 100 percent customizable. This Data Visualization,Project Report,Business Intelligence,Data Model,Technology Project-slide complete deck helps you impress a roomful of people with your expertise in business and even presentation. Craft such a professional and appealing presentation for that amazing recall value. Download now. Our Power BI PowerPoint PPT Template Bundles are carefully crafted to provide a visually appealing and professional backdrop for any subject. These templates allow you to convey data insights and statistics with clarity and impact, making you appear professional and confident.
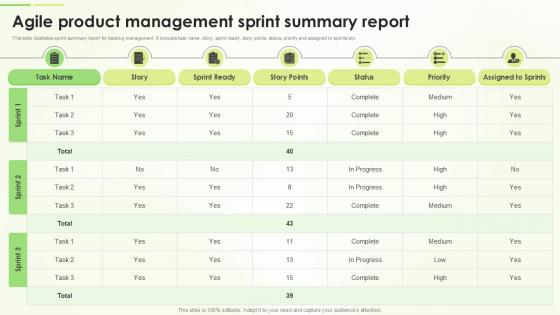
Agile Product Management Sprint Summary Report
Slidegeeks is one of the best resources for PowerPoint templates. You can download easily and regulate Agile Product Management Sprint Summary Report for your personal presentations from our wonderful collection. A few clicks is all it takes to discover and get the most relevant and appropriate templates. Use our Templates to add a unique zing and appeal to your presentation and meetings. All the slides are easy to edit and you can use them even for advertisement purposes. Use our professionally crafted templated on Sprint Summary Report designed for effective backlog management covering key elements including task names, user stories, sprint readiness, story points, current status, priority levels, and sprint assignments, etc. providing overview of priorities and progress.
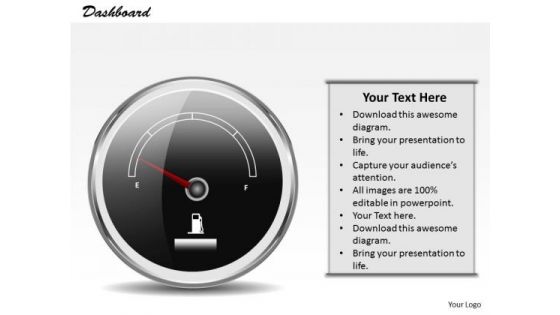
Sales Diagram Dashbaord Design To Communicate Effectively Marketing Diagram
Get Out Of The Dock With Our Sales Diagram Dashboard Design To Communicate Effectively Marketing Diagram Powerpoint Templates. Your Mind Will Be Set Free.
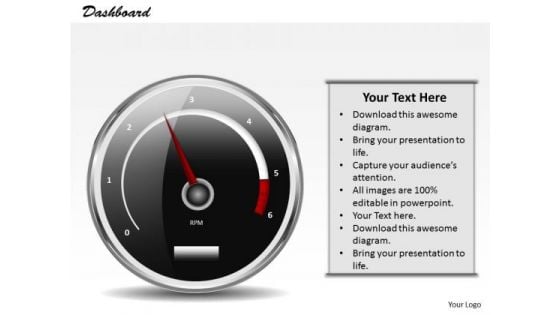
Strategy Diagram Dashbaord Design To Communicate Effectively Strategic Management
Document Your Views On Our Strategy Diagram Dashboard Design To Communicate Effectively Strategic Management Powerpoint Templates. They Will Create A Strong Impression.
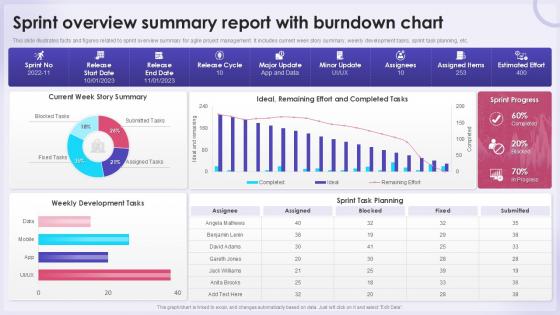
Sprint Overview Summary Report With Burndown Chart
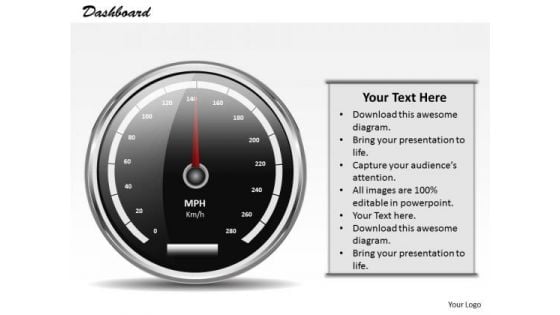
Business Diagram Dashbaord Design To Communicate Effectively Marketing Diagram
Analyze Ailments On Our Business Diagram Dashboard Design To Communicate Effectively Marketing Diagram Powerpoint Templates. Bring Out The Thinking Doctor In You. Dock Your Thoughts With Our Business Diagram Dashboard Design To Communicate Effectively Marketing Diagram Powerpoint Templates. They Will Launch Them Into Orbit.
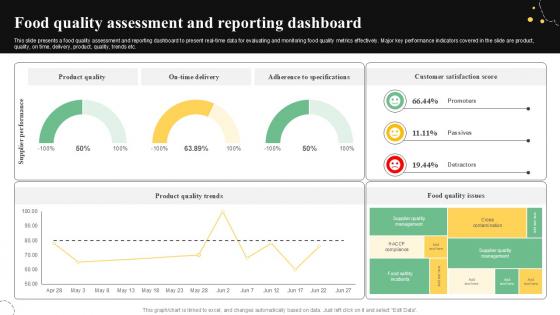
Food Quality Assessment And Reporting Quality Control Guide For Food PPT Sample
This slide presents a food quality assessment and reporting dashboard to present real-time data for evaluating and monitoring food quality metrics effectively. Major key performance indicators covered in the slide are product, quality, on time, delivery, product, quality, trends etc. Crafting an eye-catching presentation has never been more straightforward. Let your presentation shine with this tasteful yet straightforward Food Quality Assessment And Reporting Quality Control Guide For Food PPT Sample template. It offers a minimalistic and classy look that is great for making a statement. The colors have been employed intelligently to add a bit of playfulness while still remaining professional. Construct the ideal Food Quality Assessment And Reporting Quality Control Guide For Food PPT Sample that effortlessly grabs the attention of your audience Begin now and be certain to wow your customers This slide presents a food quality assessment and reporting dashboard to present real-time data for evaluating and monitoring food quality metrics effectively. Major key performance indicators covered in the slide are product, quality, on time, delivery, product, quality, trends etc.
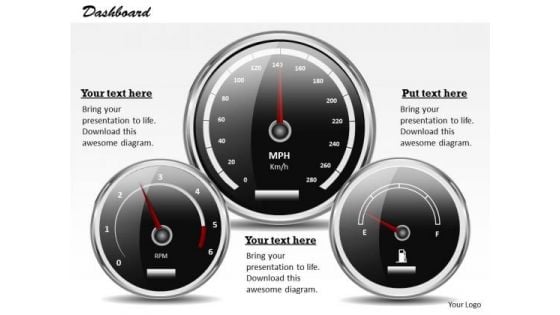
Strategic Management Dashbaord Design To Communicate Effectively Strategy Diagram
Get Out Of The Dock With Our Strategic Management Dashbaord Design To Communicate Effectively Powerpoint Templates. Your Mind Will Be Set Free.
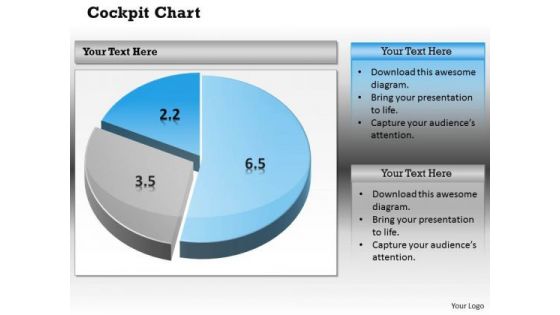
Business Cycle Diagram Pie Chart Dashborad Design Marketing Diagram
Document Your Views On Our Business Cycle Diagram Pie Chart Dashborad Design Marketing Diagram Powerpoint Templates. They Will Create A Strong Impression.
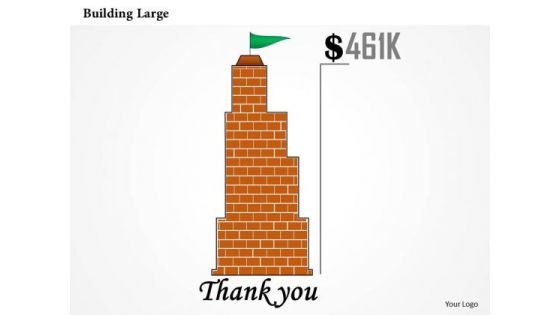
Strategy Diagram Design Of Red Large Building Business Diagram
Open Up Doors That Lead To Success. Our Strategy Diagram Design Of Red Large Building Business Diagram Powerpoint Templates Provide The Handles.
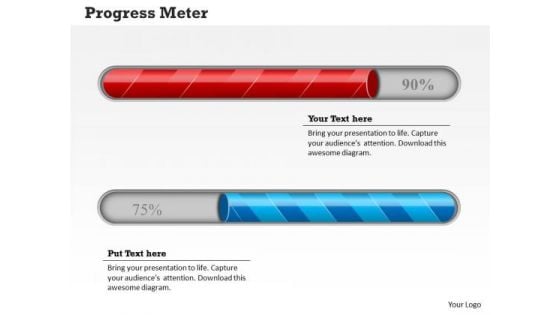
Strategy Diagram Meter Design For Business Progress Sales Diagram
Our Strategy Diagram Meter Design For Business Progress Sales Diagram Powerpoint Templates Abhor Doodling. They Never Let The Interest Flag.
Business Research And Analytics Vector Icon Ppt PowerPoint Presentation Professional Show
Presenting this set of slides with name business research and analytics vector icon ppt powerpoint presentation professional show. This is a three stage process. The stages in this process are data visualization icon, research analysis, business focus. This is a completely editable PowerPoint presentation and is available for immediate download. Download now and impress your audience.
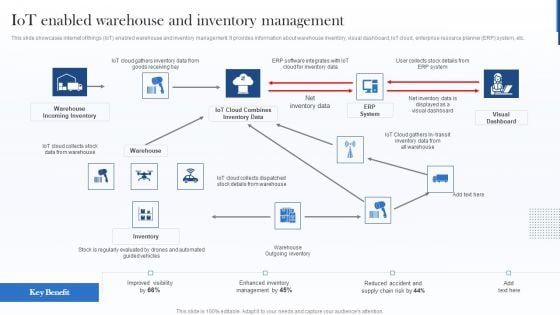
Iot Enabled Warehouse And Inventory Management Demonstration PDF
This slide showcases internet of things IoT enabled warehouse and inventory management. It provides information about warehouse inventory, visual dashboard, IoT cloud, enterprise resource planner ERP system, etc. Deliver and pitch your topic in the best possible manner with this Iot Enabled Warehouse And Inventory Management Demonstration PDF. Use them to share invaluable insights on Warehouse, Inventory Data, Dashboard and impress your audience. This template can be altered and modified as per your expectations. So, grab it now.
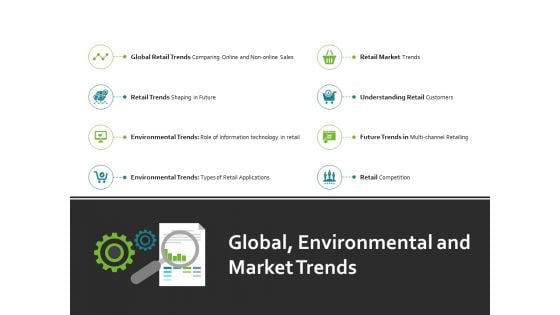
Global Environmental And Market Trends Ppt PowerPoint Presentation File Outline
This is a global environmental and market trends ppt powerpoint presentation file outline. This is a eight stage process. The stages in this process are retail competition, retail market, environmental trends, marketing, planning.
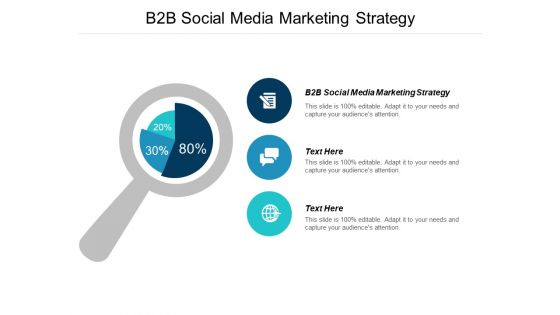
B2B Social Media Marketing Strategy Ppt PowerPoint Presentation Outline Influencers
This is a b2b social media marketing strategy ppt powerpoint presentation outline influencers. This is a three stage process. The stages in this process are b2b social media marketing strategy.
Magnify Glass Research Ppt PowerPoint Presentation Styles Gallery
This is a magnify glass research ppt powerpoint presentation styles gallery. This is a three stage process. The stages in this process are magnifying glass, research, marketing, strategy, business.
Magnifying Glass Research Ppt PowerPoint Presentation Gallery Clipart Images
This is a magnifying glass research ppt powerpoint presentation gallery clipart images. This is a five stage process. The stages in this process are magnifying glass, research, marketing, strategy, business.
Magnifying Glass Research Ppt PowerPoint Presentation Infographics Example Introduction
This is a magnifying glass research ppt powerpoint presentation infographics example introduction. This is a four stage process. The stages in this process are magnifying glass, research, marketing, strategy, business.
Magnifying Glass Research Ppt PowerPoint Presentation Infographics Good
This is a magnifying glass research ppt powerpoint presentation infographics good. This is a four stage process. The stages in this process are magnifying glass, research, marketing, strategy, business.

B2B Sales Analysis Ppt PowerPoint Presentation Infographic Template Show Cpb
This is a b2b sales analysis ppt powerpoint presentation infographic template show cpb. This is a five stage process. The stages in this process are b2b sales analysis.
Compensation Structure Ppt PowerPoint Presentation Styles Graphics Example Cpb
This is a compensation structure ppt powerpoint presentation styles graphics example cpb. This is a three stage process. The stages in this process are compensation structure.
Online Research Tools Ppt PowerPoint Presentation Example 2015 Cpb
This is a online research tools ppt powerpoint presentation example 2015 cpb. This is a four stage process. The stages in this process are online research tools.
Iteration Planning Agile Ppt PowerPoint Presentation Slides Microsoft Cpb
This is a iteration planning agile ppt powerpoint presentation slides microsoft cpb. This is a five stage process. The stages in this process are iteration planning agile.
Email Management Ppt PowerPoint Presentation Pictures Elements Cpb
This is a email management ppt powerpoint presentation pictures elements cpb. This is a three stage process. The stages in this process are email management.
Business Action Plans Ppt PowerPoint Presentation Portfolio Layouts Cpb
This is a business action plans ppt powerpoint presentation portfolio layouts cpb. This is a three stage process. The stages in this process are business action plans.
Consumer Risk Management Ppt PowerPoint Presentation File Graphic Tips Cpb
This is a consumer risk management ppt powerpoint presentation file graphic tips cpb. This is a three stage process. The stages in this process are consumer risk management.
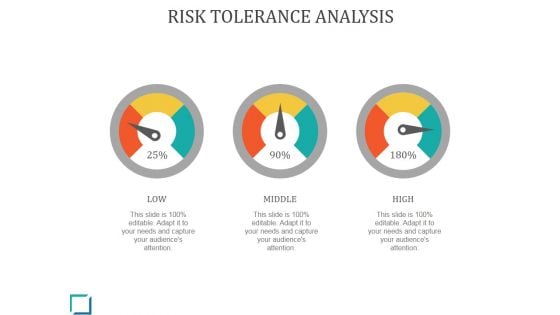
Risk Tolerance Analysis Ppt PowerPoint Presentation Background Image
This is a risk tolerance analysis ppt powerpoint presentation background image. This is a three stage process. The stages in this process are high, low, middle, dashboard, measurement.
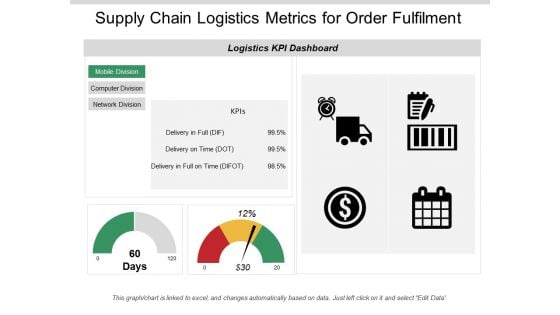
Supply Chain Logistics Metrics For Order Fulfilment Ppt PowerPoint Presentation Infographic Template Information
This is a supply chain logistics metrics for order fulfilment ppt powerpoint presentation infographic template information. This is a two stage process. The stages in this process are logistics performance, logistics dashboard, logistics kpis.
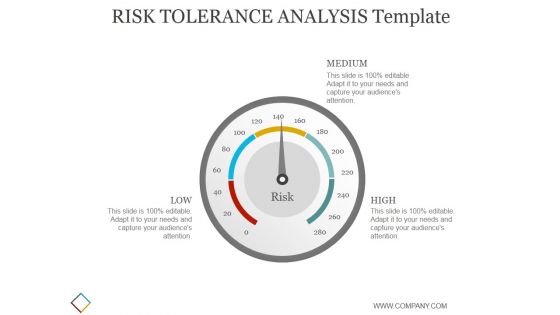
Risk Tolerance Analysis Template Ppt PowerPoint Presentation Background Designs
This is a risk tolerance analysis template ppt powerpoint presentation background designs. This is a one stage process. The stages in this process are business, strategy, marketing, analysis, dashboard.
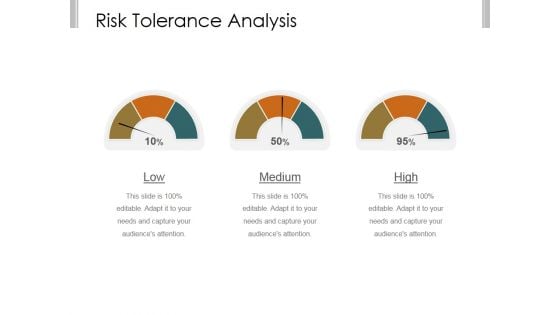
Risk Tolerance Analysis Template 1 Ppt PowerPoint Presentation Infographic Template
This is a risk tolerance analysis template 1 ppt powerpoint presentation infographic template. This is a three stage process. The stages in this process are business, strategy, marketing, analysis, dashboard, measuring.
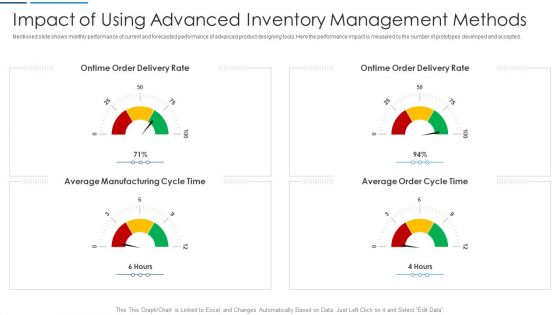
Information Technology Transformation Impact Of Using Advanced Inventory Management Methods Time Guidelines PDF
Mentioned slide shows monthly performance of current and forecasted performance of advanced product designing tools. Here the performance impact is measured by the number of prototypes developed and accepted. This is a information technology transformation impact of using advanced inventory management methods time guidelines pdf template with various stages. Focus and dispense information on four stages using this creative set, that comes with editable features. It contains large content boxes to add your information on topics like average manufacturing cycle, average order cycle time, inventory management. You can also showcase facts, figures, and other relevant content using this PPT layout. Grab it now.
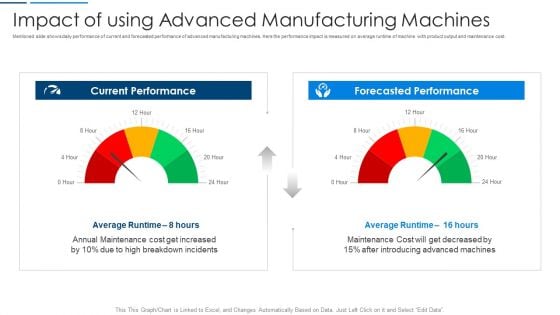
Information Technology Transformation Impact Of Using Advanced Manufacturing Machines Diagrams PDF
Mentioned slide shows daily performance of current and forecasted performance of advanced manufacturing machines. Here the performance impact is measured on average runtime of machine with product output and maintenance cost. This is a information technology transformation impact of using advanced manufacturing machines diagrams pdf template with various stages. Focus and dispense information on two stages using this creative set, that comes with editable features. It contains large content boxes to add your information on topics like forecasted performance, current performance, maintenance cost. You can also showcase facts, figures, and other relevant content using this PPT layout. Grab it now.

Customer Service Benchmarking Ppt PowerPoint Presentation Inspiration
This is a customer service benchmarking ppt powerpoint presentation inspiration. This is a three stage process. The stages in this process are business, marketing, success, dashboard, technology.
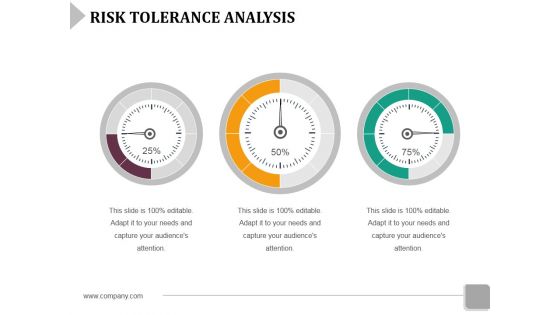
Risk Tolerance Analysis Template 1 Ppt Powerpoint Presentation File Infographic Template
This is a risk tolerance analysis template 1 ppt powerpoint presentation file infographic template. This is a three stage process. The stages in this process are dashboard, marketing, measure, business.
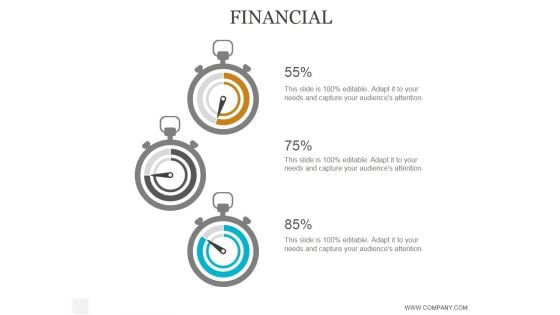
Financial Ppt PowerPoint Presentation Background Designs
This is a financial ppt powerpoint presentation background designs. This is a five stage process. The stages in this process are business, strategy, marketing, analysis, success, finance, dashboard.
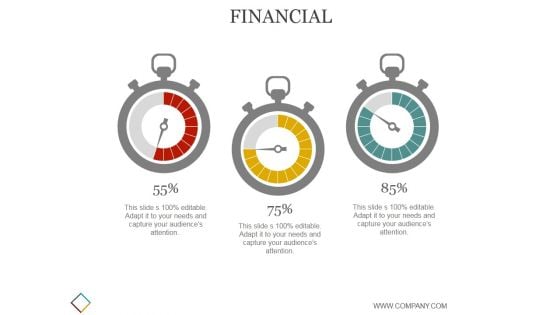
Financial Ppt PowerPoint Presentation Guide
This is a financial ppt powerpoint presentation guide. This is a three stage process. The stages in this process are business, strategy, marketing, analysis, dashboard, measuring.
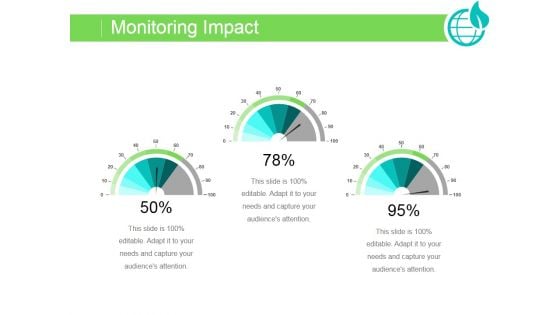
Monitoring Impact Ppt PowerPoint Presentation Example
This is a monitoring impact ppt powerpoint presentation example. This is a three stage process. The stages in this process are business, strategy, marketing, analysis, dashboard.
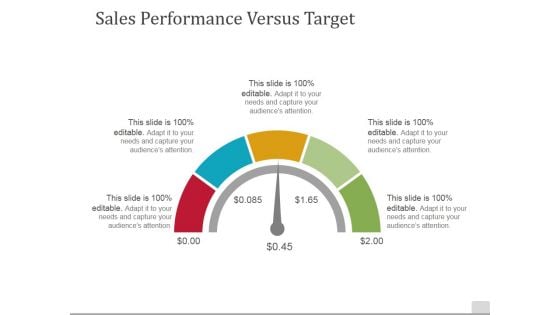
Sales Performance Versus Target Ppt PowerPoint Presentation Pictures Structure
This is a sales performance versus target ppt powerpoint presentation pictures structure. This is a five stage process. The stages in this process are business, dashboard, technology, process, marketing.
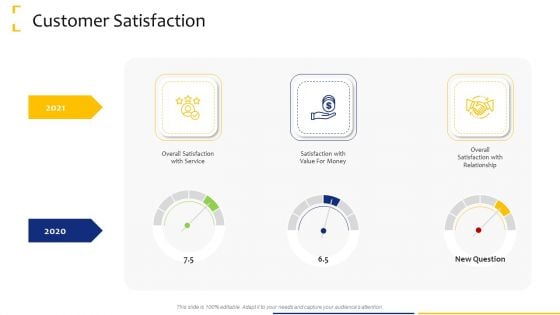
Tactical Analysis Customer Satisfaction Ppt Gallery Graphics Template PDF
This is a tactical analysis customer satisfaction ppt gallery graphics template pdf template with various stages. Focus and dispense information on three stages using this creative set, that comes with editable features. It contains large content boxes to add your information on topics like customer satisfaction. You can also showcase facts, figures, and other relevant content using this PPT layout. Grab it now.
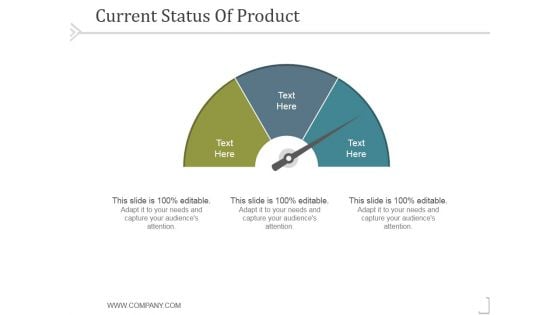
Current Status Of Product Ppt PowerPoint Presentation Visuals
This is a current status of product ppt powerpoint presentation visuals. This is a three stage process. The stages in this process are business, strategy, marketing, success, analysis, dashboard.
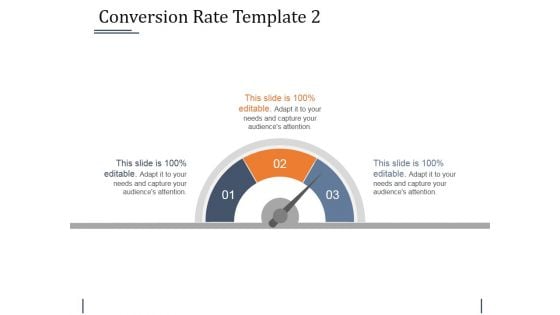
Conversion Rate Template 2 Ppt PowerPoint Presentation Ideas Design Inspiration
This is a conversion rate template 2 ppt powerpoint presentation ideas design inspiration. This is a three stage process. The stages in this process are dashboard, marketing, strategy, analysis, business.
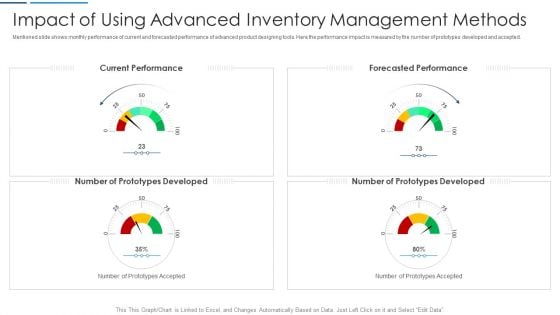
Information Technology Transformation Impact Of Using Advanced Inventory Management Methods Background PDF
Mentioned slide shows monthly performance of current and forecasted performance of advanced product designing tools. Here the performance impact is measured by the number of prototypes developed and accepted. Presenting information technology transformation impact of using advanced inventory management methods background pdf to provide visual cues and insights. Share and navigate important information on four stages that need your due attention. This template can be used to pitch topics like current performance, forecasted performance, developed. In addtion, this PPT design contains high resolution images, graphics, etc, that are easily editable and available for immediate download.
Enterprise Analysis Customer Satisfaction Ppt Icon Backgrounds PDF
This is a enterprise analysis customer satisfaction ppt icon backgrounds pdf template with various stages. Focus and dispense information on three stages using this creative set, that comes with editable features. It contains large content boxes to add your information on topics like overall satisfaction with service, satisfaction with value for money, overall satisfaction with relationship. You can also showcase facts, figures, and other relevant content using this PPT layout. Grab it now.
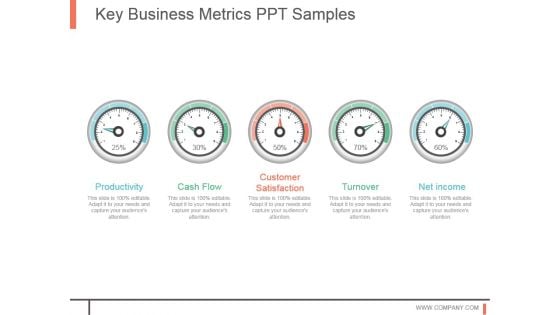
Key Business Metrics Ppt Samples
This is a key business metrics ppt samples. This is a five stage process. The stages in this process are productivity, cash flow, customer satisfaction, turnover, net income.
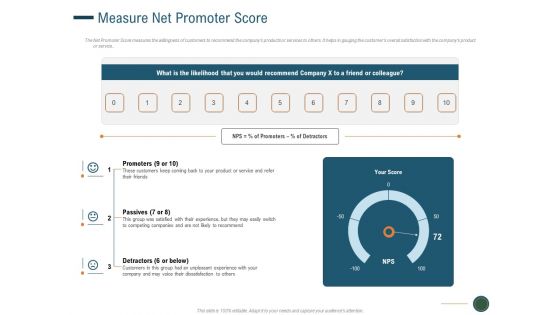
Enhance Profit Client Journey Analysis Measure Net Promoter Score Clipart PDF
The Net Promoter Score measures the willingness of customers to recommend the companys products or services to others. It helps in gauging the customers overall satisfaction with the companys product or service. This is a enhance profit client journey analysis measure net promoter score clipart pdf template with various stages. Focus and dispense information on three stages using this creative set, that comes with editable features. It contains large content boxes to add your information on topics like promoters, passives, detractors. You can also showcase facts, figures, and other relevant content using this PPT layout. Grab it now.
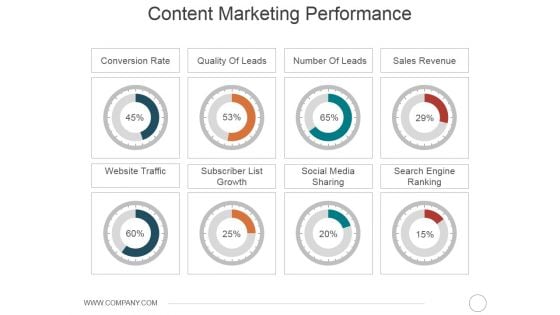
Content Marketing Performance Template 1 Ppt PowerPoint Presentation Styles Infographics
This is a content marketing performance template 1 ppt powerpoint presentation styles infographics. This is a eight stage process. The stages in this process are conversion rate, quality of leads, number of leads, sales revenue, website traffic, subscriber list growth, social media sharing, search engine ranking.

Our Performance Indicators Powerpoint Themes
This is a our performance indicators powerpoint themes. This is a five stage process. The stages in this process are cash flow, turnover, productivity, customer satisfaction, net income.
Organizational Network Staff Learning Security Awareness Tracking Kpis Demonstration PDF
This slide covers the key performance for security awareness training including compliance, security culture and incident reduction. This is a organizational network staff learning security awareness tracking kpis demonstration pdf template with various stages. Focus and dispense information on three stages using this creative set, that comes with editable features. It contains large content boxes to add your information on topics like compliance, security culture, incident reduction. You can also showcase facts, figures, and other relevant content using this PPT layout. Grab it now.
Workforce Security Realization Coaching Plan Security Awareness Tracking Kpis Inspiration PDF
This slide covers the key performance for security awareness training including compliance, security culture and incident reduction. This is a workforce security realization coaching plan security awareness tracking kpis inspiration pdf template with various stages. Focus and dispense information on three stages using this creative set, that comes with editable features. It contains large content boxes to add your information on topics like compliance, security culture, incident reduction. You can also showcase facts, figures, and other relevant content using this PPT layout. Grab it now.
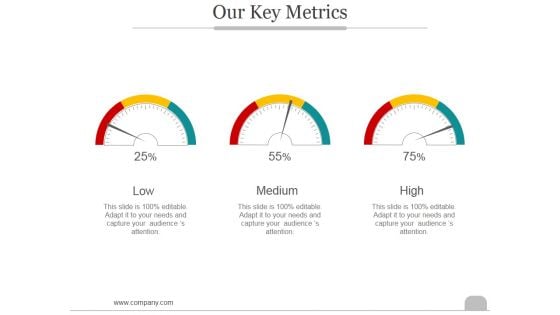
Our Key Metrics Ppt PowerPoint Presentation Gallery
This is a our key metrics ppt powerpoint presentation gallery. This is a three stage process. The stages in this process are low, medium, high.
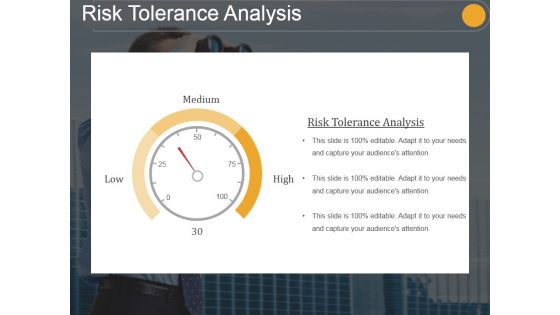
Risk Tolerance Analysis Template 1 Ppt PowerPoint Presentation Design Ideas
This is a risk tolerance analysis template 1 ppt powerpoint presentation design ideas. This is a one stage process. The stages in this process are risk tolerance analysis, low, medium, high.
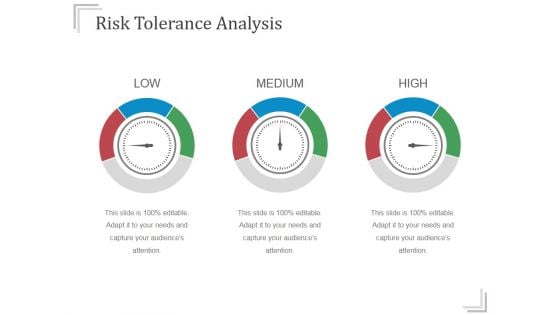
Risk Tolerance Analysis Templates 1 Ppt PowerPoint Presentation Designs
This is a risk tolerance analysis templates 1 ppt powerpoint presentation designs. This is a three stage process. The stages in this process are low, medium, high.

Risk Tolerance Analysis Template 2 Ppt PowerPoint Presentation Slides Diagrams
This is a risk tolerance analysis template 2 ppt powerpoint presentation slides diagrams. This is a three stage process. The stages in this process are low, medium, high.
Project Profit Analysis Vector Icon Ppt PowerPoint Presentation Outline Graphics Template PDF
Presenting this set of slides with name project profit analysis vector icon ppt powerpoint presentation outline graphics template pdf. This is a three stage process. The stages in this process are project profit analysis vector icon. This is a completely editable PowerPoint presentation and is available for immediate download. Download now and impress your audience.
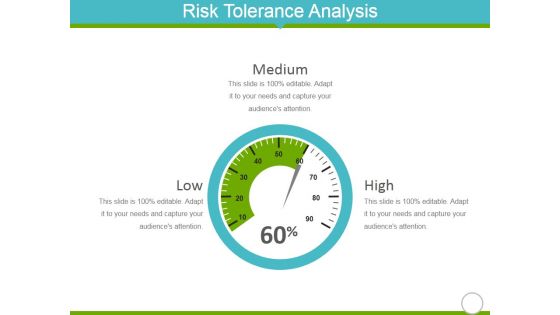
Risk Tolerance Analysis Template 1 Ppt PowerPoint Presentation Gallery Design Templates
This is a risk tolerance analysis template 1 ppt powerpoint presentation gallery design templates. This is a three stage process. The stages in this process are medium, low, high.
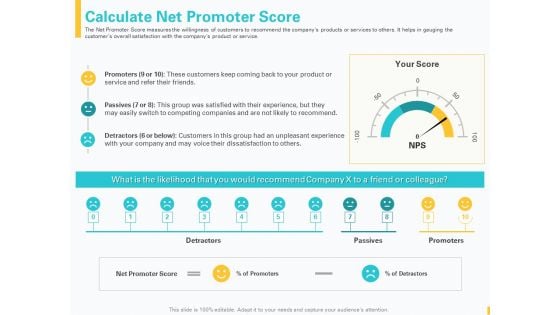
Designing Great Client Experience Action Plan Calculate Net Promoter Score Ppt Gallery Ideas PDF
The Net Promoter Score measures the willingness of customers to recommend the companys products or services to others. It helps in gauging the customers overall satisfaction with the companys product or service. This is a designing great client experience action plan calculate net promoter score ppt gallery ideas pdf template with various stages. Focus and dispense information on one stages using this creative set, that comes with editable features. It contains large content boxes to add your information on topics like promoters, passives, detractors, customers, net promoter score. You can also showcase facts, figures, and other relevant content using this PPT layout. Grab it now.
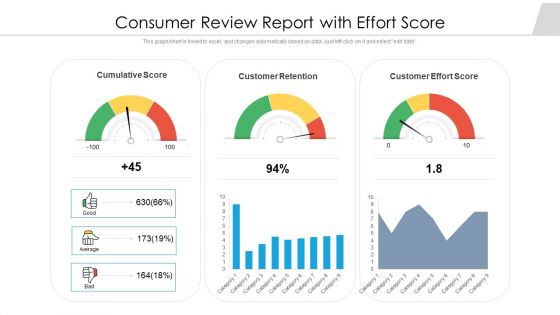
Consumer Review Report With Effort Score Ppt Layouts Graphics Tutorials PDF
Presenting consumer review report with effort score ppt layouts graphics tutorials pdf to dispense important information. This template comprises three stages. It also presents valuable insights into the topics including customer effort score, customer retention, cumulative score. This is a completely customizable PowerPoint theme that can be put to use immediately. So, download it and address the topic impactfully.
Organizational Network Staff Learning Security Awareness Tracking Kpis Event Ppt Slides Clipart Images PDF
Presenting organizational network staff learning security awareness tracking kpis event ppt slides clipart images pdf to provide visual cues and insights. Share and navigate important information on three stages that need your due attention. This template can be used to pitch topics like compliance, security culture, incident reduction. In addition, this PPT design contains high-resolution images, graphics, etc, that are easily editable and available for immediate download.
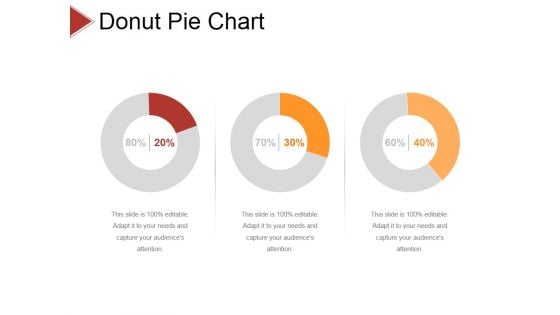
Donut Pie Chart Ppt PowerPoint Presentation Infographic Template Diagrams
This is a donut pie chart ppt powerpoint presentation infographic template diagrams. This is a three stage process. The stages in this process are business, strategy, analysis, pretention, comparison.


 Continue with Email

 Home
Home


