Data Dashboard
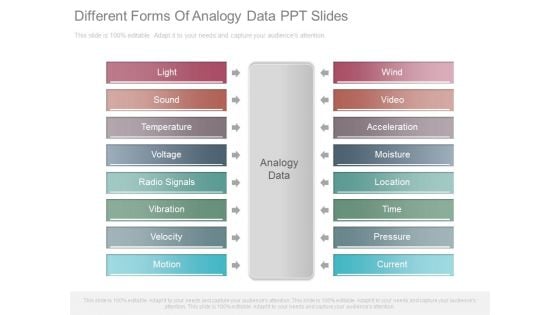
Different Forms Of Analogy Data Ppt Slides
This is a different forms of analogy data ppt slides. This is a eight stage process. The stages in this process are analogy data, light, sound, temperature, voltage, radio signals, vibration, velocity, motion, wind, video, acceleration, moisture, location, time, pressure, current.
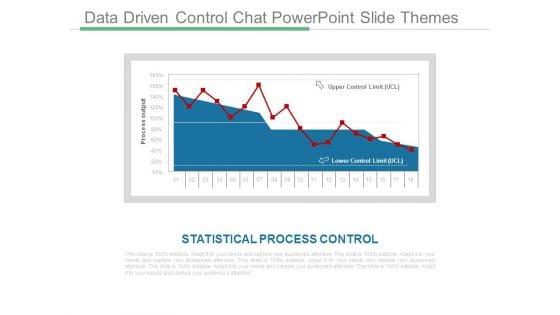
Data Driven Control Chat Powerpoint Slide Themes
This is a data driven control chat powerpoint slide themes. This is a one stage process. The stages in this process are process output, upper control limit, statistical process control, lower control limit.
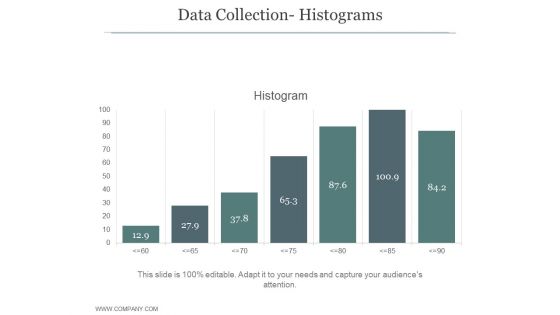
Data Collection Histograms Ppt PowerPoint Presentation Diagrams
This is a data collection histograms ppt powerpoint presentation diagrams. This is a seven stage process. The stages in this process are business, strategy, growth strategy, marketing, histogram, finance.

Market Research Data Collection Chart Presentation
This is a market research data collection chart presentation. This is a five stage process. The stages in this process are concept testing, customer satisfaction, pricing research, market segmentation, awareness usage.
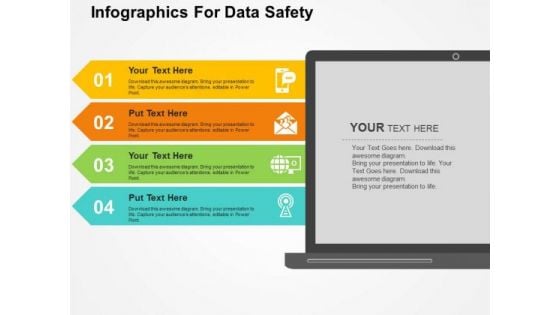
Infographics For Data Safety PowerPoint Templates
Add charm to your presentations with this professional slide of Infographics. Icons displayed in this diagram may be used to depict data safety concept. Illustrate your plans to your listeners with using this slide.
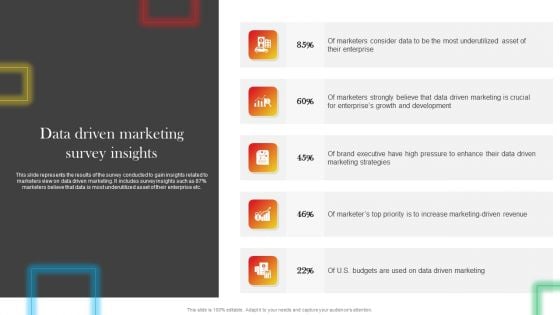
Data Driven Marketing Survey Insights Download PDF
This slide represents the results of the survey conducted to gain insights related to marketers view on data driven marketing. It includes survey insights such as 87 percent marketers believe that data is most underutilized asset of their enterprise etc. Make sure to capture your audiences attention in your business displays with our gratis customizable Data Driven Marketing Survey Insights Download PDF. These are great for business strategies, office conferences, capital raising or task suggestions. If you desire to acquire more customers for your tech business and ensure they stay satisfied, create your own sales presentation with these plain slides.
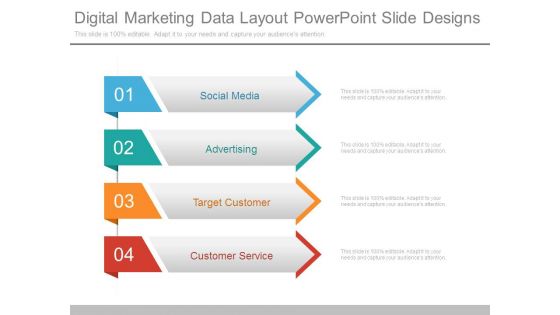
Digital Marketing Data Layout Powerpoint Slide Designs
This is a digital marketing data layout powerpoint slide designs. This is a four stage process. The stages in this process are social media, advertising, target customer, customer service.
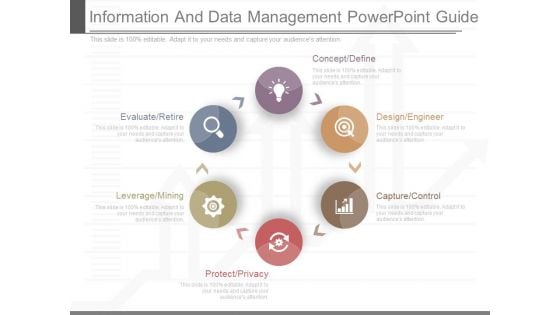
Information And Data Management Powerpoint Guide
This is a information and data management powerpoint guide. This is a six stage process. The stages in this process are concept define, design engineer, capture control, evaluate retire, leverage mining, protect privacy.

Accessing The Data Security PowerPoint Template 1010
3d illustration of a large brass key and lock protruding from a simple pie chart Help develop a solution with our Accessing The Data Security PowerPoint Template 1010. Just download, type and present.
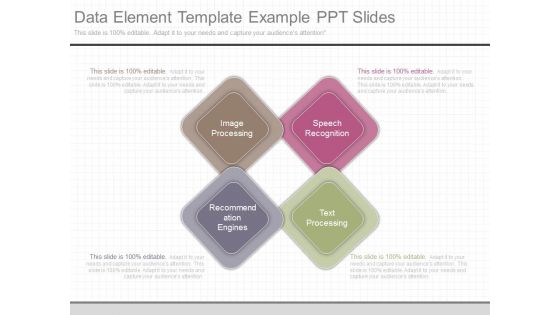
Data Element Template Example Ppt Slides
This is a data element template example ppt slides. This is a four stage process. The stages in this process are image processing, speech recognition, recommendation engines, text processing.
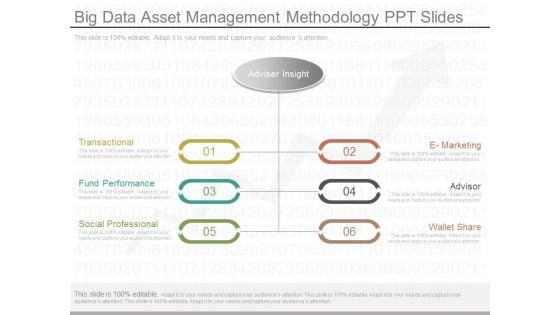
Big Data Asset Management Methodology Ppt Slides
This is a big data asset management methodology ppt slides. This is a six stage process. The stages in this process are transactional, fund performance, social professional, e marketing, advisor, wallet share, adviser insight.
Adjusting The Data PowerPoint Icon C
3d illustration of a simple wrench turning/adjusting the elements on a multi-colored bar chart Eliminate doubts with our Adjusting The Data PowerPoint Icon C. Download without worries with our money back guaranteee.
Adjusting The Data PowerPoint Icon Cc
3d illustration of a simple wrench turning/adjusting the elements on a multi-colored bar chart Change the world with our Adjusting The Data PowerPoint Icon Cc. You will come out on top.
Adjusting The Data PowerPoint Icon F
3d illustration of a simple wrench turning/adjusting the elements on a multi-colored bar chart Confident and committed define you well. Add to your dynamism with our Adjusting The Data PowerPoint Icon F.
Adjusting The Data PowerPoint Icon R
3d illustration of a simple wrench turning/adjusting the elements on a multi-colored bar chart Recapture your dream with our Adjusting The Data PowerPoint Icon R. Download without worries with our money back guaranteee.
Adjusting The Data PowerPoint Icon S
3d illustration of a simple wrench turning/adjusting the elements on a multi-colored bar chart Analyze growth with our Adjusting The Data PowerPoint Icon S. Download without worries with our money back guaranteee.
Analyzing The Data PowerPoint Icon C
3d illustration of a magnifying glass hovering over a three-dimensional multi-colored bar chart Our Analyzing The Data PowerPoint Icon C will get you all animated. You will become eager to assert your views.
Analyzing The Data PowerPoint Icon Cc
3d illustration of a magnifying glass hovering over a three-dimensional multi-colored bar chart Entertain dreams with our Analyzing The Data PowerPoint Icon Cc. Let your imagination run to places unknown.
Analyzing The Data PowerPoint Icon F
3d illustration of a magnifying glass hovering over a three-dimensional multi-colored bar chart Our Analyzing The Data PowerPoint Icon F are generous to an excess. They will give their all most willingly.
Analyzing The Data PowerPoint Icon R
3d illustration of a magnifying glass hovering over a three-dimensional multi-colored bar chart You are a renowned exponent of your trade. Ply your line with our Analyzing The Data PowerPoint Icon R.
Analyzing The Data PowerPoint Icon S
3d illustration of a magnifying glass hovering over a three-dimensional multi-colored bar chart Our Analyzing The Data PowerPoint Icon S are a great equaliser. They take everybody to the same level.

Three Tags For Data Comparison Powerpoint Slides
This PPT slide contains graphics of three tags. Download this PowerPoint template to depict data comparison in business presentations. Deliver amazing presentations to mesmerize your audience by using this PPT slide design.
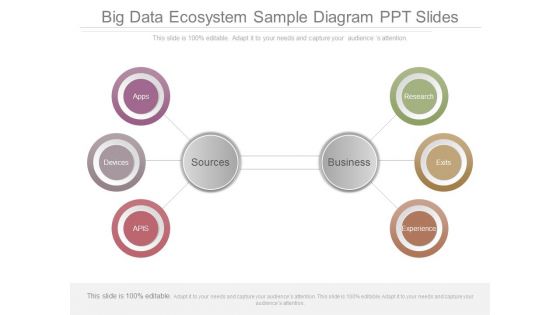
Big Data Ecosystem Sample Diagram Ppt Slides
This is a big data ecosystem sample diagram ppt slides. This is a two stage process. The stages in this process are apps, devices, apis, sources, business, experience, exits, research.
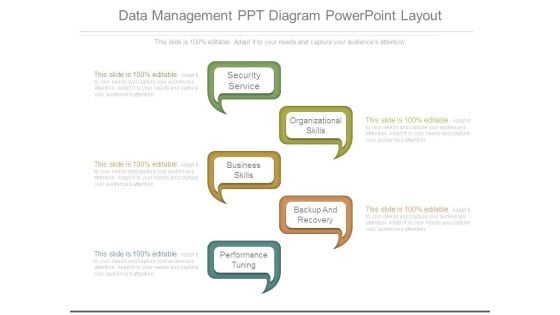
Data Management Ppt Diagram Powerpoint Layout
This is a data management ppt diagram powerpoint layout. This is a five stage process. The stages in this process are security service, organizational skills, business skills, backup and recovery, performance tuning.
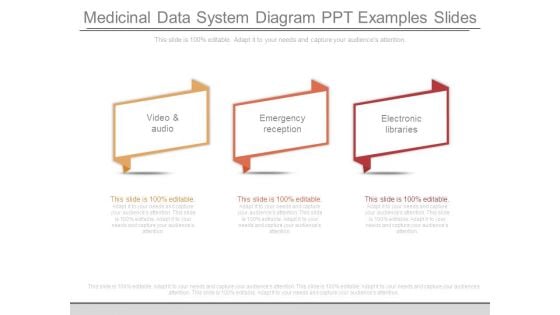
Medicinal Data System Diagram Ppt Examples Slides
This is a medicinal data system diagram ppt examples slides. This is a three stage process. The stages in this process are video and audio, emergency reception, electronic libraries.
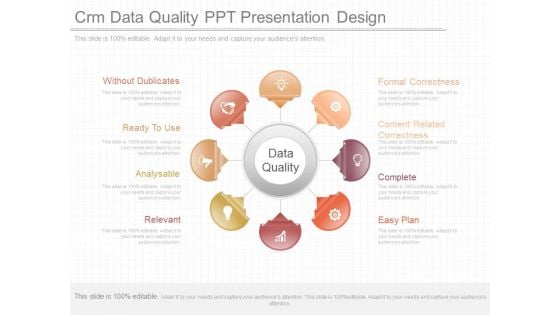
Crm Data Quality Ppt Presentation Design
This is a crm data quality ppt presentation design. This is a eight stage process. The stages in this process are without dublicates, ready to use, formal correctness, content related correctness, complete, easy plan, relevant, analysable.
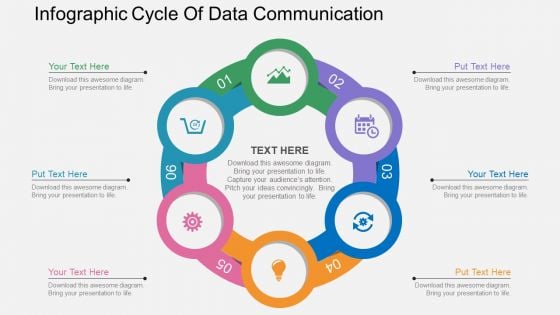
Infographic Cycle Of Data Communication Powerpoint Template
Our above PPT slide contains graphics of circular diagram. This business diagram helps to display outline of business plan. Use this template to impart more clarity to data and to create more sound impact on viewers.
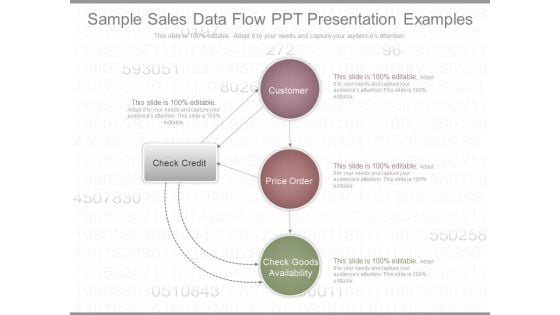
Sample Sales Data Flow Ppt Presentation Examples
This is a sample sales data flow ppt presentation examples. This is a four stage process. The stages in this process are check credit, customer, price order, check goods availability.
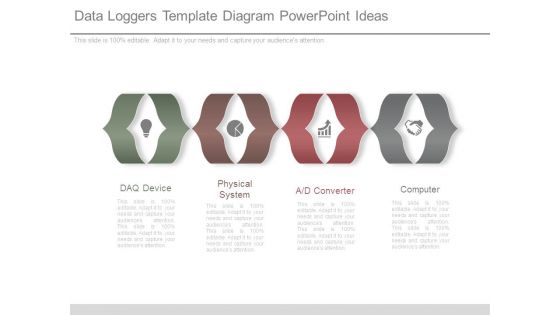
Data Loggers Template Diagram Powerpoint Ideas
This is a data loggers template diagram powerpoint ideas. This is a four stage process. The stages in this process are daq device, physical system, a d converter, computer.
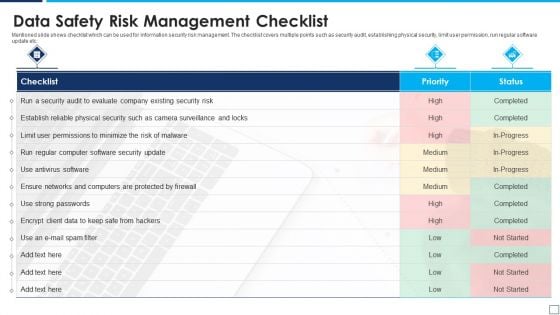
Data Safety Risk Management Checklist Information PDF
Mentioned slide shows checklist which can be used for information security risk management. The checklist covers multiple points such as security audit, establishing physical security, limit user permission, run regular software update etc. Presenting data safety risk management checklist information pdf to dispense important information. This template comprises one stage. It also presents valuable insights into the topics including data safety risk management checklist. This is a completely customizable PowerPoint theme that can be put to use immediately. So, download it and address the topic impactfully.
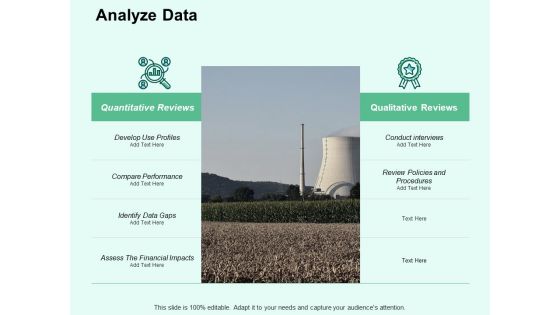
Analyze Data Ppt PowerPoint Presentation Summary Demonstration
Presenting this set of slides with name analyze data ppt powerpoint presentation summary demonstration. The topics discussed in these slides are develop, compare, performance, financial, impacts. This is a completely editable PowerPoint presentation and is available for immediate download. Download now and impress your audience
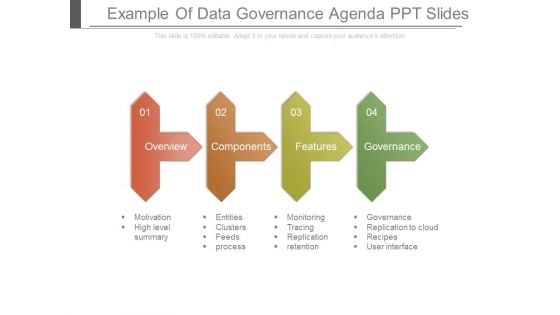
Example Of Data Governance Agenda Ppt Slides
This is a example of data governance agenda ppt slides. This is a four stage process. The stages in this process are overview, components, features, governance, motivation, high level summary, entities, clusters, feeds, process, monitoring, tracing, replication, retention, replication to cloud, recipes, user interface.
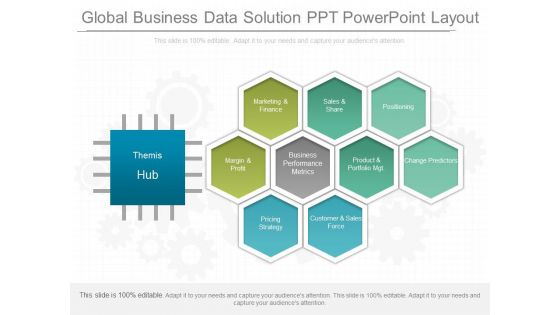
Global Business Data Solution Ppt Powerpoint Layout
This is a global business data solution ppt powerpoint layout. This is a ten stage process. The stages in this process are themis hub, marketing and finance, sales and share, positioning, margin and profit, business performance metrics, product and portfolio mgtchange predictors, pricing strategy, customer and sales force.\n\n\n\n\n\n\n\n\n\n\n\n\n\n\n\n\n\n\n\n
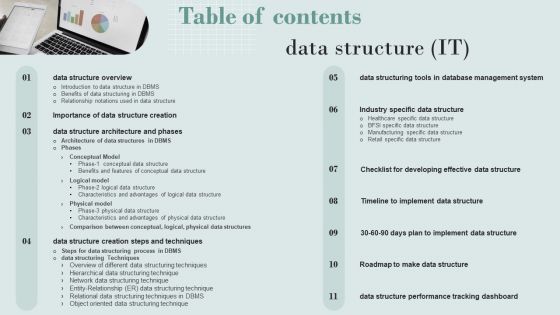
Table Of Contents Data Structure Portrait PDF
Take your projects to the next level with our ultimate collection of Table Of Contents Data Structure Portrait PDF. Slidegeeks has designed a range of layouts that are perfect for representing task or activity duration, keeping track of all your deadlines at a glance. Tailor these designs to your exact needs and give them a truly corporate look with your own brand colors they will make your projects stand out from the rest.
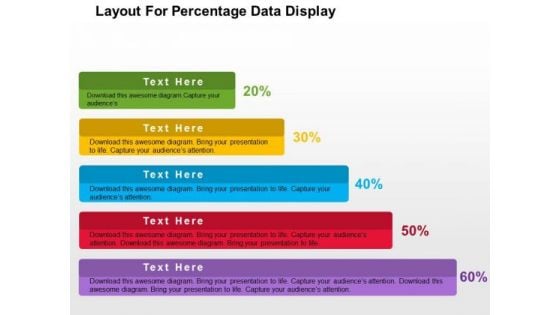
Layout For Precentage Data Display PowerPoint Template
Growth analysis for business can be defined with this business diagram. This slide depicts text boxes in increasing flow. Present your views using this innovative slide and be assured of leaving a lasting impression
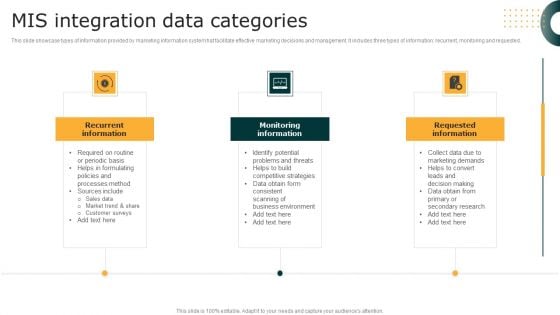
MIS Integration Data Categories Clipart PDF
This slide showcase types of information provided by marketing information system hat facilitate effective marketing decisions and management. It includes three types of information recurrent, monitoring and requested. Persuade your audience using this MIS Integration Data Categories Clipart PDF. This PPT design covers three stages, thus making it a great tool to use. It also caters to a variety of topics including Monitoring Information, Requested Information, Recurrent Information. Download this PPT design now to present a convincing pitch that not only emphasizes the topic but also showcases your presentation skills.
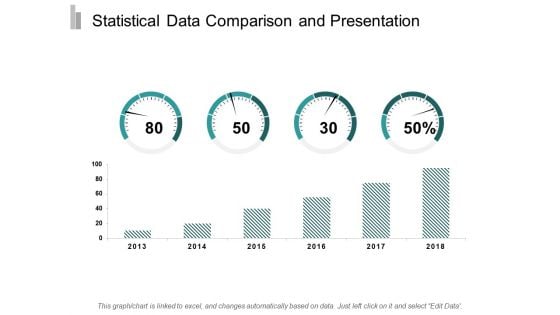
Statistical Data Comparison And Presentation Ppt Powerpoint Presentation Gallery Backgrounds
This is a statistical data comparison and presentation ppt powerpoint presentation gallery backgrounds. This is a two stage process. The stages in this process are data presentation, content presentation, information presentation.
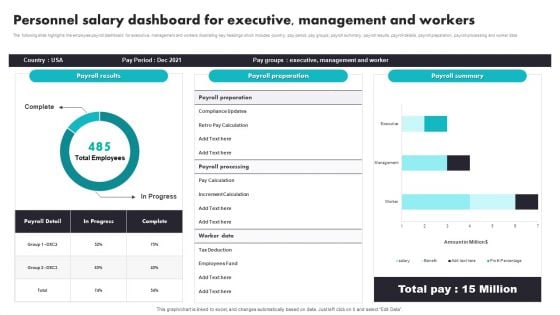
Personnel Salary Dashboard For Executive Management And Workers Rules PDF
The following slide highlights the employee payroll dashboard for executive, management and workers illustrating key headings which includes country, pay period, pay groups, payroll summary, payroll results, payroll details, payroll preparation, payroll processing and worker data. Showcasing this set of slides titled Personnel Salary Dashboard For Executive Management And Workers Rules PDF. The topics addressed in these templates are Management, Executive, Employees Fund. All the content presented in this PPT design is completely editable. Download it and make adjustments in color, background, font etc. as per your unique business setting.
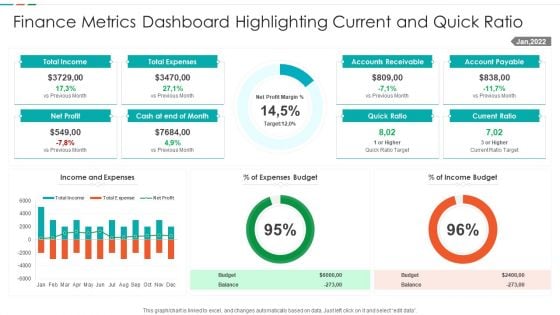
Finance Metrics Dashboard Highlighting Current And Quick Ratio Template PDF
This graph or chart is linked to excel, and changes automatically based on data. Just left click on it and select edit data. Showcasing this set of slides titled Finance Metrics Dashboard Highlighting Current And Quick Ratio Template PDF. The topics addressed in these templates are Total Income Budget, Total Expenses Balance, Net Profit Quick, Ratio Current Ratio. All the content presented in this PPT design is completely editable. Download it and make adjustments in color, background, font etc. as per your unique business setting.
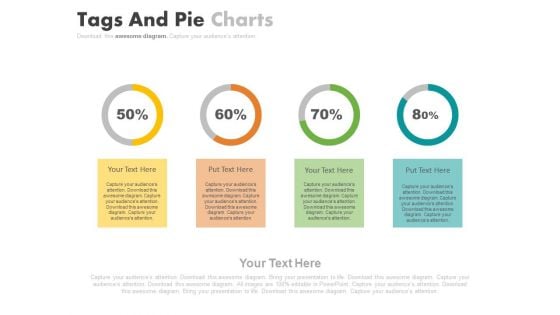
Four Steps For Financial Data Analysis Powerpoint Slides
This PowerPoint contains four circles with percentage values. Download this diagram slide to display financial data analysis. This template is editable, You can edit text, color, shade and style of this diagram as per you need.
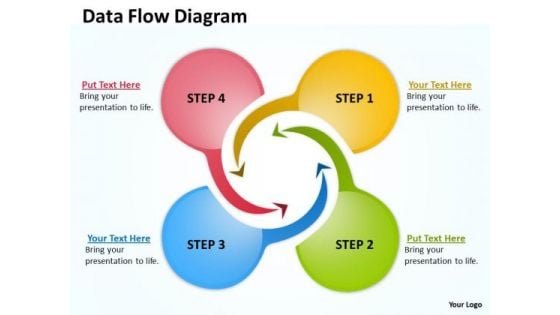
Marketing Diagram Data Flow Diagram Consulting Diagram
Open Up Doors That Lead To Success. Our Marketing_Diagram_Data_Flow_Diagram_Consulting_Diagram Powerpoint Templates Provide The Handles.
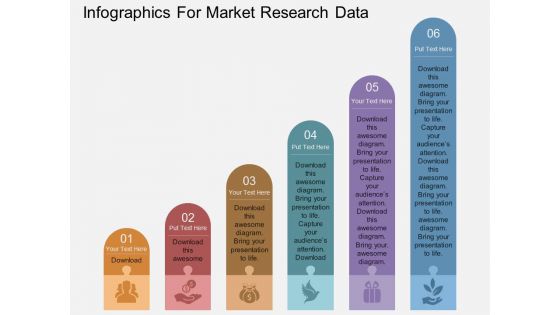
Infographics For Market Research Data Powerpoint Template
Our professionally designed business diagram is as an effective tool for communicating market research and planning. It contains infographic template design. Convey your views with this diagram slide. It will amplify the strength of your logic.
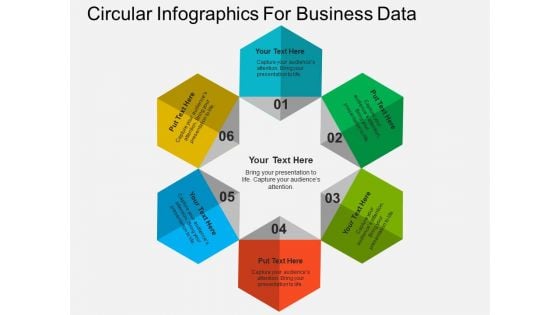
Circular Infographics For Business Data Powerpoint Templates
This PowerPoint diagram slide contains circular infographic. Download this diagram slide to display six steps of business process. You can edit text, color, shade and style of this diagram as per you need.
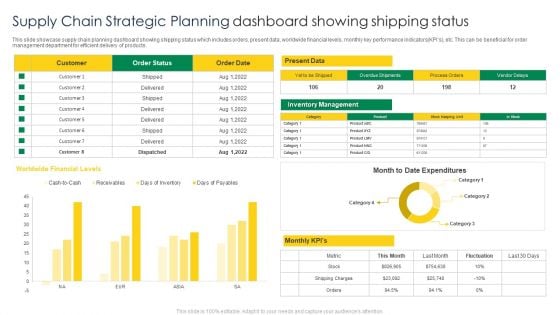
Supply Chain Strategic Planning Dashboard Showing Shipping Status Structure PDF
This slide showcase supply chain planning dashboard showing shipping status which includes orders, present data, worldwide financial levels, monthly key performance indicators KPIs, etc. This can be beneficial for order management department for efficient delivery of products. Showcasing this set of slides titled Supply Chain Strategic Planning Dashboard Showing Shipping Status Structure PDF. The topics addressed in these templates are Worldwide Financial Levels, Present Data, Customer. All the content presented in this PPT design is completely editable. Download it and make adjustments in color, background, font etc. as per your unique business setting.
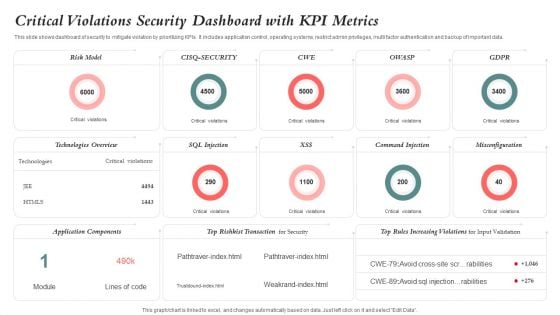
Critical Violations Security Dashboard With KPI Metrics Graphics PDF
This slide shows dashboard of security to mitigate violation by prioritizing KPIs. It includes application control, operating systems, restrict admin privileges, multi factor authentication and backup of important data. Showcasing this set of slides titled Critical Violations Security Dashboard With KPI Metrics Graphics PDF. The topics addressed in these templates are Risk Model, Application Components, Technologies Overview. All the content presented in this PPT design is completely editable. Download it and make adjustments in color, background, font etc. as per your unique business setting.
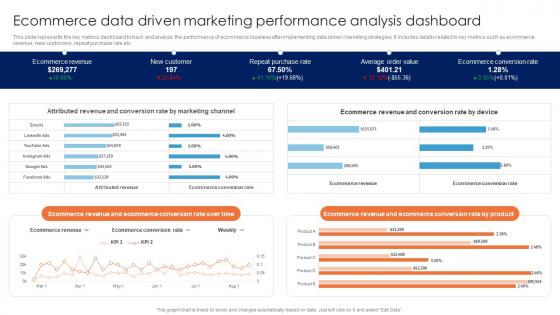
Ecommerce Data Driven Marketing Performance Guide For Data Driven Advertising Brochure Pdf
This slide represents the key metrics dashboard to track and analyze the performance of ecommerce business after implementing data driven marketing strategies. It includes details related to key metrics such as ecommerce revenue, new customers, repeat purchase rate etc.Here you can discover an assortment of the finest PowerPoint and Google Slides templates. With these templates, you can create presentations for a variety of purposes while simultaneously providing your audience with an eye-catching visual experience. Download Ecommerce Data Driven Marketing Performance Guide For Data Driven Advertising Brochure Pdf to deliver an impeccable presentation. These templates will make your job of preparing presentations much quicker, yet still, maintain a high level of quality. Slidegeeks has experienced researchers who prepare these templates and write high-quality content for you. Later on, you can personalize the content by editing the Ecommerce Data Driven Marketing Performance Guide For Data Driven Advertising Brochure Pdf. This slide represents the key metrics dashboard to track and analyze the performance of ecommerce business after implementing data driven marketing strategies. It includes details related to key metrics such as ecommerce revenue, new customers, repeat purchase rate etc.
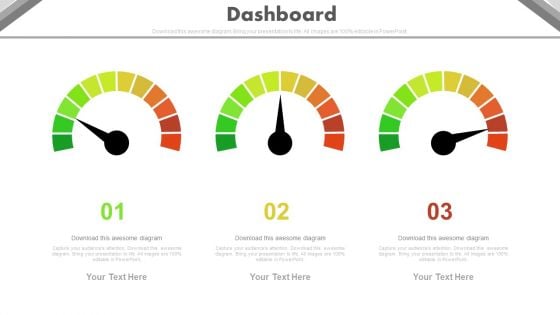
Three Steps Dashboard Charts For Financial Review Powerpoint Slides
This PowerPoint template has been designed with three dashboards. Use this PPT slide to depict financial review and plan. This professional diagram slide will help you express your views to target audience.

Implementing Succession Planning HR Performance Management Dashboard Microsoft PDF
This graph or chart is linked to excel, and changes automatically based on data. Just left click on it and select Edit Data. Find highly impressive Implementing Succession Planning HR Performance Management Dashboard Microsoft PDF on Slidegeeks to deliver a meaningful presentation. You can save an ample amount of time using these presentation templates. No need to worry to prepare everything from scratch because Slidegeeks experts have already done a huge research and work for you. You need to download Implementing Succession Planning HR Performance Management Dashboard Microsoft PDF for your upcoming presentation. All the presentation templates are 100 percent editable and you can change the color and personalize the content accordingly. Download now.
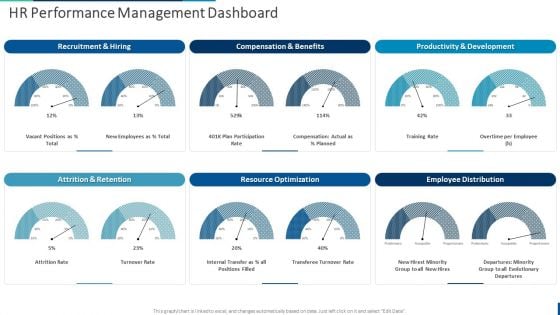
Internal Employee Succession HR Performance Management Dashboard Guidelines PDF
This graph or chart is linked to excel, and changes automatically based on data. Just left click on it and select Edit Data. Find highly impressive Internal Employee Succession HR Performance Management Dashboard Guidelines PDF on Slidegeeks to deliver a meaningful presentation. You can save an ample amount of time using these presentation templates. No need to worry to prepare everything from scratch because Slidegeeks experts have already done a huge research and work for you. You need to download Internal Employee Succession HR Performance Management Dashboard Guidelines PDF for your upcoming presentation. All the presentation templates are 100 percent editable and you can change the color and personalize the content accordingly. Download now
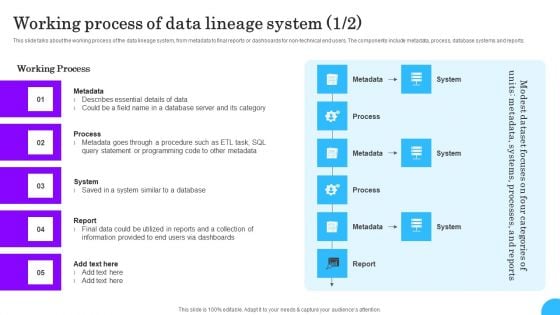
Comprehensive Analysis Of Different Data Lineage Classification Working Process Data Lineage System Demonstration PDF
This slide talks about the working process of the data lineage system, from metadata to final reports or dashboards for non technical end users. The components include metadata, process, database systems and reports. This Comprehensive Analysis Of Different Data Lineage Classification Working Process Data Lineage System Demonstration PDF is perfect for any presentation, be it in front of clients or colleagues. It is a versatile and stylish solution for organizing your meetings. The Comprehensive Analysis Of Different Data Lineage Classification Working Process Data Lineage System Demonstration PDF features a modern design for your presentation meetings. The adjustable and customizable slides provide unlimited possibilities for acing up your presentation. Slidegeeks has done all the homework before launching the product for you. So, do not wait, grab the presentation templates today

Data Lineage Implementation Working Process Of Data Lineage System Designs PDF
This slide talks about the working process of the data lineage system, from metadata to final reports or dashboards for non-technical end users. The components include metadata, process, database systems and reports. This Data Lineage Implementation Working Process Of Data Lineage System Designs PDF is perfect for any presentation, be it in front of clients or colleagues. It is a versatile and stylish solution for organizing your meetings. The Data Lineage Implementation Working Process Of Data Lineage System Designs PDF features a modern design for your presentation meetings. The adjustable and customizable slides provide unlimited possibilities for acing up your presentation. Slidegeeks has done all the homework before launching the product for you. So, do not wait, grab the presentation templates today
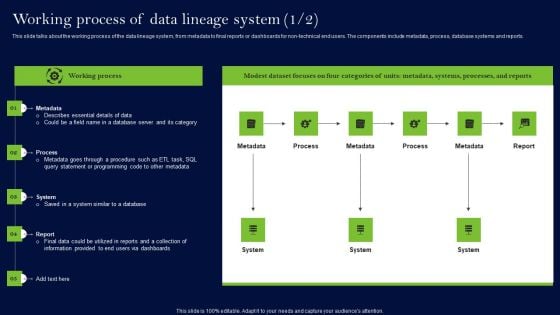
Data Lineage Methods Working Process Of Data Lineage System Structure PDF
This slide talks about the working process of the data lineage system, from metadata to final reports or dashboards for non-technical end users. The components include metadata, process, database systems and reports. Get a simple yet stunning designed Data Lineage Methods Working Process Of Data Lineage System Structure PDF. It is the best one to establish the tone in your meetings. It is an excellent way to make your presentations highly effective. So, download this PPT today from Slidegeeks and see the positive impacts. Our easy-to-edit Data Lineage Methods Working Process Of Data Lineage System Structure PDF can be your go-to option for all upcoming conferences and meetings. So, what are you waiting for Grab this template today.
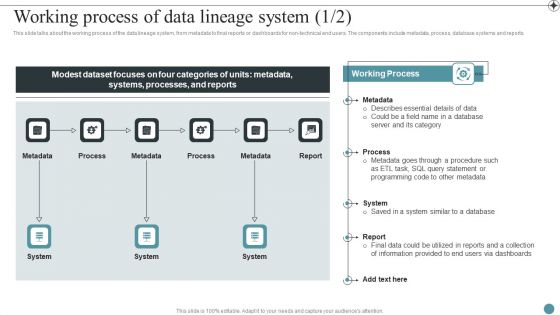
Working Process Of Data Lineage System Deploying Data Lineage IT Summary PDF
This slide talks about the working process of the data lineage system, from metadata to final reports or dashboards for non-technical end users. The components include metadata, process, database systems and reports.Coming up with a presentation necessitates that the majority of the effort goes into the content and the message you intend to convey. The visuals of a PowerPoint presentation can only be effective if it supplements and supports the story that is being told. Keeping this in mind our experts created Working Process Of Data Lineage System Deploying Data Lineage IT Summary PDF to reduce the time that goes into designing the presentation. This way, you can concentrate on the message while our designers take care of providing you with the right template for the situation.
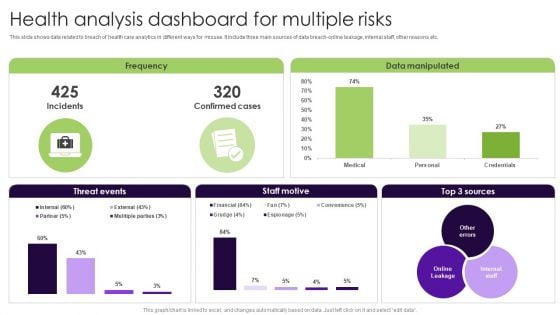
Health Analysis Dashboard For Multiple Risks Elements PDF
This slide shows data related to breach of health care analytics in different ways for misuse. It include three main sources of data breach-online leakage, internal staff, other reasons etc. Showcasing this set of slides titled Health Analysis Dashboard For Multiple Risks Elements PDF. The topics addressed in these templates are Health Analysis Dashboard, Multiple Risks. All the content presented in this PPT design is completely editable. Download it and make adjustments in color, background, font etc. as per your unique business setting.
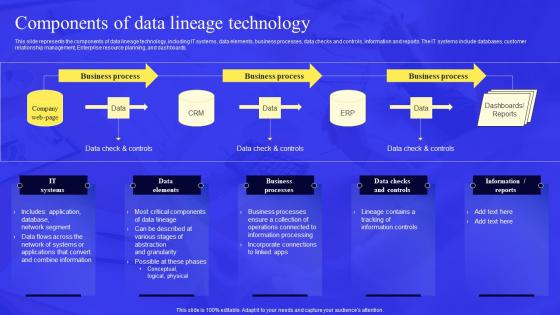
Business Process Data Lineage Components Of Data Lineage Technology Clipart Pdf
This slide represents the components of data lineage technology, including IT systems, data elements, business processes, data checks and controls, information and reports. The IT systems include databases, customer relationship management, Enterprise resource planning, and dashboards. Present like a pro with Business Process Data Lineage Components Of Data Lineage Technology Clipart Pdf Create beautiful presentations together with your team, using our easy to use presentation slides. Share your ideas in real time and make changes on the fly by downloading our templates. So whether you are in the office, on the go, or in a remote location, you can stay in sync with your team and present your ideas with confidence. With Slidegeeks presentation got a whole lot easier. Grab these presentations today. This slide represents the components of data lineage technology, including IT systems, data elements, business processes, data checks and controls, information and reports. The IT systems include databases, customer relationship management, Enterprise resource planning, and dashboards.
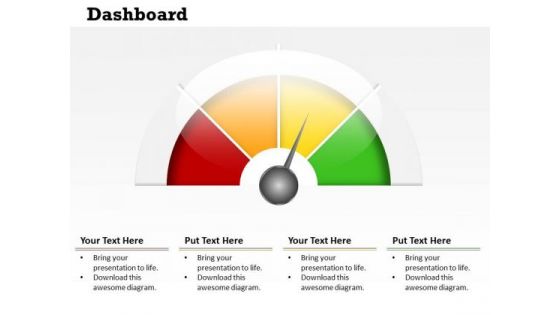
Business Framework Model Dashboard Design Business Strategy Diagram
Get The Doers Into Action. Activate Them With Our Business Framework Model Dashboard Design Business Strategy Diagram Powerpoint Templates.
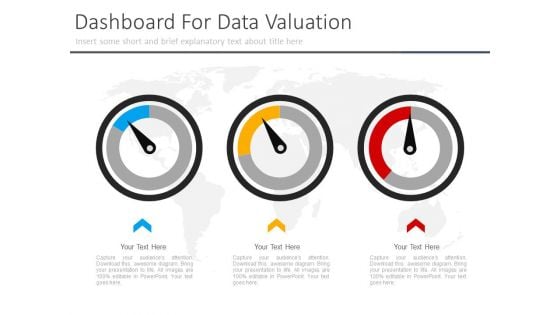
Three Dashboard For Corporate Level Strategy Powerpoint Slides
This PowerPoint template has been designed with three dashboards. You may use this slide to display corporate level strategy. This diagram provides an effective way of displaying information you can edit text, color, shade and style as per you need.
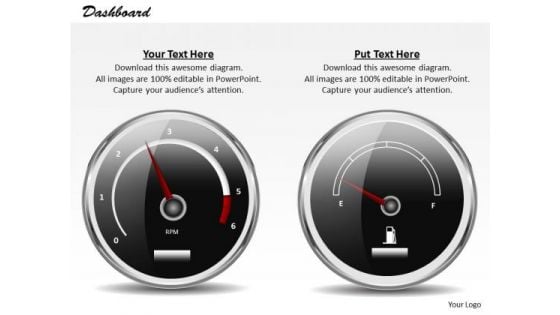
Business Cycle Diagram Dashboard Design To Communicate Effectively Strategy Diagram
Get Out Of The Dock With Our Business Cycle Diagram Dashboard Design To Communicate Effectively Strategy Diagram Powerpoint Templates. Your Mind Will Be Set Free.
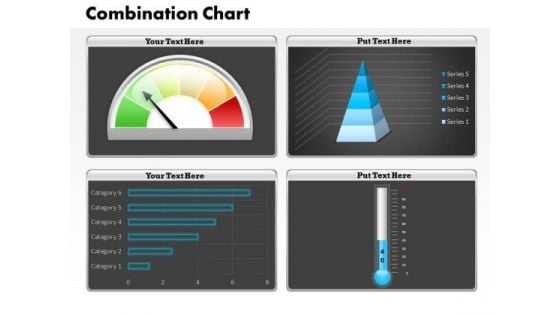
Business Cycle Diagram Business Dashboard Combination Chart Strategy Diagram
Analyze Ailments On Our Business Cycle Diagram Business Dashboard Combination Chart Strategy Diagram Powerpoint Templates. Bring Out The Thinking Doctor In You. Dock Your Thoughts With Our Business Cycle Diagram Business Dashboard Combination Chart Strategy Diagram Powerpoint Templates. They Will Launch Them Into Orbit.
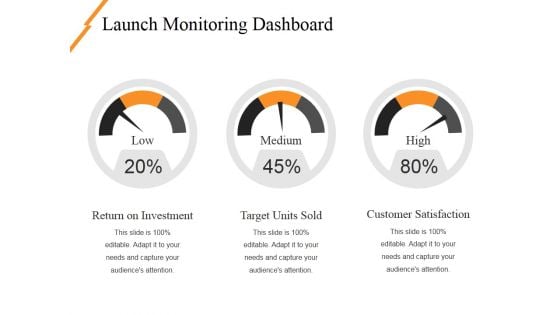
Launch Monitoring Dashboard Ppt PowerPoint Presentation Ideas Layouts
This is a launch monitoring dashboard ppt powerpoint presentation ideas layouts. This is a three stage process. The stages in this process are low, medium, high, dashboard, measurement.


 Continue with Email

 Home
Home


