Data Dashboard

The Digital Project Managers Project Change Management Kpi Dashboard
This slide represents KPI dashboard to effectively track and monitor effectiveness of changes implemented in organizational projects. It includes details related to KPIs such as changes investigated, submitted, approved, declined, etc. This The Digital Project Managers Project Change Management Kpi Dashboard from Slidegeeks makes it easy to present information on your topic with precision. It provides customization options, so you can make changes to the colors, design, graphics, or any other component to create a unique layout. It is also available for immediate download, so you can begin using it right away. Slidegeeks has done good research to ensure that you have everything you need to make your presentation stand out. Make a name out there for a brilliant performance. This slide represents KPI dashboard to effectively track and monitor effectiveness of changes implemented in organizational projects. It includes details related to KPIs such as changes investigated, submitted, approved, declined, etc.
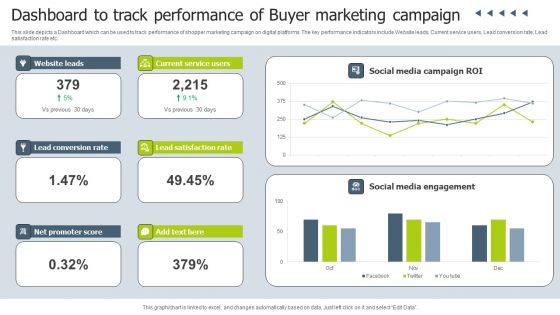
Dashboard To Track Performance Of Buyer Marketing Campaign Infographics PDF
This slide depicts a Dashboard which can be used to track performance of shopper marketing campaign on digital platforms. The key performance indicators include Website leads, Current service users, Lead conversion rate, Lead satisfaction rate etc. Pitch your topic with ease and precision using this Dashboard To Track Performance Of Buyer Marketing Campaign Infographics PDF. This layout presents information on Social Media Campaign, Social Media Engagement, Current Service Users. It is also available for immediate download and adjustment. So, changes can be made in the color, design, graphics or any other component to create a unique layout.
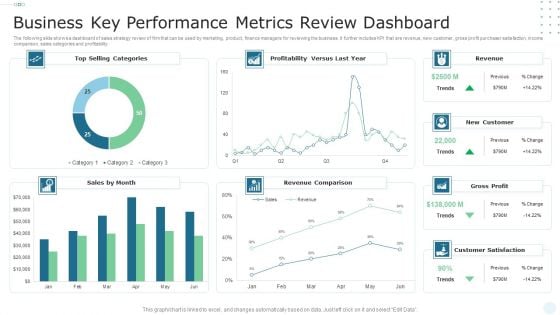
Business Key Performance Metrics Review Dashboard Portrait PDF
The following slide shows a dashboard of sales strategy review of firm that can be used by marketing, product, finance managers for reviewing the business. It further includes KPI that are revenue, new customer, gross profit purchaser satisfaction, income comparison, sales categories and profitability. Showcasing this set of slides titled Business Key Performance Metrics Review Dashboard Portrait PDF. The topics addressed in these templates are Sales, Revenue Comparison, Profitability. All the content presented in this PPT design is completely editable. Download it and make adjustments in color, background, font etc. as per your unique business setting.
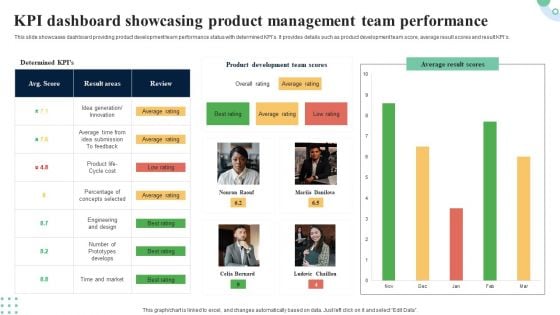
KPI Dashboard Showcasing Product Management Team Performance Demonstration PDF
This slide represents dashboard showcasing revenue assessment for new product development. It projects information regarding revenue breakdown, revenue per product, time to marketing and win or loss analysis. Showcasing this set of slides titled KPI Dashboard Showcasing Product Management Team Performance Demonstration PDF. The topics addressed in these templates are Revenue Per Project, Revenue Breakdown, Loss Analysis. All the content presented in this PPT design is completely editable. Download it and make adjustments in color, background, font etc. as per your unique business setting.
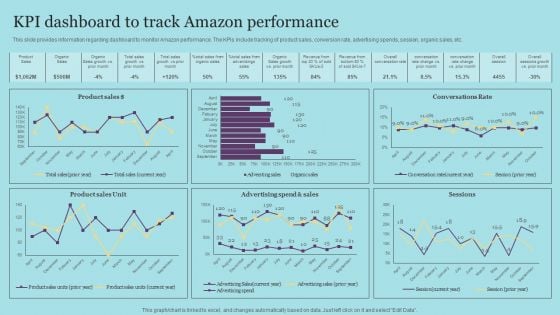
KPI Dashboard To Track Amazon Performance Designs PDF
This slide provides information regarding dashboard to monitor Amazon performance. The KPIs include tracking of product sales, conversion rate, advertising spends, session, organic sales, etc. Do you have to make sure that everyone on your team knows about any specific topic I yes, then you should give KPI Dashboard To Track Amazon Performance Designs PDF a try. Our experts have put a lot of knowledge and effort into creating this impeccable KPI Dashboard To Track Amazon Performance Designs PDF. You can use this template for your upcoming presentations, as the slides are perfect to represent even the tiniest detail. You can download these templates from the Slidegeeks website and these are easy to edit. So grab these today
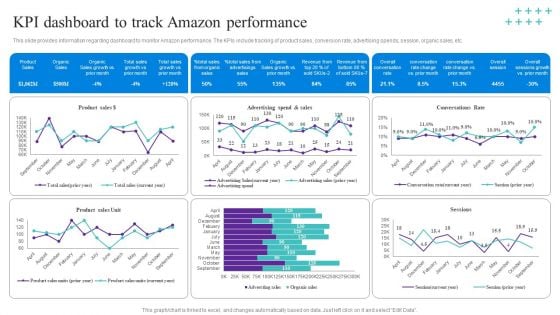
KPI Dashboard To Track Amazon Performance Template PDF
This slide provides information regarding dashboard to monitor Amazon performance. The KPIs include tracking of product sales, conversion rate, advertising spends, session, organic sales, etc. Do you have to make sure that everyone on your team knows about any specific topic I yes, then you should give KPI Dashboard To Track Amazon Performance Template PDF a try. Our experts have put a lot of knowledge and effort into creating this impeccable KPI Dashboard To Track Amazon Performance Template PDF. You can use this template for your upcoming presentations, as the slides are perfect to represent even the tiniest detail. You can download these templates from the Slidegeeks website and these are easy to edit. So grab these today
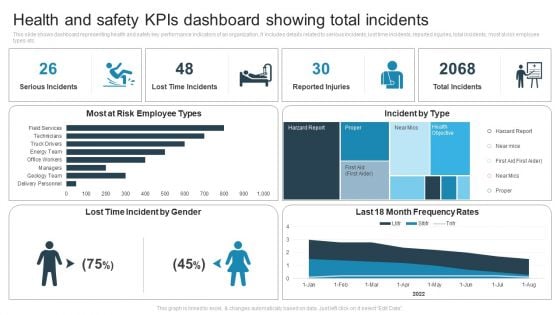
Health And Safety Kpis Dashboard Showing Total Incidents Pictures PDF
This slide shows dashboard representing health and safety key performance indicators of an organization. It includes details related to serious incidents, lost time incidents, reported injuries, total incidents, most at risk employee types etc. Showcasing this set of slides titled Health And Safety Kpis Dashboard Showing Total Incidents Pictures PDF. The topics addressed in these templates are Lost Time Incident, Most At Risk Employee, Incident By Type. All the content presented in this PPT design is completely editable. Download it and make adjustments in color, background, font etc. as per your unique business setting.
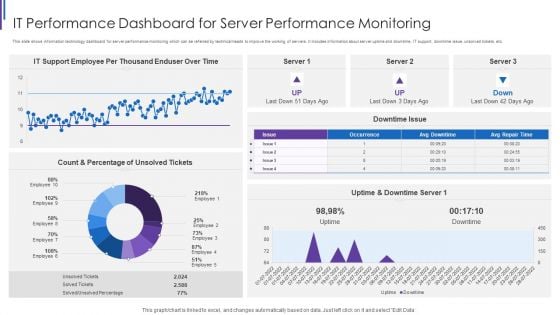
IT Performance Dashboard For Server Performance Monitoring Portrait PDF
This slide shows information technology dashboard for server performance monitoring which can be referred by technical heads to improve the working of servers. It includes information about server uptime and downtime, IT support, downtime issue, unsolved tickets, etc. Showcasing this set of slides titled IT Performance Dashboard For Server Performance Monitoring Portrait PDF. The topics addressed in these templates are IT Support Employee, Per Thousand Enduser, Uptime And Downtime, Count And Percentage. All the content presented in this PPT design is completely editable. Download it and make adjustments in color, background, font etc. as per your unique business setting.
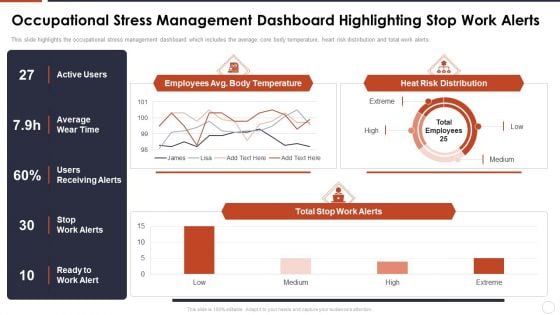
Occupational Stress Management Dashboard Highlighting Stop Work Alerts Background PDF
This slide highlights the occupational stress management dashboard which includes the average core body temperature, heart risk distribution and total work alerts. If you are looking for a format to display your unique thoughts, then the professionally designed Occupational Stress Management Dashboard Highlighting Stop Work Alerts Background PDF is the one for you. You can use it as a Google Slides template or a PowerPoint template. Incorporate impressive visuals, symbols, images, and other charts. Modify or reorganize the text boxes as you desire. Experiment with shade schemes and font pairings. Alter, share or cooperate with other people on your work. Download Occupational Stress Management Dashboard Highlighting Stop Work Alerts Background PDF and find out how to give a successful presentation. Present a perfect display to your team and make your presentation unforgettable.
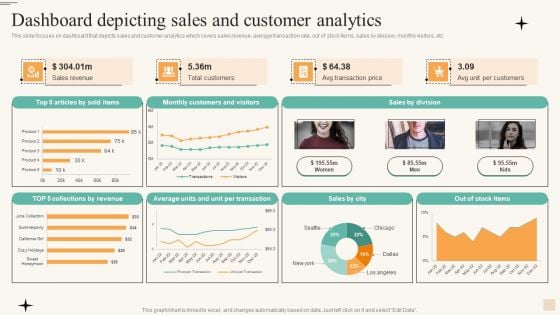
Dashboard Depicting Sales And Customer Analytics Infographics PDF
This slide focuses on dashboard that depicts sales and customer analytics which covers sales revenue, average transaction rate, out of stock items, sales by division, monthly visitors, etc. If you are looking for a format to display your unique thoughts, then the professionally designed Dashboard Depicting Sales And Customer Analytics Infographics PDF is the one for you. You can use it as a Google Slides template or a PowerPoint template. Incorporate impressive visuals, symbols, images, and other charts. Modify or reorganize the text boxes as you desire. Experiment with shade schemes and font pairings. Alter, share or cooperate with other people on your work. Download Dashboard Depicting Sales And Customer Analytics Infographics PDF and find out how to give a successful presentation. Present a perfect display to your team and make your presentation unforgettable.
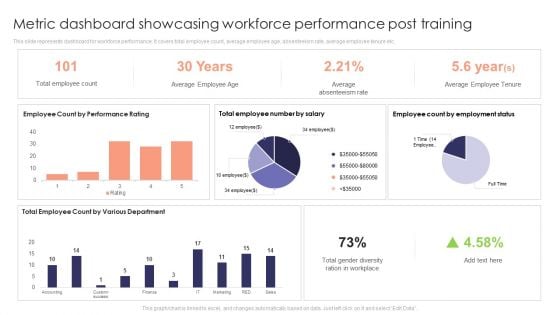
Metric Dashboard Showcasing Workforce Performance Post Training Ideas PDF
This slide represents dashboard for workforce performance. It covers total employee count, average employee age, absenteeism rate, average employee tenure etc. If you are looking for a format to display your unique thoughts, then the professionally designed Metric Dashboard Showcasing Workforce Performance Post Training Ideas PDF is the one for you. You can use it as a Google Slides template or a PowerPoint template. Incorporate impressive visuals, symbols, images, and other charts. Modify or reorganize the text boxes as you desire. Experiment with shade schemes and font pairings. Alter, share or cooperate with other people on your work. Download Metric Dashboard Showcasing Workforce Performance Post Training Ideas PDF and find out how to give a successful presentation. Present a perfect display to your team and make your presentation unforgettable.
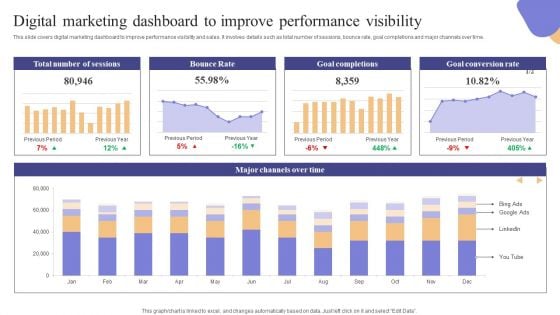
Digital Marketing Dashboard To Improve Performance Visibility Brochure PDF
This slide covers digital marketing dashboard to improve performance visibility and sales. It involves details such as total number of sessions, bounce rate, goal completions and major channels over time. If you are looking for a format to display your unique thoughts, then the professionally designed Digital Marketing Dashboard To Improve Performance Visibility Brochure PDF is the one for you. You can use it as a Google Slides template or a PowerPoint template. Incorporate impressive visuals, symbols, images, and other charts. Modify or reorganize the text boxes as you desire. Experiment with shade schemes and font pairings. Alter, share or cooperate with other people on your work. Download Digital Marketing Dashboard To Improve Performance Visibility Brochure PDF and find out how to give a successful presentation. Present a perfect display to your team and make your presentation unforgettable.
Cost And Purchase Order Procurement Dashboard Icons PDF
This slide provides an overview of the cost and purchase order-related performance indicators to improve efficiency and optimize processes. The dashboard includes the cost of the purchase order, cost reduction, savings, procurement ROI and top 5 suppliers. If you are looking for a format to display your unique thoughts, then the professionally designed Cost And Purchase Order Procurement Dashboard Icons PDF is the one for you. You can use it as a Google Slides template or a PowerPoint template. Incorporate impressive visuals, symbols, images, and other charts. Modify or reorganize the text boxes as you desire. Experiment with shade schemes and font pairings. Alter, share or cooperate with other people on your work. Download Cost And Purchase Order Procurement Dashboard Icons PDF and find out how to give a successful presentation. Present a perfect display to your team and make your presentation unforgettable.

Dashboard To Measure Workflow Performance Post RPA Implementation Demonstration PDF
This slide presents a dashboard to measure the overall operation performance after RPA implementation. It includes return on investment, bot numbers, saved hours, capital, bots runtime, time saved by bots, and workflow processes. If you are looking for a format to display your unique thoughts, then the professionally designed Dashboard To Measure Workflow Performance Post RPA Implementation Demonstration PDF is the one for you. You can use it as a Google Slides template or a PowerPoint template. Incorporate impressive visuals, symbols, images, and other charts. Modify or reorganize the text boxes as you desire. Experiment with shade schemes and font pairings. Alter, share or cooperate with other people on your work. Download Dashboard To Measure Workflow Performance Post RPA Implementation Demonstration PDF and find out how to give a successful presentation. Present a perfect display to your team and make your presentation unforgettable.
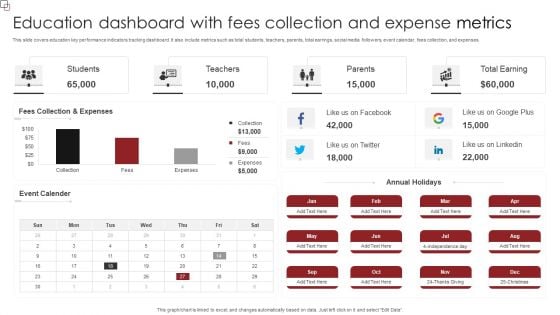
Education Dashboard With Fees Collection And Expense Metrics Demonstration PDF
This slide covers education key performance indicators tracking dashboard. It also include metrics such as total students, teachers, parents, total earrings, social media followers, event calendar, fees collection, and expenses. Showcasing this set of slides titled Education Dashboard With Fees Collection And Expense Metrics Demonstration PDF. The topics addressed in these templates are Event Calender, Annual Holidays, Fees Collection, Expenses. All the content presented in this PPT design is completely editable. Download it and make adjustments in color, background, font etc. as per your unique business setting.

Employee Feedback Dashboard With Key Metrics Elements PDF
The following slide depicts the key insights of the feedback survey to gauge employee engagement at different department levels. It includes metrics such as engagement score, response rate, no. of comments etc.Showcasing this set of slides titled Employee Feedback Dashboard With Key Metrics Elements PDF The topics addressed in these templates are Employee Feedback Dashboard With Key Metrics All the content presented in this PPT design is completely editable. Download it and make adjustments in color, background, font etc. as per your unique business setting.
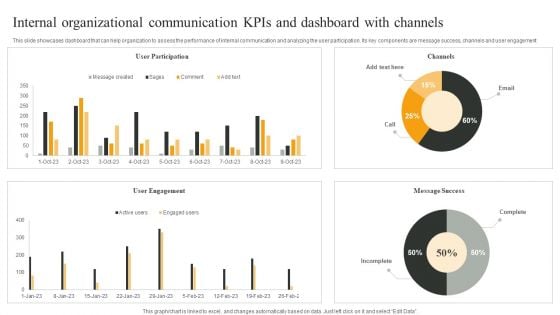
Internal Organizational Communication Kpis And Dashboard With Channels Infographics PDF
This slide showcases dashboard that can help organization to assess the performance of internal communication and analyzing the user participation. Its key components are message success, channels and user engagement. Pitch your topic with ease and precision using this Internal Organizational Communication Kpis And Dashboard With Channels Infographics PDF. This layout presents information on User Participation, User Engagement, Message Success. It is also available for immediate download and adjustment. So, changes can be made in the color, design, graphics or any other component to create a unique layout.
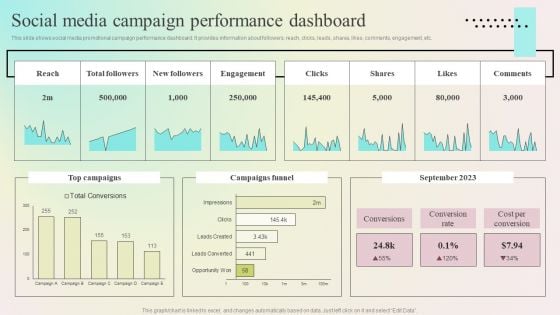
Enhancing Organic Reach Social Media Campaign Performance Dashboard Rules PDF
This slide shows social media promotional campaign performance dashboard. It provides information about followers, reach, clicks, leads, shares, likes, comments, engagement, etc. Formulating a presentation can take up a lot of effort and time, so the content and message should always be the primary focus. The visuals of the PowerPoint can enhance the presenters message, so our Enhancing Organic Reach Social Media Campaign Performance Dashboard Rules PDF was created to help save time. Instead of worrying about the design, the presenter can concentrate on the message while our designers work on creating the ideal templates for whatever situation is needed. Slidegeeks has experts for everything from amazing designs to valuable content, we have put everything into Enhancing Organic Reach Social Media Campaign Performance Dashboard Rules PDF
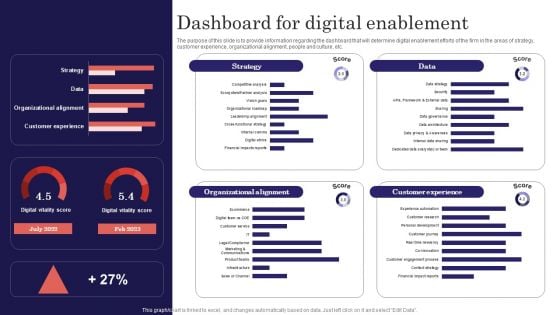
Digitalized Business Checklist Dashboard For Digital Enablement Themes PDF
The purpose of this slide is to provide information regarding the dashboard that will determine digital enablement efforts of the firm in the areas of strategy, customer experience, organizational alignment, people and culture, etc. Formulating a presentation can take up a lot of effort and time, so the content and message should always be the primary focus. The visuals of the PowerPoint can enhance the presenters message, so our Digitalized Business Checklist Dashboard For Digital Enablement Themes PDF was created to help save time. Instead of worrying about the design, the presenter can concentrate on the message while our designers work on creating the ideal templates for whatever situation is needed. Slidegeeks has experts for everything from amazing designs to valuable content, we have put everything into Digitalized Business Checklist Dashboard For Digital Enablement Themes PDF.
Employee Performance Tracking And Management Dashboard Designs PDF
This slide showcases a dashboard presenting various metrics to measure and analyze employee overall performance. It outlines information about average absenteeism rate, yearly average overtime hours, training costs and overall labor effectiveness. Formulating a presentation can take up a lot of effort and time, so the content and message should always be the primary focus. The visuals of the PowerPoint can enhance the presenters message, so our Employee Performance Tracking And Management Dashboard Designs PDF was created to help save time. Instead of worrying about the design, the presenter can concentrate on the message while our designers work on creating the ideal templates for whatever situation is needed. Slidegeeks has experts for everything from amazing designs to valuable content, we have put everything into Employee Performance Tracking And Management Dashboard Designs PDF
Organizational Plan Overview Corporate Financial Performance Tracking Dashboard Icons PDF
This slide provides information regarding dashboard utilized by firm to monitor financial performance. The performance is tracked through revenues generated, vendors associated, profit generated, etc. Here you can discover an assortment of the finest PowerPoint and Google Slides templates. With these templates, you can create presentations for a variety of purposes while simultaneously providing your audience with an eye-catching visual experience. Download Organizational Plan Overview Corporate Financial Performance Tracking Dashboard Icons PDF to deliver an impeccable presentation. These templates will make your job of preparing presentations much quicker, yet still, maintain a high level of quality. Slidegeeks has experienced researchers who prepare these templates and write high-quality content for you. Later on, you can personalize the content by editing the Organizational Plan Overview Corporate Financial Performance Tracking Dashboard Icons PDF.
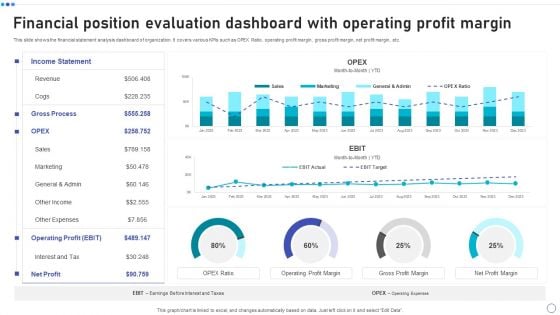
Financial Position Evaluation Dashboard With Operating Profit Margin Elements PDF
This slide shows the financial statement analysis dashboard of organization. It covers various KPIs such as OPEX Ratio, operating profit margin, gross profit margin, net profit margin, etc. Pitch your topic with ease and precision using this Financial Position Evaluation Dashboard With Operating Profit Margin Elements PDF. This layout presents information on Income Statement, Revenue, Operating Profit, Net Profit. It is also available for immediate download and adjustment. So, changes can be made in the color, design, graphics or any other component to create a unique layout.
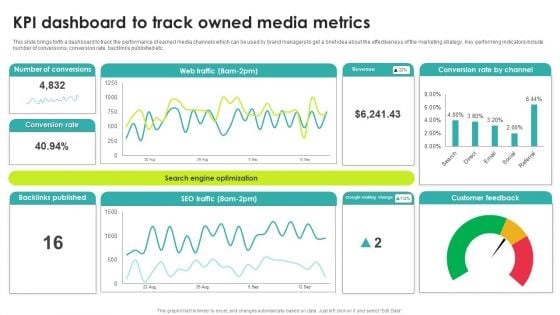
Kpi Dashboard To Track Owned Media Metrics Rules PDF
This slide brings forth a dashboard to track the performance of earned media channels which can be used by brand managers to get a brief idea about the effectiveness of the marketing strategy. Key performing indicators include number of conversions, conversion rate, backlinks published etc. Pitch your topic with ease and precision using this Kpi Dashboard To Track Owned Media Metrics Rules PDF. This layout presents information on Conversions, Backlinks Published, Metrics. It is also available for immediate download and adjustment. So, changes can be made in the color, design, graphics or any other component to create a unique layout.
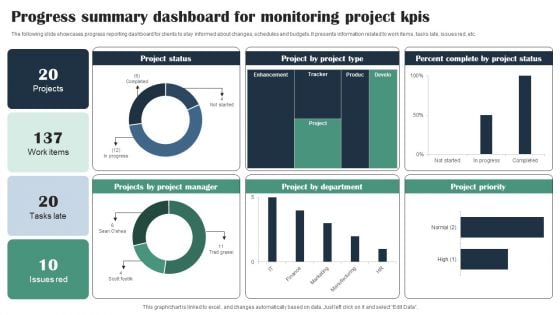
Progress Summary Dashboard For Monitoring Project Kpis Infographics PDF
The following slide showcases progress reporting dashboard for clients to stay informed about changes, schedules and budgets. It presents information related to work items, tasks late, issues red, etc. Pitch your topic with ease and precision using this Progress Summary Dashboard For Monitoring Project Kpis Infographics PDF. This layout presents information on Project Status, Project Manager, Project Type, Percent Complete. It is also available for immediate download and adjustment. So, changes can be made in the color, design, graphics or any other component to create a unique layout.
Customer Service Metrics Dashboard With Customer Retention Rate Icons PDF
This slide showcases KPIs dashboard for customer service that can help organization to track the consumer satisfaction score and improve product or service by improving customer loyalty. Its key components are net promoter score, customer retention and support costs. Showcasing this set of slides titled Customer Service Metrics Dashboard With Customer Retention Rate Icons PDF. The topics addressed in these templates are Customer Retention, Net Promoter Score, Service Level. All the content presented in this PPT design is completely editable. Download it and make adjustments in color, background, font etc. as per your unique business setting.
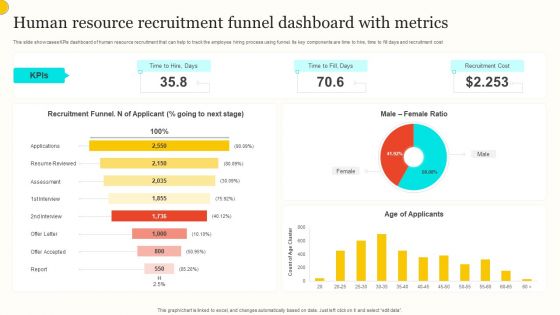
Human Resource Recruitment Funnel Dashboard With Metrics Summary PDF
This slide showcases KPIs dashboard of human resource recruitment that can help to track the employee hiring process using funnel. Its key components are time to hire, time to fill days and recruitment cost. Showcasing this set of slides titled Human Resource Recruitment Funnel Dashboard With Metrics Summary PDF. The topics addressed in these templates are Recruitment Funnel, Male Female Ratio, Age Applicants. All the content presented in this PPT design is completely editable. Download it and make adjustments in color, background, font etc. as per your unique business setting.

Business Referral Marketing Program Performance Metrics Dashboard Introduction PDF
This slide shows KPI dashboard to effectively track performance of business referral program in order to attract more leads and potential customers to the busines. It includes details related to key metrics such as referral participation rate, referred customers, referral conversion rate and total revenue generated. Showcasing this set of slides titled Business Referral Marketing Program Performance Metrics Dashboard Introduction PDF. The topics addressed in these templates are Referral Participation Rate, Referred Customers, Referral Conversion Rate, Total Revenue Generated. All the content presented in this PPT design is completely editable. Download it and make adjustments in color, background, font etc. as per your unique business setting.
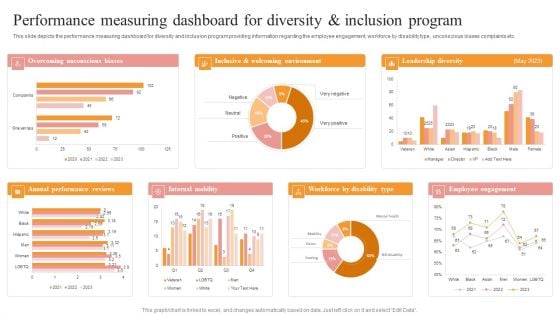
Performance Measuring Dashboard For Diversity And Inclusion Program Summary PDF
This slide depicts the performance measuring dashboard for diversity and inclusion program providing information regarding the employee engagement, workforce by disability type, unconscious biases complaints etc. Explore a selection of the finest Performance Measuring Dashboard For Diversity And Inclusion Program Summary PDF here. With a plethora of professionally designed and pre made slide templates, you can quickly and easily find the right one for your upcoming presentation. You can use our Performance Measuring Dashboard For Diversity And Inclusion Program Summary PDF to effectively convey your message to a wider audience. Slidegeeks has done a lot of research before preparing these presentation templates. The content can be personalized and the slides are highly editable. Grab templates today from Slidegeeks.
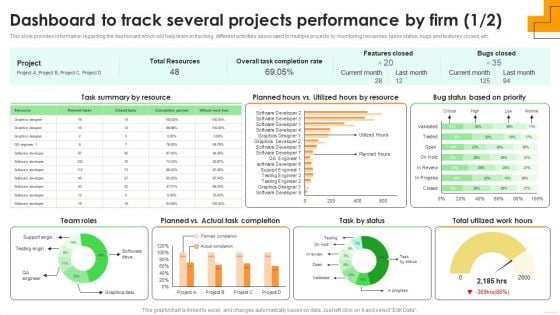
Dashboard To Track Several Projects Performance By Firm Themes PDF
This slide provides information regarding the dashboard which will help team in tracking different activities associated to multiple projects by monitoring resources, tasks status, bugs and features closed, etc. Find highly impressive Dashboard To Track Several Projects Performance By Firm Themes PDF on Slidegeeks to deliver a meaningful presentation. You can save an ample amount of time using these presentation templates. No need to worry to prepare everything from scratch because Slidegeeks experts have already done a huge research and work for you. You need to download Dashboard To Track Several Projects Performance By Firm Themes PDF for your upcoming presentation. All the presentation templates are 100 percent editable and you can change the color and personalize the content accordingly. Download now
Security Incidents Tracking Dashboard Workplace Security Management Program Summary PDF
This slide portrays information regarding the dashboard that firm will track various incidents detected. These incidents will be managed in order to avoid security risks. Find highly impressive Security Incidents Tracking Dashboard Workplace Security Management Program Summary PDF on Slidegeeks to deliver a meaningful presentation. You can save an ample amount of time using these presentation templates. No need to worry to prepare everything from scratch because Slidegeeks experts have already done a huge research and work for you. You need to download Security Incidents Tracking Dashboard Workplace Security Management Program Summary PDF for your upcoming presentation. All the presentation templates are 100 percent editable and you can change the color and personalize the content accordingly. Download now.
Employee Performance Tracking And Management Dashboard Pictures PDF
This slide showcases a dashboard presenting various metrics to measure and analyze employee overall performance. It outlines information about average absenteeism rate, yearly average overtime hours, training costs and overall labor effectiveness. Find highly impressive Employee Performance Tracking And Management Dashboard Pictures PDF on Slidegeeks to deliver a meaningful presentation. You can save an ample amount of time using these presentation templates. No need to worry to prepare everything from scratch because Slidegeeks experts have already done a huge research and work for you. You need to download Employee Performance Tracking And Management Dashboard Pictures PDF for your upcoming presentation. All the presentation templates are 100 percent editable and you can change the color and personalize the content accordingly. Download now.
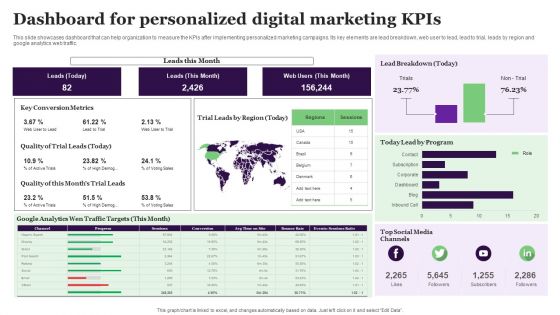
Dashboard For Personalized Digital Marketing Kpis Introduction PDF
This slide showcases dashboard that can help organization to measure the KPIs after implementing personalized marketing campaigns. Its key elements are lead breakdown, web user to lead, lead to trial, leads by region and google analytics web traffic. Boost your pitch with our creative Dashboard For Personalized Digital Marketing Kpis Introduction PDF. Deliver an awe-inspiring pitch that will mesmerize everyone. Using these presentation templates you will surely catch everyones attention. You can browse the ppts collection on our website. We have researchers who are experts at creating the right content for the templates. So you do not have to invest time in any additional work. Just grab the template now and use them.
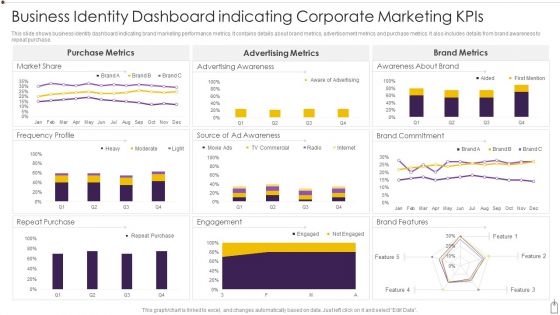
Business Identity Dashboard Indicating Corporate Marketing Kpis Diagrams PDF
This slide shows business identity dashboard indicating brand marketing performance metrics. It contains details about brand metrics, advertisement metrics and purchase metrics. It also includes details from brand awareness to repeat purchase. Showcasing this set of slides titled Business Identity Dashboard Indicating Corporate Marketing Kpis Diagrams PDF. The topics addressed in these templates are Purchase, Engagement, Market Share. All the content presented in this PPT design is completely editable. Download it and make adjustments in color, background, font etc. as per your unique business setting.
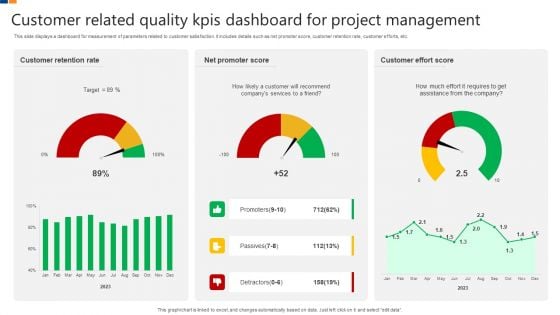
Customer Related Quality Kpis Dashboard For Project Management Brochure PDF
This slide displays a dashboard for measurement of parameters related to customer satisfaction. It includes details such as net promoter score, customer retention rate, customer efforts, etc. Showcasing this set of slides titled Customer Related Quality Kpis Dashboard For Project Management Brochure PDF. The topics addressed in these templates are Customer Retention Rate, Net Promoter Score, Customer Effort Score. All the content presented in this PPT design is completely editable. Download it and make adjustments in color, background, font etc. as per your unique business setting.

Call Center Kpis Agent Performance Dashboard Clipart PDF
This slide covers contact center agent performance metrics KPI dashboard. It involves metrics such as number of calls, average response time, average hold time, daily average transfer rate and agents with most hold time and transfer rate. Showcasing this set of slides titled Call Center Kpis Agent Performance Dashboard Clipart PDF. The topics addressed in these templates are Transfer Rate, Call Center, Hold Time. All the content presented in this PPT design is completely editable. Download it and make adjustments in color, background, font etc. as per your unique business setting.
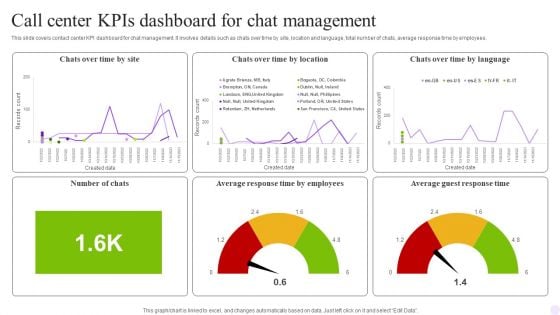
Call Center Kpis Dashboard For Chat Management Graphics PDF
This slide covers contact center KPI dashboard for chat management. It involves details such as chats over time by site, location and language, total number of chats, average response time by employees. Showcasing this set of slides titled Call Center Kpis Dashboard For Chat Management Graphics PDF. The topics addressed in these templates are Management, Employees, Chats. All the content presented in this PPT design is completely editable. Download it and make adjustments in color, background, font etc. as per your unique business setting.
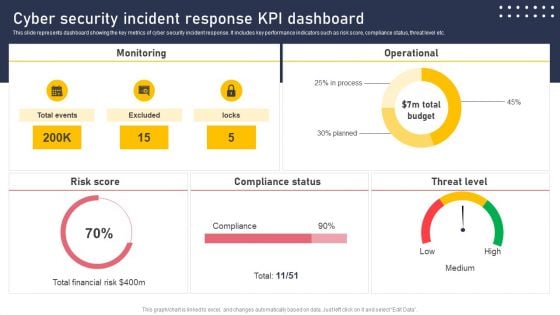
Cyber Security Incident Response KPI Dashboard Microsoft PDF
This slide represents dashboard showing the key metrics of cyber security incident response. It includes key performance indicators such as risk score, compliance status, threat level etc. Slidegeeks has constructed Cyber Security Incident Response KPI Dashboard Microsoft PDF after conducting extensive research and examination. These presentation templates are constantly being generated and modified based on user preferences and critiques from editors. Here, you will find the most attractive templates for a range of purposes while taking into account ratings and remarks from users regarding the content. This is an excellent jumping off point to explore our content and will give new users an insight into our top notch PowerPoint Templates.
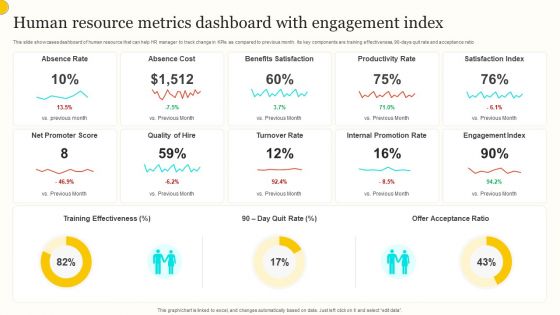
Human Resource Metrics Dashboard With Engagement Index Guidelines PDF
This slide showcases dashboard of human resource that can help HR manager to track change in KPIs as compared to previous month. Its key components are training effectiveness, 90 days quit rate and acceptance ratio. Pitch your topic with ease and precision using this Human Resource Metrics Dashboard With Engagement Index Guidelines PDF. This layout presents information on Absence Rate, Absence Cost, Benefits Satisfaction. It is also available for immediate download and adjustment. So, changes can be made in the color, design, graphics or any other component to create a unique layout.
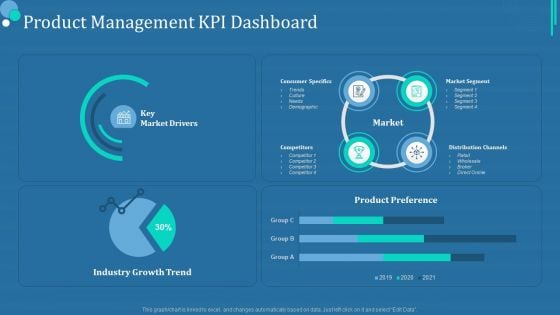
Commodity Category Analysis Product Management KPI Dashboard Inspiration PDF
Deliver an awe inspiring pitch with this creative commodity category analysis product management kpi dashboard inspiration pdf bundle. Topics like key market drivers, industry growth trend, product preference can be discussed with this completely editable template. It is available for immediate download depending on the needs and requirements of the user.
Content Marketing Freelance Metrics Dashboard With Visitor Demographics Icons PDF
Showcasing this set of slides titled Content Marketing Freelance Metrics Dashboard With Visitor Demographics Icons PDF. The topics addressed in these templates are Content Level Metrics, Revenue Generated, Visitor Demographics. All the content presented in this PPT design is completely editable. Download it and make adjustments in color, background, font etc. as per your unique business setting.
Facebook Analytics Pixel Marketing Plan Dashboard Professional PDF
This slide exhibits dashboard which offers free point of view for optimization and in-depth analysis of visitors. This template helps in tracking social media and campaigns performance. It involves information related to revenue, age factor, etc. Showcasing this set of slides titled Facebook Analytics Pixel Marketing Plan Dashboard Professional PDF Graphics. The topics addressed in these templates are People Metrics, Lifetime Value, Purchases Repeated. All the content presented in this PPT design is completely editable. Download it and make adjustments in color, background, font etc. as per your unique business setting.
Lead Tracking Metrics Dashboard With User Responses Diagrams PDF
This slide showcases dashboard for lead conversion metrics that can help organization to filter out total leads interested from the leads who have responded to the phone calls by organization. It also showcases key metrics such as leads busiest hours, leads busiest days, phone number types and lead types. Showcasing this set of slides titled Lead Tracking Metrics Dashboard With User Responses Diagrams PDF. The topics addressed in these templates are Busiest Hours Leads, Conversion Metrics, Lead Types. All the content presented in this PPT design is completely editable. Download it and make adjustments in color, background, font etc. as per your unique business setting.
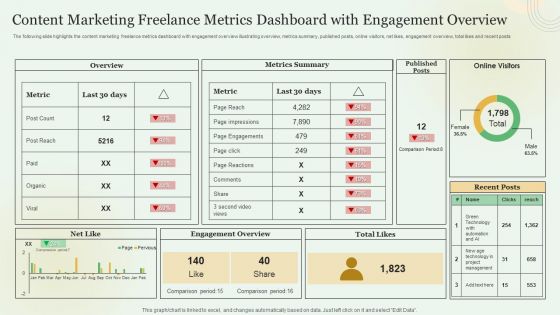
Content Marketing Freelance Metrics Dashboard With Engagement Overview Demonstration PDF
Showcasing this set of slides titled Content Marketing Freelance Metrics Dashboard With Engagement Overview Demonstration PDF. The topics addressed in these templates are Metrics Summary, Engagement Overview. All the content presented in this PPT design is completely editable. Download it and make adjustments in color, background, font etc. as per your unique business setting.
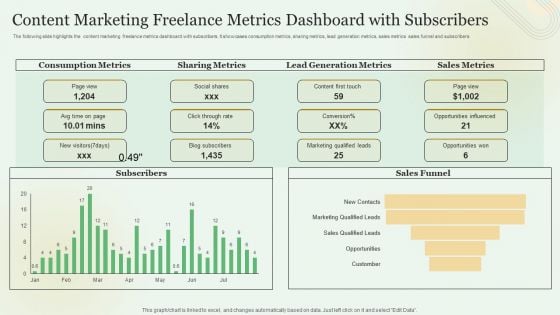
Content Marketing Freelance Metrics Dashboard With Subscribers Mockup PDF
Showcasing this set of slides titled Content Marketing Freelance Metrics Dashboard With Subscribers Mockup PDF. The topics addressed in these templates are Sharing Metrics, Lead Generation Metrics, Sales Metrics. All the content presented in this PPT design is completely editable. Download it and make adjustments in color, background, font etc. as per your unique business setting.
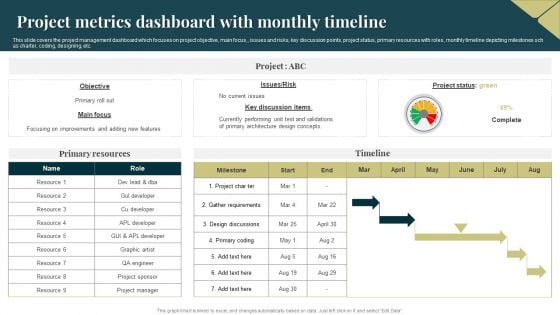
Project Metrics Dashboard With Monthly Timeline Pictures PDF
This slide covers the project management dashboard which focuses on project objective, main focus,, issues and risks, key discussion points, project status, primary resources with roles, monthly timeline depicting milestones sch as charter, coding, designing, etc. Showcasing this set of slides titled Project Metrics Dashboard With Monthly Timeline Pictures PDF. The topics addressed in these templates are Primary Resources, Risk, Requirements. All the content presented in this PPT design is completely editable. Download it and make adjustments in color, background, font etc. as per your unique business setting.
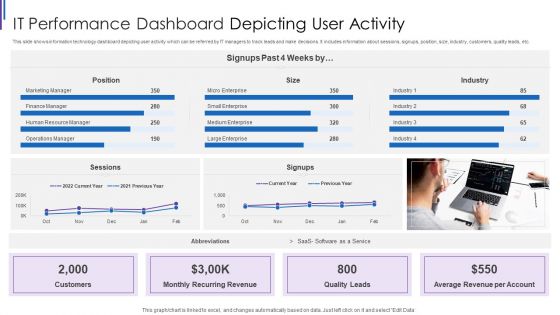
IT Performance Dashboard Depicting User Activity Inspiration PDF
This slide shows information technology dashboard depicting user activity which can be referred by IT managers to track leads and make decisions. It includes information about sessions, signups, position, size, industry, customers, quality leads, etc. Pitch your topic with ease and precision using this IT Performance Dashboard Depicting User Activity Inspiration PDF. This layout presents information on Monthly Recurring Revenue, Average Revenue Per, Account Quality Leads, Customers Position Sessions. It is also available for immediate download and adjustment. So, changes can be made in the color, design, graphics or any other component to create a unique layout.
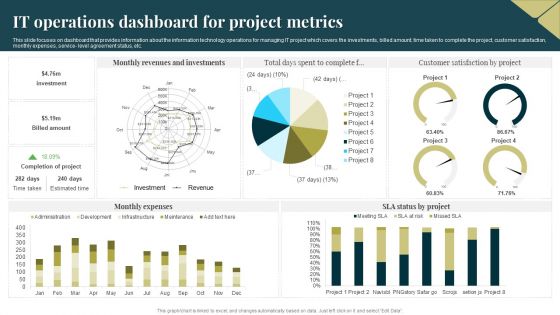
IT Operations Dashboard For Project Metrics Portrait PDF
This slide focuses on dashboard that provides information about the information technology operations for managing IT project which covers the investments, billed amount, time taken to complete the project, customer satisfaction, monthly expenses, service level agreement status, etc. Pitch your topic with ease and precision using this IT Operations Dashboard For Project Metrics Portrait PDF. This layout presents information on Revenues, Investments, Monthly Expenses. It is also available for immediate download and adjustment. So, changes can be made in the color, design, graphics or any other component to create a unique layout.
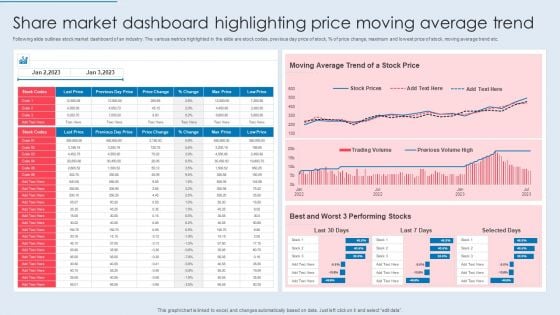
Share Market Dashboard Highlighting Price Moving Average Trend Themes PDF
Following slide outlines stock market dashboard of an industry. The various metrics highlighted in the slide are stock codes, previous day price of stock, percent of price change, maximum and lowest price of stock, moving average trend etc. Pitch your topic with ease and precision using this Share Market Dashboard Highlighting Price Moving Average Trend Themes PDF. This layout presents information on Moving Average, Stock Price, Performing Stocks. It is also available for immediate download and adjustment. So, changes can be made in the color, design, graphics or any other component to create a unique layout.
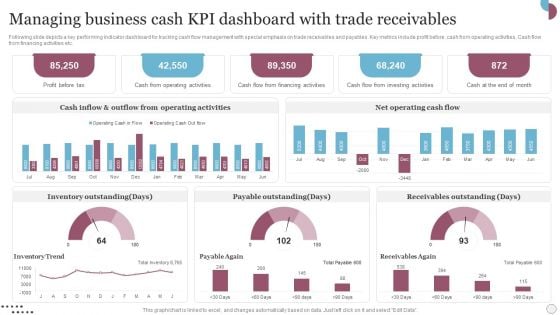
Managing Business Cash Kpi Dashboard With Trade Receivables Slides PDF
Following slide depicts a key performing indicator dashboard for tracking cash flow management with special emphasis on trade receivables and payables. Key metrics include profit before, cash from operating activities, Cash flow from financing activities etc. Showcasing this set of slides titled Managing Business Cash Kpi Dashboard With Trade Receivables Slides PDF. The topics addressed in these templates are Inventory Outstanding, Payable Outstanding, Receivables Outstanding. All the content presented in this PPT design is completely editable. Download it and make adjustments in color, background, font etc. as per your unique business setting.
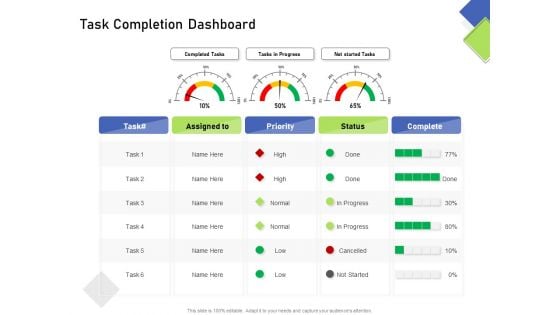
Developing Content Mapping Strategy Task Completion Dashboard Formats PDF
Deliver an awe-inspiring pitch with this creative developing content mapping strategy task completion dashboard formats pdf bundle. Topics like task, assigned to, priority, status, complete can be discussed with this completely editable template. It is available for immediate download depending on the needs and requirements of the user.
Dashboard For Tracking Brand Awareness Advertisement Campaign Results Download PDF
This slide showcases dashboard that can help organization to track results of online advertisement campaigns. Its key components ad impressions, click through rate, cost per conversion, revenue per click, impressions, new users and sessions. Here you can discover an assortment of the finest PowerPoint and Google Slides templates. With these templates, you can create presentations for a variety of purposes while simultaneously providing your audience with an eye catching visual experience. Download Dashboard For Tracking Brand Awareness Advertisement Campaign Results Download PDF to deliver an impeccable presentation. These templates will make your job of preparing presentations much quicker, yet still, maintain a high level of quality. Slidegeeks has experienced researchers who prepare these templates and write high quality content for you. Later on, you can personalize the content by editing the Dashboard For Tracking Brand Awareness Advertisement Campaign Results Download PDF.

Financial KPI Dashboard With Profit And Loss Analysis Designs PDF
Showcasing this set of slides titled Financial KPI Dashboard With Profit And Loss Analysis Designs PDF. The topics addressed in these templates are Assets And Liabilities, Cash Flow Analysis, Income And Expenses. All the content presented in this PPT design is completely editable. Download it and make adjustments in color, background, font etc. as per your unique business setting.
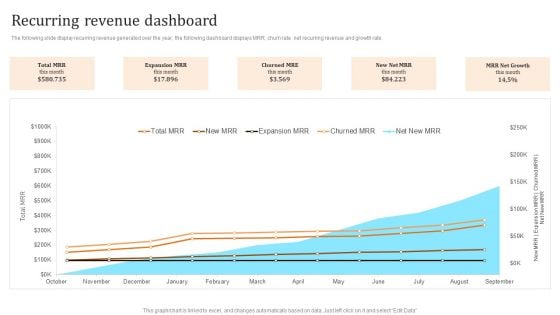
Membership Based Revenue Plan Recurring Revenue Dashboard Pictures PDF
The following slide display recurring revenue generated over the year, the following dashboard displays MRR, churn rate net recurring revenue and growth rate. Formulating a presentation can take up a lot of effort and time, so the content and message should always be the primary focus. The visuals of the PowerPoint can enhance the presenters message, so our Membership Based Revenue Plan Recurring Revenue Dashboard Pictures PDF was created to help save time. Instead of worrying about the design, the presenter can concentrate on the message while our designers work on creating the ideal templates for whatever situation is needed. Slidegeeks has experts for everything from amazing designs to valuable content, we have put everything into Membership Based Revenue Plan Recurring Revenue Dashboard Pictures PDF
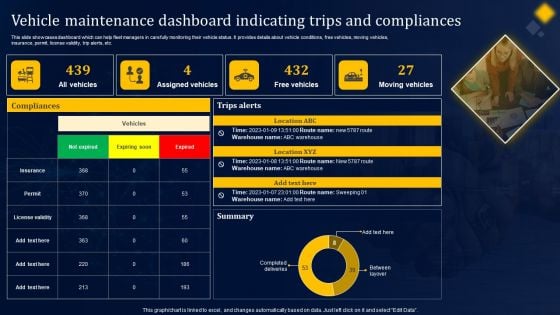
Vehicle Maintenance Dashboard Indicating Trips And Compliances Structure PDF
This slide showcases dashboard which can help fleet managers in carefully monitoring their vehicle status. It provides details about vehicle conditions, free vehicles, moving vehicles, insurance, permit, license validity, trip alerts, etc. Here you can discover an assortment of the finest PowerPoint and Google Slides templates. With these templates, you can create presentations for a variety of purposes while simultaneously providing your audience with an eye-catching visual experience. Download Vehicle Maintenance Dashboard Indicating Trips And Compliances Structure PDF to deliver an impeccable presentation. These templates will make your job of preparing presentations much quicker, yet still, maintain a high level of quality. Slidegeeks has experienced researchers who prepare these templates and write high-quality content for you. Later on, you can personalize the content by editing the Vehicle Maintenance Dashboard Indicating Trips And Compliances Structure PDF.
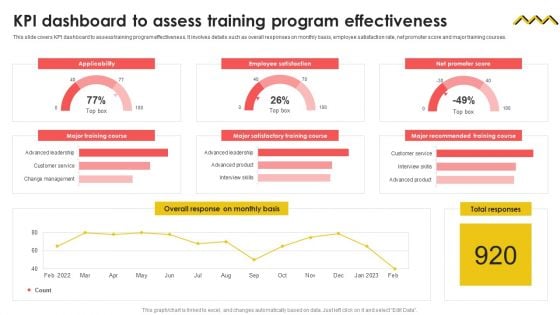
KPI Dashboard To Assess Training Program Effectiveness Formats PDF
This slide covers KPI dashboard to assess training program effectiveness. It involves details such as overall responses on monthly basis, employee satisfaction rate, net promoter score and major training courses. Here you can discover an assortment of the finest PowerPoint and Google Slides templates. With these templates, you can create presentations for a variety of purposes while simultaneously providing your audience with an eye catching visual experience. Download KPI Dashboard To Assess Training Program Effectiveness Formats PDF to deliver an impeccable presentation. These templates will make your job of preparing presentations much quicker, yet still, maintain a high level of quality. Slidegeeks has experienced researchers who prepare these templates and write high quality content for you. Later on, you can personalize the content by editing the KPI Dashboard To Assess Training Program Effectiveness Formats PDF.
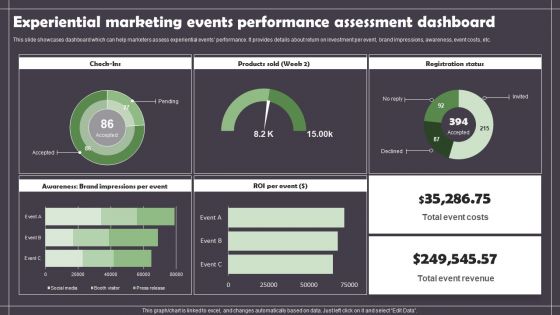
Experiential Marketing Events Performance Assessment Dashboard Portrait PDF
This slide showcases dashboard which can help marketers assess experiential events performance. It provides details about return on investment per event, brand impressions, awareness, event costs, etc. Here you can discover an assortment of the finest PowerPoint and Google Slides templates. With these templates, you can create presentations for a variety of purposes while simultaneously providing your audience with an eye catching visual experience. Download Experiential Marketing Events Performance Assessment Dashboard Portrait PDF to deliver an impeccable presentation. These templates will make your job of preparing presentations much quicker, yet still, maintain a high level of quality. Slidegeeks has experienced researchers who prepare these templates and write high quality content for you. Later on, you can personalize the content by editing the Experiential Marketing Events Performance Assessment Dashboard Portrait PDF.
Dashboard For Tracking Aftersales Customer Services Team Performance Pictures PDF
This slide covers the KPI dashboard for ticket tracking. It includes metrics such as tickets by month, service level, and details of customer service department agents. Here you can discover an assortment of the finest PowerPoint and Google Slides templates. With these templates, you can create presentations for a variety of purposes while simultaneously providing your audience with an eye catching visual experience. Download Dashboard For Tracking Aftersales Customer Services Team Performance Pictures PDF to deliver an impeccable presentation. These templates will make your job of preparing presentations much quicker, yet still, maintain a high level of quality. Slidegeeks has experienced researchers who prepare these templates and write high quality content for you. Later on, you can personalize the content by editing the Dashboard For Tracking Aftersales Customer Services Team Performance Pictures PDF.
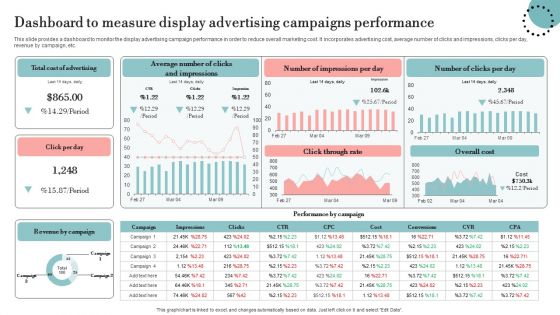
Dashboard To Measure Display Advertising Campaigns Performance Graphics PDF
This slide provides a dashboard to monitor the display advertising campaign performance in order to reduce overall marketing cost. It incorporates advertising cost, average number of clicks and impressions, clicks per day, revenue by campaign, etc. Formulating a presentation can take up a lot of effort and time, so the content and message should always be the primary focus. The visuals of the PowerPoint can enhance the presenters message, so our Dashboard To Measure Display Advertising Campaigns Performance Graphics PDF was created to help save time. Instead of worrying about the design, the presenter can concentrate on the message while our designers work on creating the ideal templates for whatever situation is needed. Slidegeeks has experts for everything from amazing designs to valuable content, we have put everything into Dashboard To Measure Display Advertising Campaigns Performance Graphics PDF
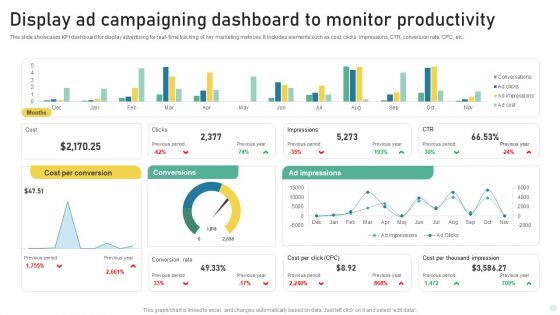
Display Ad Campaigning Dashboard To Monitor Productivity Infographics PDF
This slide showcases KPI dashboard for display advertising for real- time tracking of key marketing metrices, It includes elements such as cost, clicks, impressions, CTR, conversion rate, CPC, etc. Showcasing this set of slides titled Display Ad Campaigning Dashboard To Monitor Productivity Infographics PDF. The topics addressed in these templates are Cost Per Conversion, Conversions, Ad Impressions. All the content presented in this PPT design is completely editable. Download it and make adjustments in color, background, font etc. as per your unique business setting.
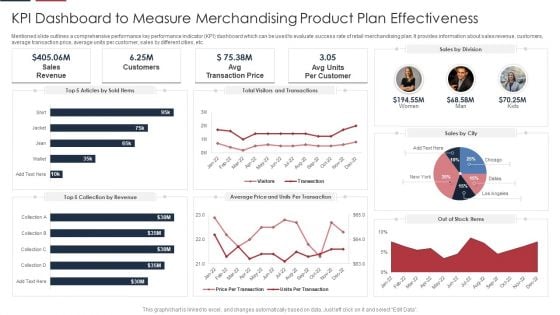
KPI Dashboard To Measure Merchandising Product Plan Effectiveness Guidelines PDF
Mentioned slide outlines a comprehensive performance key performance indicator KPI dashboard which can be used to evaluate success rate of retail merchandising plan. It provides information about sales revenue, customers, average transaction price, average units per customer, sales by different cities, etc. Showcasing this set of slides titled KPI Dashboard To Measure Merchandising Product Plan Effectiveness Guidelines PDF. The topics addressed in these templates are Sales, Customers, Price. All the content presented in this PPT design is completely editable. Download it and make adjustments in color, background, font etc. as per your unique business setting.


 Continue with Email

 Home
Home


