Data Governance Icon
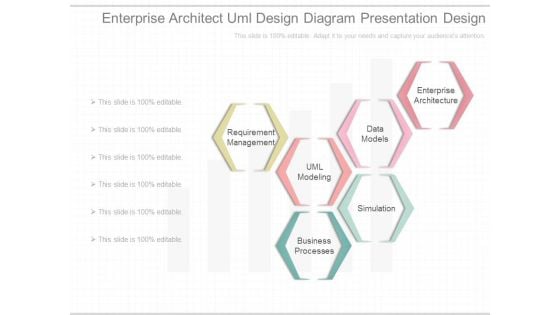
Enterprise Architect Uml Design Diagram Presentation Design
This is a enterprise architect uml design diagram presentation design. This is a six stage process. The stages in this process are requirement management, uml modeling, data models, business processes, simulation, enterprise architecture.
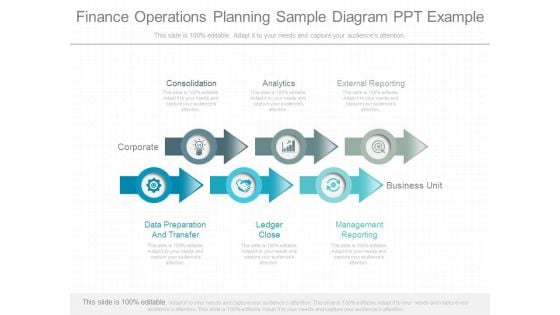
Finance Operations Planning Sample Diagram Ppt Example
This is a finance operations planning sample diagram ppt example. This is a six stage process. The stages in this process are consolidation, analytics, corporate, external reporting, business unit, data preparation and transfer, ledger close, management reporting.\n\n\n\n\n\n\n\n\n \n

Pie Chart With Coins Finance PowerPoint Templates And PowerPoint Backgrounds 0811
Microsoft PowerPoint Template and Background with pie chart with coins and statistic data Facilitate your discourse with our Pie Chart With Coins Finance PowerPoint Templates And PowerPoint Backgrounds 0811. Add to the amenities at your command.
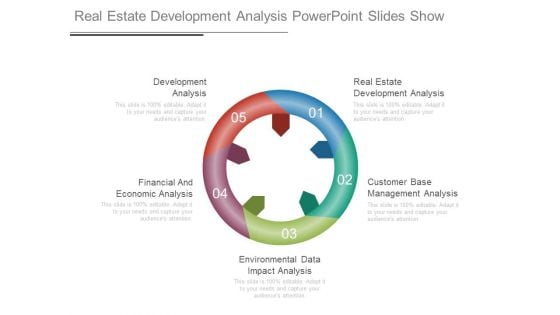
Real Estate Development Analysis Powerpoint Slides Show
This is a real estate development analysis powerpoint slides show. This is a five stage process. The stages in this process are development analysis, financial and economic analysis, environmental data impact analysis, customer base management analysis, real estate development analysis.
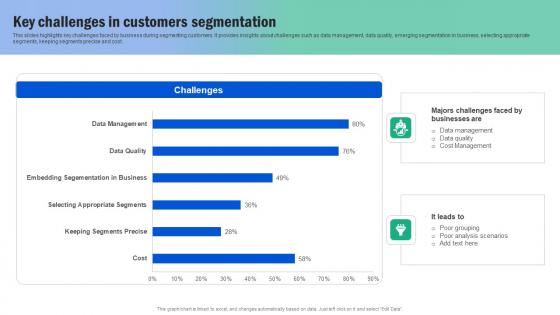
Key Challenges In Customers Segmentation Guide For Segmenting And Formulating Structure Pdf
This slides highlights key challenges faced by business during segmenting customers. It provides insights about challenges such as data management, data quality, emerging segmentation in business, selecting appropriate segments, keeping segments precise and cost. Do you know about Slidesgeeks Key Challenges In Customers Segmentation Guide For Segmenting And Formulating Structure Pdf These are perfect for delivering any kind od presentation. Using it, create PowerPoint presentations that communicate your ideas and engage audiences. Save time and effort by using our pre designed presentation templates that are perfect for a wide range of topic. Our vast selection of designs covers a range of styles, from creative to business, and are all highly customizable and easy to edit. Download as a PowerPoint template or use them as Google Slides themes. This slides highlights key challenges faced by business during segmenting customers. It provides insights about challenges such as data management, data quality, emerging segmentation in business, selecting appropriate segments, keeping segments precise and cost.
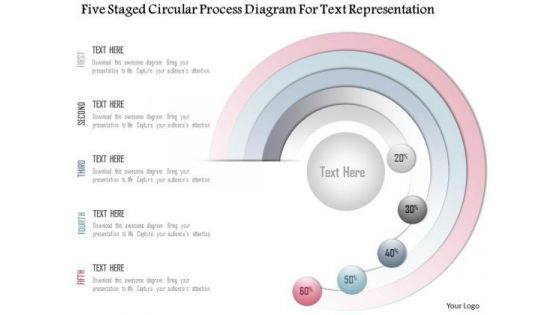
Business Diagram Five Staged Circular Process Diagram For Text Representation Presentation Template
Our above slide displays Five staged circular process diagram. Download our above diagram to express information in a visual way. Use this diagram and get good comments for data related presentations.
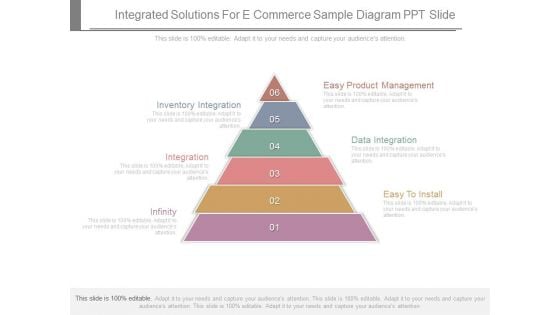
Integrated Solutions For E Commerce Sample Diagram Ppt Slide
This is a integrated solutions for e commerce sample diagram ppt slide. This is a six stage process. The stages in this process are inventory integration, integration, infinity, easy to install, data integration, easy product management.
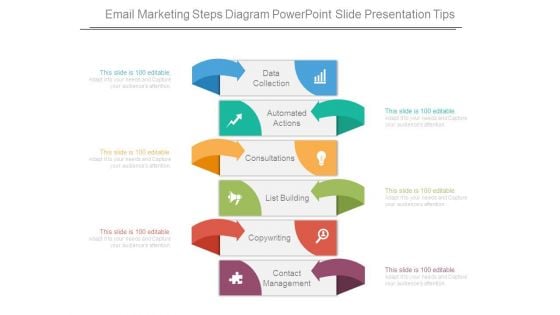
Email Marketing Steps Diagram Powerpoint Slide Presentation Tips
This is a email marketing steps diagram powerpoint slide presentation tips. This is a six stage process. The stages in this process are data collection, automated actions, consultations, list building, copywriting, contact management.
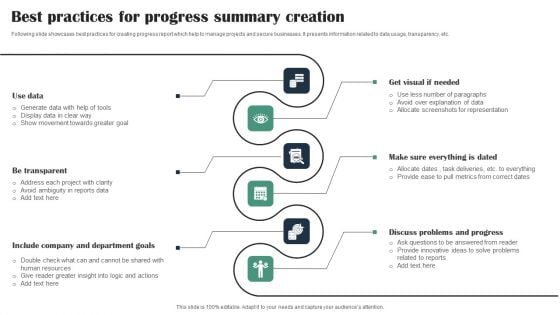
Best Practices For Progress Summary Creation Ideas PDF
Following slide showcases best practices for creating progress report which help to manage projects and secure businesses. It presents information related to data usage, transparency, etc. Presenting Best Practices For Progress Summary Creation Ideas PDF to dispense important information. This template comprises six stages. It also presents valuable insights into the topics including Use Data, Be Transparent, Include Company Department Goals. This is a completely customizable PowerPoint theme that can be put to use immediately. So, download it and address the topic impactfully.
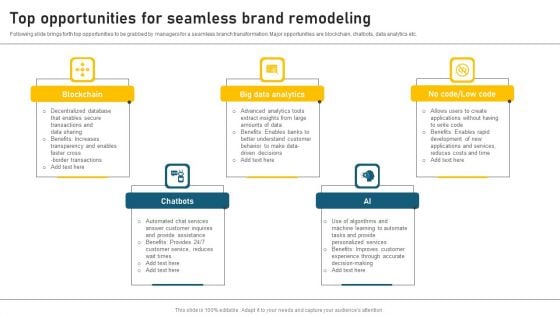
Top Opportunities For Seamless Brand Remodeling Summary PDF
Following slide brings forth top opportunities to be grabbed by managers for a seamless branch transformation. Major opportunities are blockchain, chatbots, data analytics etc. Presenting Top Opportunities For Seamless Brand Remodeling Summary PDF to dispense important information. This template comprises Five stages. It also presents valuable insights into the topics including Blockchain, Big Data Analytics, Chatbots. This is a completely customizable PowerPoint theme that can be put to use immediately. So, download it and address the topic impactfully.
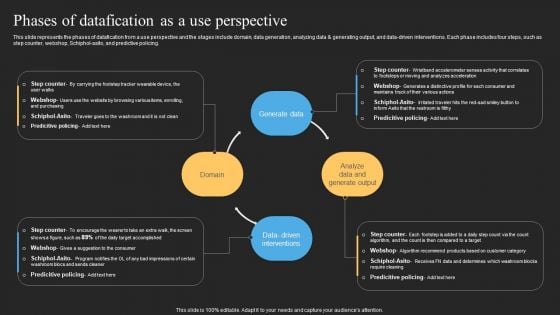
Datafy Phases Of Datafication As A Use Perspective Ideas PDF
This slide represents the phases of datafication from a use perspective and the stages include domain, data generation, analyzing data and generating output, and data-driven interventions. Each phase includes four steps, such as step counter, webshop, Schiphol-asito, and predictive policing. The Datafy Phases Of Datafication As A Use Perspective Ideas PDF is a compilation of the most recent design trends as a series of slides. It is suitable for any subject or industry presentation, containing attractive visuals and photo spots for businesses to clearly express their messages. This template contains a variety of slides for the user to input data, such as structures to contrast two elements, bullet points, and slides for written information. Slidegeeks is prepared to create an impression.
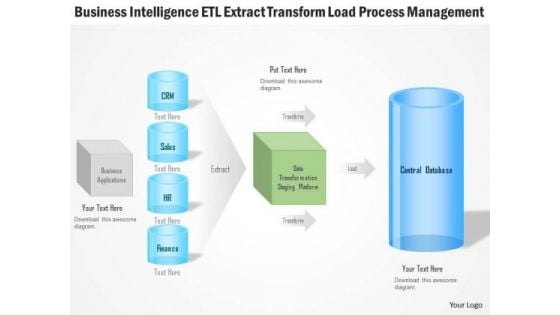
Business Diagram Business Intelligence Etl Extract Transform Load Process Management Ppt Slide
Explain the load process management and ETL extract transform with this unique PPT. This PPT contains the graphic of computer server and data base with connectivity. This PPT can be used for business intelligence related topics in any presentation.
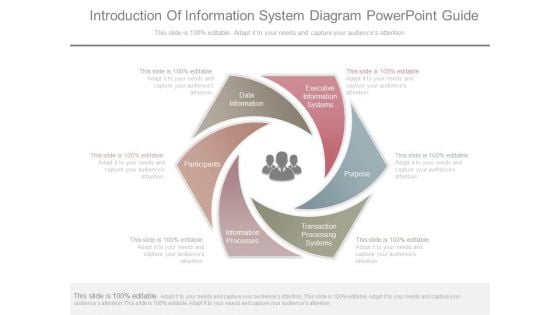
Introduction Of Information System Diagram Powerpoint Guide
This is a introduction of information system diagram powerpoint guide. This is a six stage process. The stages in this process are executive information systems, purpose, transaction processing systems, information processes, participants, data information.
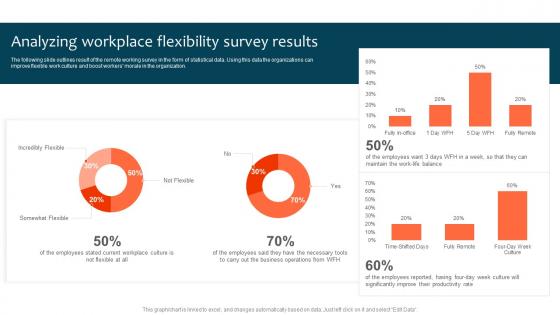
Analyzing Workplace Flexibility Survey Results Optimizing Staff Retention Rate Pictures Pdf
The following slide outlines result of the remote working survey in the form of statistical data. Using this data the organizations can improve flexible work culture and boost workers morale in the organization. The best PPT templates are a great way to save time, energy, and resources. Slidegeeks have 100 percent editable powerpoint slides making them incredibly versatile. With these quality presentation templates, you can create a captivating and memorable presentation by combining visually appealing slides and effectively communicating your message. Download Analyzing Workplace Flexibility Survey Results Optimizing Staff Retention Rate Pictures Pdf from Slidegeeks and deliver a wonderful presentation. The following slide outlines result of the remote working survey in the form of statistical data. Using this data the organizations can improve flexible work culture and boost workers morale in the organization.
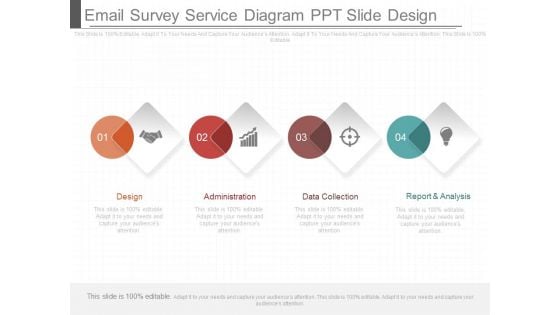
Email Survey Service Diagram Ppt Slide Design
This is a email survey service diagram ppt slide design. This is a four stage process. The stages in this process are design, administration, data collection, report and analysis.
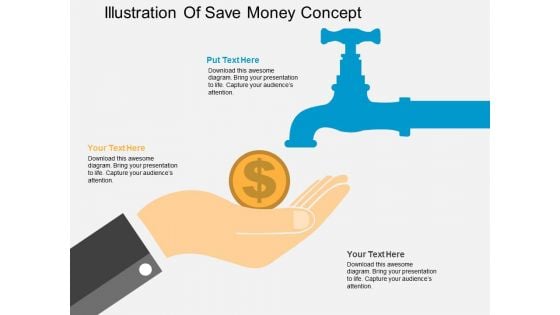
Illustration Of Save Money Concept Powerpoint Templates
This business slide has been designed with infographic square. These text boxes can be used for data representation. Use this diagram for your business presentations. Build a quality presentation for your viewers with this unique diagram.

Business Diagram Three Staged Text Representation Diagram Presentation Template
Display the concept of data flow in any presentation with this unique power point template. This PPT contains the graphic of three staged text boxes. Use this PPT for your business and management related presentations.
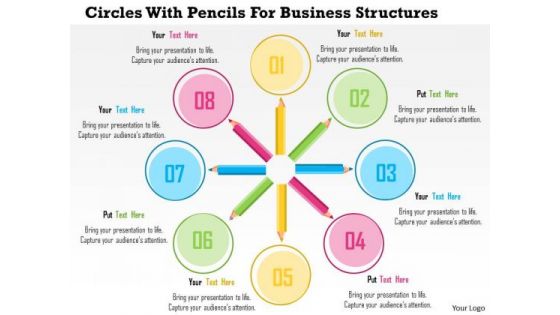
Business Diagram Circles With Pencils For Business Structures Presentation Template
This business diagram has been designed with graphic of pencils with text circles. This slide helps to depict business data and process. Use this slide to build quality presentations for your viewers.
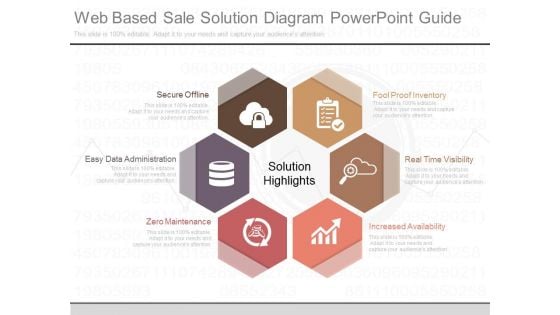
Web Based Sale Solution Diagram Powerpoint Guide
This is a web based sale solution diagram powerpoint guide. This is a six stage process. The stages in this process are fool proof inventory, real time visibility, increased availability, zero maintenance, easy data administration, secure offline.
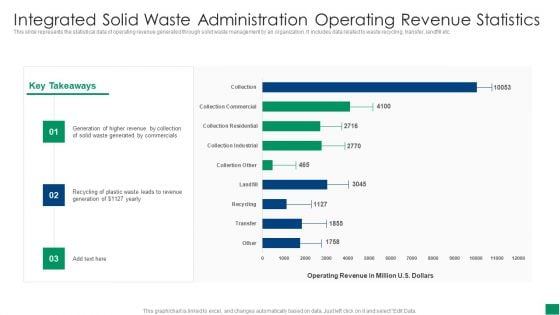
Integrated Solid Waste Administration Operating Revenue Statistics Formats PDF
This slide represents the statistical data of operating revenue generated through solid waste management by an organization. It includes data related to waste recycling, transfer, landfill etc. Pitch your topic with ease and precision using this Integrated Solid Waste Administration Operating Revenue Statistics Formats PDF. This layout presents information on Revenue, Recycling, Commercials. It is also available for immediate download and adjustment. So, changes can be made in the color, design, graphics or any other component to create a unique layout.
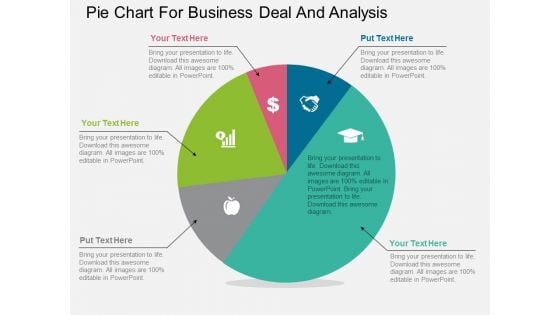
Pie Chart For Business Deal And Analysis Powerpoint Template
Our above PPT slide contains diagram of pentagon infographic. It helps to display steps of corporate marketing. Use this diagram to impart more clarity to data and to create more sound impact on viewers.
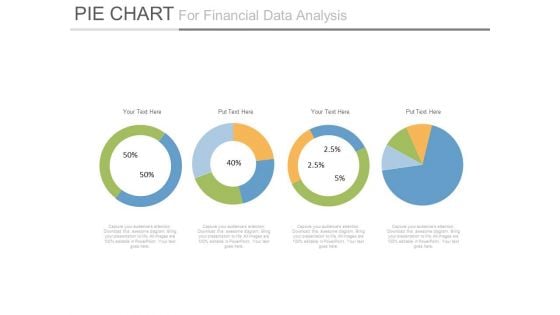
Pie Charts For Financial Ratio Analysis Powerpoint Slides
This PowerPoint template has been designed with diagram of pie charts. This PPT slide can be used to prepare presentations for profit growth report and also for financial data analysis. You can download finance PowerPoint template to prepare awesome presentations.

Previous Current And Future Hr Performance Assessment Techniques Brochure PDF
The following slide highlights criteria to assess HR performance based on previous, current and future activities. It constitutes of techniques such as big data, employee engagement etc. Presenting Previous Current And Future Hr Performance Assessment Techniques Brochure PDF to dispense important information. This template comprises three stages. It also presents valuable insights into the topics including Data Analysis, Information, Performance Assessment. This is a completely customizable PowerPoint theme that can be put to use immediately. So, download it and address the topic impactfully.

Business Diagram Four Staged Road Sign Diagram For Text Representation Presentation Template
Four staged road sign diagram has been used to design this power point template. This PPT contains the concept of text and data representation. Use this PPT and build quality presentation for your viewers.

Four Stage Puzzle Infographic Powerpoint Templates
Our above slide contains diagram of puzzles infographic. It helps to exhibit business management and strategies. Use this diagram to impart more clarity to data and to create more sound impact on viewers.
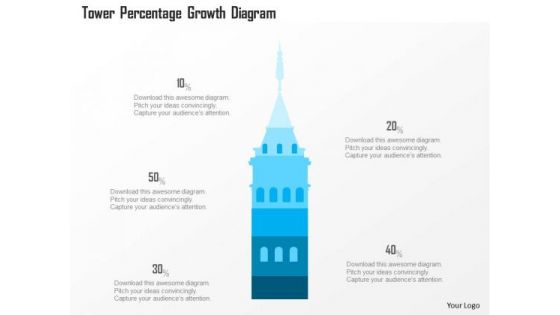
Business Diagram Tower Percentage Growth Diagram Presentation Template
This power point diagram slide has been crafted with graphic of 3d blue tower and text boxes. This PPT slide contains the concept of data and text representations. Use this PPT slide for your business and management related presentations.
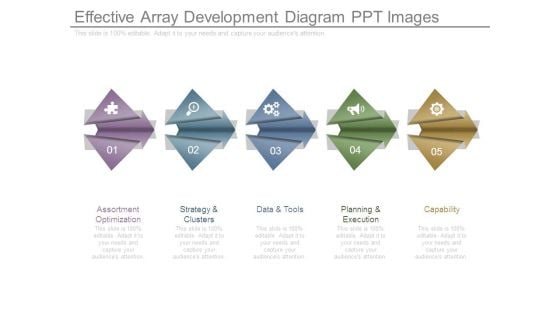
Effective Array Development Diagram Ppt Images
This is a effective array development diagram ppt images. This is a five stage process. The stages in this process are assortment optimization, strategy and clusters, data and tools, planning and execution, capability.
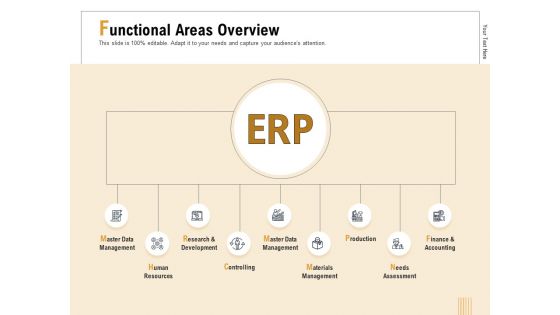
Business Activity Flows Optimization Functional Areas Overview Ppt PowerPoint Presentation Layouts Gallery PDF
Presenting this set of slides with name business activity flows optimization functional areas overview ppt powerpoint presentation layouts gallery pdf. This is a nine stage process. The stages in this process are master data management, human resources, research and development, controlling, master data management, materials management, production needs assessment, finance and accounting. This is a completely editable PowerPoint presentation and is available for immediate download. Download now and impress your audience.
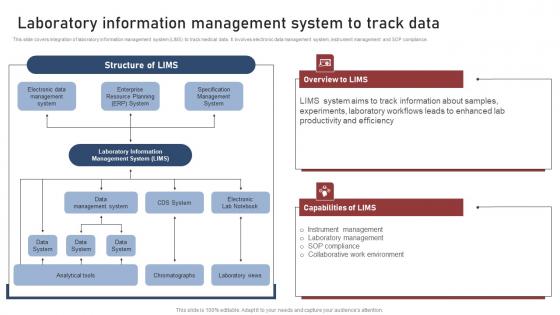
Laboratory Information Transforming Medical Workflows Via His Integration Mockup Pdf
This slide covers integration of laboratory information management system LIMS to track medical data. It involves electronic data management system, instrument management and SOP compliance. Retrieve professionally designed Laboratory Information Transforming Medical Workflows Via His Integration Mockup Pdf to effectively convey your message and captivate your listeners. Save time by selecting pre made slideshows that are appropriate for various topics, from business to educational purposes. These themes come in many different styles, from creative to corporate, and all of them are easily adjustable and can be edited quickly. Access them as PowerPoint templates or as Google Slides themes. You do not have to go on a hunt for the perfect presentation because Slidegeeks got you covered from everywhere. This slide covers integration of laboratory information management system LIMS to track medical data. It involves electronic data management system, instrument management and SOP compliance.

Comparative Assessment Of SOA And Microservices Architecture Professional PDF
This slide illustrates comparative analysis of Service Oriented Architecture and Microservices. It includes scope, component reuse, communication protocols, data access, etc. Presenting Comparative Assessment Of SOA And Microservices Architecture Professional PDF to dispense important information. This template comprises six stages. It also presents valuable insights into the topics including Scope, Component Reuse, Communication Protocols, Data Access. This is a completely customizable PowerPoint theme that can be put to use immediately. So, download it and address the topic impactfully.
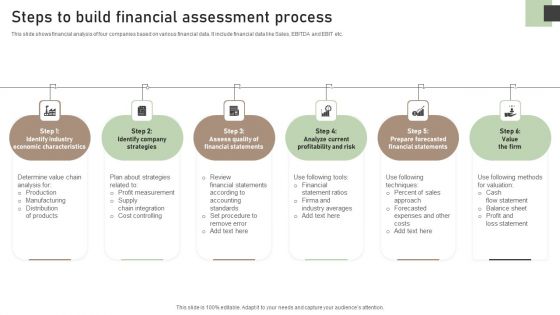
Steps To Build Financial Assessment Process Ideas PDF
This slide shows financial analysis of four companies based on various financial data. It include financial data like Sales, EBITDA and EBIT etc. Presenting Steps To Build Financial Assessment Process Ideas PDF to dispense important information. This template comprises six stages. It also presents valuable insights into the topics including Identify Industry Economic, Identify Company Strategies, Analyze Current Profitability. This is a completely customizable PowerPoint theme that can be put to use immediately. So, download it and address the topic impactfully.
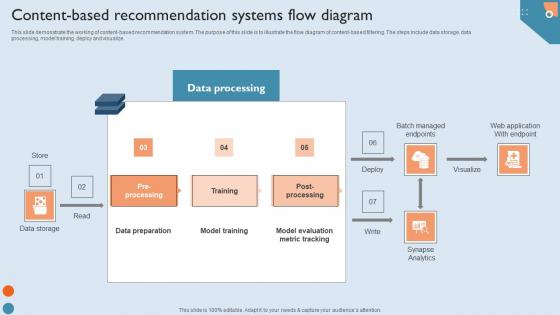
Recommendation Techniques Content Based Recommendation Systems Flow Diagram Demonstration PDF
This slide demonstrate the working of content-based recommendation system. The purpose of this slide is to illustrate the flow diagram of content-based filtering. The steps include data storage, data processing, model training, deploy and visualize. This Recommendation Techniques Content Based Recommendation Systems Flow Diagram Demonstration PDF is perfect for any presentation, be it in front of clients or colleagues. It is a versatile and stylish solution for organizing your meetings. The Recommendation Techniques Content Based Recommendation Systems Flow Diagram Demonstration PDF features a modern design for your presentation meetings. The adjustable and customizable slides provide unlimited possibilities for acing up your presentation. Slidegeeks has done all the homework before launching the product for you. So, do not wait, grab the presentation templates today This slide demonstrate the working of content-based recommendation system. The purpose of this slide is to illustrate the flow diagram of content-based filtering. The steps include data storage, data processing, model training, deploy and visualize.

Three Steps Business Strategy Chart Powerpoint Template
This PowerPoint slide contains three steps infographic hart. It helps to exhibit business strategy steps. Use this diagram to impart more clarity to data and to create more sound impact on viewers.
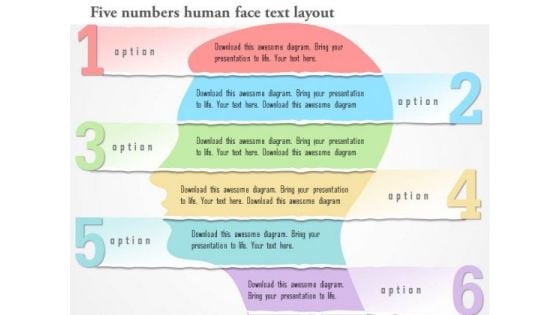
Business Diagram Six Numbers Human Face Text Layout Presentation Template
Graphic of six numeric tags and human face has been used to design this business diagram. Download our above diagram to express information in a visual way. Use this diagram and get good comments for data related presentations.
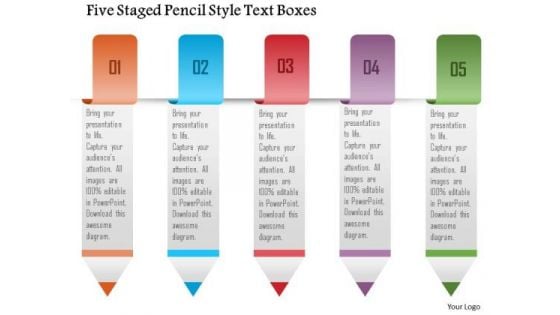
Business Diagram Five Staged Pencil Style Text Boxes Presentation Template
Our above slide displays five staged pencil style text boxes. Download our above diagram to express information in a visual way. Use this diagram and get good comments for data related presentations.
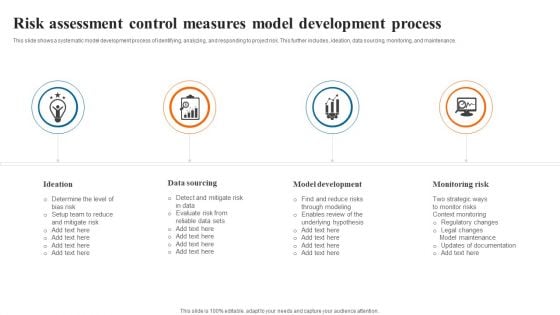
Risk Assessment Control Measures Model Development Process Structure PDF
This slide shows a systematic model development process of identifying, analyzing, and responding to project risk. This further includes, ideation, data sourcing, monitoring, and maintenance. Presenting Risk Assessment Control Measures Model Development Process Structure PDF to dispense important information. This template comprises four stages. It also presents valuable insights into the topics including Data Sourcing, Model Development, Monitoring Risk. This is a completely customizable PowerPoint theme that can be put to use immediately. So, download it and address the topic impactfully.
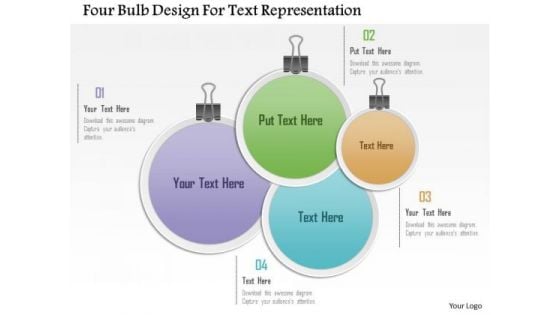
Busines Diagram Four Bulb Design For Text Representation Presentation Template
Four bulb design text diagram has been used to design this business slide. Use this diagram to display data in visual manner. This slide offers an excellent background to build professional presentations.
Business Diagram Highway Signboard With Road And Text Boxes PowerPoint Template
Graphic of highway signboard with road and text has been used to craft this power point template diagram. This PPT contains the concept of transportation and data representation. Use this PPT for your business and management related presentations.
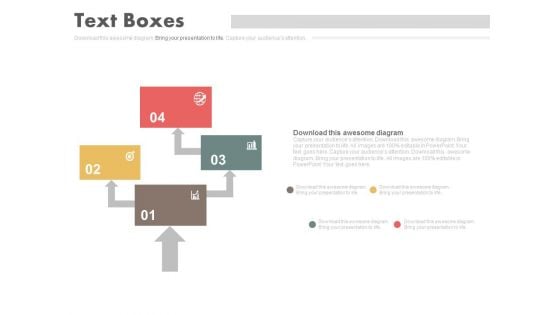
Four Steps Arrow Chart Design Powerpoint Slides
This PowerPoint template has been designed with four steps arrow chart. This PPT slide can be used to prepare presentations for marketing reports and also for financial data analysis. You can download finance PowerPoint template to prepare awesome presentations.
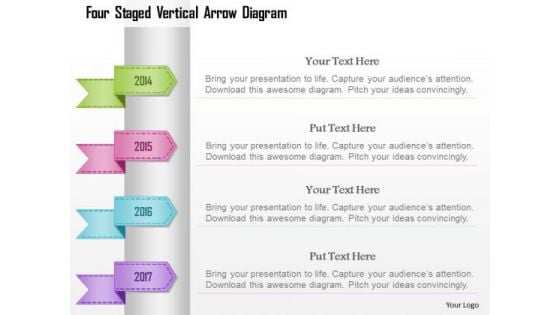
Busines Diagram Four Staged Vertical Arrow Diagram Presentation Template
Four staged vertical arrow diagram has been used to design this business diagram. This business diagram contains the concept of data representation. This pre designed high quality image slide will make your presentations simply the best.
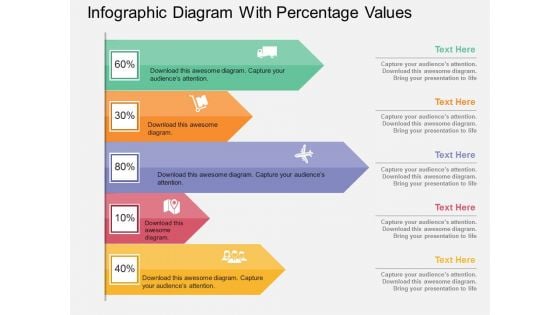
Infographic Diagram With Percentage Values Powerpoint Template
Visually support your presentation with our above template containing infographic diagram with percentage values. This diagram is excellent visual tools for explaining huge amounts of information where complex data needs to be explained immediately and clearly.
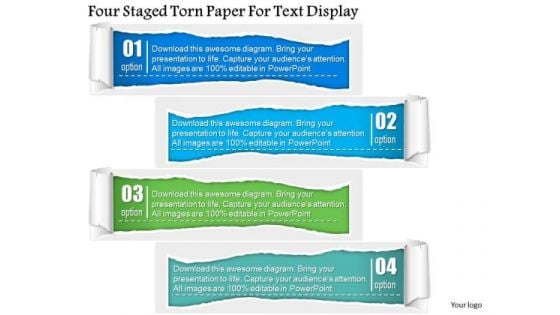
Business Diagram Four Staged Torn Paper For Text Display PowerPoint Template
Four staged torn paper style text boxes has been used to design this power point template. This PPT contains the concept of text representation for business process. Use this PPT and build quality presentation for data and process related topics.
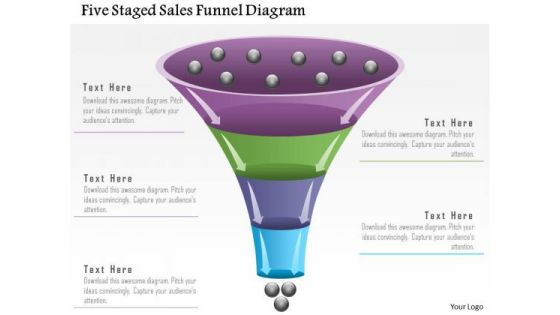
Business Diagram Five Staged Sales Funnel Diagram Presentation Template
Our above slide displays five staged sales funnel diagram. Download our above diagram to express information in a visual way. Use this diagram and get good comments for data related presentations.
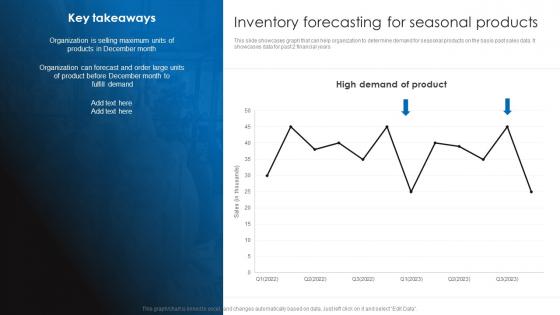
Inventory Forecasting For Seasonal Products Retail Stock Administration Strategies Template Pdf
This slide showcases graph that can help organization to determine demand for seasonal products on the basis past sales data. It showcases data for past 2 financial years.Slidegeeks has constructed Inventory Forecasting For Seasonal Products Retail Stock Administration Strategies Template Pdf after conducting extensive research and examination. These presentation templates are constantly being generated and modified based on user preferences and critiques from editors. Here, you will find the most attractive templates for a range of purposes while taking into account ratings and remarks from users regarding the content. This is an excellent jumping-off point to explore our content and will give new users an insight into our top-notch PowerPoint Templates. This slide showcases graph that can help organization to determine demand for seasonal products on the basis past sales data. It showcases data for past 2 financial years.
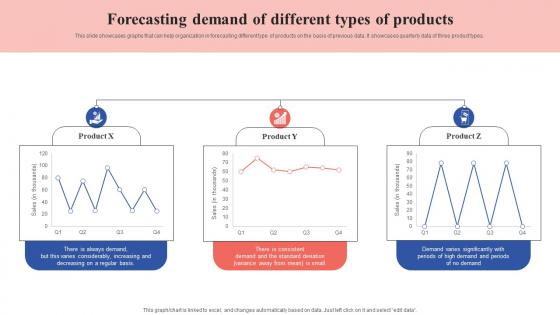
Forecasting Demand Of Different Types Of Products Tactical Guide Stock Administration Microsoft Pdf
This slide showcases graphs that can help organization in forecasting different type of products on the basis of previous data. It showcases quarterly data of three product types. If your project calls for a presentation, then Slidegeeks is your go-to partner because we have professionally designed, easy-to-edit templates that are perfect for any presentation. After downloading, you can easily edit Forecasting Demand Of Different Types Of Products Tactical Guide Stock Administration Microsoft Pdf and make the changes accordingly. You can rearrange slides or fill them with different images. Check out all the handy templates This slide showcases graphs that can help organization in forecasting different type of products on the basis of previous data. It showcases quarterly data of three product types.
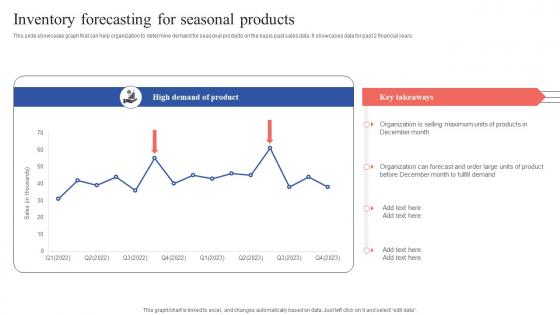
Inventory Forecasting For Seasonal Products Tactical Guide Stock Administration Formats Pdf
This slide showcases graph that can help organization to determine demand for seasonal products on the basis past sales data. It showcases data for past 2 financial years. Make sure to capture your audiences attention in your business displays with our gratis customizable Inventory Forecasting For Seasonal Products Tactical Guide Stock Administration Formats Pdf. These are great for business strategies, office conferences, capital raising or task suggestions. If you desire to acquire more customers for your tech business and ensure they stay satisfied, create your own sales presentation with these plain slides. This slide showcases graph that can help organization to determine demand for seasonal products on the basis past sales data. It showcases data for past 2 financial years.
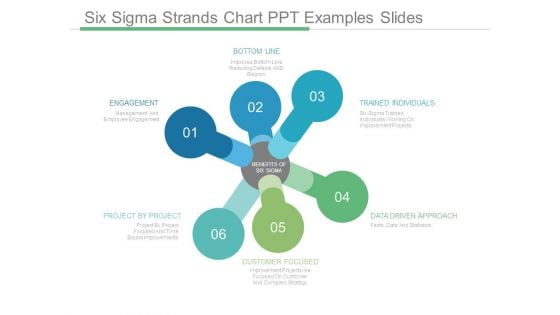
Six Sigma Strands Chart Ppt Examples Slides
This is a six sigma strands chart ppt examples slides. This is a six stage process. The stages in this process are bottom line, trained individuals, data driven approach, customer focused, project by project, engagement, benefits of six sigma.
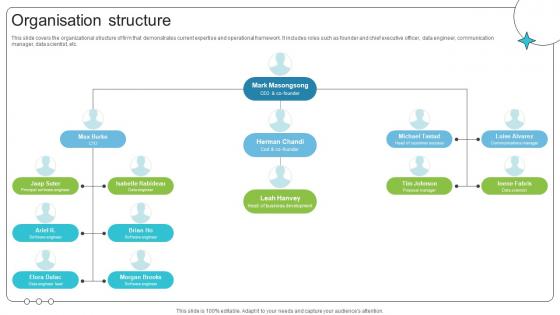
Organisation Structure Investor Oriented Urbanlogiq Fundraising Deck
This slide covers the organizational structure of firm that demonstrates current expertise and operational framework. It includes roles such as founder and chief executive officer, data engineer, communication manager, data scientist, etc. Crafting an eye-catching presentation has never been more straightforward. Let your presentation shine with this tasteful yet straightforward Organisation Structure Investor Oriented Urbanlogiq Fundraising Deck template. It offers a minimalistic and classy look that is great for making a statement. The colors have been employed intelligently to add a bit of playfulness while still remaining professional. Construct the ideal Organisation Structure Investor Oriented Urbanlogiq Fundraising Deck that effortlessly grabs the attention of your audience Begin now and be certain to wow your customers This slide covers the organizational structure of firm that demonstrates current expertise and operational framework. It includes roles such as founder and chief executive officer, data engineer, communication manager, data scientist, etc.
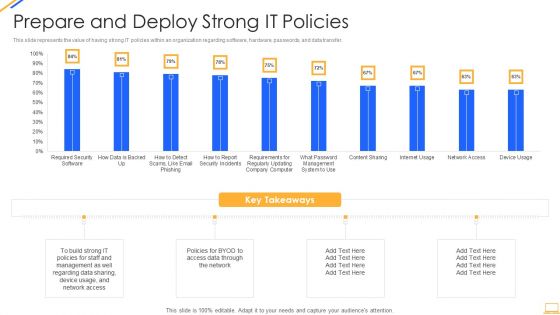
Desktop Security Management Prepare And Deploy Strong It Policies Template PDF
This slide represents the value of having strong IT policies within an organization regarding software, hardware, passwords, and data transfer. Deliver and pitch your topic in the best possible manner with this desktop security management prepare and deploy strong it policies template pdf. Use them to share invaluable insights on management, data, network and impress your audience. This template can be altered and modified as per your expectations. So, grab it now.
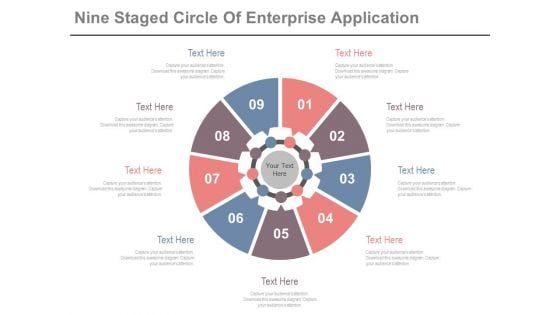
Circle Diagram For Business Marketing Mix Powerpoint Slides
This PowerPoint template has been designed with nine steps circle chart. This PPT slide can be used to prepare presentations for profit growth report and also for financial data analysis. You can download finance PowerPoint template to prepare awesome presentations.
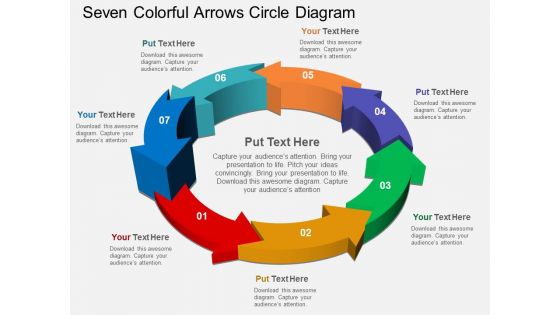
Seven Colorful Arrows Circle Diagram Powerpoint Templates
Our above PPT slide contains arrows infographic. It helps to display outline of business plan. Use this diagram to impart more clarity to data and to create more sound impact on viewers.
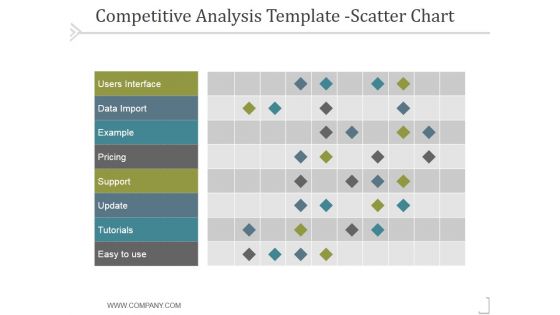
Competitive Analysis Scatter Chart Template 2 Ppt PowerPoint Presentation Files
This is a competitive analysis scatter chart template 2 ppt powerpoint presentation files. This is a nine stage process. The stages in this process are users interface, data import, example, pricing, support, update.
Online Promotion Playbook Google Analytics For All Web Tracking Summary PDF
This template covers tools to measure marketing analytics such as google analytics for all web tracking, google data studio to build real time reporting dashboards and google data studio reports. Deliver and pitch your topic in the best possible manner with this online promotion playbook google analytics for all web tracking summary pdf. Use them to share invaluable insights on demographics, devices, social networks and impress your audience. This template can be altered and modified as per your expectations. So, grab it now.
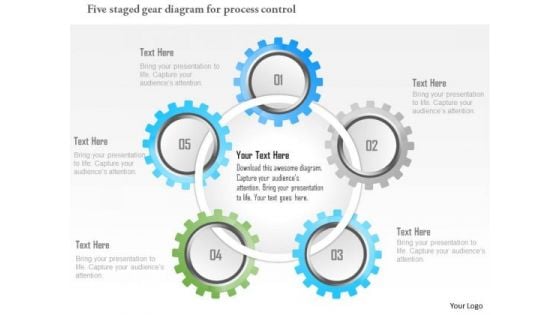
Business Diagram Five Staged Gear Diagram For Process Control Presentation Template
Our above slide displays five staged gear diagram for process control. Download our above diagram to express information in a visual way. Use this diagram and get good comments for data related presentations.
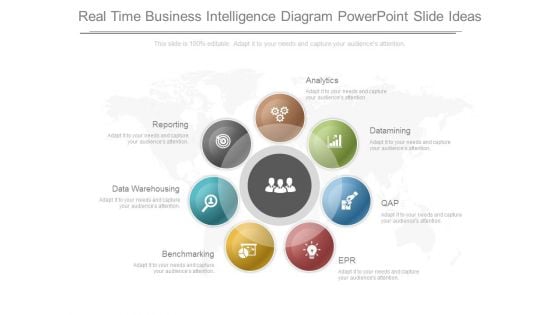
Real Time Business Intelligence Diagram Powerpoint Slide Ideas
This is a real time business intelligence diagram powerpoint slide ideas. This is a seven stage process. The stages in this process are data warehousing, reporting, analytics, datamining, qap, epr, benchmarking.
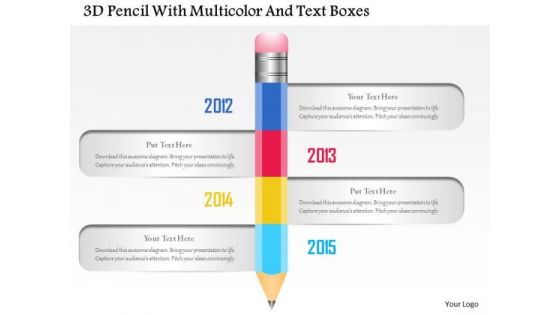
Busines Diagram 3d Pencil With Multicolor And Text Boxes Presentation Template
This business diagram displays four text boxes around a pencil. This professional slide can be used for data display in visual manner. Download this diagram for your school and education related presentations.
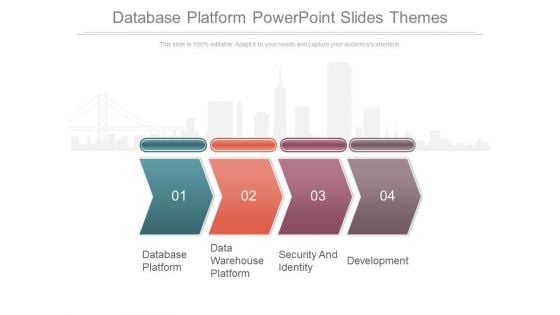
Database Platform Powerpoint Slides Themes
This is a database platform powerpoint slides themes. This is a four stage process. The stages in this process are database platform, data warehouse platform, security and identity, development.
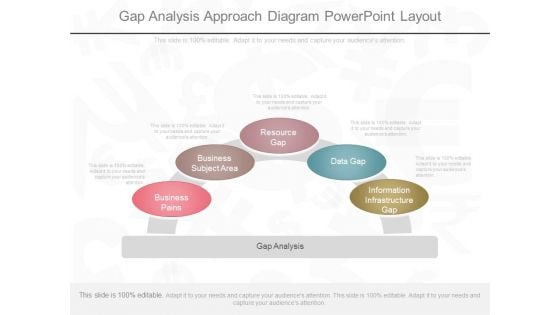
Gap Analysis Approach Diagram Powerpoint Layout
This is a gap analysis approach diagram powerpoint layout. This is a five stage process. The stages in this process are information infrastructure gap, data gap, resource gap, business subject area, business pains.
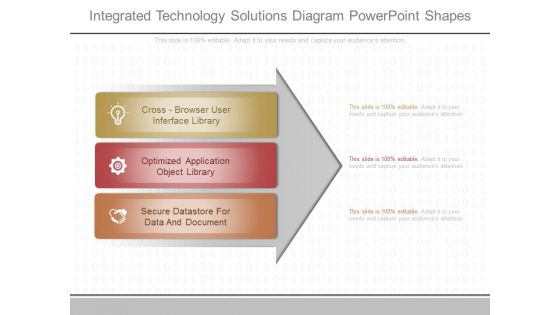
Integrated Technology Solutions Diagram Powerpoint Shapes
This is a integrated technology solutions diagram powerpoint shapes. This is a three stage process. The stages in this process are cross browser user interface library, optimized application object library, secure datastore for data and document.
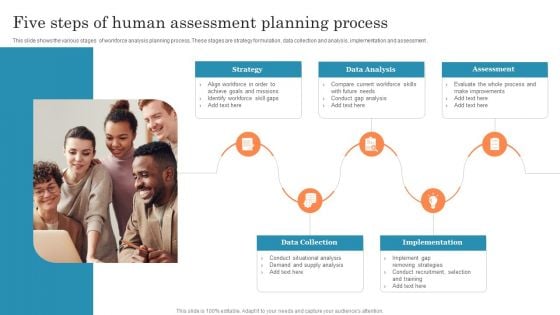
Five Steps Of Human Assessment Planning Process Ppt PowerPoint Presentation Outline Model PDF
This slide shows the various stages of workforce analysis planning process. These stages are strategy formulation, data collection and analysis, implementation and assessment . Presenting Five Steps Of Human Assessment Planning Process Ppt PowerPoint Presentation Outline Model PDF to dispense important information. This template comprises five stages. It also presents valuable insights into the topics including Goals Missions, Data Collection, Implementation. This is a completely customizable PowerPoint theme that can be put to use immediately. So, download it and address the topic impactfully.

 Home
Home