Data Governance Icon
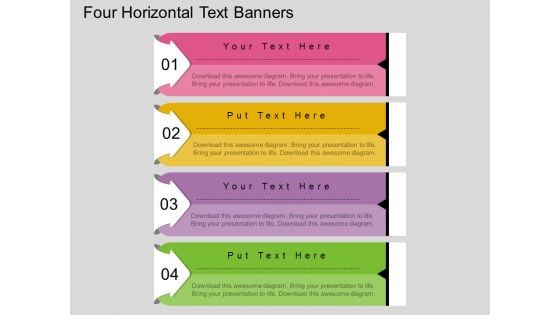
Four Horizontal Text Banners Powerpoint Template
This PowerPoint template has been designed with four horizontal text banners. This diagram is excellent visual tools for business presentations. Download this PPT slide to explain complex data immediately and clearly.
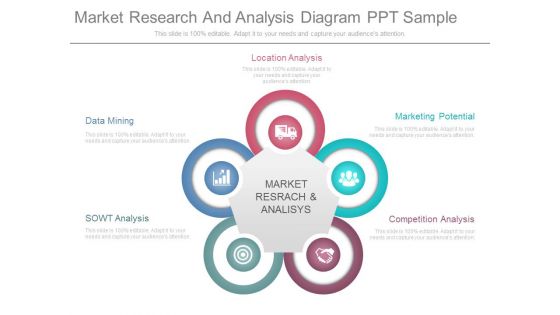
Market Research And Analysis Diagram Ppt Sample
This is a market research and analysis diagram ppt sample. This is a five stage process. The stages in this process are location analysis, data mining, sowt analysis, market research and analysis, competition analysis, marketing potential.
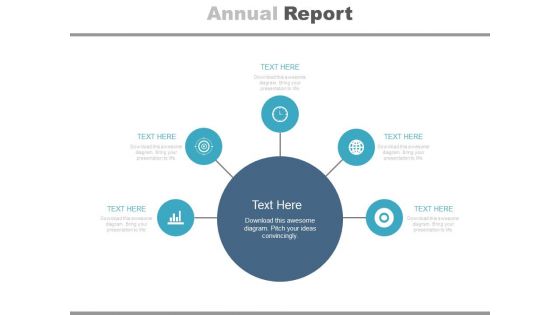
Diagram For Market Research Analysis Powerpoint Slides
This PowerPoint template has been designed with circular infographic diagram. It can be used to display steps for market research and also for financial data analysis. You can download finance PowerPoint template to prepare awesome presentations.
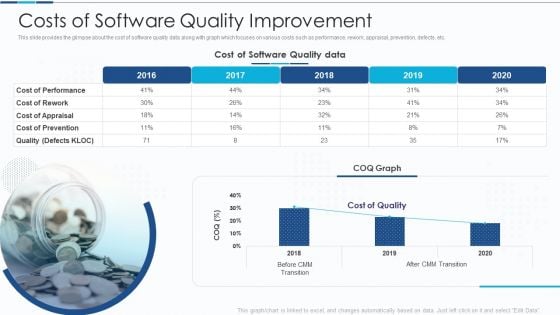
Introduction To IT Project Development Costs Of Software Quality Improvement Information PDF
This slide provides the glimpse about the cost of software quality data along with graph which focuses on various costs such as performance, rework, appraisal, prevention, defects, etc. Deliver an awe inspiring pitch with this creative introduction to it project development costs of software quality improvement information pdf bundle. Topics like cost of software, quality data, cost of performance can be discussed with this completely editable template. It is available for immediate download depending on the needs and requirements of the user.
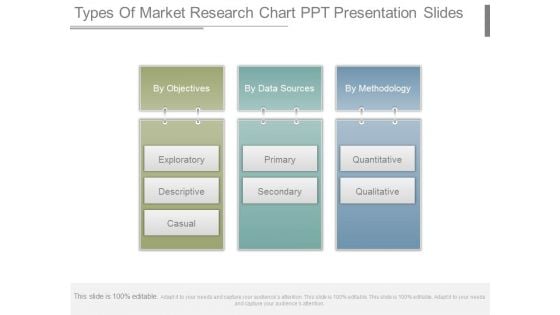
Types Of Market Research Chart Ppt Presentation Slides
This is a types of market research chart ppt presentation slides. This is a three stage process. The stages in this process are by objectives, exploratory, descriptive, causal, by data sources, primary, secondary, by methodology, quantitative, qualitative.
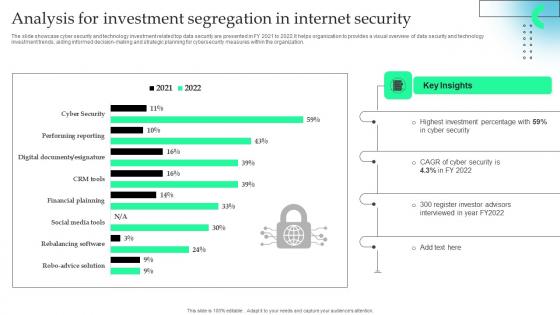
Analysis For Investment Segregation In Internet Security Formats Pdf
The slide showcase cyber security and technology investment related top data security are presented in FY 2021 to 2022.It helps organization to provides a visual overview of data security and technology investment trends, aiding informed decision making and strategic planning for cybersecurity measures within the organization.Pitch your topic with ease and precision using this Analysis For Investment Segregation In Internet Security Formats Pdf This layout presents information on Highest Investment, Register Investor Advisors, Key Insights It is also available for immediate download and adjustment. So, changes can be made in the color, design, graphics or any other component to create a unique layout. The slide showcase cyber security and technology investment related top data security are presented in FY 2021 to 2022.It helps organization to provides a visual overview of data security and technology investment trends, aiding informed decision making and strategic planning for cybersecurity measures within the organization.

Business Diagram Blue Cloud With Database Server And Laptop PowerPoint Template
Graphic of blue cloud and server has been used to craft this power point template. This PPT contains the concept of database management. Use this PPT diagram for your data and database related topics in any technical presentations.
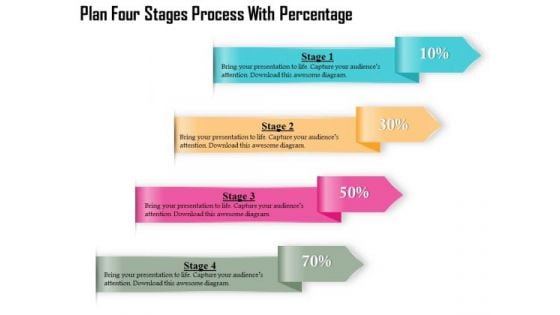
Business Diagram Four Stages Process With Percentage Presentation Template
Four multicolored tags in vertical order has been used to decorate this business diagram. This diagram contains the concept of financial data display with percent values. This diagram can be used for management and finance related presentations.

Business Diagram Three Stages Process Percentage Presentation Template
Three multicolored tags in vertical order has been used to decorate this business diagram. This diagram contains the concept of financial data display with percent values. This diagram can be used for management and finance related presentations.
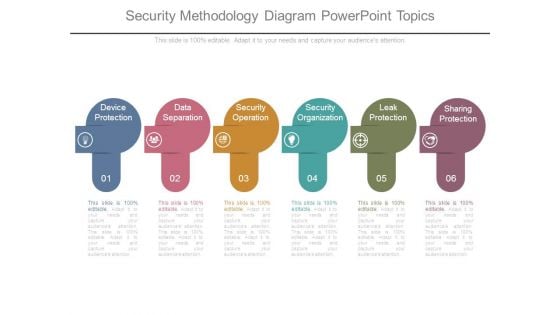
Security Methodology Diagram Powerpoint Topics
This is a security methodology diagram powerpoint topics. This is a six stage process. The stages in this process are device protection, data separation, security operation, security organization, leak protection, sharing protection.
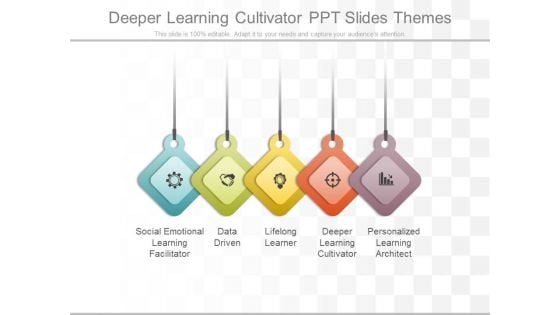
Deeper Learning Cultivator Ppt Slides Themes
This is a deeper learning cultivator ppt slides themes. This is a five stage process. The stages in this process are social emotional learning facilitator, data driven, lifelong learner, deeper learning cultivator, personalized learning architect.
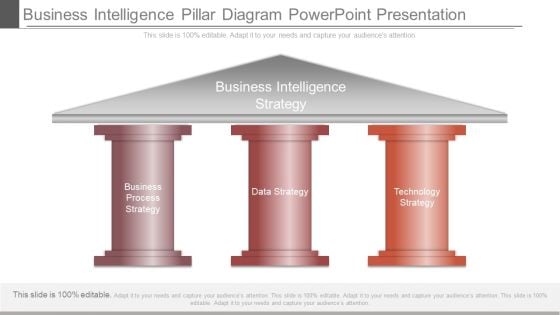
Business Intelligence Pillar Diagram Powerpoint Presentation
This is a business intelligence pillar diagram powerpoint presentation. This is a three stage process. The stages in this process are business intelligence strategy, business process strategy, data strategy, technology strategy.
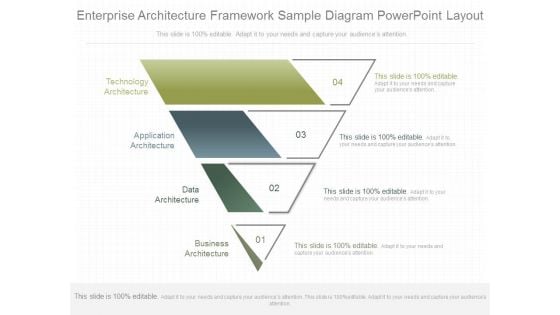
Enterprise Architecture Framework Sample Diagram Powerpoint Layout
This is a enterprise architecture framework sample diagram powerpoint layout. This is a four stage process. The stages in this process are technology architecture, application architecture, data architecture, business architecture.
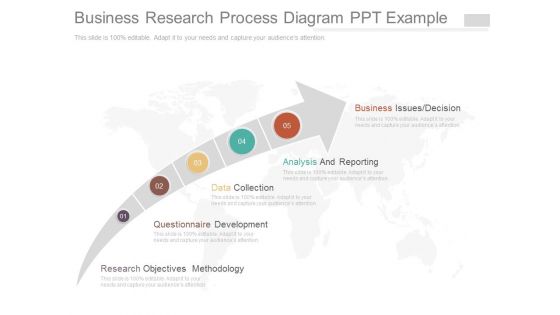
Business Research Process Diagram Ppt Example
This is a business research process diagram ppt example. This is a five stage process. The stages in this process are business issues decision, analysis and reporting, data collection, questionnaire development, research objectives methodology.
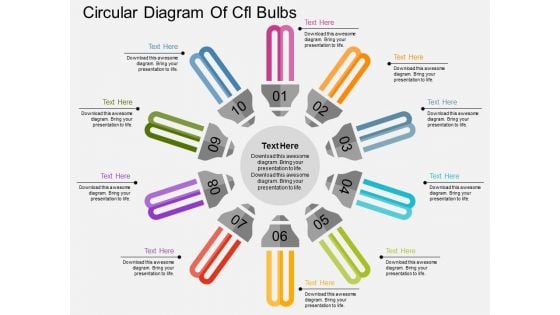
Circular Diagram Of Cfl Bulbs Powerpoint Templates
This PowerPoint template has been designed with circular diagram of CFL bulbs. It helps to exhibit business strategies and ideas. Use this diagram to impart more clarity to data and to create more sound impact on viewers.
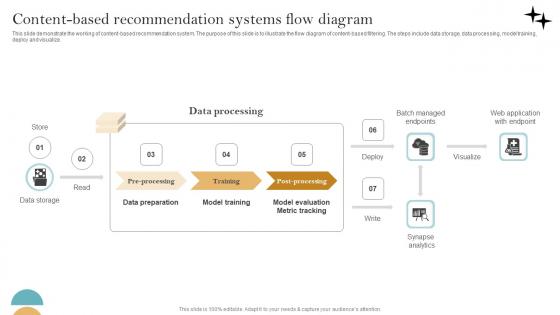
Recommender System Implementation Content Based Recommendation Systems Elements Pdf
This slide demonstrate the working of content-based recommendation system. The purpose of this slide is to illustrate the flow diagram of content-based filtering. The steps include data storage, data processing, model training, deploy and visualize. This modern and well-arranged Recommender System Implementation Content Based Recommendation Systems Elements Pdf provides lots of creative possibilities. It is very simple to customize and edit with the Powerpoint Software. Just drag and drop your pictures into the shapes. All facets of this template can be edited with Powerpoint no extra software is necessary. Add your own material, put your images in the places assigned for them, adjust the colors, and then you can show your slides to the world, with an animated slide included. This slide demonstrate the working of content-based recommendation system. The purpose of this slide is to illustrate the flow diagram of content-based filtering. The steps include data storage, data processing, model training, deploy and visualize.
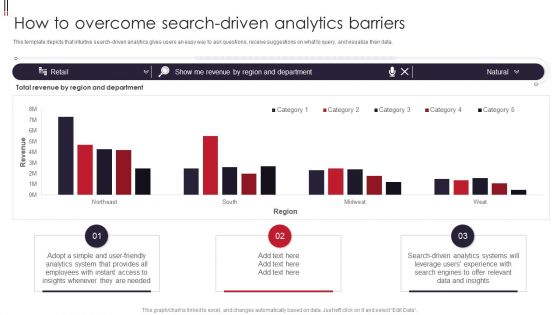
Information Visualizations Playbook How To Overcome Search Driven Analytics Barriers Guidelines PDF
This template depicts that intuitive search-driven analytics gives users an easy way to ask questions, receive suggestions on what to query, and visualize their data. Deliver an awe inspiring pitch with this creative Information Visualizations Playbook How To Overcome Search Driven Analytics Barriers Guidelines PDF bundle. Topics like Analytics System, Data And Insights, Search Driven Analytics can be discussed with this completely editable template. It is available for immediate download depending on the needs and requirements of the user.
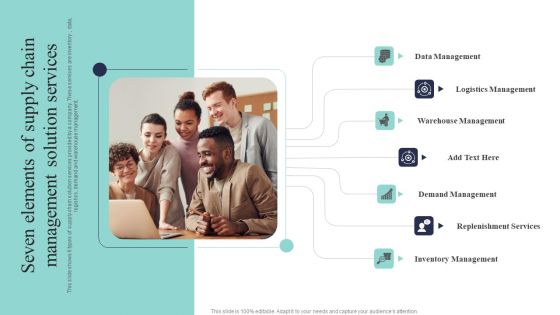
Seven Elements Of Supply Chain Management Solution Services Clipart PDF
This slide shows 6 types of supply chain solution services provided by a company. These services are inventory , data, logistics, demand and warehouse management. Presenting Seven Elements Of Supply Chain Management Solution Services Clipart PDF to dispense important information. This template comprises seven stages. It also presents valuable insights into the topics including Data Management, Logistics Management, Warehouse Management. This is a completely customizable PowerPoint theme that can be put to use immediately. So, download it and address the topic impactfully.
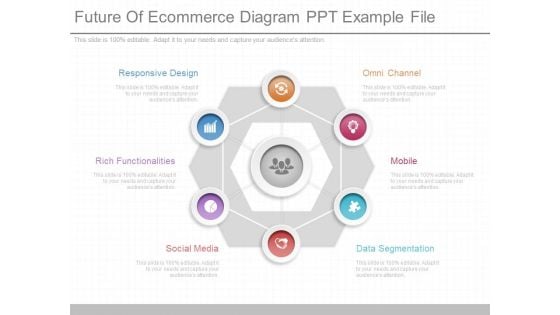
Future Of Ecommerce Diagram Ppt Example File
This is a future of ecommerce diagram ppt example file. This is a six stage process. The stages in this process are responsive design, rich functionalities, social media, omni channel, mobile, data segmentation.
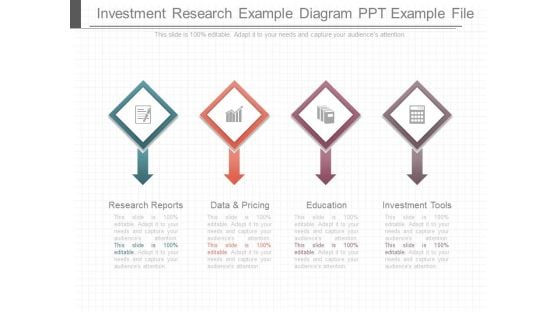
Investment Research Example Diagram Ppt Example File
This is a investment research example diagram ppt example file. This is a four stage process. The stages in this process are research reports, data and pricing, education, investment tools.
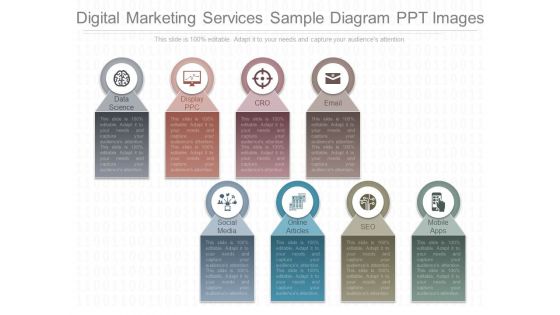
Digital Marketing Services Sample Diagram Ppt Images
This is a digital marketing services sample diagram ppt images. This is a eight stage process. The stages in this process are data science, display ppc, cro, email, social media, online articles, seo, mobile apps.
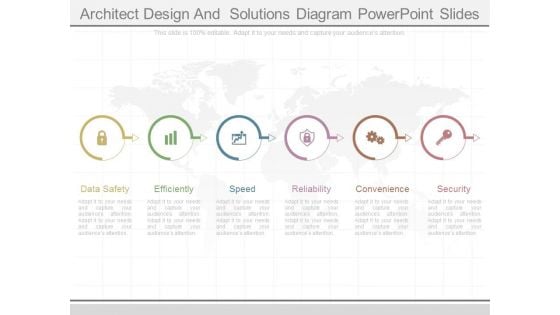
Architect Design And Solutions Diagram Powerpoint Slides
This is a architect design and solutions diagram powerpoint slides. This is a six stage process. The stages in this process are data safety, efficiently, speed, reliability, convenience, security.
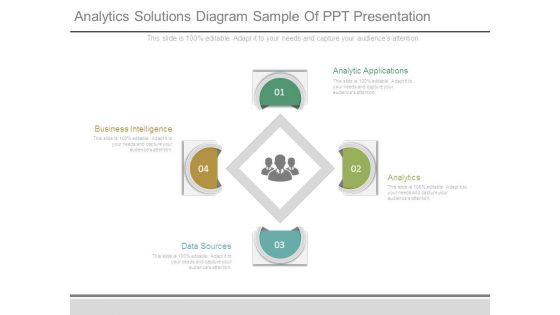
Analytics Solutions Diagram Sample Of Ppt Presentation
This is a analytics solutions diagram sample of ppt presentation. This is a four stage process. The stages in this process are analytic applications, analytics, data sources, business intelligence.
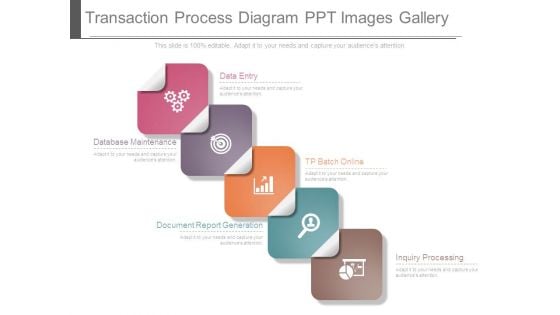
Transaction Process Diagram Ppt Images Gallery
This is a transaction process diagram ppt images gallery. This is a five stage process. The stages in this process are data entry, tp batch online, database maintenance, document report generation, inquiry processing.
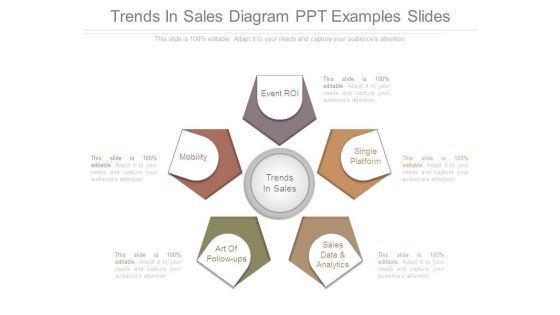
Trends In Sales Diagram Ppt Examples Slides
This is a trends in sales diagram ppt examples slides. This is a five stage process. The stages in this process are event roi, single platform, sales data and analytics, art of follow ups, mobility, trends in sales.
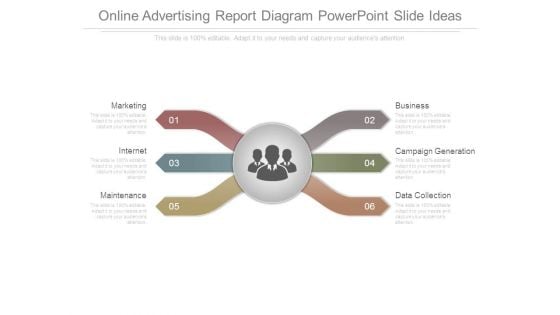
Online Advertising Report Diagram Powerpoint Slide Ideas
This is a online advertising report diagram powerpoint slide ideas. This is a six stage process. The stages in this process are marketing, internet, maintenance, business, campaign generation, data collection.

Customized Analytical Support Diagram Powerpoint Presentation Examples
This is a customized analytical support diagram powerpoint presentation examples. This is a four stage process. The stages in this process are scope and define the problem, data gathering and investigation, develop options, recommendation report.
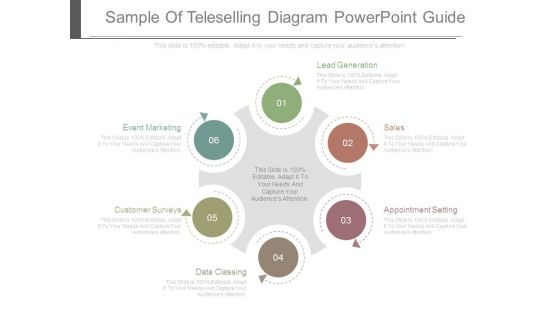
Sample Of Teleselling Diagram Powerpoint Guide
This is a sample of teleselling diagram powerpoint guide. This is a six stage process. The stages in this process are lead generation, sales, appointment setting, data classing, customer surveys, event marketing.
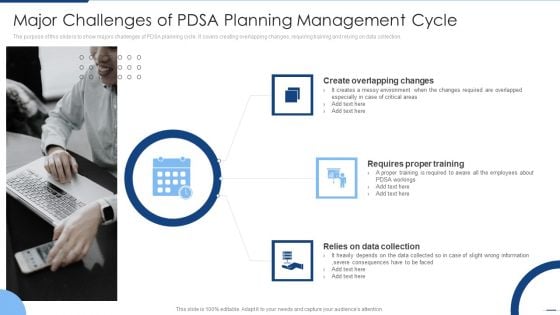
Major Challenges Of PDSA Planning Management Cycle Background PDF
The purpose of this slide is to show majors challenges of PDSA planning cycle. It covers creating overlapping changes, requiring training and relying on data collection.Presenting Major Challenges Of PDSA Planning Management Cycle Background PDF to dispense important information. This template comprises three stages. It also presents valuable insights into the topics including Overlapping Changes, Requires Proper, Data Collection. This is a completely customizable PowerPoint theme that can be put to use immediately. So, download it and address the topic impactfully.
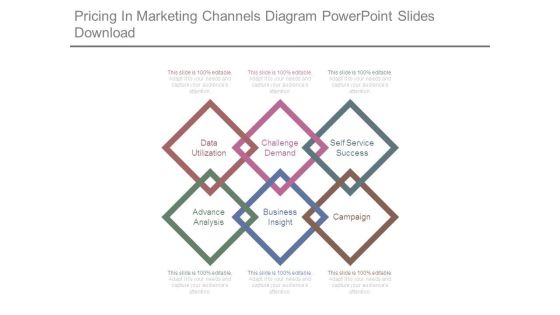
Pricing In Marketing Channels Diagram Powerpoint Slides Download
This is a pricing in marketing channels diagram powerpoint slides download. This is a six stage process. The stages in this process are data utilization, challenge demand, self service success, advance analysis, business insight, campaign.
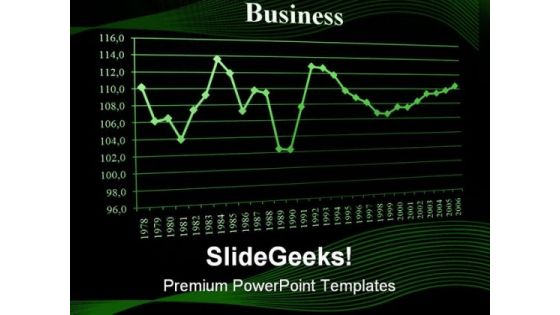
Graph03 Business PowerPoint Templates And PowerPoint Backgrounds 0411
Microsoft PowerPoint Template and Background with business chart and data from stock market showing success Manage expectations with our Graph03 Business PowerPoint Templates And PowerPoint Backgrounds 0411. You will be at the top of your game.
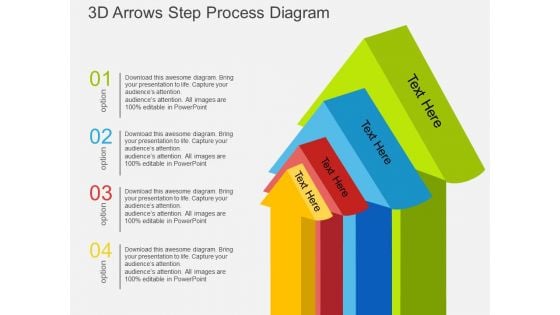
3D Arrows Step Process Diagram Powerpoint Template
Our above slide contains graphics of arrows step process diagram. It helps to display innovative ideas. Use this diagram to impart more clarity to data and to create more sound impact on viewers.
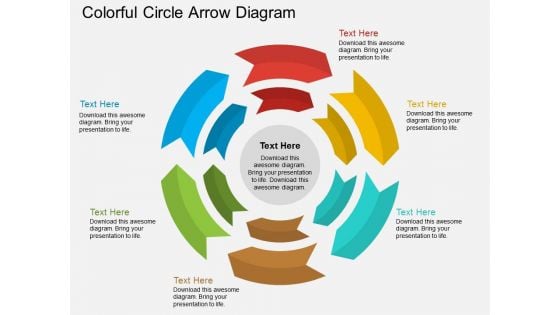
Colorful Circle Arrow Diagram Powerpoint Template
Our above PPT slide contains circular arrow design. This business diagram helps to exhibit process flow. Use this diagram to impart more clarity to data and to create more sound impact on viewers.
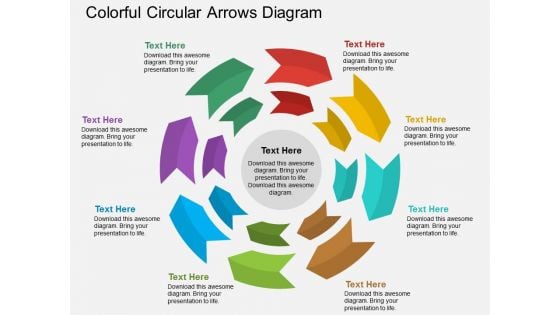
Colorful Circular Arrows Diagram Powerpoint Template
Our above PPT slide contains circular arrow design. This business diagram helps to exhibit process flow. Use this diagram to impart more clarity to data and to create more sound impact on viewers.
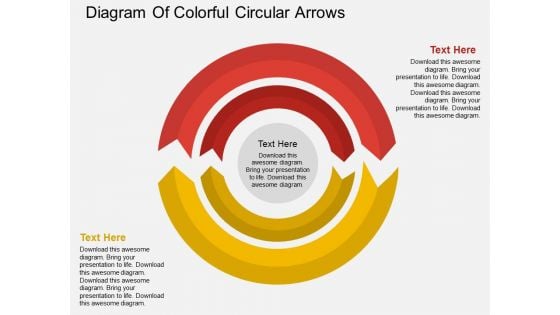
Diagram Of Colorful Circular Arrows Powerpoint Template
Our above PPT slide contains circular arrow design. This business diagram helps to exhibit process flow. Use this diagram to impart more clarity to data and to create more sound impact on viewers.
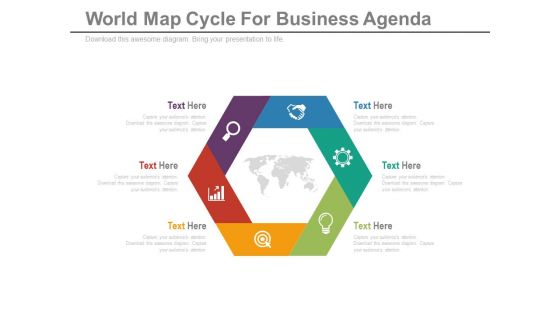
Diagram For Global Business Strategy Powerpoint Template
Our above slide contains hexagonal infographic diagram. This PowerPoint template helps to display global business strategy. Use this diagram to impart more clarity to data and to create more sound impact on viewers.
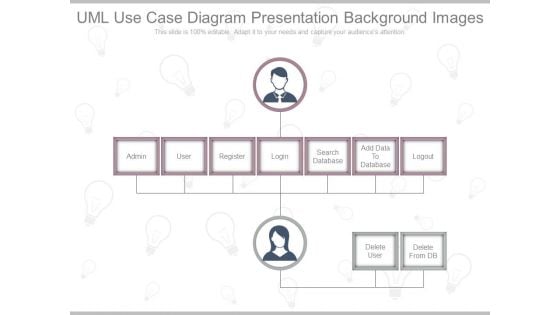
Uml Use Case Diagram Presentation Background Images
This is a uml use case diagram presentation background images. This is a seven stage process. The stages in this process are admin, user, register, login, search database, add data to database, logout.
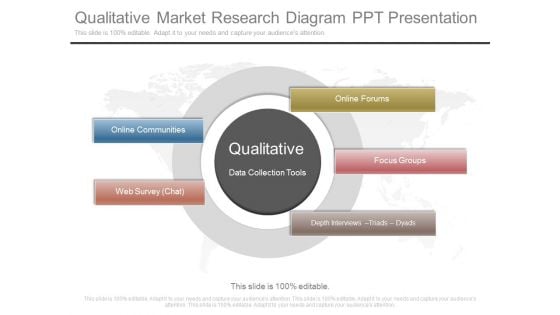
Qualitative Market Research Diagram Ppt Presentation
This is a qualitative market research diagram ppt presentation. This is a five stage process. The stages in this process are qualitative, data collection tools, online communities, web survey chat, online forums, focus groups, depth interviews triads dyads.
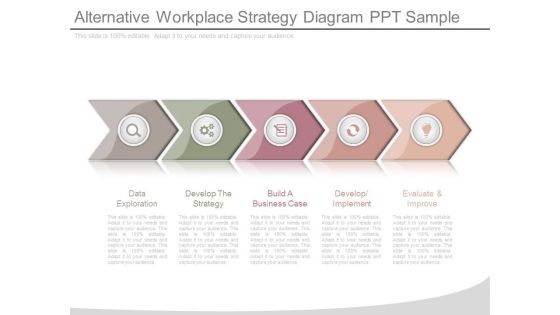
Alternative Workplace Strategy Diagram Ppt Sample
This is a alternative workplace strategy diagram ppt sample. This is a five stage process. The stages in this process are data exploration, develop the strategy, build a business case, develop implement, evaluate and improve.
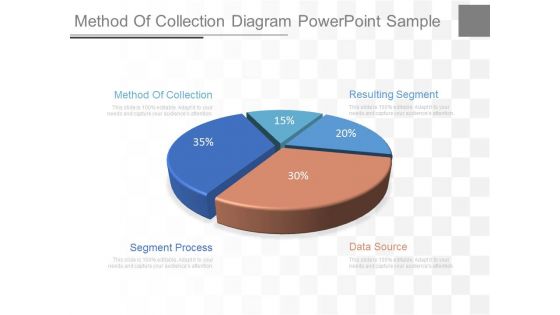
Method Of Collection Diagram Powerpoint Sample
This is a method of collection diagram powerpoint sample. This is a five stage process. The stages in this process are method of collection, segment process, data source, resulting segment.
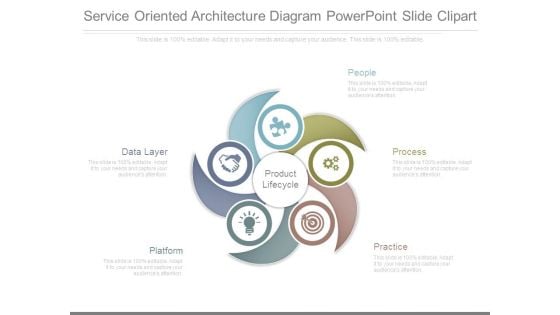
Service Oriented Architecture Diagram Powerpoint Slide Clipart
This is a service oriented architecture diagram powerpoint slide clipart. This is a five stage process. The stages in this process are product lifecycle, data layer, platform, people, process, practice.
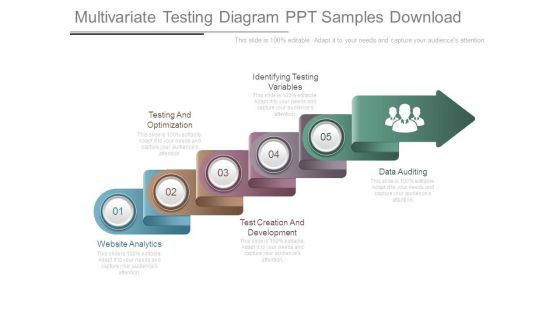
Multivariate Testing Diagram Ppt Samples Download
This is a multivariate testing diagram ppt samples download. This is a five stage process. The stages in this process are website analytics, testing and optimization, test creation and development, identifying testing variables, data auditing.
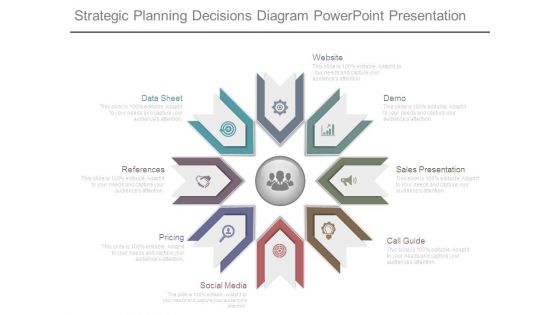
Strategic Planning Decisions Diagram Powerpoint Presentation
This is a strategic planning decisions diagram powerpoint presentation. This is a eight stage process. The stages in this process are data sheet, references, pricing, social media, call guide, sales presentation, demo, website.
Marketing And Sales Tools Diagram Sample Ppt Files
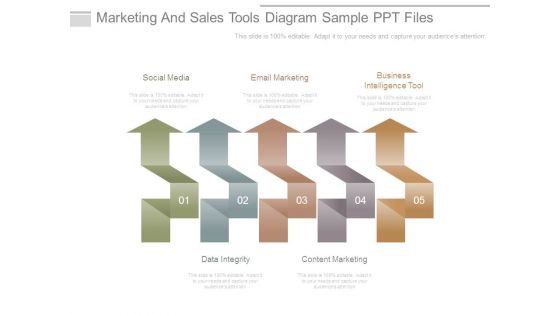
This is a marketing and sales tools diagram sample ppt files. This is a five stage process. The stages in this process are social media, email marketing, business intelligence tool, data integrity, content marketing.
Cycle Of Cross Media Overview Diagram Ppt Slides
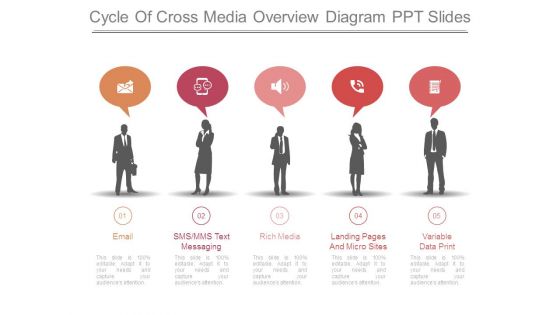
This is a cycle of cross media overview diagram ppt slides. This is a five stage process. The stages in this process are email, sms, mms text messaging, rich media, landing pages and micro sites, variable data print.
Board With Bar Graph For Financial Analysis Powerpoint Slides
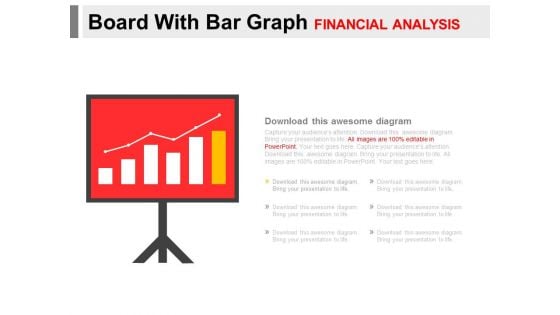
You can download this PowerPoint template to display statistical data and analysis. This PPT slide contains display board with bar graph. Draw an innovative business idea using this professional diagram.
Abc Steps For Corporate Entrepreneurship Powerpoint Template
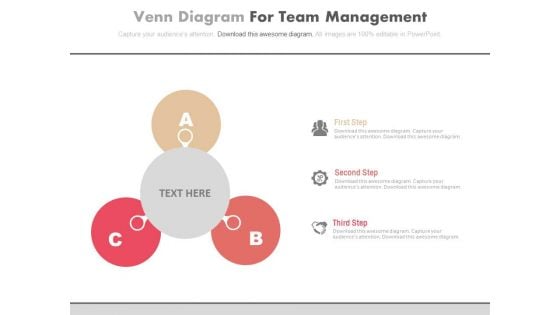
Our above PPT slide contains graphics of ABC steps chart. This business diagram helps to depict concept of corporate entrepreneurship. Use this diagram to impart more clarity to data and to create more sound impact on viewers.
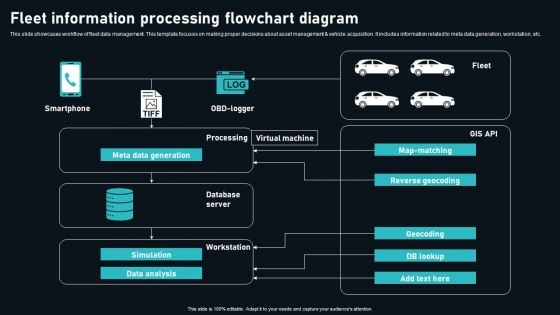
Fleet Information Processing Flowchart Diagram Themes PDF
This slide showcases workflow of fleet data management. This template focuses on making proper decisions about asset management and vehicle acquisition. It includes information related to meta data generation, workstation, etc. Showcasing this set of slides titled Fleet Information Processing Flowchart Diagram Themes PDF. The topics addressed in these templates are Smartphone, Processing, Virtual Machine. All the content presented in this PPT design is completely editable. Download it and make adjustments in color, background, font etc. as per your unique business setting.
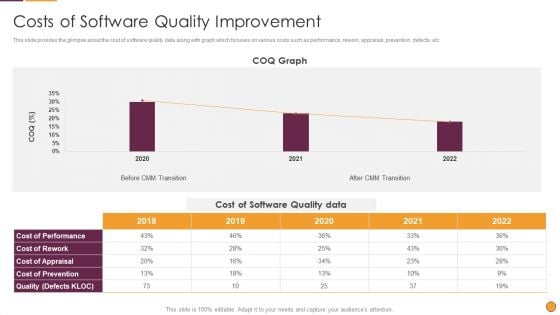
Process Enhancement Program Success Costs Of Software Quality Improvement Graphics PDF
This slide provides the glimpse about the cost of software quality data along with graph which focuses on various costs such as performance, rework, appraisal, prevention, defects, etc. Deliver an awe inspiring pitch with this creative Process Enhancement Program Success Costs Of Software Quality Improvement Graphics PDF bundle. Topics like Cost Software, Quality Data, COQ Graph can be discussed with this completely editable template. It is available for immediate download depending on the needs and requirements of the user.
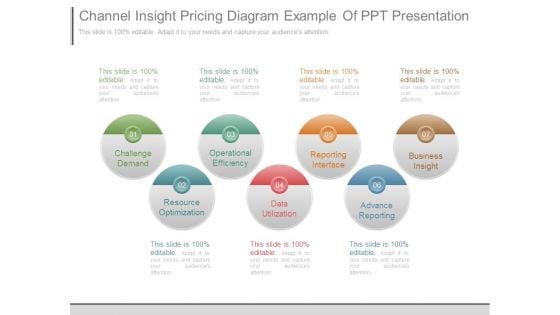
Channel Insight Pricing Diagram Example Of Ppt Presentation
This is a channel insight pricing diagram example of ppt presentation. This is a seven stage process. The stages in this process are challenge demand, operational efficiency, reporting interface, business insight, resource optimization, data utilization, advance reporting.
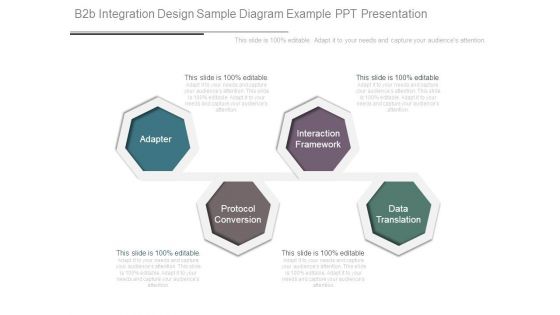
B2b Integration Design Sample Diagram Example Ppt Presentation
This is a b2b integration design sample diagram example ppt presentation. This is a four stage process. The stages in this process are adapter, protocol conversion, interaction framework, data translation.
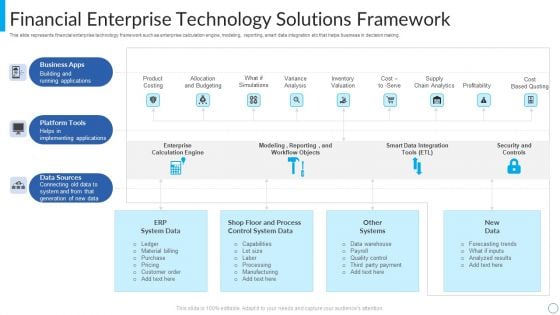
Financial Enterprise Technology Solutions Framework Diagrams PDF
This slide represents financial enterprise technology framework such as enterprise calculation engine, modeling, reporting, smart data integration etc that helps business in decision making. Showcasing this set of slides titled Financial Enterprise Technology Solutions Framework Diagrams PDF. The topics addressed in these templates are Business Apps, Platform Tools, Data Sources. All the content presented in this PPT design is completely editable. Download it and make adjustments in color, background, font etc. as per your unique business setting.
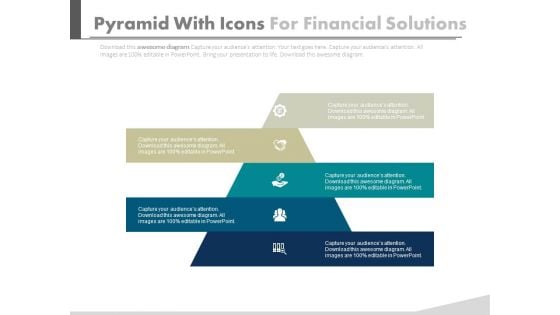
Pyramid For Financial Accounting Information Powerpoint Slides
This PowerPoint template has been designed with graphics of pyramid chart. This PPT slide can be used to prepare presentations for profit growth report and also for financial data analysis. You can download finance PowerPoint template to prepare awesome presentations.
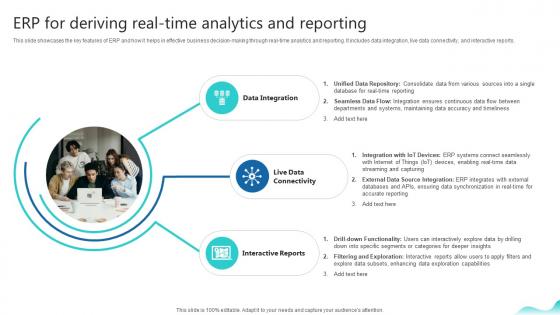
Erp For Deriving Real Time Analytics And Reporting Erp And Digital Transformation For Maximizing DT SS V
This slide showcases the key features of ERP and how it helps in effective business decision-making through real-time analytics and reporting. It includes data integration, live data connectivity, and interactive reports.Retrieve professionally designed Erp For Deriving Real Time Analytics And Reporting Erp And Digital Transformation For Maximizing DT SS V to effectively convey your message and captivate your listeners. Save time by selecting pre-made slideshows that are appropriate for various topics, from business to educational purposes. These themes come in many different styles, from creative to corporate, and all of them are easily adjustable and can be edited quickly. Access them as PowerPoint templates or as Google Slides themes. You do not have to go on a hunt for the perfect presentation because Slidegeeks got you covered from everywhere. This slide showcases the key features of ERP and how it helps in effective business decision-making through real-time analytics and reporting. It includes data integration, live data connectivity, and interactive reports.
Circle Process Of Four Steps Powerpoint Templates
Our above slide contains graphics of bulb with success graph. It helps to exhibit planning for growth. Use this diagram to impart more clarity to data and to create more sound impact on viewers.
Sample Of Business Process Flow Diagram Presentation Slides
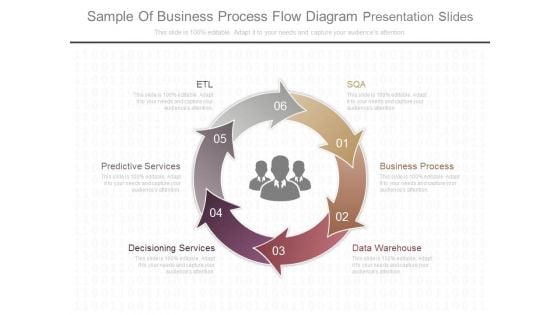
This is a sample of business process flow diagram presentation slides. This is a six stage process. The stages in this process are etl, sqa, business process, data warehouse, decisioning services, predictive services.
Voice Of The Customer Six Sigma Diagram Ppt Images
This is a voice of the customer six sigma diagram ppt images. This is a five stage process. The stages in this process are groups, warranty, metrics, data returns, survey, voice of customer.
Sop Strategic Plan Ppt Diagram Powerpoint Templates Microsoft
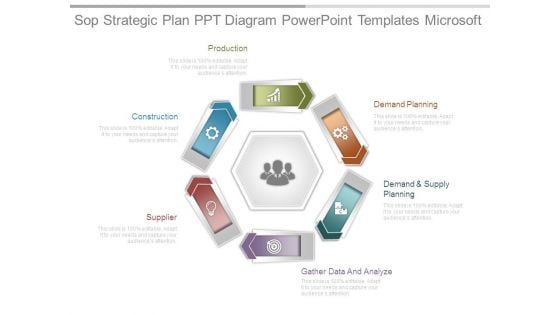
This is a sop strategic plan ppt diagram powerpoint templates microsoft. This is a six stage process. The stages in this process are production, construction, supplier, gather data and analyze, demand and supply, demand planning.
Information Technology Infrastructure Model With Service Provider Graphics PDF
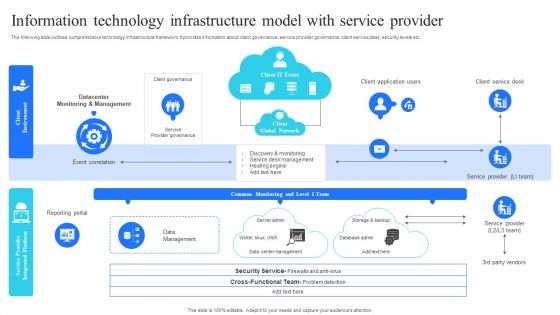
The following slide outlines comprehensive technology infrastructure framework. It provides information about client governance, service provider governance, client service desk, security levels etc. Presenting Information Technology Infrastructure Model With Service Provider Graphics PDF to dispense important information. This template comprises one stages. It also presents valuable insights into the topics including Datacenter, Monitoring And Management, Data Management, Client Service Desk, Service Provider. This is a completely customizable PowerPoint theme that can be put to use immediately. So, download it and address the topic impactfully.
Dashboard With Increasing Values Powerpoint Slides
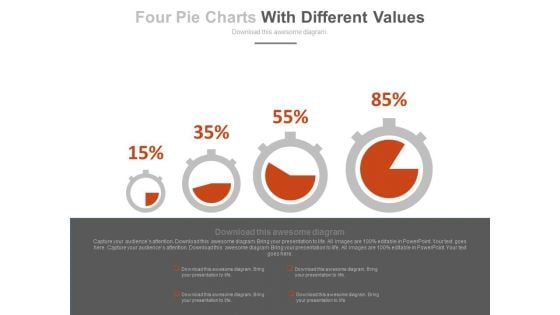
This innovative, stunningly beautiful dashboard has been designed for data visualization. It contains pie charts with increasing percentage values. This PowerPoint template helps to display your information in a useful, simple and uncluttered way.

 Home
Home