Data Governance

Business Diagram Three Stages Process Percentage Presentation Template
Three multicolored tags in vertical order has been used to decorate this business diagram. This diagram contains the concept of financial data display with percent values. This diagram can be used for management and finance related presentations.
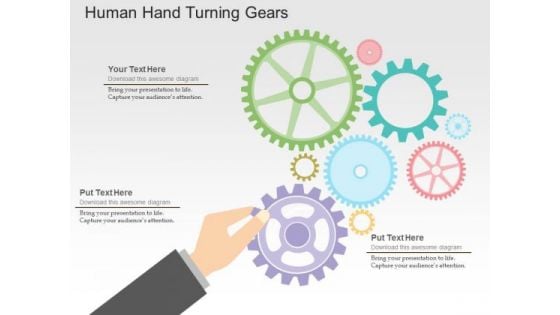
Human Hand Turning Gears PowerPoint Templates
Our above slide contains graphics of human hand turning gears. It helps to display concepts of process control and management. Use this diagram to impart more clarity to data and to create more sound impact on viewers.
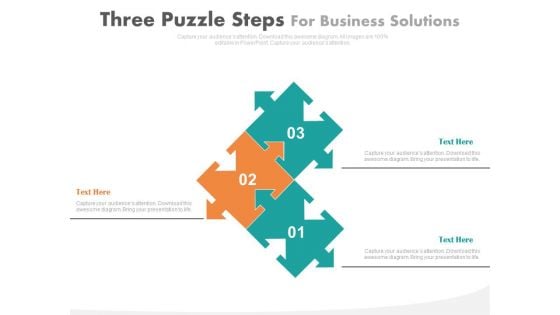
Three Puzzle Steps For Business Solutions Powerpoint Slides
Our above slide contains graphics of three puzzle steps. This slide is suitable to present business management and strategy. Use this diagram to impart more clarity to data and to create more sound impact on viewers.

Research Proposal Steps Ppt PowerPoint Presentation Complete Deck With Slides
This is a research proposal steps ppt powerpoint presentation complete deck with slides. This is a one stage process. The stages in this process are planning, table, data management, teamwork, process.

Oracle Analytics Cloud Application Roles Background PDF
This slide represents the oracle analytics aloud application roles. It includes BI service administrator, BI data model author, BI content writer, BI data load, DV content writer, and DV consumer. Deliver an awe inspiring pitch with this creative oracle analytics cloud application roles background pdf bundle. Topics like administrator, content, communicate, dashboards, visualizations can be discussed with this completely editable template. It is available for immediate download depending on the needs and requirements of the user.
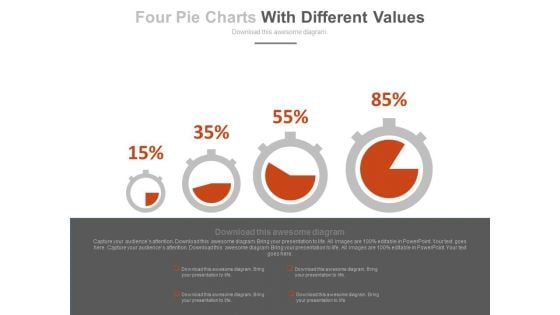
Dashboard With Increasing Values Powerpoint Slides
This innovative, stunningly beautiful dashboard has been designed for data visualization. It contains pie charts with increasing percentage values. This PowerPoint template helps to display your information in a useful, simple and uncluttered way.
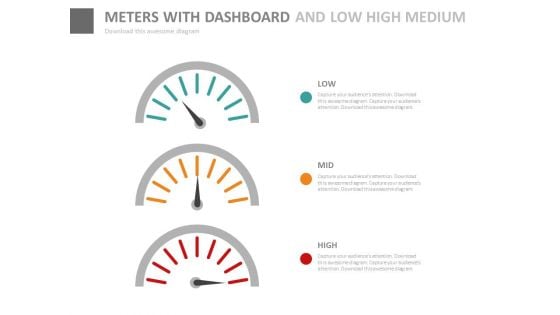
Dashboard With Low High Medium Indication Powerpoint Slides
This innovative, stunningly beautiful dashboard has been designed for data visualization. It contains dashboard with low, high and medium indication. This PowerPoint template helps to display your information in a useful, simple and orderly way.
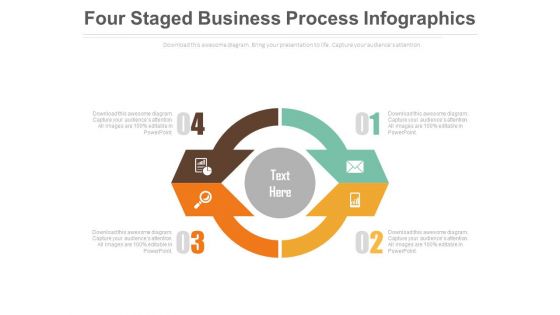
Four Steps Circular Infographic Powerpoint Slides
This innovative, stunningly beautiful dashboard has been designed for data visualization. It contains circular infographic design. This PowerPoint template helps to display your information in a useful, simple and orderly way.
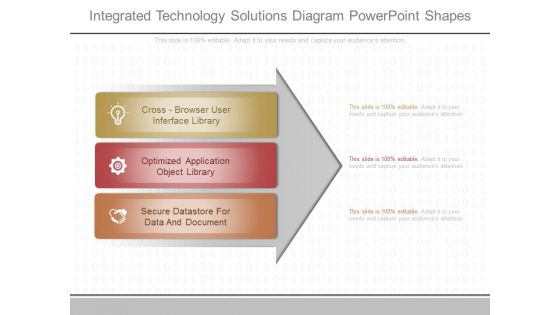
Integrated Technology Solutions Diagram Powerpoint Shapes
This is a integrated technology solutions diagram powerpoint shapes. This is a three stage process. The stages in this process are cross browser user interface library, optimized application object library, secure datastore for data and document.
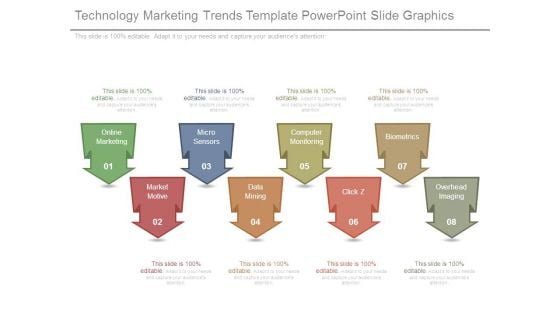
Technology Marketing Trends Template Powerpoint Slide Graphics
This is a technology marketing trends template powerpoint slide graphics. This is a eight stage process. The stages in this process are online marketing, market motive, micro sensors, data mining, computer monitoring, click z, biometrics, overhead imaging.
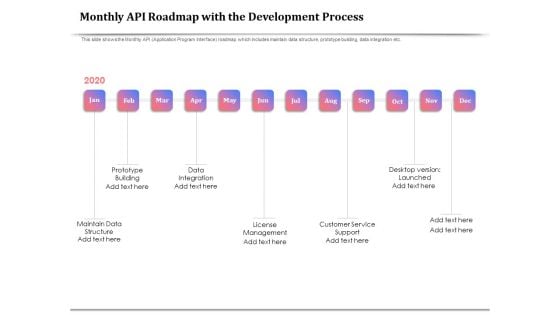
API Management For Building Software Applications Monthly API Roadmap With The Development Process Ideas PDF
Presenting this set of slides with name api management for building software applications monthly api roadmap with the development process ideas pdf. This is a twelve stage process. The stages in this process are data structure, prototype building, data integration, license management, customer service support, desktop version launched, 2020. This is a completely editable PowerPoint presentation and is available for immediate download. Download now and impress your audience.
Business Diagram Five Staged Business Process Diagram With Icons Presentation Template
Our above slide displays five staged business process diagram. Download our above diagram to express information in a visual way. Use this diagram and get good comments for data related presentations.
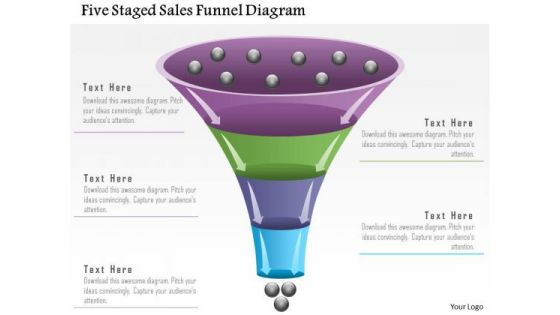
Business Diagram Five Staged Sales Funnel Diagram Presentation Template
Our above slide displays five staged sales funnel diagram. Download our above diagram to express information in a visual way. Use this diagram and get good comments for data related presentations.
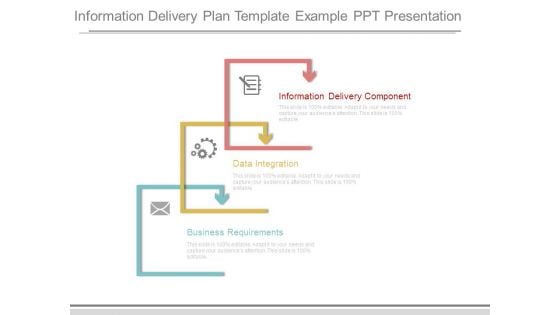
Information Delivery Plan Template Example Ppt Presentation
This is a information delivery plan template example ppt presentation. This is a three stage process. The stages in this process are information delivery component, data integration, business requirements.
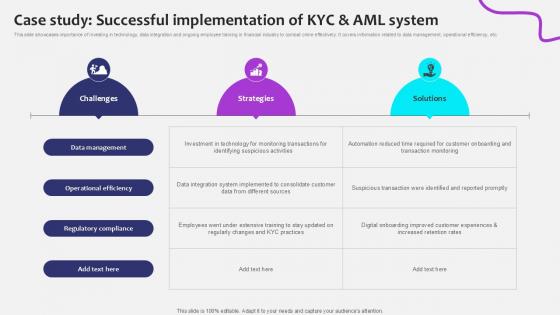
Case Study Successful Implementation Initiating Globalization Of Banking Ppt Sample
This slide showcases importance of investing in technology, data integration and ongoing employee training in financial industry to combat crime effectively. It covers information related to data management, operational efficiency, etc. Slidegeeks is one of the best resources for PowerPoint templates. You can download easily and regulate Case Study Successful Implementation Initiating Globalization Of Banking Ppt Sample for your personal presentations from our wonderful collection. A few clicks is all it takes to discover and get the most relevant and appropriate templates. Use our Templates to add a unique zing and appeal to your presentation and meetings. All the slides are easy to edit and you can use them even for advertisement purposes. This slide showcases importance of investing in technology, data integration and ongoing employee training in financial industry to combat crime effectively. It covers information related to data management, operational efficiency, etc.
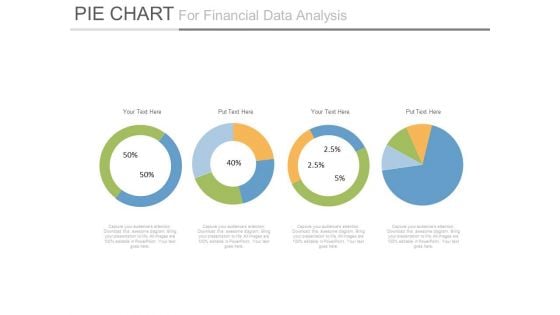
Pie Charts For Financial Ratio Analysis Powerpoint Slides
This PowerPoint template has been designed with diagram of pie charts. This PPT slide can be used to prepare presentations for profit growth report and also for financial data analysis. You can download finance PowerPoint template to prepare awesome presentations.
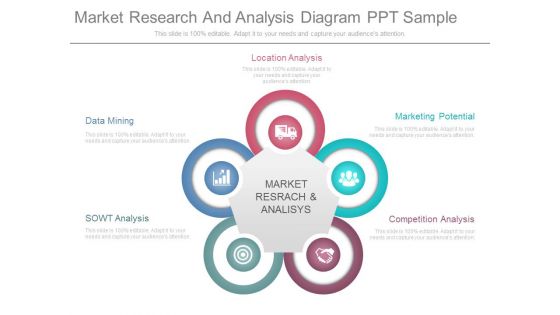
Market Research And Analysis Diagram Ppt Sample
This is a market research and analysis diagram ppt sample. This is a five stage process. The stages in this process are location analysis, data mining, sowt analysis, market research and analysis, competition analysis, marketing potential.
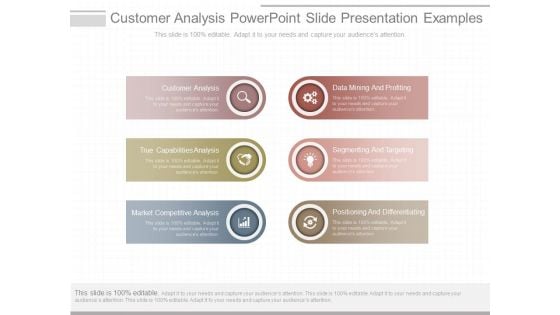
Customer Analysis Powerpoint Slide Presentation Examples
This is a customer analysis powerpoint slide presentation examples. This is a six stage process. The stages in this process are customer analysis, true capabilities analysis, market competitive analysis, data mining and profiting, segmenting and targeting, positioning and differentiating.
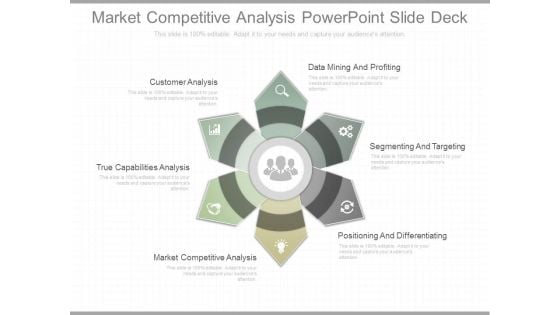
Market Competitive Analysis Powerpoint Slide Deck
This is a market competitive analysis powerpoint slide deck. This is a six stage process. The stages in this process are customer analysis, true capabilities analysis, market competitive analysis, positioning and differentiating, segmenting and targeting, data mining and profiting.
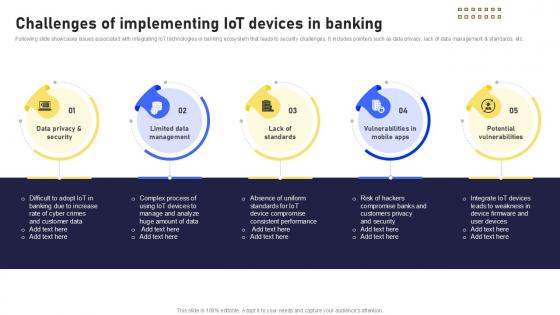
Challenges Of Implementing Banking Future With IoT Ppt Powerpoint IoT SS V
Following slide showcases issues associated with integrating IoT technologies in banking ecosystem that leads to security challenges. It includes pointers such as data privacy, lack of data management and standards, etc. Slidegeeks is one of the best resources for PowerPoint templates. You can download easily and regulate Challenges Of Implementing Banking Future With IoT Ppt Powerpoint IoT SS V for your personal presentations from our wonderful collection. A few clicks is all it takes to discover and get the most relevant and appropriate templates. Use our Templates to add a unique zing and appeal to your presentation and meetings. All the slides are easy to edit and you can use them even for advertisement purposes. Following slide showcases issues associated with integrating IoT technologies in banking ecosystem that leads to security challenges. It includes pointers such as data privacy, lack of data management and standards, etc.
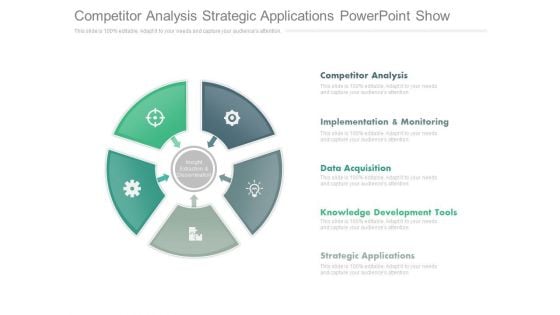
Competitor Analysis Strategic Applications Powerpoint Show
This is a competitor analysis strategic applications powerpoint show. This is a five stage process. The stages in this process are competitor analysis, implementation & monitoring, data acquisition, knowledge development tools, strategic applications.
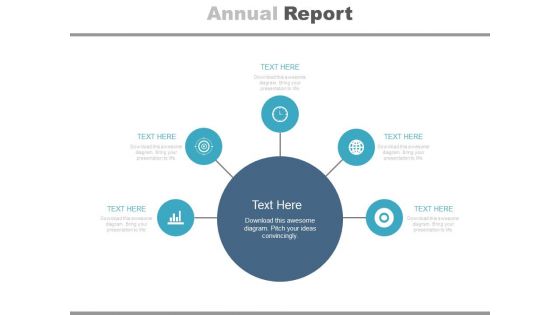
Diagram For Market Research Analysis Powerpoint Slides
This PowerPoint template has been designed with circular infographic diagram. It can be used to display steps for market research and also for financial data analysis. You can download finance PowerPoint template to prepare awesome presentations.
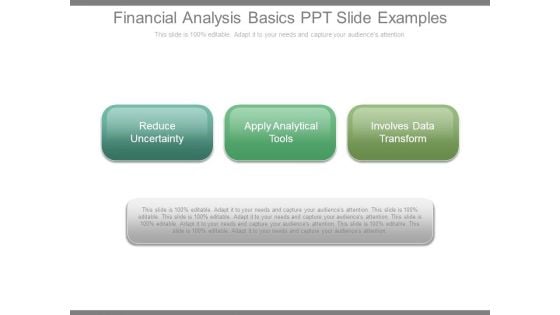
Financial Analysis Basics Ppt Slide Examples
This is a financial analysis basics ppt slide examples. This is a three stage process. The stages in this process are reduce uncertainty, apply analytical tools, involves data transform.
Navigation Point Four Banners And Icons Powerpoint Template
This PowerPoint template has been designed with four banners icons. This diagram is excellent visual tools for business presentations. Download this PPT slide to explain complex data immediately and clearly.
Four Staged Numeric Banners With Icons Powerpoint Template
This PowerPoint template has been designed with four staged numeric banners icons. This diagram is excellent visual tools for business presentations. Download this PPT slide to explain complex data immediately and clearly.
Histogram Financial Analysis Vector Icon Ppt PowerPoint Presentation Layouts File Formats Cpb
This is a histogram financial analysis vector icon ppt powerpoint presentation layouts file formats cpb. This is a three stage process. The stages in this process are bar chart icon, bar graph icon, data chart icon.
Three Bars For Financial Analysis Vector Icon Ppt PowerPoint Presentation Pictures Background Cpb
This is a three bars for financial analysis vector icon ppt powerpoint presentation pictures background cpb. This is a three stage process. The stages in this process are bar chart icon, bar graph icon, data chart icon.
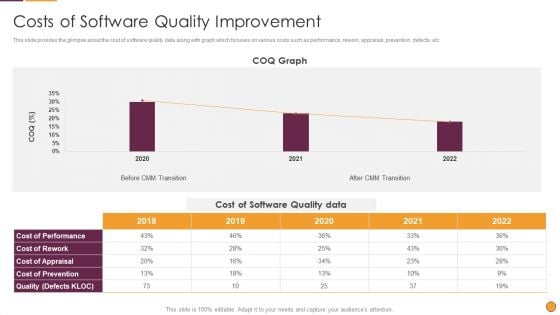
Process Enhancement Program Success Costs Of Software Quality Improvement Graphics PDF
This slide provides the glimpse about the cost of software quality data along with graph which focuses on various costs such as performance, rework, appraisal, prevention, defects, etc. Deliver an awe inspiring pitch with this creative Process Enhancement Program Success Costs Of Software Quality Improvement Graphics PDF bundle. Topics like Cost Software, Quality Data, COQ Graph can be discussed with this completely editable template. It is available for immediate download depending on the needs and requirements of the user.
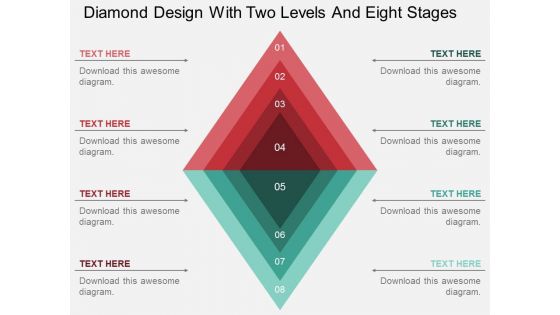
Diamond Design With Two Levels And Eight Stages Powerpoint Template
Our above slide contains graphics of diamond design with two levels and eight stages. It helps to display concepts in visual manner. Use this diagram to impart more clarity to data and to create more sound impact on viewers.
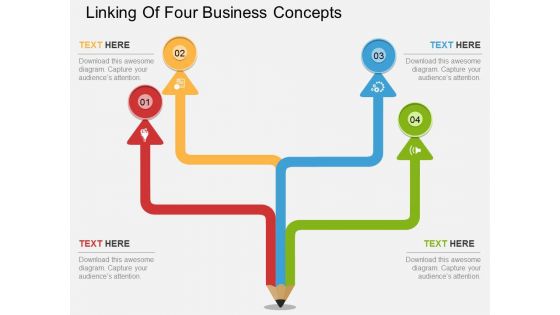
Linking Of Four Business Concepts Powerpoint Template
This PowerPoint template has been designed with four steps pencil diagram. This diagram is excellent visual tools to present link of steps. Download this PPT slide to explain complex data immediately and clearly.
Four Sequential Boxes And Icons Diagram Powerpoint Template
This PowerPoint template has been designed with four sequential boxes and icons. This diagram is excellent visual tools for business presentations. Download this PPT slide to explain complex data immediately and clearly.
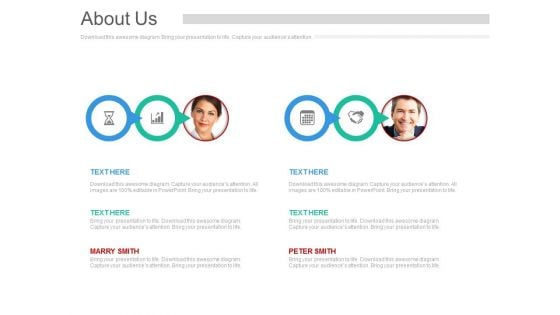
Business Team About Us Page Powerpoint Slides
This PowerPoint template has been designed with team pictures and business icons. This diagram is excellent visual tools to present teams strategic planning. Download this PPT slide to explain complex data immediately and clearly.
Three Options Puzzle Diagram With Icons Powerpoint Slides
Our above slide contains graphics of three options puzzle diagram with icons. It helps to display concepts in visual manner. Use this diagram to impart more clarity to data and to create more sound impact on viewers.
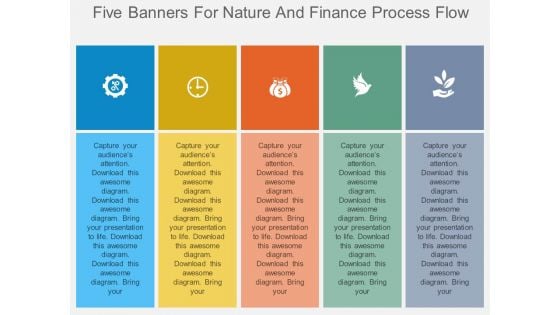
Five Banners For Nature And Finance Process Flow Powerpoint Template
This PowerPoint template has been designed with five banners nature, finance icons. This diagram is excellent visual tools for business presentations. Download this PPT slide to explain complex data immediately and clearly.
Four Arrows For Different Process Representation Powerpoint Template
This PowerPoint template has been designed with graphics of four arrows This diagram is excellent visual tools for business presentations. Download this PPT slide to explain complex data immediately and clearly.
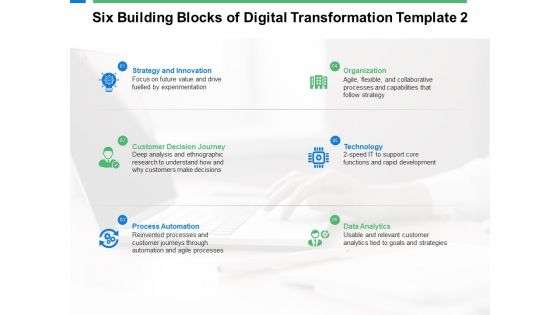
Six Building Blocks Of Digital Transformation Technology Ppt PowerPoint Presentation Infographic Template Guide
This is a six building blocks of digital transformation technology ppt powerpoint presentation infographic template guide. This is a six stage process. The stages in this process are process automation, organization, technology, data and analytics, strategy and innovation.
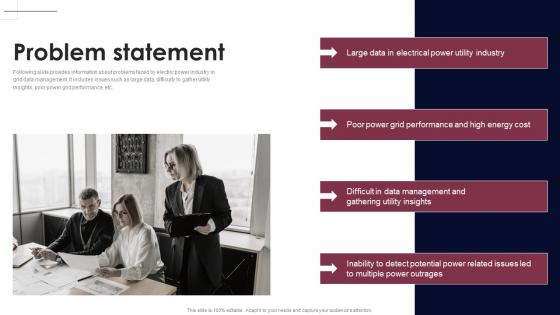
Problem Statement Smart Grid Analytics Investor Fund Raising Inspiration PDF
Following slide provides information about problems faced by electric power industry in grid data management. It includes issues such as large data, difficulty to gather utility insights, poor power grid performance, etc. Make sure to capture your audiences attention in your business displays with our gratis customizable Problem Statement Smart Grid Analytics Investor Fund Raising Inspiration PDF. These are great for business strategies, office conferences, capital raising or task suggestions. If you desire to acquire more customers for your tech business and ensure they stay satisfied, create your own sales presentation with these plain slides. Following slide provides information about problems faced by electric power industry in grid data management. It includes issues such as large data, difficulty to gather utility insights, poor power grid performance, etc.
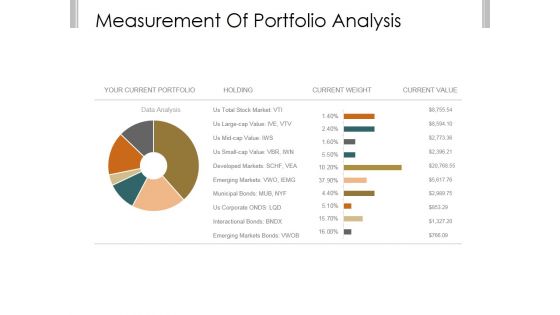
Measurement Of Portfolio Analysis Ppt PowerPoint Presentation Clipart
This is a measurement of portfolio analysis ppt powerpoint presentation clipart. This is a two stage process. The stages in this process are your current portfolio, holding, current weight, current value, data analysis.
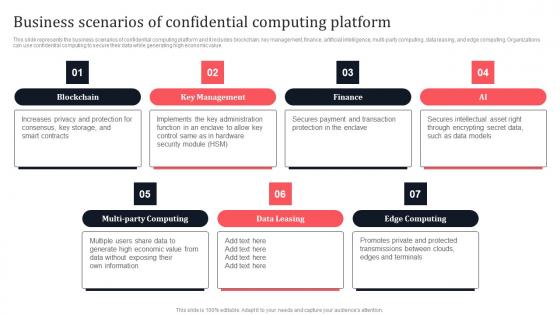
Business Scenarios Of Confidential Computing Platform Secure Multi Party Formats Pdf
This slide represents the business scenarios of confidential computing platform and it includes blockchain, key management, finance, artificial intelligence, multi-party computing, data leasing, and edge computing. Organizations can use confidential computing to secure their data while generating high economic value. Boost your pitch with our creative Business Scenarios Of Confidential Computing Platform Secure Multi Party Formats Pdf Deliver an awe-inspiring pitch that will mesmerize everyone. Using these presentation templates you will surely catch everyones attention. You can browse the ppts collection on our website. We have researchers who are experts at creating the right content for the templates. So you do not have to invest time in any additional work. Just grab the template now and use them. This slide represents the business scenarios of confidential computing platform and it includes blockchain, key management, finance, artificial intelligence, multi-party computing, data leasing, and edge computing. Organizations can use confidential computing to secure their data while generating high economic value.
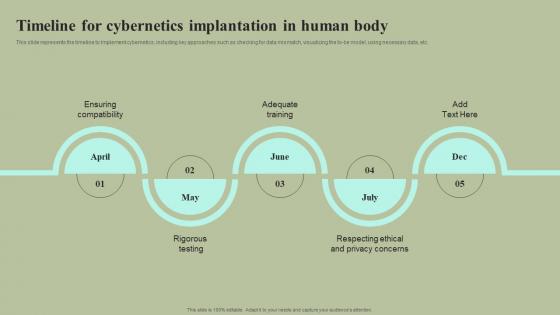
Timeline For Cybernetics Implantation In Human Body Cybernetic Integration Portrait Pdf
This slide represents the timeline to Implement cybernetics, including key approaches such as checking for data mismatch, visualizing the to-be model, using necessary data, etc. Coming up with a presentation necessitates that the majority of the effort goes into the content and the message you intend to convey. The visuals of a PowerPoint presentation can only be effective if it supplements and supports the story that is being told. Keeping this in mind our experts created Timeline For Cybernetics Implantation In Human Body Cybernetic Integration Portrait Pdf to reduce the time that goes into designing the presentation. This way, you can concentrate on the message while our designers take care of providing you with the right template for the situation. This slide represents the timeline to Implement cybernetics, including key approaches such as checking for data mismatch, visualizing the to-be model, using necessary data, etc.

Problem Statement Document Creation Software Company Fundraising Ppt Slide
This slide shows information regarding the various problems related to different form of documents. These problems are, fragmentated workflows, data silos, data integration issue, etc. Formulating a presentation can take up a lot of effort and time, so the content and message should always be the primary focus. The visuals of the PowerPoint can enhance the presenters message, so our Problem Statement Document Creation Software Company Fundraising Ppt Slide was created to help save time. Instead of worrying about the design, the presenter can concentrate on the message while our designers work on creating the ideal templates for whatever situation is needed. Slidegeeks has experts for everything from amazing designs to valuable content, we have put everything into Problem Statement Document Creation Software Company Fundraising Ppt Slide This slide shows information regarding the various problems related to different form of documents. These problems are, fragmentated workflows, data silos, data integration issue, etc.
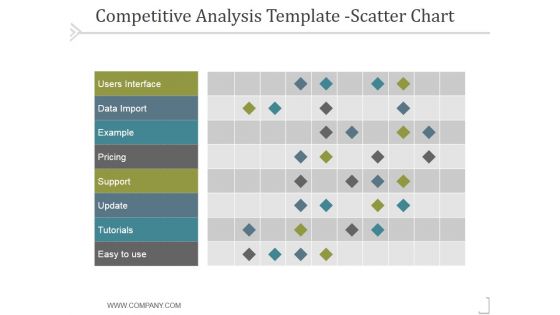
Competitive Analysis Scatter Chart Template 2 Ppt PowerPoint Presentation Files
This is a competitive analysis scatter chart template 2 ppt powerpoint presentation files. This is a nine stage process. The stages in this process are users interface, data import, example, pricing, support, update.
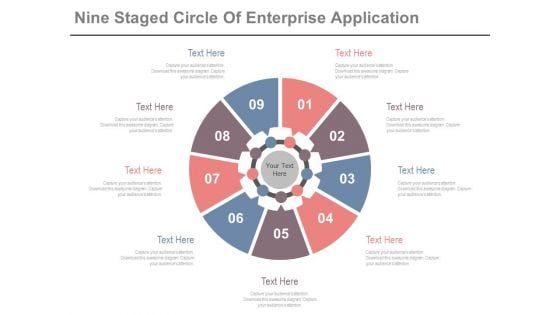
Circle Diagram For Business Marketing Mix Powerpoint Slides
This PowerPoint template has been designed with nine steps circle chart. This PPT slide can be used to prepare presentations for profit growth report and also for financial data analysis. You can download finance PowerPoint template to prepare awesome presentations.
Cloud Icons With Paper Clips PowerPoint Template
Visually support your presentation with our above template showing cloud icons with paper clips. This slide has been professionally designed to portray concepts like cloud computing and data storage. This template offers an excellent background to build impressive presentation.
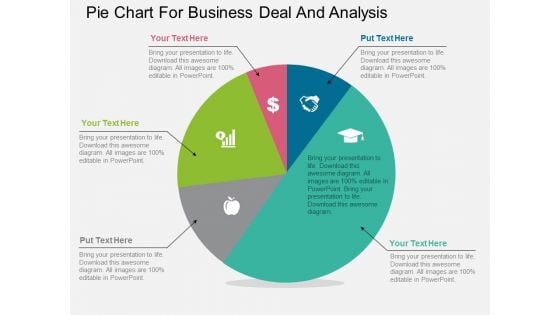
Pie Chart For Business Deal And Analysis Powerpoint Template
Our above PPT slide contains diagram of pentagon infographic. It helps to display steps of corporate marketing. Use this diagram to impart more clarity to data and to create more sound impact on viewers.
Illustration For Business Steps With Icons Powerpoint Template
Our above PowerPoint slide contains graphics of four text boxes with icons. Download this business slide to illustrate four business steps. Use this diagram to impart more clarity to data and to create more sound impact on viewers.
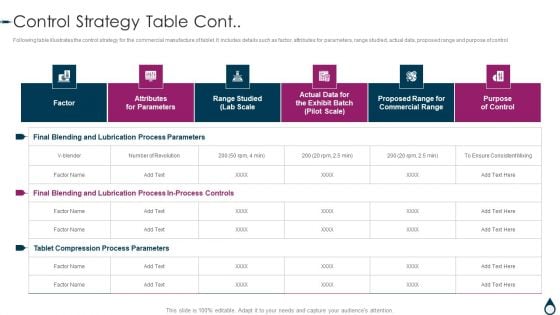
Quality Manufacturing Process For Generic Medicines Control Strategy Table Cont Template PDF
Following table illustrates the control strategy for the commercial manufacture of tablet. It includes details such as factor, attributes for parameters, range studied, actual data, proposed range and purpose of control. Deliver an awe inspiring pitch with this creative Quality Manufacturing Process For Generic Medicines Control Strategy Table Cont Template PDF bundle. Topics like Commercial Range, Data can be discussed with this completely editable template. It is available for immediate download depending on the needs and requirements of the user.
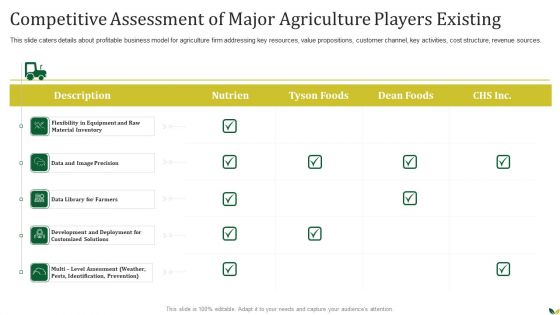
Agribusiness Competitive Assessment Of Major Agriculture Players Existing Mockup PDF
This slide caters details about profitable business model for agriculture firm addressing key resources, value propositions, customer channel, key activities, cost structure, revenue sources. Deliver an awe inspiring pitch with this creative Agribusiness Competitive Assessment Of Major Agriculture Players Existing Mockup PDF bundle. Topics like Nutrien, Data AND Image Precision, Data Library FOR Farmers, Development AND Deployment, Customized Solutions can be discussed with this completely editable template. It is available for immediate download depending on the needs and requirements of the user.
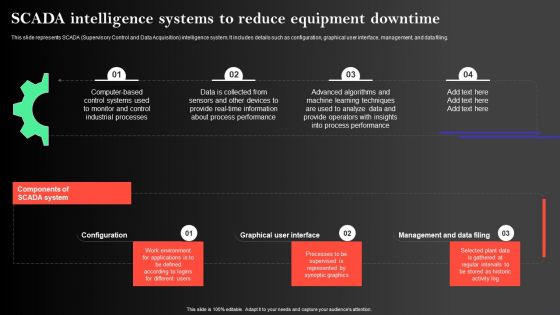
Manufacturing Operations Management Process Scada Intelligence Systems To Reduce Guidelines PDF
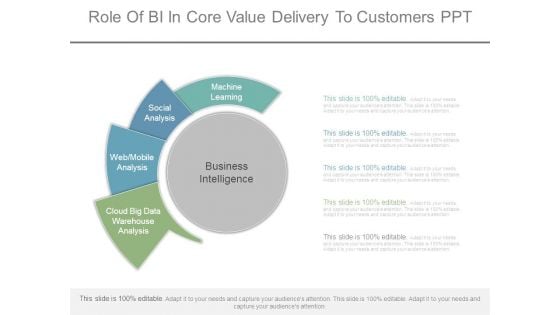
Role Of Bi In Core Value Delivery To Customers Ppt
This is a role of bi in core value delivery to customers ppt. This is a five stage process. The stages in this process are business intelligence, machine learning, social analysis, web mobile analysis, cloud big data warehouse analysis.
Battery Icons For Business Growth Levels Powerpoint Template
Levels of business growth can be displayed with this diagram. This PowerPoint template contains graphics of seven battery icons. You can use this design for data analysis in business presentations
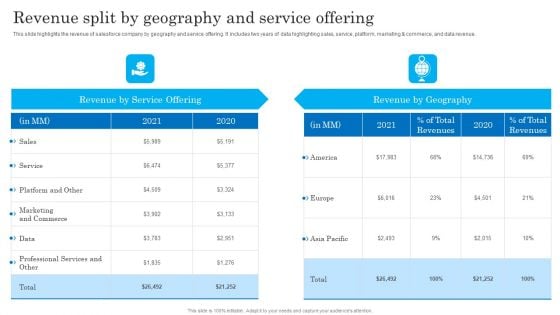
Revenue Split By Geography And Service Offering Salesforce Business Profile Download PDF
This slide highlights the revenue of salesforce company by geography and service offering. It includes two years of data highlighting sales, service, platform, marketing and commerce, and data revenue. Deliver an awe inspiring pitch with this creative Revenue Split By Geography And Service Offering Salesforce Business Profile Download PDF bundle. Topics like Revenue By Service Offering, Revenue By Geography can be discussed with this completely editable template. It is available for immediate download depending on the needs and requirements of the user.
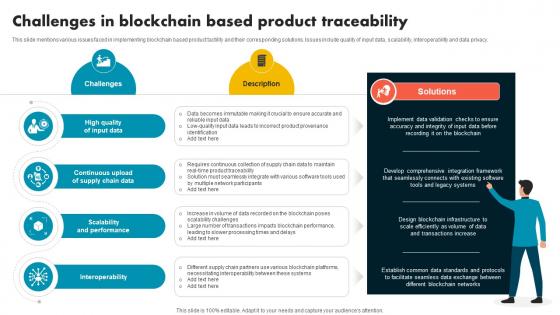
Challenges In Blockchain Based Product Traceability Supply Chain Evolution Harnessing The Power BCT SS V
This slide mentions various issues faced in implementing blockchain based product tactility and their corresponding solutions. Issues include quality of input data, scalability, interoperability and data privacy. Welcome to our selection of the Challenges In Blockchain Based Product Traceability Supply Chain Evolution Harnessing The Power BCT SS V. These are designed to help you showcase your creativity and bring your sphere to life. Planning and Innovation are essential for any business that is just starting out. This collection contains the designs that you need for your everyday presentations. All of our PowerPoints are 100 percent editable, so you can customize them to suit your needs. This multi-purpose template can be used in various situations. Grab these presentation templates today. This slide mentions various issues faced in implementing blockchain based product tactility and their corresponding solutions. Issues include quality of input data, scalability, interoperability and data privacy.
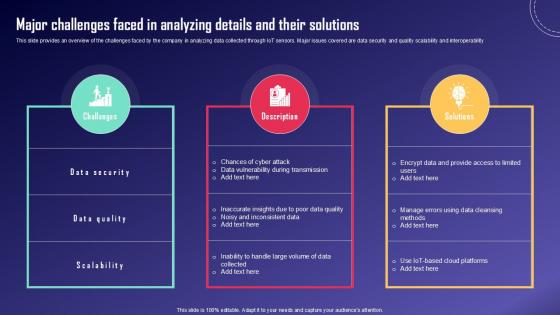
Major Challenges Faced In IoT Fleet Monitoring Ppt Presentation IoT SS V
This slide provides an overview of the challenges faced by the company in analyzing data collected through IoT sensors. Major issues covered are data security and quality scalability and interoperability. Get a simple yet stunning designed Major Challenges Faced In IoT Fleet Monitoring Ppt Presentation IoT SS V. It is the best one to establish the tone in your meetings. It is an excellent way to make your presentations highly effective. So, download this PPT today from Slidegeeks and see the positive impacts. Our easy-to-edit Major Challenges Faced In IoT Fleet Monitoring Ppt Presentation IoT SS V can be your go-to option for all upcoming conferences and meetings. So, what are you waiting for Grab this template today. This slide provides an overview of the challenges faced by the company in analyzing data collected through IoT sensors. Major issues covered are data security and quality scalability and interoperability.
Competitive Analysis Template 6 Scatter Chart Ppt PowerPoint Presentation Icon Example Topics
This is a competitive analysis template 6 scatter chart ppt powerpoint presentation icon example topics. This is a eight stage process. The stages in this process are users interface, data import, example, pricing, support, update, tutorials, easy to use.
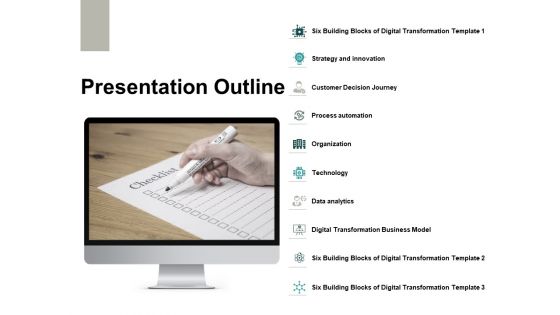
Presentation Outline Ppt PowerPoint Presentation Gallery Templates
This is a presentation outline ppt powerpoint presentation gallery templates. This is a ten stage process. The stages in this process are technology, organization, data analytics, process automation, strategy.
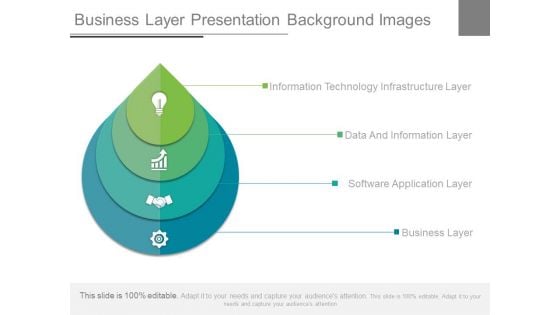
Business Layer Presentation Background Images
This is a business layer presentation background images. This is a four stage process. The stages in this process are information technology infrastructure layer, data and information layer, software application layer, business layer.
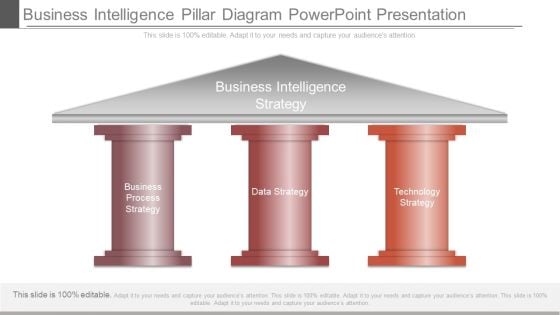
Business Intelligence Pillar Diagram Powerpoint Presentation
This is a business intelligence pillar diagram powerpoint presentation. This is a three stage process. The stages in this process are business intelligence strategy, business process strategy, data strategy, technology strategy.
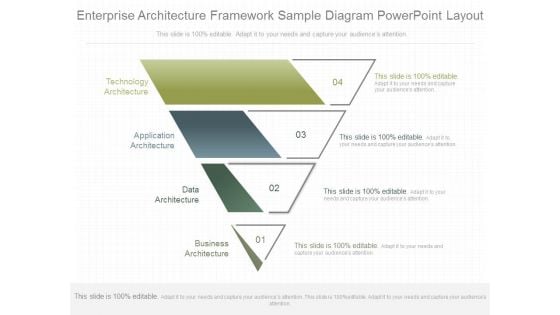
Enterprise Architecture Framework Sample Diagram Powerpoint Layout
This is a enterprise architecture framework sample diagram powerpoint layout. This is a four stage process. The stages in this process are technology architecture, application architecture, data architecture, business architecture.
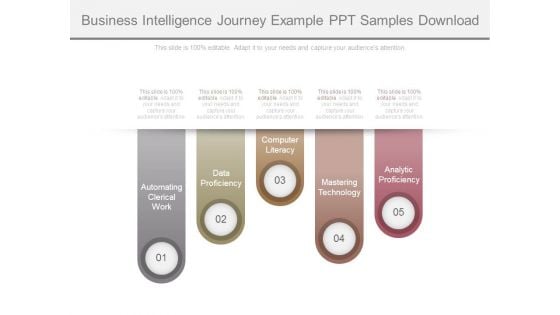
Business Intelligence Journey Example Ppt Samples Download
This is a business intelligence journey example ppt samples download. This is a five stage process. The stages in this process are automating clerical work, data proficiency, mastering technology, analytic proficiency, computer literacy.


 Continue with Email

 Home
Home


