Data Governance
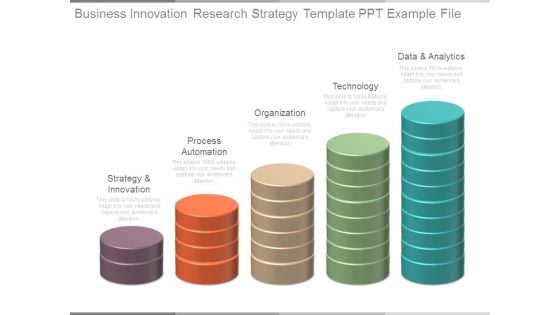
Business Innovation Research Strategy Template Ppt Example File
This is a business innovation research strategy template ppt example file. This is a five stage process. The stages in this process are strategy and innovation, process automation, organization, technology, data and analytics.
Mitigation Solutions For Healthcare Deploying IoT Solutions For Enhanced Healthcare Icons Pdf
Following slide exhibits solutions that helps to solve issues faced due to implementation of intent of things in medical industry. It includes pointers such as data security, protocol integration and data management. If your project calls for a presentation, then Slidegeeks is your go to partner because we have professionally designed, easy to edit templates that are perfect for any presentation. After downloading, you can easily edit Mitigation Solutions For Healthcare Deploying IoT Solutions For Enhanced Healthcare Icons Pdf and make the changes accordingly. You can rearrange slides or fill them with different images. Check out all the handy templates Following slide exhibits solutions that helps to solve issues faced due to implementation of intent of things in medical industry. It includes pointers such as data security, protocol integration and data management.
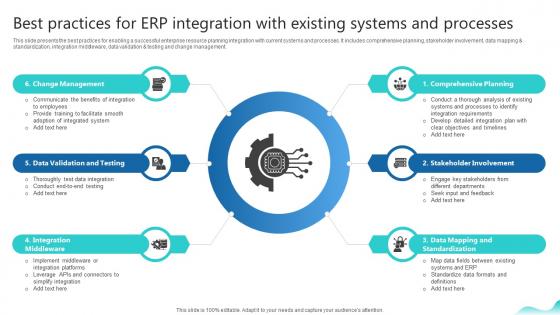
Best Practices For Erp Integration With Existing Systems Erp And Digital Transformation For Maximizing DT SS V
This slide presents the best practices for enabling a successful enterprise resource planning integration with current systems and processes. It includes comprehensive planning, stakeholder involvement, data mapping and standardization, integration middleware, data validation and testing and change management.From laying roadmaps to briefing everything in detail, our templates are perfect for you. You can set the stage with your presentation slides. All you have to do is download these easy-to-edit and customizable templates. Best Practices For Erp Integration With Existing Systems Erp And Digital Transformation For Maximizing DT SS V will help you deliver an outstanding performance that everyone would remember and praise you for. Do download this presentation today. This slide presents the best practices for enabling a successful enterprise resource planning integration with current systems and processes. It includes comprehensive planning, stakeholder involvement, data mapping and standardization, integration middleware, data validation and testing and change management.
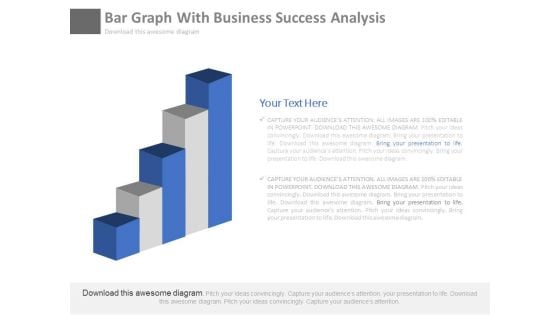
Bar Graph For Marketing Research Process Powerpoint Slides
This PowerPoint template has been designed with diagram of bar graph. This PPT slide can be used to prepare presentations for profit growth report and also for financial data analysis. You can download finance PowerPoint template to prepare awesome presentations.
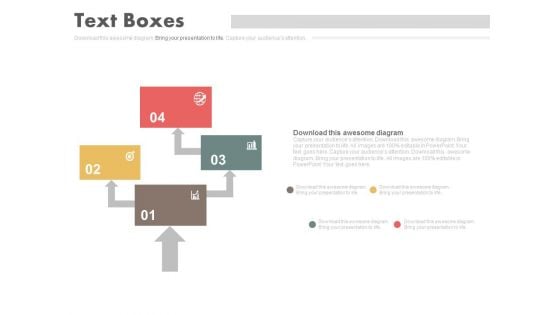
Four Steps Arrow Chart Design Powerpoint Slides
This PowerPoint template has been designed with four steps arrow chart. This PPT slide can be used to prepare presentations for marketing reports and also for financial data analysis. You can download finance PowerPoint template to prepare awesome presentations.
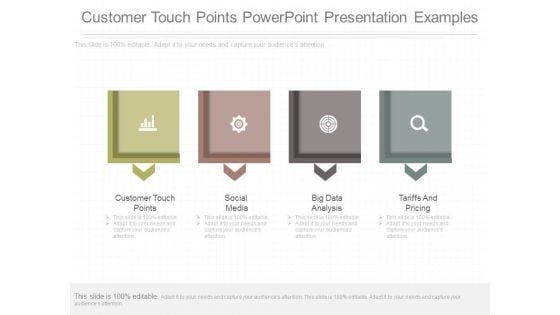
Customer Touch Points Powerpoint Presentation Examples
This is a customer touch points powerpoint presentation examples. This is a four stage process. The stages in this process are customer touch points, social media, big data analysis, tariffs and pricing.
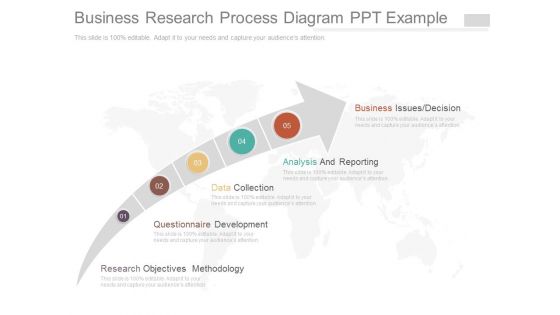
Business Research Process Diagram Ppt Example
This is a business research process diagram ppt example. This is a five stage process. The stages in this process are business issues decision, analysis and reporting, data collection, questionnaire development, research objectives methodology.
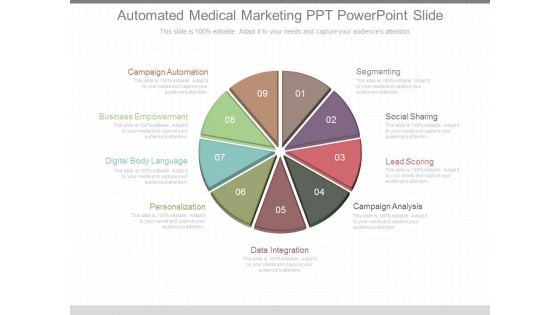
Automated Medical Marketing Ppt Powerpoint Slide
This is an automated medical marketing ppt powerpoint slide. This is a nine stage process. The stages in this process are campaign automation, segmenting, business empowerment, social sharing, lead scoring, lead scoring, digital body language, campaign analysis, data integration.
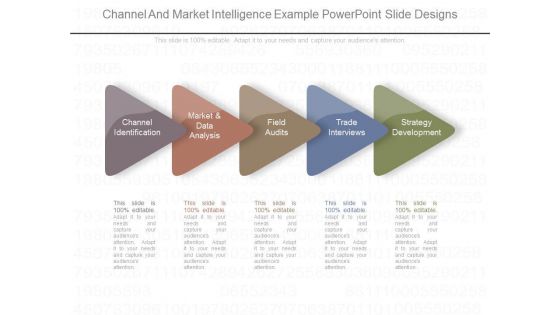
Channel And Market Intelligence Example Powerpoint Slide Designs
This is a channel and market intelligence example powerpoint slide designs. This is a five stage process. The stages in this process are channel identification, market and data analysis, field audits, trade interviews, strategy development.
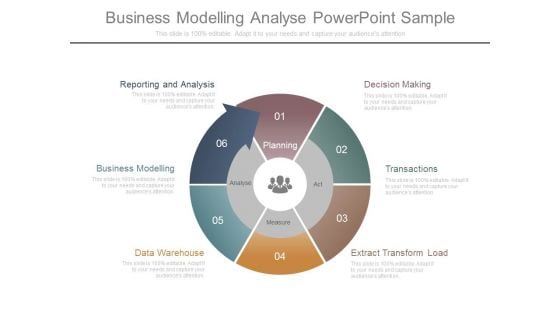
Business Modelling Analyse Powerpoint Sample
This is a business modelling analyse powerpoint sample. This is a six stage process. The stages in this process are decision making, transactions, extract transform load, data warehouse, business modelling, reporting and analysis, planning, act, measure, analyse.
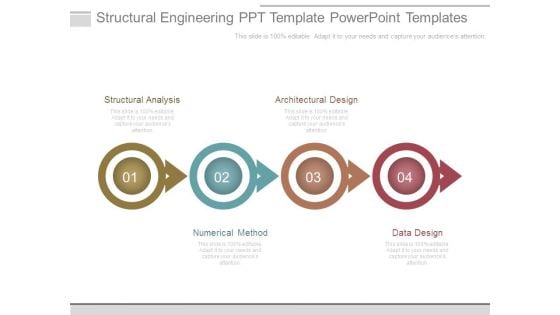
Structural Engineering Ppt Template Powerpoint Templates
This is a structural engineering ppt template powerpoint templates. This is a four stage process. The stages in this process are structural analysis, architectural design, numerical method, data design.
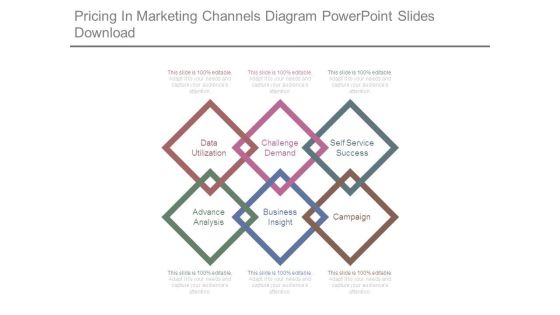
Pricing In Marketing Channels Diagram Powerpoint Slides Download
This is a pricing in marketing channels diagram powerpoint slides download. This is a six stage process. The stages in this process are data utilization, challenge demand, self service success, advance analysis, business insight, campaign.

Siem Process Template Powerpoint Slides
This is a siem process template powerpoint slides. This is a six stage process. The stages in this process are add value, reporting, data collection, dashboard, log analysis, log retention.
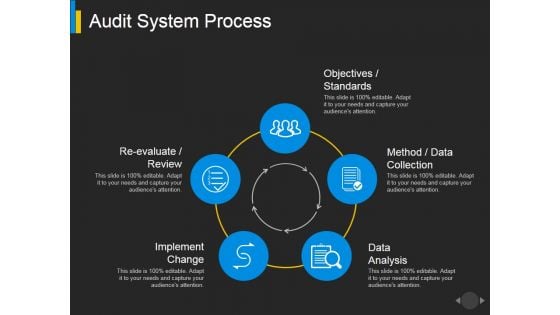
Audit System Process Ppt PowerPoint Presentation File Shapes
This is a audit system process ppt powerpoint presentation file shapes. This is a five stage process. The stages in this process are data analysis, implement change, objectives standards.

Portfolio Revision Ppt PowerPoint Presentation Gallery File Formats
This is a portfolio revision ppt powerpoint presentation gallery file formats. This is a two stage process. The stages in this process are current portfolio, new portfolio, data analysis.
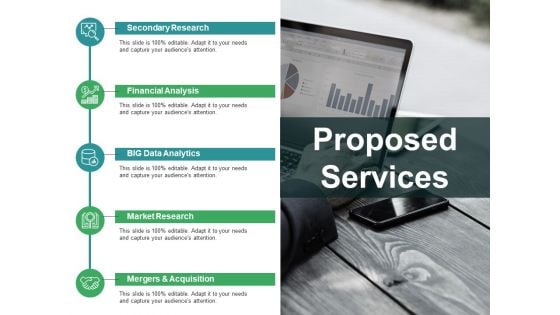
Proposed Services Ppt PowerPoint Presentation Pictures Backgrounds
This is a proposed services ppt powerpoint presentation pictures backgrounds. This is a five stage process. The stages in this process are secondary research, financial analysis, big data analytics, market research.
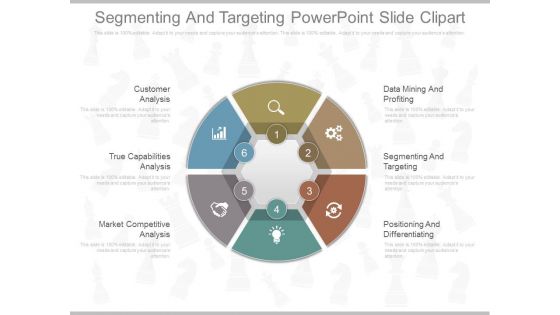
Segmenting And Targeting Powerpoint Slide Clipart
This is a segmenting and targeting powerpoint slide clipart. This is a six stage process. The stages in this process are data mining and profiting, segmenting and targeting, positioning and differentiating, market competitive analysis, true capabilities analysis, customer analysis.
Four Tags With Mobile And Icons Powerpoint Template
Our above PPT slide contains graphics mobile with four tags and icons. This business diagram helps to display technology and communication concepts. Use this template to impart more clarity to data and to create more sound impact on viewers.
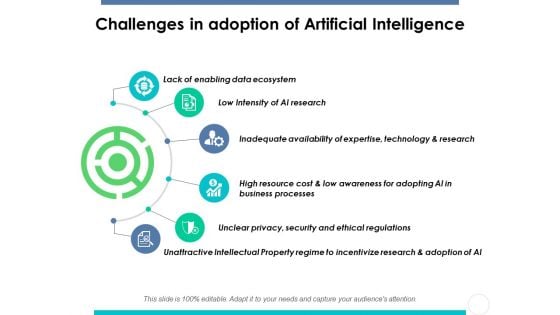
Challenges In Adoption Of Artificial Intelligence Ppt PowerPoint Presentation Portfolio Infographics
This is a challenges in adoption of artificial intelligence ppt powerpoint presentation portfolio infographics. This is a six stage process. The stages in this process are enabling data ecosystem, Inadequate availability, expertise, technology, research.
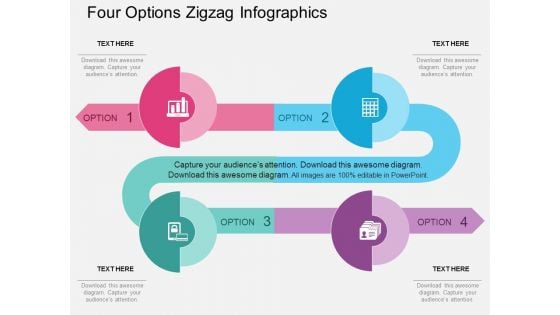
Four Options Zigzag Infographics Powerpoint Template
Emphatically define your message with our above template which contains four options zigzag infographic. This business diagram may be used to plot data series. Deliver amazing presentations to mesmerize your audience.
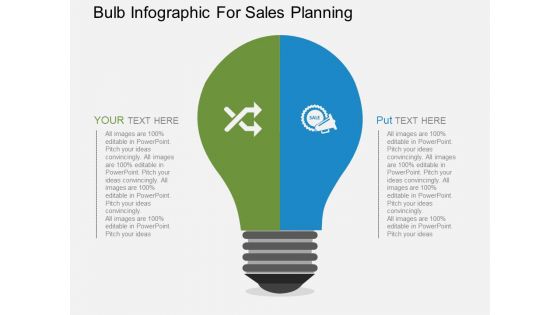
Bulb Infographic For Sales Planning Powerpoint Templates
This PowerPoint slide contains graphics of bulb diagram with icons. It helps to exhibit concepts of sales planning. Use this diagram to impart more clarity to data and to create more sound impact on viewers.
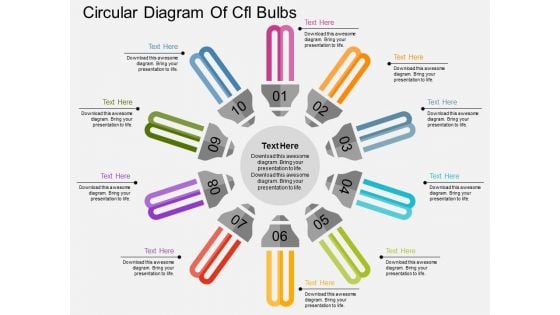
Circular Diagram Of Cfl Bulbs Powerpoint Templates
This PowerPoint template has been designed with circular diagram of CFL bulbs. It helps to exhibit business strategies and ideas. Use this diagram to impart more clarity to data and to create more sound impact on viewers.
Colorful Bulb With Three Icons Powerpoint Templates
This PowerPoint slide contains graphics of bulb diagram with icons. It helps to exhibit concepts of sales planning. Use this diagram to impart more clarity to data and to create more sound impact on viewers.
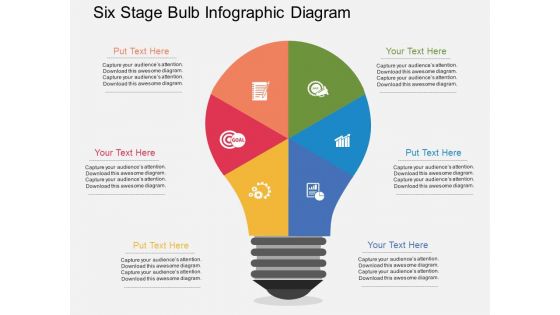
Six Stage Bulb Infographic Diagram Powerpoint Templates
This PowerPoint slide contains graphics of bulb diagram with icons. It helps to exhibit concepts of marketing strategy. Use this diagram to impart more clarity to data and to create more sound impact on viewers.
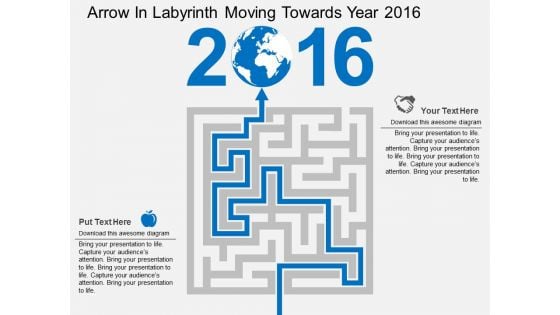
Arrow In Labyrinth Moving Towards Year 2016 Powerpoint Templates
Our above slide contains graphics of labyrinth with arrow on 2016 and globe. It helps to display concept of global business strategy. Use this diagram to impart more clarity to data and to create more sound impact on viewers.
Profit Growth Bars With Icons And Mouse Powerpoint Template
Our above slide contains graphics of profit growth bars with icons. This PowerPoint template helps to display outline of business plan. Use this diagram to impart more clarity to data and to create more sound impact on viewers.
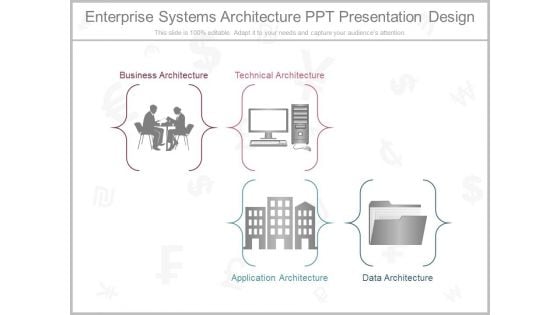
Enterprise Systems Architecture Ppt Presentation Design
This is a enterprise systems architecture ppt presentation design. This is a four stage process. The stages in this process are business architecture, technical architecture, application architecture, data architecture.
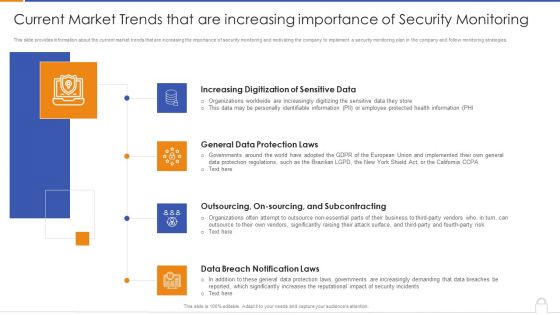
Current Market Trends That Are Increasing Importance Of Security Monitoring Information PDF
Presenting current market trends that are increasing importance of security monitoring information pdf to provide visual cues and insights. Share and navigate important information on four stages that need your due attention. This template can be used to pitch topics like increasing digitization, general data protection laws, data breach notification laws. In addtion, this PPT design contains high resolution images, graphics, etc, that are easily editable and available for immediate download.
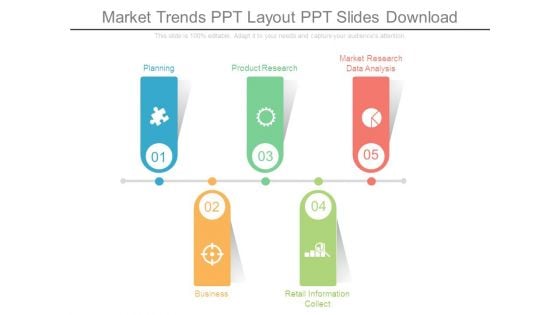
Market Trends Ppt Layout Ppt Slides Download
This is a market trends ppt layout ppt slides download. This is a five stage process. The stages in this process are planning, business, product research, retail information collect, market research data analysis.
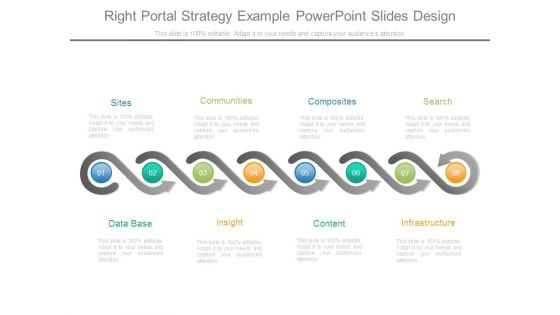
Right Portal Strategy Example Powerpoint Slides Design
This is a right portal strategy example powerpoint slides design. This is a eight stage process. The stages in this process are sites, communities, composites, search, data base, insight, content, infrastructure.
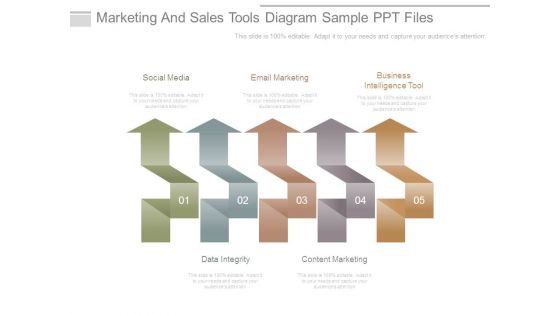
Marketing And Sales Tools Diagram Sample Ppt Files
This is a marketing and sales tools diagram sample ppt files. This is a five stage process. The stages in this process are social media, email marketing, business intelligence tool, data integrity, content marketing.
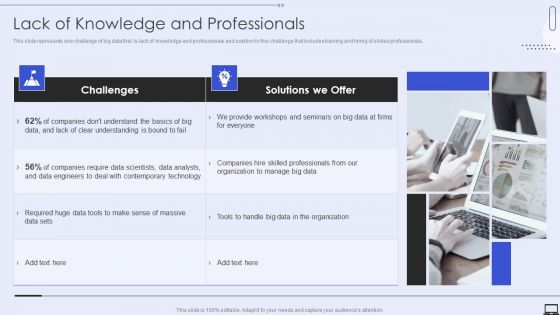
Lack Of Knowledge And Professional Ppt PowerPoint Presentation File Pictures PDF
This is a Lack Of Knowledge And Professional Ppt PowerPoint Presentation File Pictures PDF template with various stages. Focus and dispense information on two stages using this creative set, that comes with editable features. It contains large content boxes to add your information on topics like Contemporary Technology, Data Analysts, Require Data. You can also showcase facts, figures, and other relevant content using this PPT layout. Grab it now.
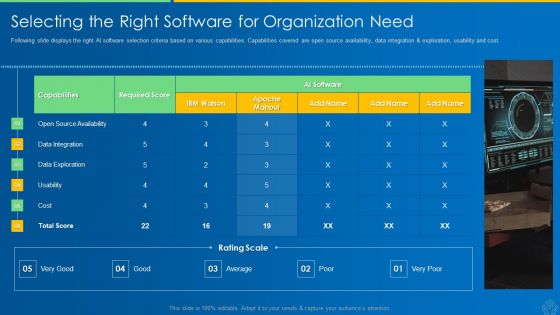
AI And ML Driving Monetary Value For Organization Selecting The Right Software For Organization Need Infographics PDF
This is a ai and ml driving monetary value for organization selecting the right software for organization need infographics pdf template with various stages. Focus and dispense information on six stages using this creative set, that comes with editable features. It contains large content boxes to add your information on topics like data integration, data exploration, usability, cost, capabilities. You can also showcase facts, figures, and other relevant content using this PPT layout. Grab it now.
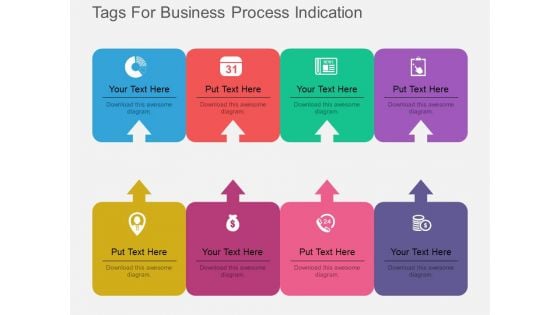
Eight Tags For Business Process Indication Powerpoint Template
Our above PPT slide contains graphics of eight text tags with icons. This PowerPoint template may be used to display business process steps. Use this diagram to impart more clarity to data and to create more sound impact on viewers.
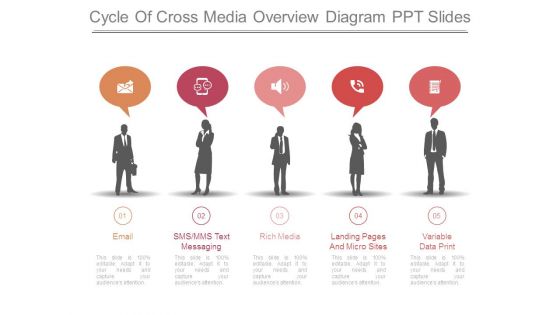
Cycle Of Cross Media Overview Diagram Ppt Slides
This is a cycle of cross media overview diagram ppt slides. This is a five stage process. The stages in this process are email, sms, mms text messaging, rich media, landing pages and micro sites, variable data print.
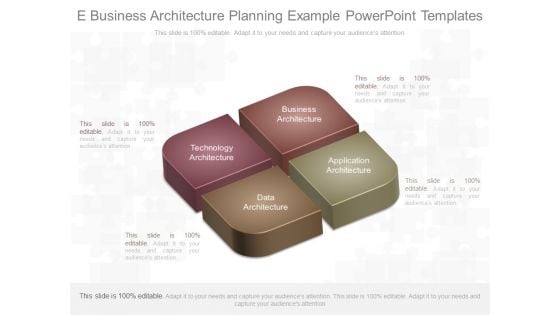
E Business Architecture Planning Example Powerpoint Templates
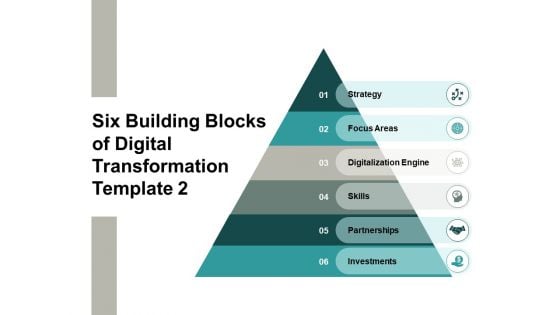
Six Building Blocks Of Digital Transformation Strategy Ppt PowerPoint Presentation Gallery Model
This is a six building blocks of digital transformation strategy ppt powerpoint presentation gallery model. This is a six stage process. The stages in this process are technology, organization, data analytics, process automation, strategy.
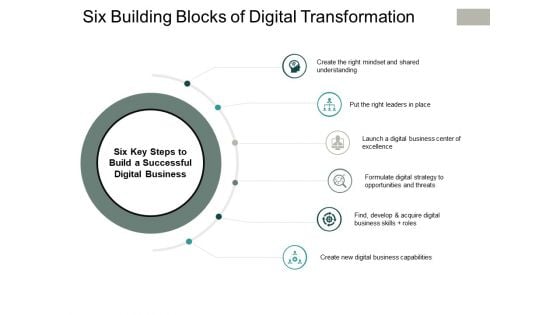
Six Building Blocks Of Digital Transformation Ppt PowerPoint Presentation Pictures Example
This is a six building blocks of digital transformation ppt powerpoint presentation pictures example. This is a six stage process. The stages in this process are technology, organization, data analytics, process automation, strategy.
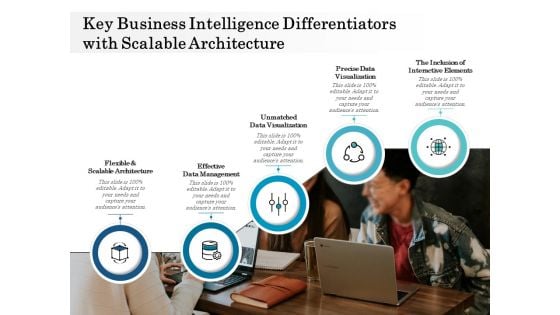
Key Business Intelligence Differentiators With Scalable Architecture Ppt PowerPoint Presentation File Inspiration PDF
Persuade your audience using this key business intelligence differentiators with scalable architecture ppt powerpoint presentation file inspiration pdf. This PPT design covers five stages, thus making it a great tool to use. It also caters to a variety of topics including data management, data visualization, interactive elements. Download this PPT design now to present a convincing pitch that not only emphasizes the topic but also showcases your presentation skills.
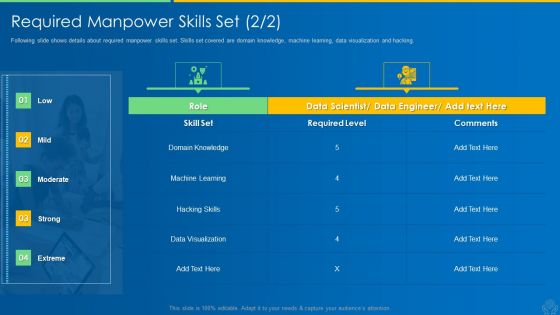
AI And ML Driving Monetary Value For Organization Required Manpower Skills Set Visualization Rules PDF
Following slide shows details about required manpower skills set. Skills set covered are domain knowledge, machine learning, data visualization and hacking. Deliver an awe inspiring pitch with this creative ai and ml driving monetary value for organization required manpower skills set visualization rules pdf bundle. Topics like domain knowledge, machine learning, machine learning, data visualization can be discussed with this completely editable template. It is available for immediate download depending on the needs and requirements of the user.
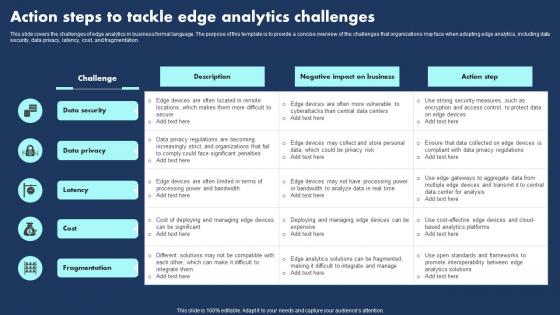
Action Steps To Tackle Edge Analytics Challenges Template Pdf
This slide covers the challenges of edge analytics in business formal language. The purpose of this template is to provide a concise overview of the challenges that organizations may face when adopting edge analytics, including data security, data privacy, latency, cost, and fragmentation.Showcasing this set of slides titled Action Steps To Tackle Edge Analytics Challenges Template Pdf The topics addressed in these templates are Processing Power Bandwidth, Integrate Manage, Promote Interoperability All the content presented in this PPT design is completely editable. Download it and make adjustments in color, background, font etc. as per your unique business setting. This slide covers the challenges of edge analytics in business formal language. The purpose of this template is to provide a concise overview of the challenges that organizations may face when adopting edge analytics, including data security, data privacy, latency, cost, and fragmentation.
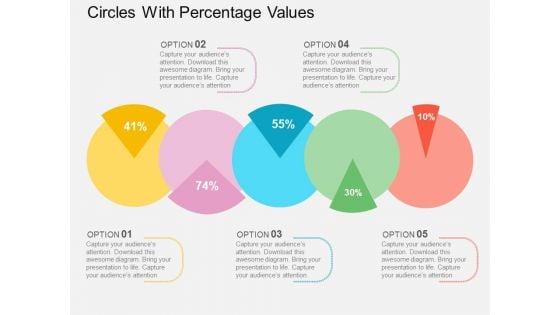
Circles With Percentage Values Powerpoint Templates
This PowerPoint template displays circles with percentage values. This business diagram is suitable for financial data analysis. Use this business diagram slide to highlight the key issues of your presentation.
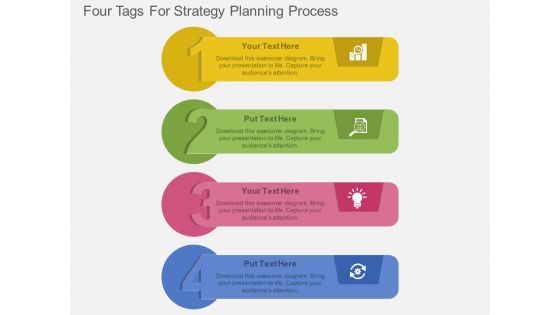
Four Tags For Strategy Planning Process Powerpoint Template
Steps for strategy planning can be explained with this diagram. This PowerPoint template contains diagram of four infographic tags. You can also use this design for data analysis in business presentations
Six Staged Infographics Square With Business Icons Powerpoint Templates
This business diagram displays circular puzzle infographic. This editable slide is suitable to present global communication. Use this diagram for business and finance related topics and display complete data analysis in your presentation.
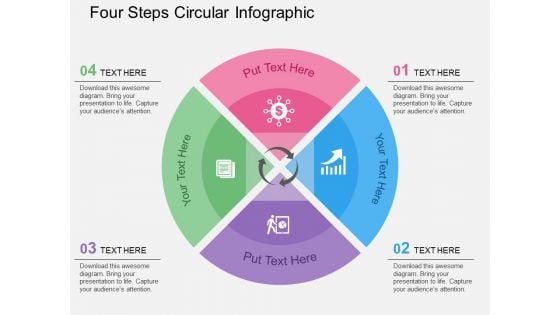
Four Steps Circular Infographic Powerpoint Templates
Our above slide contains diagram of three stage circular infographic. It helps to display global business analysis. Use this diagram to impart more clarity to data and to create more sound impact on viewers.
Four Circles Venn Diagram With Icons Powerpoint Slides
Four circles Venn diagram has been used to design this power point template. This PPT helps to portray the concept of business data analysis. Use this PPT for your business and marketing related presentations.
Two Circles Venn Diagram With Icons Powerpoint Slides
Venn diagram of two circles has been used to design this power point template. This PPT helps to portray the concept of business data analysis. Use this PPT for your business and marketing related presentations.
Curve Line Diagram With Icons Powerpoint Template
Our above slide contains diagram of curve line infographic. This infographic slide helps to exhibit business analysis. Use this diagram to impart more clarity to data and to create more sound impact on viewers.
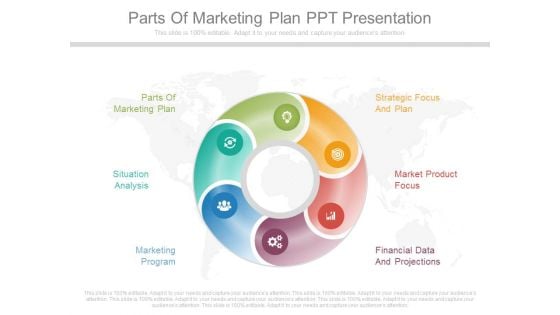
Parts Of Marketing Plan Ppt Presentation
This is a parts of marketing plan ppt presentation. This is a six stage process. The stages in this process are parts of marketing plan, strategic focus and plan, situation analysis, market product focus, marketing program, financial data and projections.
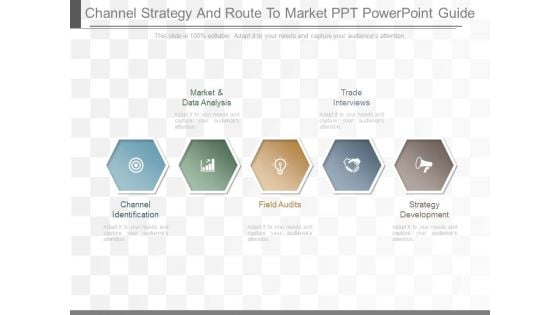
Channel Strategy And Route To Market Ppt Powerpoint Guide
This is a channel strategy and route to market ppt powerpoint guide. This is a five stage process. The stages in this process are market and data analysis, trade interviews, channel identification, field audits, strategy development.
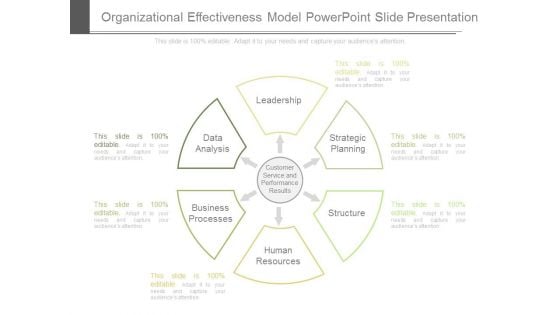
Organizational Effectiveness Model Powerpoint Slide Presentation
This is a organizational effectiveness model powerpoint slide presentation. This is a six stage process. The stages in this process are leadership, strategic planning, structure, human resources, business processes, data analysis, customer service and performance results.
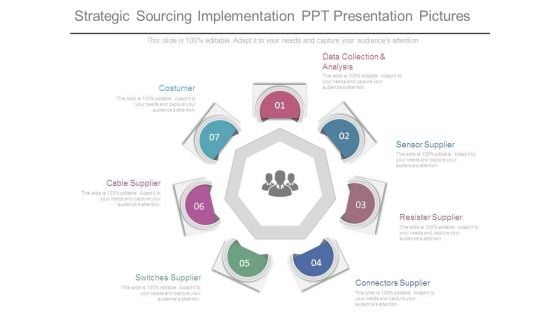
Strategic Sourcing Implementation Ppt Presentation Pictures
This is a strategic sourcing implementation ppt presentation pictures. This is a seven stage process. The stages in this process are data collection and analysis, sensor supplier, resister supplier, connectors supplier, switches supplier, cable supplier, costumer.
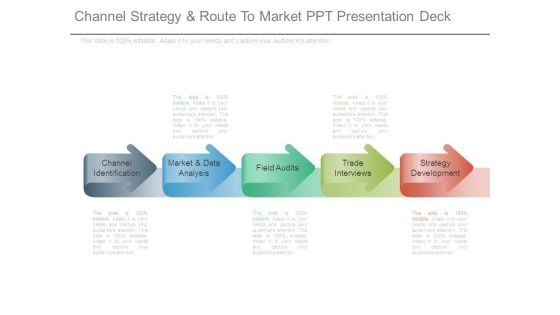
Channel Strategy And Route To Market Ppt Presentation Deck
This is a channel strategy and route to market ppt presentation deck. This is a five stage process. The stages in this process are channel identification, market and data analysis, field audits, trade interviews, strategy development.
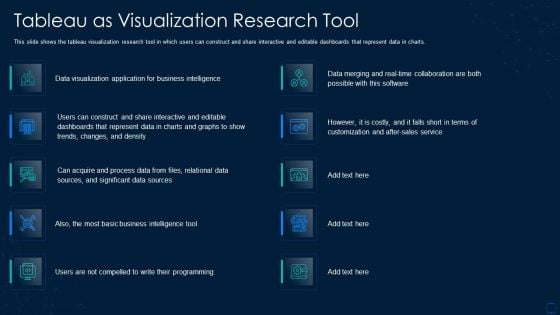
Graphical Representation Of Research IT Tableau As Visualization Research Tool Graphics PDF
This slide shows the tableau visualization research tool in which users can construct and share interactive and editable dashboards that represent data in charts. Deliver and pitch your topic in the best possible manner with this graphical representation of research it tableau as visualization research tool graphics pdf. Use them to share invaluable insights on process data, sources, sales, application and impress your audience. This template can be altered and modified as per your expectations. So, grab it now.

Business Men On Gears Towards Success Trophy Powerpoint Templates
Our above slide contains diagram of business men on gears towards success trophy. It helps to exhibit strategy process and competition. Use this diagram to impart more clarity to data and to create more sound impact on viewers.
Hands With Bulbs And Two Icons Powerpoint Template
Our above PPT slide contains graphics of hands holding idea bulbs. This business diagram helps to exhibit innovative ideas. Use this diagram to impart more clarity to data and to create more sound impact on viewers.
Five Arrows Around Globe With Icons Powerpoint Templates
This PowerPoint slide contains graphics of five arrows around globe. It helps to exhibit concepts of global finance and business economics. Use this diagram to impart more clarity to data and to create more sound impact on viewers.
Infographic Banners With Bulb Target And Globe Icons Powerpoint Templates
Our above slide contains diagram of three banners. It also contains icons of bulb, target and globe. Use this diagram to impart more clarity to data and to create more sound impact on viewers.
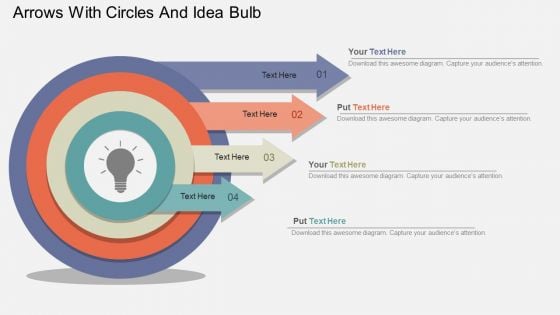
Arrows With Circles And Idea Bulb Powerpoint Template
Our above slide contains graphics of arrows with circles and idea bulb. It helps to display innovative ideas. Use this diagram to impart more clarity to data and to create more sound impact on viewers.
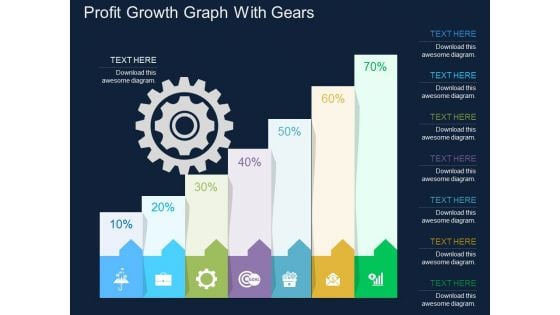
Profit Growth Graph With Gears Powerpoint Template
This business slide contains profit growth graph with gears. This PowerPoint template helps to display outline of business plan. Use this diagram to impart more clarity to data and to create more sound impact on viewers.


 Continue with Email

 Home
Home


